Upper mantle structure of eastern Asia from multimode surface waveform tomography Keith Priestley, 1 Eric Debayle, 2 D. McKenzie, 1 and S. Pilidou 1 Received 1 October 2005; revised 8 April 2006; accepted 12 May 2006; published 11 October 2006. [1] We present a new three-dimensional S v wave speed and azimuthal anisotropy model for the upper mantle of eastern Asia constrained by the analysis of more than 17,000 vertical component multimode Rayleigh wave seismograms. This data set allows us to build an upper mantle model for Asia with a horizontal resolution of a few hundred kilometers extending to 400 km depth. At 75–100 km depth, there is approximately ±9% wave speed perturbation from the ‘‘smoothed PREM’’ reference model used in our analysis, and the pattern of azimuthal anisotropy is complex. Both the amplitude of the S v wave speed heterogeneity and the complexity and amplitude of the azimuthal anisotropy decrease with depth. Above 200 km depth the upper mantle structure of the model correlates with surface geology and tectonics; below 200 km depth the structures primarily reflect the advection of material in the upper mantle. Since shear wave speed is principally controlled by temperature rather than by composition, Vs(z) can be used to calculate the temperature T(z), and hence map the lithospheric thickness. We use the relationship of Priestley and McKenzie to produce a contour map of the lithospheric thickness of eastern Asia from the surface wave tomography. This shows an extensive region of thick lithosphere beneath the Siberian Platform and the West Siberian Basin that extends to the European Platform, forming the stable Eurasian craton or core. The eastern portion of the Eurasian craton has controlled the geometry of continental deformation and the distribution of kimberlites in eastern Asia. Citation: Priestley, K., E. Debayle, D. McKenzie, and S. Pilidou (2006), Upper mantle structure of eastern Asia from multimode surface waveform tomography, J. Geophys. Res., 111, B10304, doi:10.1029/2005JB004082. 1. Introduction [2] Asia is a mosaic of ancient continental fragments separated by mountain ranges, fold belts, deep sedimentary basins and high plateaus (Figure 1). The region has been shaped by numerous tectonic events, the most recent being the Indo-Asian collision which is responsible for the uplift of the Himalaya Mountains and the Tibetan Plateau, and has induced widespread strain in SE Asia and possibly as far north as Mongolia. The events which formed Asia have left their imprint on the upper mantle structure, and unraveling the tectonic history and understanding the tectonic processes involved in building Asia require a better knowledge of the Asian upper mantle structure. Fundamental mode sur- face wave studies [e.g., Ekstro ¨m et al., 1997; Curtis et al., 1998; Ritzwoller and Levshin, 1998; Griot et al., 1998a; Villasen ˜or et al., 2001; Friederich, 2003] have furnished a great deal of structural information; however, the inclusion of higher-mode surface waves greatly improves the resolu- tion in the upper mantle because of the independent infor- mation they provide to the fundamental mode at shallower depths and because of the improved sampling they provide over the fundamental mode at deeper depths. [3] In this paper we focus on the structure of eastern Asia. We use a large, multimode surface wave data set to investigate the S v wave speed heterogeneity and azimuthal anisotropy of the upper mantle beneath this region on a finer scale than that seen in global tomographic models. We present a high-resolution, three-dimensional (3-D) tomo- graphic image of the Asian upper mantle that displays significant shear velocity features to depths of 200 km, much of which correlates with surface tectonics. Below 200 km depth, the correlation of upper mantle structure with surface tectonics is greatly reduced and is primarily restricted to the subduction zones of the western Pacific. [4] In our preliminary surface wave tomographic study [Priestley and Debayle, 2003], we compiled a data set of 13,000 vertical component Rayleigh wave seismograms from permanent seismographs operating in Eurasia and North America and use these data to determine a 3-D S v wave speed model for eastern Asia. The data set analyzed in the present study is different from that used by Priestley and Debayle [2003]. The new data set we have compiled consists of over 17,000 new measurements using seismo- grams from both permanent and temporary seismographs in Eurasia, Greenland, and the Canadian Arctic. However, the most important difference between the two studies is not in the increased number of paths but in the fact that the JOURNAL OF GEOPHYSICAL RESEARCH, VOL. 111, B10304, doi:10.1029/2005JB004082, 2006 Click Here for Full Articl e 1 Bullard Laboratories, University of Cambridge, Cambridge, UK. 2 Ecole et Observatoire des Sciences de la Terre, Universite ´ Louis Pasteur, Strasbourg, France. Copyright 2006 by the American Geophysical Union. 0148-0227/06/2005JB004082$09.00 B10304 1 of 20
Transcript
Upper mantle structure of eastern Asia from
multimode surface waveform tomography
Keith Priestley,1 Eric Debayle,2 D. McKenzie,1 and S. Pilidou1
Received 1 October 2005; revised 8 April 2006; accepted 12 May 2006; published 11 October 2006.
[1] We present a new three-dimensional Sv wave speed and azimuthal anisotropy modelfor the upper mantle of eastern Asia constrained by the analysis of more than 17,000vertical component multimode Rayleigh wave seismograms. This data set allows us tobuild an upper mantle model for Asia with a horizontal resolution of a few hundredkilometers extending to �400 km depth. At 75–100 km depth, there is approximately±9% wave speed perturbation from the ‘‘smoothed PREM’’ reference model used in ouranalysis, and the pattern of azimuthal anisotropy is complex. Both the amplitude of theSv wave speed heterogeneity and the complexity and amplitude of the azimuthalanisotropy decrease with depth. Above �200 km depth the upper mantle structure ofthe model correlates with surface geology and tectonics; below �200 km depth thestructures primarily reflect the advection of material in the upper mantle. Since shear wavespeed is principally controlled by temperature rather than by composition, Vs(z) can beused to calculate the temperature T(z), and hence map the lithospheric thickness. Weuse the relationship of Priestley and McKenzie to produce a contour map of thelithospheric thickness of eastern Asia from the surface wave tomography. This shows anextensive region of thick lithosphere beneath the Siberian Platform and the West SiberianBasin that extends to the European Platform, forming the stable Eurasian craton orcore. The eastern portion of the Eurasian craton has controlled the geometry of continentaldeformation and the distribution of kimberlites in eastern Asia.
Citation: Priestley, K., E. Debayle, D. McKenzie, and S. Pilidou (2006), Upper mantle structure of eastern Asia from multimode
surface waveform tomography, J. Geophys. Res., 111, B10304, doi:10.1029/2005JB004082.
1. Introduction
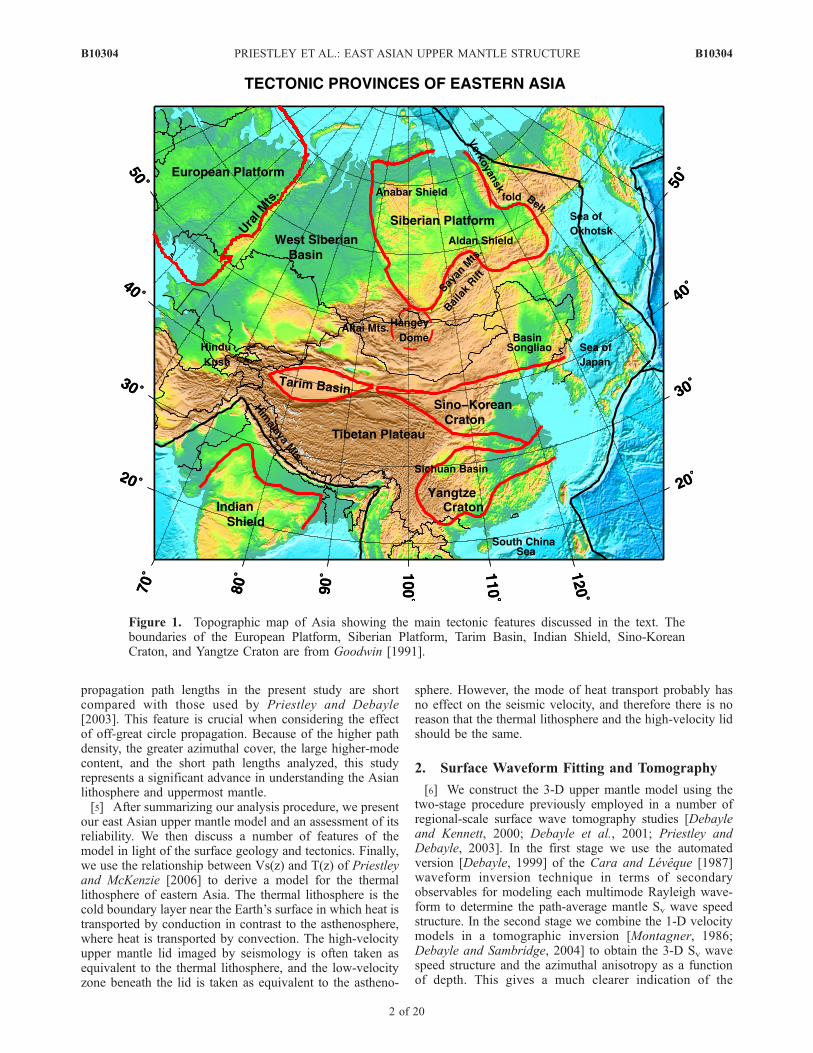
[2] Asia is a mosaic of ancient continental fragmentsseparated by mountain ranges, fold belts, deep sedimentarybasins and high plateaus (Figure 1). The region has beenshaped by numerous tectonic events, the most recent beingthe Indo-Asian collision which is responsible for the upliftof the Himalaya Mountains and the Tibetan Plateau, and hasinduced widespread strain in SE Asia and possibly as farnorth as Mongolia. The events which formed Asia have lefttheir imprint on the upper mantle structure, and unravelingthe tectonic history and understanding the tectonic processesinvolved in building Asia require a better knowledge ofthe Asian upper mantle structure. Fundamental mode sur-face wave studies [e.g., Ekstrom et al., 1997; Curtis et al.,1998; Ritzwoller and Levshin, 1998; Griot et al., 1998a;Villasenor et al., 2001; Friederich, 2003] have furnished agreat deal of structural information; however, the inclusionof higher-mode surface waves greatly improves the resolu-tion in the upper mantle because of the independent infor-mation they provide to the fundamental mode at shallower
depths and because of the improved sampling they provideover the fundamental mode at deeper depths.[3] In this paper we focus on the structure of eastern Asia.
We use a large, multimode surface wave data set toinvestigate the Sv wave speed heterogeneity and azimuthalanisotropy of the upper mantle beneath this region on a finerscale than that seen in global tomographic models. Wepresent a high-resolution, three-dimensional (3-D) tomo-graphic image of the Asian upper mantle that displayssignificant shear velocity features to depths of �200 km,much of which correlates with surface tectonics. Below�200 km depth, the correlation of upper mantle structurewith surface tectonics is greatly reduced and is primarilyrestricted to the subduction zones of the western Pacific.[4] In our preliminary surface wave tomographic study
[Priestley and Debayle, 2003], we compiled a data set of�13,000 vertical component Rayleigh wave seismogramsfrom permanent seismographs operating in Eurasia andNorth America and use these data to determine a 3-D Svwave speed model for eastern Asia. The data set analyzed inthe present study is different from that used by Priestley andDebayle [2003]. The new data set we have compiledconsists of over 17,000 new measurements using seismo-grams from both permanent and temporary seismographs inEurasia, Greenland, and the Canadian Arctic. However, themost important difference between the two studies is not inthe increased number of paths but in the fact that the
JOURNAL OF GEOPHYSICAL RESEARCH, VOL. 111, B10304, doi:10.1029/2005JB004082, 2006ClickHere
for
FullArticle
1Bullard Laboratories, University of Cambridge, Cambridge, UK.2Ecole et Observatoire des Sciences de la Terre, Universite Louis
Pasteur, Strasbourg, France.
Copyright 2006 by the American Geophysical Union.0148-0227/06/2005JB004082$09.00
propagation path lengths in the present study are shortcompared with those used by Priestley and Debayle[2003]. This feature is crucial when considering the effectof off-great circle propagation. Because of the higher pathdensity, the greater azimuthal cover, the large higher-modecontent, and the short path lengths analyzed, this studyrepresents a significant advance in understanding the Asianlithosphere and uppermost mantle.[5] After summarizing our analysis procedure, we present
our east Asian upper mantle model and an assessment of itsreliability. We then discuss a number of features of themodel in light of the surface geology and tectonics. Finally,we use the relationship between Vs(z) and T(z) of Priestleyand McKenzie [2006] to derive a model for the thermallithosphere of eastern Asia. The thermal lithosphere is thecold boundary layer near the Earth’s surface in which heat istransported by conduction in contrast to the asthenosphere,where heat is transported by convection. The high-velocityupper mantle lid imaged by seismology is often taken asequivalent to the thermal lithosphere, and the low-velocityzone beneath the lid is taken as equivalent to the astheno-
sphere. However, the mode of heat transport probably hasno effect on the seismic velocity, and therefore there is noreason that the thermal lithosphere and the high-velocity lidshould be the same.
2. Surface Waveform Fitting and Tomography
[6] We construct the 3-D upper mantle model using thetwo-stage procedure previously employed in a number ofregional-scale surface wave tomography studies [Debayleand Kennett, 2000; Debayle et al., 2001; Priestley andDebayle, 2003]. In the first stage we use the automatedversion [Debayle, 1999] of the Cara and Leveque [1987]waveform inversion technique in terms of secondaryobservables for modeling each multimode Rayleigh wave-form to determine the path-average mantle Sv wave speedstructure. In the second stage we combine the 1-D velocitymodels in a tomographic inversion [Montagner, 1986;Debayle and Sambridge, 2004] to obtain the 3-D Sv wavespeed structure and the azimuthal anisotropy as a functionof depth. This gives a much clearer indication of the
Figure 1. Topographic map of Asia showing the main tectonic features discussed in the text. Theboundaries of the European Platform, Siberian Platform, Tarim Basin, Indian Shield, Sino-KoreanCraton, and Yangtze Craton are from Goodwin [1991].
B10304 PRIESTLEY ET AL.: EAST ASIAN UPPER MANTLE STRUCTURE
2 of 20
B10304
properties at depth than do group and phase velocity mapswhich represent a weighted average of the earth structureover a frequency-dependent depth interval.[7] There are two assumptions inherent in our analysis:
that the observed surface waveform can be represented bymultimode surface waves, each mode propagating indepen-dently, and that they do so along the great circle path. Theseassumptions are valid for a smoothly varying mediumwithout strong lateral velocity gradients [Woodhouse,1974] and are widely accepted in surface wave tomography.Kennett [1995] examined the validity of the great circleapproximation for surface wave propagation at regionalcontinental scale and concluded that the assumption wasvalid at longer periods (>50 s) where surface waves crossmajor structural boundaries such as the continent-oceantransition. Ritzwoller et al. [2002] examined the effects ofoff-great circle propagation and found that for short pathlengths (�5000 km), the great circle assumption wasadequate but led to increasing bias in the inverted modelas path length increased.Marquering et al. [1996] examinedthe effect of mode coupling and found that when theanalysis was restricted to the fundamental mode andthe first few higher modes at relatively low frequencies,the artifacts resulting from neglecting mode couplingwere negligible. We therefore restrict our analysis to thefundamental and first four higher Rayleigh mode in the 50–160 s period band, and restrict our analysis to events with
relatively short paths compared to those used in globalstudies, while maintaining good azimuthal coverage.[8] Following Kennett [1995], we take a source region
specific velocity structure from the 3-D model 3SMAC[Nataf and Ricard, 1996] to improve the source excitationcomputation and we analyze the seismograms using amodified (smoothed) version of PREM [Dziewonski andAnderson, 1981] for the upper mantle velocity structure(Figure 2) both for the reference model used in extractingthe modal information from the seismogram and for thestarting inversion and a priori velocity models employed indetermining the path-average mantle structure. However,each path has a path-specific crustal model determined byaveraging the crustal part of 3SMAC along the path. At 40 speriod the maximum sensitivity of even the fundamentalmode is located below the crust, so that our data set isprimarily sensitive to upper mantle structure, and thereforewe assume the crustal structure is known and invert for theupper mantle structure.
3. Data
[9] The distribution of stations and events providingseismograms for this study (Figure 3a) results in excellentdensity and azimuthal distribution of paths. Most of theearthquakes we study are located on the plate boundariessurrounding Asia. We selected the events from the Harvardcentroid moment tensor catalog during the period 1977–2002; however, because of the great expansion of theGlobal Digital Seismograph Network in the mid-1990s,most of the data are from the period since 1994.[10] Since the waveforms are automatically fit for each
seismogram, the two most important aspects of the analysisare the noise and error detection and the data rejectionprocedures. For these, we follow the automated proceduredescribed by Debayle [1999], the first step of which is toevaluate the bandwidth over which the seismogram can beanalyzed.Debayle and Kennett [2003] compare tomographicresults for Australia obtained by inverting the waveforms inthe 40–160 s and 50–160 s period bands and found littledifference in the deeper part of the model (>130 km) foranalysis from either band, but observed that significantdisparities could occur at shallower depths. Some of thediscrepancy could be attributed to the increased resolutionresulting from including the shorter wavelength 40 s periodwaveforms, but part of the difference probably results fromeffects such as a departure from ray theory or an inaccuratecrustal structure, both of which are more significant atshorter periods. As the Asia region in our study encom-passes large variations in crustal thickness, we choose amore restrictive bandwidth criterion than Debayle [1999]and evaluate the signal in the 50, 70, 90, 120, and 160 speriod bands.[11] At each period, the signal-to-noise is deemed ade-
quate if the ratio between the maximum amplitude of theenvelope of the signal over the maximum amplitude of theenvelope of the noise is greater than 3. From the noiseevaluation, the automated waveform inversion chooses thebandwidth for the waveform analysis according to thefollowing sequence of priority: (1) 50, 90 and 160 s;(2) 50, 70 and 120 s; (3) 50 and 90 s; and (4) 50 and 70 s.Once the bandwidth has been chosen, the automated
Figure 2. Comparison of PREM [Dziewonski andAnderson, 1981] (dashed line) and the ‘‘smooth PREM’’(solid line) reference model used in this study.
B10304 PRIESTLEY ET AL.: EAST ASIAN UPPER MANTLE STRUCTURE
3 of 20
B10304
waveform analysis is performed according to the procedureand criterion described by Debayle [1999]. The inversion isconsidered successful if the final model provides a good fitto both the secondary observables and the observed seismo-gram and if the inversion has converged toward a unique andstable velocity model.[12] This extremely conservative procedure was used to
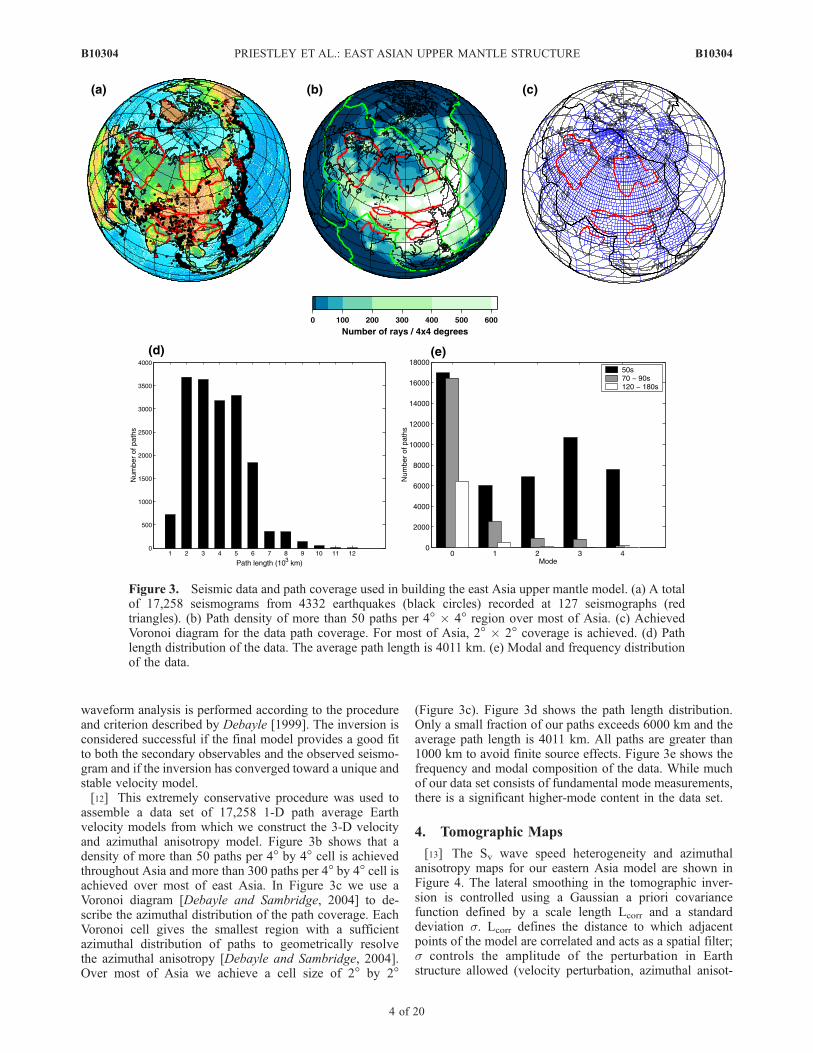
assemble a data set of 17,258 1-D path average Earthvelocity models from which we construct the 3-D velocityand azimuthal anisotropy model. Figure 3b shows that adensity of more than 50 paths per 4� by 4� cell is achievedthroughout Asia and more than 300 paths per 4� by 4� cell isachieved over most of east Asia. In Figure 3c we use aVoronoi diagram [Debayle and Sambridge, 2004] to de-scribe the azimuthal distribution of the path coverage. EachVoronoi cell gives the smallest region with a sufficientazimuthal distribution of paths to geometrically resolvethe azimuthal anisotropy [Debayle and Sambridge, 2004].Over most of Asia we achieve a cell size of 2� by 2�
(Figure 3c). Figure 3d shows the path length distribution.Only a small fraction of our paths exceeds 6000 km and theaverage path length is 4011 km. All paths are greater than1000 km to avoid finite source effects. Figure 3e shows thefrequency and modal composition of the data. While muchof our data set consists of fundamental mode measurements,there is a significant higher-mode content in the data set.
4. Tomographic Maps
[13] The Sv wave speed heterogeneity and azimuthalanisotropy maps for our eastern Asia model are shown inFigure 4. The lateral smoothing in the tomographic inver-sion is controlled using a Gaussian a priori covariancefunction defined by a scale length Lcorr and a standarddeviation �. Lcorr defines the distance to which adjacentpoints of the model are correlated and acts as a spatial filter;� controls the amplitude of the perturbation in Earthstructure allowed (velocity perturbation, azimuthal anisot-
Figure 3. Seismic data and path coverage used in building the east Asia upper mantle model. (a) A totalof 17,258 seismograms from 4332 earthquakes (black circles) recorded at 127 seismographs (redtriangles). (b) Path density of more than 50 paths per 4� � 4� region over most of Asia. (c) AchievedVoronoi diagram for the data path coverage. For most of Asia, 2� � 2� coverage is achieved. (d) Pathlength distribution of the data. The average path length is 4011 km. (e) Modal and frequency distributionof the data.
B10304 PRIESTLEY ET AL.: EAST ASIAN UPPER MANTLE STRUCTURE
4 of 20
B10304
ropy, or both) in the inversion. The model shown in Figure 4was obtained using Lcorr = 400 km for both velocityheterogeneity and azimuthal anisotropy, � = 0.05 km s�1
for the velocity perturbation and � = 0.003 km s�1 for theazimuthal anisotropy variation. This choice favors a smooth
model, considering our shortest wavelengths (about 200 kmat 50 s period) and dense path coverage.[14] The correlation of mantle features with known man-
tle structure (e.g., subducted slabs) and surface features andthe tests discussed below show that these values for Lcorr
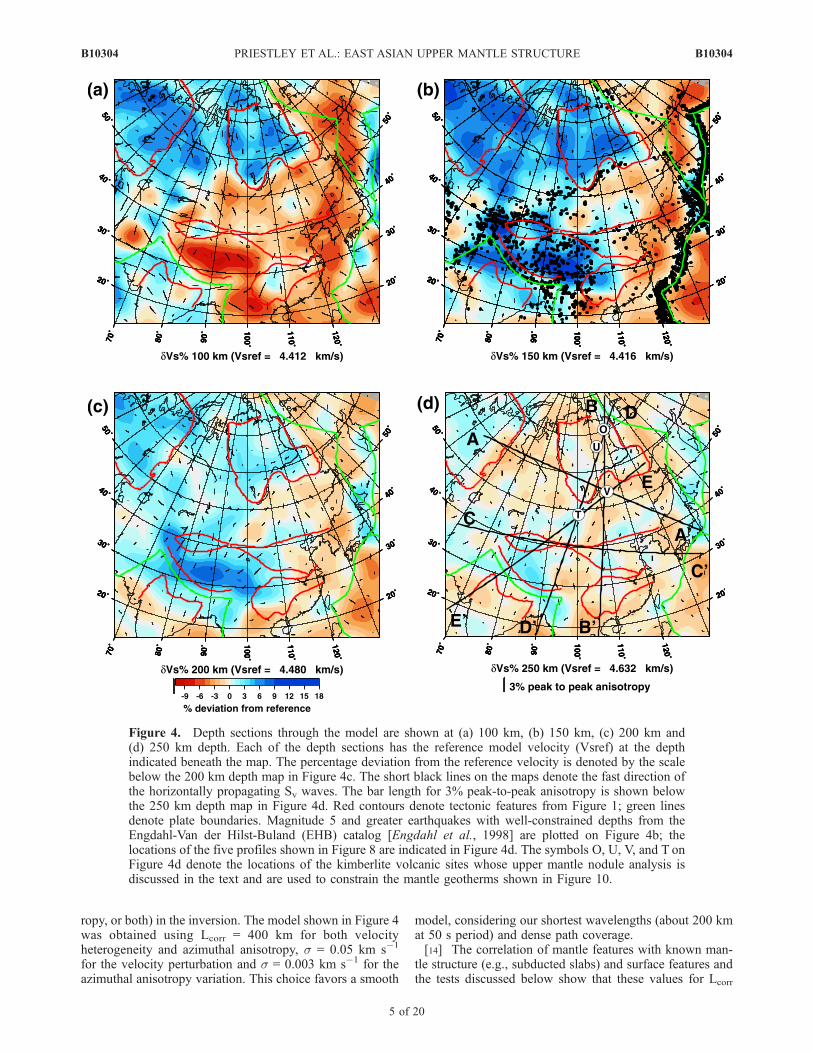
Figure 4. Depth sections through the model are shown at (a) 100 km, (b) 150 km, (c) 200 km and(d) 250 km depth. Each of the depth sections has the reference model velocity (Vsref) at the depthindicated beneath the map. The percentage deviation from the reference velocity is denoted by the scalebelow the 200 km depth map in Figure 4c. The short black lines on the maps denote the fast direction ofthe horizontally propagating Sv waves. The bar length for 3% peak-to-peak anisotropy is shown belowthe 250 km depth map in Figure 4d. Red contours denote tectonic features from Figure 1; green linesdenote plate boundaries. Magnitude 5 and greater earthquakes with well-constrained depths from theEngdahl-Van der Hilst-Buland (EHB) catalog [Engdahl et al., 1998] are plotted on Figure 4b; thelocations of the five profiles shown in Figure 8 are indicated in Figure 4d. The symbols O, U, V, and T onFigure 4d denote the locations of the kimberlite volcanic sites whose upper mantle nodule analysis isdiscussed in the text and are used to constrain the mantle geotherms shown in Figure 10.
B10304 PRIESTLEY ET AL.: EAST ASIAN UPPER MANTLE STRUCTURE
5 of 20
B10304
and � and the path density (Figure 3b) enable us to resolvestructures with horizontal wavelengths of a few hundredkilometers for the uppermost �400 km of the model.Although the lateral resolution that can be achieved insurface wave inversion with ray theory is debated [Yoshizawaand Kennett, 2002; Spetzler and Snieder, 2001], recentstudies suggest that the shortcomings of ray theory comparedto a more sophisticated finite frequency theory can becounterbalanced by the choice of the regularization of theinversion [Sieminski et al., 2004; Trampert and Spetzler,2006]. In the present study, we use a scheme for thetomographic inversion which facilitates the choice of aphysically based regularization, because the prior informa-tion imposed on the inverse problem through the parametersLcorr and � has a direct interpretation in terms of the physicalproperties of the model [Debayle and Sambridge, 2004].Sieminski et al. [2004] show that with such a physicallybased regularization of the inverse problem and using a densepath coverage, it is possible to offset the shortcomings of raytheory and to detect heterogeneities with length scalessmaller than the wavelength of the data set. This likelyexplains why structures with a small horizontal extensionsuch as slabs are detected in this study.[15] In this paper, we do not discuss the details of the
anisotropic directions at lithospheric depths. Within thelithosphere, the complex tectonic history of Asia may haveproduced anisotropic patterns with directions changing overhorizontal wavelength smaller than our lateral resolution, asituation where our tomographic approach does not allow usto reliably recover the anisotropic direction. We are morelikely to recover properly the anisotropy in the astheno-sphere, where large scale patterns may control its organiza-tion. However, the azimuthal anisotropy signal is weakbelow the lithosphere as discussed in section 7.[16] At 75–100 km depth there is approximately ±9%
wave speed perturbation from the reference model and thepattern of azimuthal anisotropy is complex. Both the am-plitude of the Sv wave speed heterogeneity and the com-plexity and amplitude of the azimuthal anisotropy decreaseat deeper depths. Above �200 km depth the upper mantlestructure of the model is correlated with surface geologyand tectonics; below �200 km depth the structures primar-ily reflect the advection of material in the upper mantle. Themain features of our model are as follows:[17] 1. Pronounced low wave speeds exist beneath the
back-arc basins of the western Pacific subduction zones offthe coast of eastern Asia and high wave speeds exist alongnarrow, elongated zones corresponding to the location of thesubducted oceanic lithosphere beneath Kamchatka, theKuriles, Japan, Taiwan, and the Philippines.[18] 2. Low wave speeds exist at shallow depths (75–
100 km) beneath Tibet but at deeper depths (150–200 km)the mantle beneath the whole of Tibet is fast with respect tothe reference model. The high wave speed mantle at thesedepths beneath Tibet merges to the south with high wavespeeds beneath India and to the east with high wave speedsbeneath southeastern China. From 250 km to the bottom ofthe model, high wave speeds persist beneath southern Tibet.[19] 3. High wave speed upper mantle exists beneath the
cratons to 200–225 km depth, but at greater depth, the wavespeeds beneath the cratons are close to that of the referencemodel.
[20] We elaborate on the model features below but firstdiscuss the reliability and resolution of the upper mantlemodel.
5. Reliability of the 3-D Model
[21] There are a number of factors in both stages of theanalysis which influence the reliability of the model. Inaddition to the great circle propagation approximation andthe neglect of mode coupling discussed above, the modelreliability is affected by the choice of reference model,path coverage, and poor knowledge of the uninvertedparameters.[22] Cara and Leveque [1987] show that for their wave-
form inversion technique used in stage one of our analysis,the final velocity structure is weakly dependent on thereference model. However, errors in uninverted parameterssuch as earthquake source parameters and crustal structurewill cause errors in the 1-D path average velocity modelsdetermined in the first stage of the analysis. Ritzwoller andLevshin [1998] and Maggi and Priestley [2005] examinedthe effect of a systematic shift in event locations onregional-scale surface wave tomography and found that ifthe path density and azimuthal coverage are good, as theyare in this study, the effects of the mislocation wererestricted to the source region and were of small magnitude.Errors in the assumed crustal structure will influence theshallow mantle structure. Debayle and Kennett [2000] showthat reasonable errors in crustal thickness have little effecton the mantle structure below 100–125 km depth. Inaddition, we have tested a subset of our data using theCRUST2 [http://mahi.ucsd.edu/Gabi/rem.dir/crust/crust2.html] model in place of the 3SMAC crustal model andfound little difference in the upper mantle structure. Differ-ences in mantle structure resulting from the choice of crustalmodels are discussed in greater detail by Pilidou et al.[2005].[23] The resolution achieved and the presence of artifacts
in the 3-D model determined in the second stage of theanalysis are primarily the result of the path coverage, andthe frequency and modal makeup of the surface waves.The continuous regionalization approach we use to deter-mine the tomographic model provides an a posteriori errorestimate for the extracted model, and this is a useful guideto the resolution attainable from the data. It is well knownthat in regions where resolution is weak, the a posteriorierror nearly equals the a priori error [Tarantola and Valette,1982]. As a result of the dense path coverage and richhigher-mode content of the data set, the a posteriorierror (Figure 5) is low (<0.035 km s�1) over most of Asiato 400 km depth compared to the a priori error (set to0.05 km s�1). The a posteriori error maps (Figure 5)display a pattern similar to the path distribution (Figure 3b)and optimum Voronoi (Figure 3c) diagram.[24] We also use a traditional checkerboard test to eval-
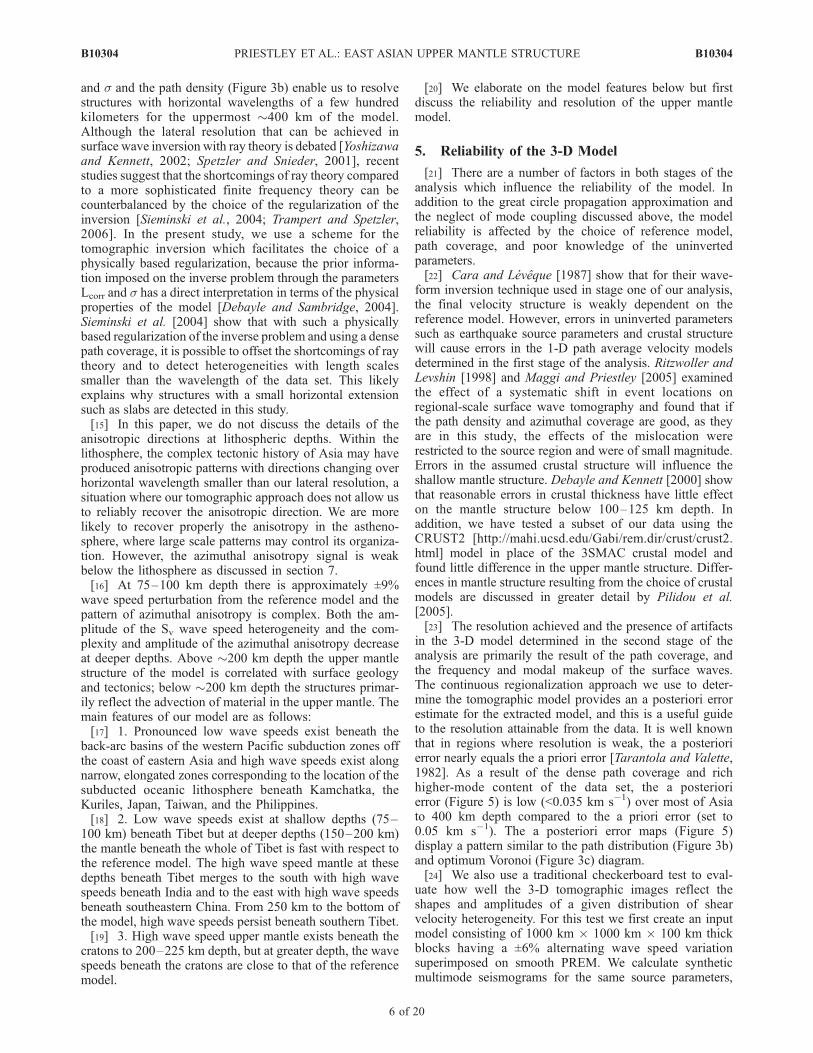
uate how well the 3-D tomographic images reflect theshapes and amplitudes of a given distribution of shearvelocity heterogeneity. For this test we first create an inputmodel consisting of 1000 km � 1000 km � 100 km thickblocks having a ±6% alternating wave speed variationsuperimposed on smooth PREM. We calculate syntheticmultimode seismograms for the same source parameters,
B10304 PRIESTLEY ET AL.: EAST ASIAN UPPER MANTLE STRUCTURE
6 of 20
B10304
frequency content, modal distribution, and event-receivercombinations as in the observed data. The synthetic seismo-grams are then inverted in exactly the same way as the realdata using the automated procedure outlined in section 2.By starting with the initial step of the 1-D waveforminversions, our tests not only provide insights on the spatialresolution of the model attained from the path coverage, butthey also yield information on the depth resolution attainedfrom the frequency and modal content of the seismogramsanalyzed. Figure 6 shows slices through the recoveredcheckerboard model at depths between 75 and 350 km.The geometry of the input model (Figure 7) is retrieved overthe whole depth range except at the edges of the maps, andthere is little indication of horizontal smearing. At shallowdepths the amplitude of the input model is faithfully
recovered. At 250 km depth the amplitude recovery is�50% of the input amplitude, and by 350 km depth theamplitude recovery has dropped to �25% of the inputamplitude.[25] The final test evaluates the azimuthal anisotropy
resolution of the models (Figure 7). To the checkerboardmodel described above we add a pattern of azimuthalanisotropy with a peak-to-peak amplitude of 5% with apattern for the fast anisotropy that displays an abrupt changein direction (Figure 7a). The magnitude and direction of theanisotropy pattern are in general well recovered (Figure 7b)in areas of good azimuthal coverage (Figure 3c). In theregion of abrupt change in anisotropic direction, the hori-zontal smoothing introduced in the inversion and by thelong-period surface waves can, however, produce a local
Figure 5. A posteriori error for the model at four depths.
B10304 PRIESTLEY ET AL.: EAST ASIAN UPPER MANTLE STRUCTURE
7 of 20
B10304
anisotropic pattern that is wrong in both amplitude anddirection. Thus the anisotropic pattern obtained with surfacewaves is likely to be meaningful only where the anisotropyvaries slowly with respect to the horizontal resolution of thesurface waves. It may be that such regions are not commonwithin the continental lithosphere where anisotropy gener-ally reflects the complex tectonic history. In regions whereabrupt changes in anisotropic direction are present or wherevariations in anisotropic direction occur over distancessmaller than the horizontal resolution, the horizontalsmoothing of the surface waves will not allow recovery ofthe azimuthal anisotropy directions. For this reason, we willdiscuss only the general trend of the anisotropy and not the
fine details. In more extensive azimuthal anisotropy tests wefound a coupling between azimuthal anisotropy and lateralheterogeneity with as much as 1–2% lateral heterogeneityarising from the azimuthal anisotropy [Pilidou et al., 2005].We have conducted similar tests with our Asia data set andfind similar levels of coupling.
6. Discussion
[26] Asia is made up of continental and oceanic fragmentsaccreted to the southern margin of stable Eurasia consistingof the Siberian Platform and the West Siberian Basin[Sengor and Natal’in, 1996; Yin and Nie, 1996]. The main
Figure 6. Checkerboard resolution test for the model at the four depths. Blocks of the input syntheticmodel are 1000 � 1000 km in lateral dimension and 100 km thick. The input model at 100 km depth isshown in Figure 7.
B10304 PRIESTLEY ET AL.: EAST ASIAN UPPER MANTLE STRUCTURE
8 of 20
B10304
accreted fragments include the north China block or Sino-Korean craton, the south China block or Yangtze craton, andIndia. These and other smaller blocks are separated bysutures whose geometries have been significantly modifiedat various stages by later collisional and translational events.At present, compressional tectonics dominates most ofcentral Asia while extensional tectonics dominates most ofeastern China. There is a corresponding difference in ourupper mantle model where areas primarily under compres-sion are underlain to �200 km depth with high wave speedsrelative to the reference model, and areas primarily undertension are underlain by low wave speed upper mantle to�200 km depth relative to the reference model (Figure 4).Deeper structures seen in the model are associated with theadvection of material in the upper mantle, particularly thesubduction zones in the western Pacific.
6.1. Stable Eurasia
[27] The Siberian Platform (Figure 1) forms the eastern-most part of stable Eurasia. The Platform is mostly coveredby 2–14 km of Proterozoic-to-Cretaceous sediments [Griffinet al., 1999] and the 250Ma flood basalts of the Siberian traps[Zolutkhin and Al’muckhamedor, 1988], but its Archeanbasement outcrops in the Aldan Shield in the southeast andAnabar Shield in the north. The Siberian Platform is borderedto the south and east by Phanerozoic fold-and-thrust beltsformed during the assembly of Pangea [Mitrofanov andTaskin, 1994; Griffin et al., 1999]. Crustal evolution of theplatform may have begun as early as 3.5 Ga, but the oldestrocks found thus far are �3.3 Ga [Jahn et al., 1998].[28] The Siberian Platform is well delineated in our
upper mantle Sv model. Between 100 and 200 km depth(Figures 4a–4c) the boundary of the high wave speed rootbeneath the eastern part of the Siberian Platform closely
matches the geologically mapped boundary corresponding tothewestern boundary of the Verkhoyansk fold-and-thrust beltat the surface. However, in the west, the high velocity uppermantle lid extends across theWest Siberian Basin as far as theUral Mountains where it merges with the high velocity rootbeneath the East European Platform (Figures 4a–4c and 8a).At 250 km depth the velocity beneath both the SiberianPlatform and the West Siberian Basin is close to that of thereference model (Figures 4d, 8a, 8b, and 8d). The checker-board tests (Figures 9a, 9b, and 9d) show that the depthresolution in this part of the model is excellent.[29] The Baikal rift (discussed in more detail below) at
the southern boundary of the Siberian Platform occursabove a sharp transition in the Sv model between the highvelocities beneath the platform and the low velocitiesbeneath the central Asian fold belt (Figures 4a–4c, 8a,and 8b). However, to the northeast of Lake Baikal, the high-velocity root of the Siberian Platform extends somewhatfurther south from the location of the mapped boundary atthe surface (Figures 4a–4c and 8b). The seismicity north-east of Lake Baikal follows more closely the boundary ofthe Siberian Platform seen in the tomographic model than itdoes the mapped boundary of the platform at the surface(Figure 4b). The right stepping en echelon basins of theBaikal rift northeast of the lake also follow this trend[Logatchev, 1993] suggesting that the strong, cold mantleroot of the Siberian Platform is controlling the location ofthe rift. The mismatch between the surface manifestation ofthe Siberian Platform and the southern boundary of its uppermantle root probably results from the thrusting from thesouth of the Sayan Mountains over the platform basement[Mitrofanov and Taskin, 1994].[30] The 200–225 km values we find for the thickness of
the high velocity mantle lid beneath the Siberian Platform
Figure 7. (a) Input synthetic model at 100 km depth for the azimuthal anisotropy test and (b) outputmodel from the inversion at 100 km depth.
B10304 PRIESTLEY ET AL.: EAST ASIAN UPPER MANTLE STRUCTURE
9 of 20
B10304
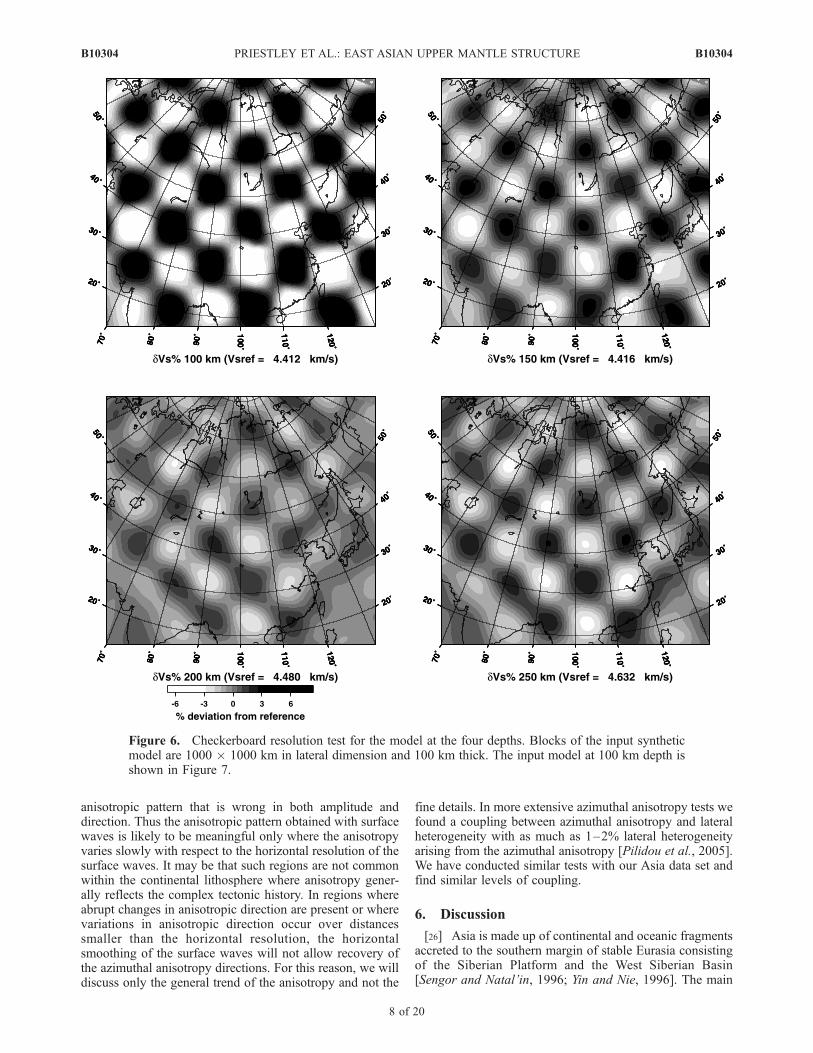
Figure 8. Five profiles showing the depth variation of the Sv wave speed heterogeneity. Each profile is7000 km long and the locations of the profiles are denoted on Figure 4d. The Sv wave speedheterogeneity is only plotted below 75 km depth. Black dots are magnitude 5 and greater earthquakeswith well-constrained depths from the EHB catalog [Engdahl et al., 1998], projected onto the profile. Theprofile topography is plotted above. Note the difference in depth and elevation scales. The short red lineson the cross sections denote the lithospheric thickness from the four sites of Figure 10. The errordistribution and checkerboard test results for the profiles are shown in Figure 9.
B10304 PRIESTLEY ET AL.: EAST ASIAN UPPER MANTLE STRUCTURE
10 of 20
B10304
(Figures 4, 8a, 8b, and 8d) differ significantly from thevalues of the thermal lithospheric thickness of 350 km ormore determined by Artemieva and Mooney [2001]. How-ever, their thermal lithospheric model of the SiberianPlatform is based on rather sparse heat flow data andassumptions about the radioactive heat production of thecrust.[31] The thickness of the thermal lithosphere can be
determined directly from the upper mantle nodules broughtto the surface in some volcanic eruptions. There are twosites on the Siberian Platform where kimberlite eruptionshave brought up mantle nodules: Udachnaya and Obnaz-hennaya (Figure 4d), and the mineralogy of such nodulescan be used to estimate the pressure and temperature atwhich they last equilibrated. We use the Brey and Kohler[1990] expression for the solubility of aluminum in enstatitein the presence of garnet to estimate the pressure (depth)
and the Brey and Kohler [1990] expression for the inter-solubility of enstatite and diopside to obtain the tempera-ture. The steady state temperature within the lithospherewas calculated using the expressions in McKenzie et al.[2005]. For this calculation the 40 km thick crust [Suvorovet al., 2002; Pavlenkova et al., 2002] is divided intotwo layers, both with the same thermal conductivity,2.5 W K�1 m�1. The heat generation rate for the uppercrust is 1.12 � W m�3 and the lower crust is 0.4 � W m�3,values suggested by Jaupart and Mareschal [1999] forgranulite. The thicknesses of the upper and lower crustwere varied to fit the pressure and temperature estimatesfrom the nodules while keeping the total crustal thicknessequal to 40 km. The heat generation in the mantle portion ofthe mechanical boundary layer (MBL) is taken to be zeroand the thermal conductivity is taken to be a function oftemperature [Schatz and Simmons, 1972; Hofmeister, 1999;
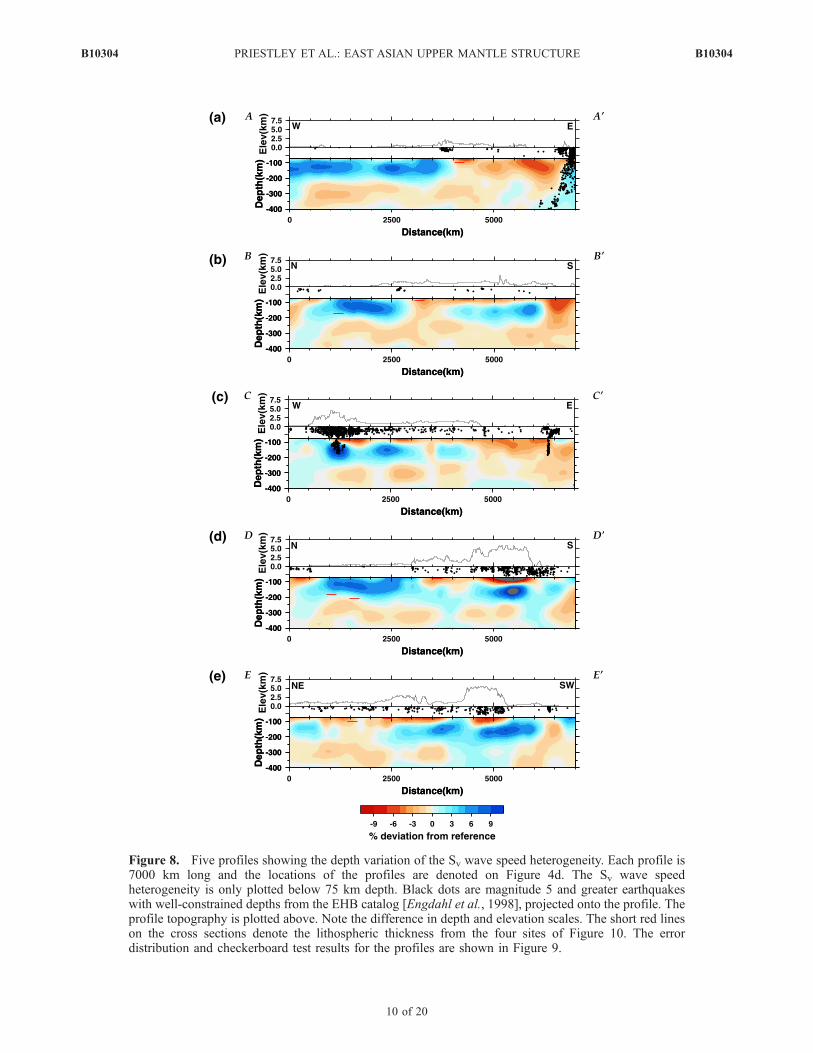
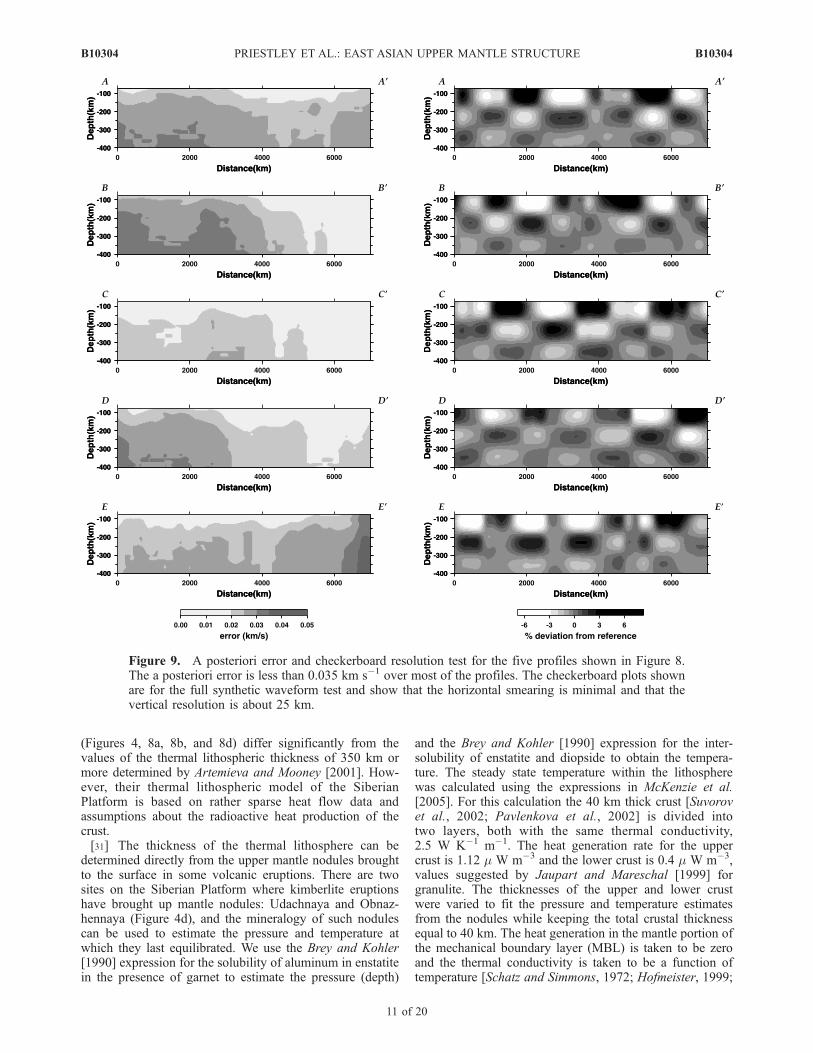
Figure 9. A posteriori error and checkerboard resolution test for the five profiles shown in Figure 8.The a posteriori error is less than 0.035 km s�1 over most of the profiles. The checkerboard plots shownare for the full synthetic waveform test and show that the horizontal smearing is minimal and that thevertical resolution is about 25 km.
B10304 PRIESTLEY ET AL.: EAST ASIAN UPPER MANTLE STRUCTURE
11 of 20
B10304
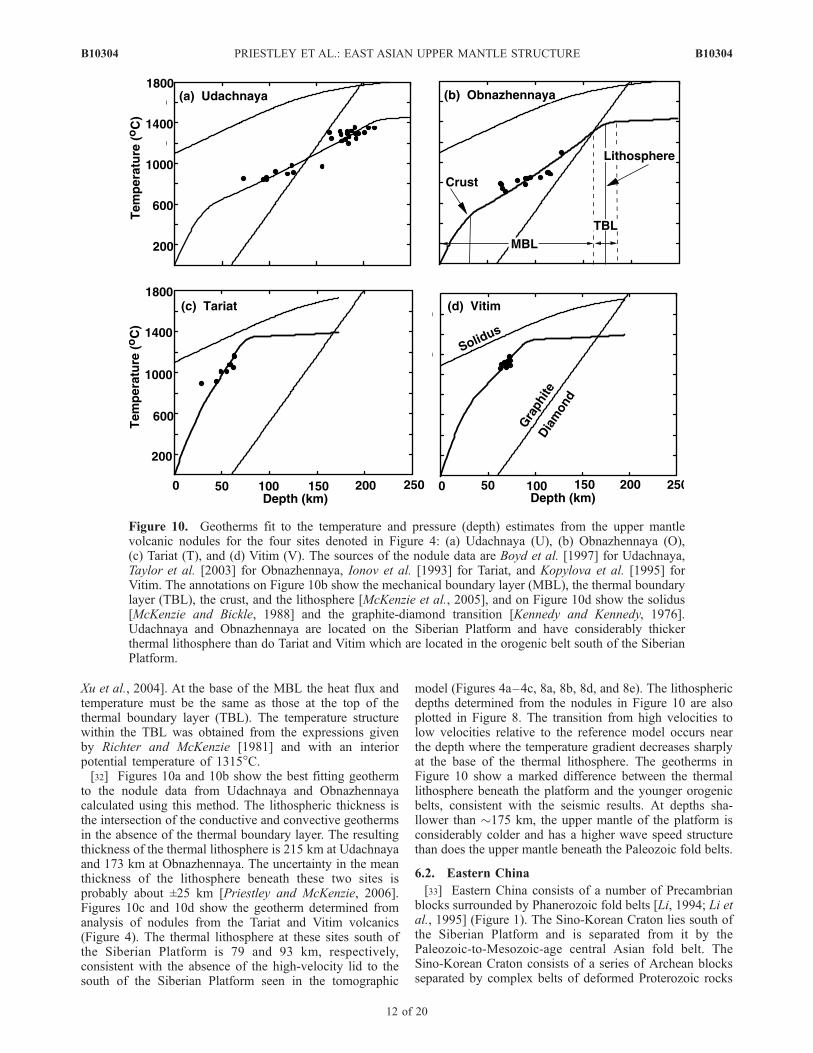
Xu et al., 2004]. At the base of the MBL the heat flux andtemperature must be the same as those at the top of thethermal boundary layer (TBL). The temperature structurewithin the TBL was obtained from the expressions givenby Richter and McKenzie [1981] and with an interiorpotential temperature of 1315�C.[32] Figures 10a and 10b show the best fitting geotherm
to the nodule data from Udachnaya and Obnazhennayacalculated using this method. The lithospheric thickness isthe intersection of the conductive and convective geothermsin the absence of the thermal boundary layer. The resultingthickness of the thermal lithosphere is 215 km at Udachnayaand 173 km at Obnazhennaya. The uncertainty in the meanthickness of the lithosphere beneath these two sites isprobably about ±25 km [Priestley and McKenzie, 2006].Figures 10c and 10d show the geotherm determined fromanalysis of nodules from the Tariat and Vitim volcanics(Figure 4). The thermal lithosphere at these sites south ofthe Siberian Platform is 79 and 93 km, respectively,consistent with the absence of the high-velocity lid to thesouth of the Siberian Platform seen in the tomographic
model (Figures 4a–4c, 8a, 8b, 8d, and 8e). The lithosphericdepths determined from the nodules in Figure 10 are alsoplotted in Figure 8. The transition from high velocities tolow velocities relative to the reference model occurs nearthe depth where the temperature gradient decreases sharplyat the base of the thermal lithosphere. The geotherms inFigure 10 show a marked difference between the thermallithosphere beneath the platform and the younger orogenicbelts, consistent with the seismic results. At depths sha-llower than �175 km, the upper mantle of the platform isconsiderably colder and has a higher wave speed structurethan does the upper mantle beneath the Paleozoic fold belts.
6.2. Eastern China
[33] Eastern China consists of a number of Precambrianblocks surrounded by Phanerozoic fold belts [Li, 1994; Li etal., 1995] (Figure 1). The Sino-Korean Craton lies south ofthe Siberian Platform and is separated from it by thePaleozoic-to-Mesozoic-age central Asian fold belt. TheSino-Korean Craton consists of a series of Archean blocksseparated by complex belts of deformed Proterozoic rocks
Figure 10. Geotherms fit to the temperature and pressure (depth) estimates from the upper mantlevolcanic nodules for the four sites denoted in Figure 4: (a) Udachnaya (U), (b) Obnazhennaya (O),(c) Tariat (T), and (d) Vitim (V). The sources of the nodule data are Boyd et al. [1997] for Udachnaya,Taylor et al. [2003] for Obnazhennaya, Ionov et al. [1993] for Tariat, and Kopylova et al. [1995] forVitim. The annotations on Figure 10b show the mechanical boundary layer (MBL), the thermal boundarylayer (TBL), the crust, and the lithosphere [McKenzie et al., 2005], and on Figure 10d show the solidus[McKenzie and Bickle, 1988] and the graphite-diamond transition [Kennedy and Kennedy, 1976].Udachnaya and Obnazhennaya are located on the Siberian Platform and have considerably thickerthermal lithosphere than do Tariat and Vitim which are located in the orogenic belt south of the SiberianPlatform.
B10304 PRIESTLEY ET AL.: EAST ASIAN UPPER MANTLE STRUCTURE
12 of 20
B10304
[Xu and Ma, 1992]. Radiometric dating shows the basementrocks are 2.5–3.8 Ga [Jahn et al., 1987; Song et al., 1996],but U-Pb ages of detrital zircons indicate the existence ofcrustal rocks older than 3.8 Ga [Liu et al., 1992]. Thebasement rocks of the Sino-Korean Craton are overlain by athick sequence of Proterozoic and Paleozoic sediments,suggesting that the craton was stabilized by at least themiddle Proterozoic. Paleomagnetic studies indicate that theamalgamation of the Siberian Platform and the Sino-KoreanCraton started in the Permian (�275 Ma) and was completedby the late Jurassic (�200 Ma) [Zhao et al., 1990].[34] The Sino-Korean Craton has a high-velocity litho-
spheric root extending to �225 km depth beneath thewestern part of the craton (west of �110�E), but the high-velocity root is missing beneath the Archean crust of theeastern part of the craton. (Figures 4 and 8c). This differencebetween the eastern and western parts of the Sino-KoreanCraton has been previously noted [Menzies et al., 1993;Lebedev and Nolet, 2003; Priestley and Debayle, 2003].Kimberlitic magmas erupted on the eastern Sino-KoreanCraton during the Paleozoic, entraining garnet-diamondfacies mantle nodules [Menzies et al., 1993; Menzies andXu, 1998; Griffin et al., 1998], implying that the craton wasunderlain by a cool, depleted root extending into thediamond stability field (deeper than about 140 km depth).Since the late Mesozoic the eastern portion of the craton hasbeen tectonically active as indicated by the formation oflarge sedimentary basins and widespread volcanism [Ma etal., 1984; Liu, 1987; Tain et al., 1992]. During the Ceno-zoic, basaltic magmas entraining spinel-facies nodules wereerupted on the same part of the craton as the earlier diamond-bearing kimberlites [Menzies and Xu, 1998; Griffin et al.,1998; Xu et al., 1998], suggesting that the cool, depletedmantle root beneath the eastern part of the craton had beenthinned or replaced by warm, fertile mantle by this time.Presently, the eastern portion of the Sino-Korean Craton hashigh heat flow [Ma et al., 1984] and extensive seismicity[Wesnousky et al., 1984], indicating a fundamentally differ-ent nature of the mantle lithosphere beneath the easternand western parts of the Sino-Korean Craton that is consis-tent with the difference in the mantle structure we see in ourSv wave speed model.[35] To the north of the Sino-Korean Craton lies another
high-velocity feature in our Sv model (Figures 4b–4d)which approximately coincides with the Songliao Basin(Figure 1). Zhang et al. [1998] analyzed potassic volcanicrocks and mantle xenoliths from the Songliao Basin andconcluded that it is an Archean–early Proterozoic mantleterrane; the high-velocity feature in our model to the northof the Sino-Korean Craton may be related to this proposedArchean–early Proterozoic mantle terrane.[36] The Sichuan Basin forms the Archean core of the
Yangtze Craton (Figure 1). An isolated high-velocity featureexists at 100 km depth beneath the Sichuan Basin (Figure 4a),but by 150 km depth the high-velocity region expandsbeyond the basin to underlie much of the western part ofthe Yangtze Craton (Figure 4b) and links up to the west withthe high velocities at this depth beneath eastern Tibet. Theresolution in our model does not permit us to say whether ornot these high-velocity features are continuous. The high-velocity root of the Yangtze Craton is also resolved in thesurface wave model of Lebedev and Nolet [2003], but in their
model, this feature extends somewhat deeper than in ours(Figure 8b).[37] There is a major negative velocity anomaly beneath
SE China and northern Thailand (Figure 4 and 8b) with lowwave speeds extending to �250 km depth. The checker-board test (Figure 9b) suggests the resolution in this part ofthe model is good even though it is near the edge of themodel.
6.3. Hangay Dome–Baikal Rift Region
[38] A prominent low-velocity anomaly extends from theAltai Mountains to the Baikal rift region south of theSiberian Platform (Figure 4). Low velocities in the vicinityof Lake Baikal have been reported in previous surface wavetomography models of Asia. Curtis et al. [1998] note lowvelocities in the Baikal region in their 80 s phase velocitymap with the zone of lowest velocity southeast of LakeBaikal; Villasenor et al. [2001] observe a large, low-velocityregion beneath Mongolia with its largest anomaly occurringsouthwest of Lake Baikal; and Friederich [2003] found awell-confined, nearly cylindrical low-velocity anomalybeneath the southern tip of the Baikal rift reaching downinto the transition zone. At 100 km depth in this part of ourmodel (Figure 4a), there is low-velocity mantle extending asfar west as the Altai Mountains, similar to that seen in theshear wave model of Villasenor et al. [2001], but by 150 kmdepth the mantle beneath the Altai Mountains is relativelyfast and the low mantle velocities extend only to as far westas �100�E.[39] The western portion of this low-velocity anomaly
occurs beneath the region of the Hangay Dome which formsthe large part of the Mongolian Plateau, a 800-km-long N-Stopographic bulge characterized by elevations typicallyexceeding the regional trend of �1.5 km [Windley andAllen, 1993] (Figure 1). It is an area of recent uplift, diffusedextension, high seismicity, high heat flow, and recentCenozoic volcanism [Kiselev, 1987; Cunningham, 1998;Bayasgalan et al., 2005]. Regional heat flow data showthe highest values over the Hangay Dome decreasing radiallyaway from the dome [Cunningham, 1998]. The timing ofCenozoic uplift is not well constrained [Cunningham, 2001],but it appears that most of the present-day topography datesfrom the Oligocene to early Miocene [Cunningham, 2001;Cunningham et al., 1996; Baljinnyam et al., 1993]. Thesefeatures have been cited as evidence for a juvenile mantleplume or asthenospheric diapir that also extends northeast-ward beneath Lake Baikal [Zorin et al., 1989; Kiselev andPopov, 1992; Windley and Allen, 1993] although othersargue against the existence of a plume below the HangayDome [Khutorskoy and Yarmoluk, 1989].[40] Villasenor et al. [2001] point out that the Hangay
Dome coincides with the significant upper mantle low-velocity anomaly WSW of Lake Baikal in their model.However, our model shows that this is not a deep-seated,low-velocity anomaly but west of 100�E it is a shallowfeature extending no deeper than �125 km. The Hangayvolcanic field (Figure 4) lies above the transition from highto low velocity at deeper depths. Studies of xenoliths fromrecent (1 Ma) Tariat volcanics [Ionov et al., 1998] indicatethat the source of this magmatism is deeper than 70 km.Some mantle xenoliths of the Mongolia lavas have Prote-rozoic model ages and show evidence of long term (�Ga)
B10304 PRIESTLEY ET AL.: EAST ASIAN UPPER MANTLE STRUCTURE
13 of 20
B10304
depletion in incompatible trace elements, suggesting deri-vation from old, cold, basalt-depleted lithosphere compati-ble with the higher velocities seen at deeper depths beneaththis region. However, the geotherm for Tariat (Figure 10c)shows very thin lithosphere associated with the Cenozoicvolcanism.[41] Farther east the northern edge of the low-velocity
anomaly coincides with the Baikal Rift. The extensionaldeformation of the rift is thought to result from either far-field effects of the Indo-Eurasian collision [Molnar andTapponnier, 1975; Tapponnier and Molnar, 1979], from amantle upwelling beneath rift axis [Logatchev and Zorin,1987, 1992; Kiselev and Popov, 1992], or a combination ofboth [Petit et al., 1998]. However, Ionov et al. [1995]showed that the nodules from volcanics near the rift axisare fertile lherzolite, but equilibration temperatures are nohigher than those from volcanics at other locations fartherfrom the rift and all are well below temperatures expectedfor mantle diapirs. Lowman and Jarvis [1996] show thatdue to blanketing effects, mantle upwelling can persist for along time after continental suturing and such upwelling cancause small-scale tensional stresses; Petit et al. [2002]suggest this as a possible explanation for the low velocitiesseen in the upper mantle and for the extension observed atthe surface. However, the suturing of the Siberian Platformand the Sino-Korean Craton was complete by �200 Ma[Zhao et al., 1990]. Whatever the deep-seated cause of thevolcanics and rifting, the high-velocity lid we image westand north of the low velocity anomaly and which appears toequate with the cold lithosphere (Figures 8a, 8b, 10a, and10b) appears to be the controlling factor in the proposedmantle upwelling.
6.4. Indo-Eurasian Collision Zone
[42] For the past �50 Ma Asian tectonics has beendominated by the collision of India and southern Eurasia.The continued northward motion of India since the closureof the Tethys Ocean has uplifted the Himalaya Mountainsand the Tibetan Plateau. However, how the collision relatesto structures in the upper mantle is still unclear. At shallowdepths (<100 km) in our model, India is fast and the TibetanPlateau is slow with respect to the reference model(Figure 4a); however, by 150 km depth the mantle beneathTibet is fast (Figure 4b). Figures 8d and 8e show two profilesthrough the model crossing the Indo-Eurasian collision zoneand these show fast Indian mantle dips northward beneathTibet. At shallower depths beneath Tibet the velocities arelow. These low velocities extend to somewhat deeper depthsbeneath northern Tibet than they do beneath southern Tibet(Figure 8e). An isolated high-velocity anomaly underlies theTarim Basin at shallow depths (Figure 4a), but by 150 kmdepth this merges with the high velocities beneath thewestern Tibetan Plateau (Figure 4b).[43] Both surface wave group [Ritzwoller and Levshin,
1998] and phase [Curtis et al., 1998; Griot et al., 1998a]velocity tomographic studies of the Tibetan Plateau show achange from low to high velocity with increasing period,consistent with the low velocity at shallow depth and highvelocities at deeper depths that we see beneath the plateau.Griot et al. [1998a] suggested that the low phase velocity atshort period (<70 s) resulted from the thick crust andpossible partial melting in the uppermost mantle litho-
sphere, and the high phase velocity at long-period (>70 s)results from the inward plunge of the cold lithosphericmantle surrounding Tibet. However, more detailed seismicstudies show that the low velocities in the uppermost mantleare confined to the northern part of the plateau and that thethickest crust occurs in the southern part of the plateau [Niand Barazangi, 1983; McNamara et al., 1995; Woodwardand Molnar, 1995; McNamara et al., 1997; Yuan et al.,1997; Wittlinger et al., 2004; Rapine et al., 2003; Mitra etal., 2005]. Therefore the pattern of low velocity we see atshallow depths beneath Tibet (Figures 8d and 8e) is notlikely to result solely from the thick Tibetan crust.[44] On the basis of the low uppermost mantle velocity
seen beneath northern Tibet coupled with the nature of thevolcanics on the northern part of the plateau [Chung et al.,2005], a model for plateau uplift involving lithosphericdelamination has been proposed [Molnar, 1988; Molnar etal., 1993]. However, our mantle model (Figures 8d and 8e)shows that high-velocity material underlies most and pos-sibly all of Tibet to a depth of 225–250 km. This suggeststhat the Indian lithosphere has not detached and sunkbeneath the plateau but that most of the plateau has beenunderthrust by high-velocity Indian mantle from the southand possibly to a lesser extent, high-velocity Asian mantlefrom the north. However, because of the smoothing due tothe long wavelengths of our surface wave data and the400 km correlation length used in the tomographic inver-sion, we cannot rule out a narrow upwelling beneath theplateau as proposed by Tilmann et al. [2003]. McNamaraet al. [1995] found that whereas Sn from near events wasblocked for paths crossing the northern part of the plateau,S waves from events at larger regional distances did propa-gate efficiently beneath the plateau, supporting the continuityof the high velocity lid beneath most, if not all, of Tibet.[45] There are two intriguing features deeper in the
mantle beneath India and Tibet. By 250 km depth thehigh-velocity mantle beneath Peninsular India and northernTibet has largely disappeared, but high velocities persistbeneath the Himalaya and southern Tibet and extend to thesoutheast beneath northern Burma (Figure 4d), a region ofdeep seismicity. Profile EE0 (Figure 8e) shows that this is ahigh-velocity tabular feature extending to the base of ourmodel and suggests that India has overridden a subductedlithospheric fragment. High velocities beneath southernTibet have been noted in past body wave studies [Pandeyet al., 1991; Zhou et al., 1996; Tilmann et al., 2003].Tilmann et al. [2003] invert P wave traveltime residualfrom INDEPTH II and III data and found a high velocitystructure extending to �400 km depth beneath southernTibet. They discount that this high-velocity anomaly is aremnant of the Tethys Oceanic lithosphere as observeddeeper in the mantle to the south beneath India [Van derVoo et al., 1999] because such a body of dense and coldmaterial would not be stable over 50–60 Ma and wouldhave sunk into the mantle or been thermally eroded. InsteadTilmann et al. [2003] suggest this is delaminated Indiancontinental lithosphere as proposed by Chemenda et al.[2000]. However, the Chemenda et al. [2000] modeldepends on India having a weak lower crust and it isbecoming increasingly clear that this is not the case [Jackson,2002; Jackson et al., 2004]. In addition, the Precambriancrust of the Indian subcontinent today is underlain by a
B10304 PRIESTLEY ET AL.: EAST ASIAN UPPER MANTLE STRUCTURE
14 of 20
B10304
fast, buoyant root, similar to but somewhat thinner thanthe other shields and such buoyant material would notdelaminate and sink. On the other hand, there are frag-ments of oceanic lithosphere such as the Black Sea and theCaspian Sea, presently caught up in other parts of theAlpine-Himalayan belt. These persist for a time but willeventually subduct, forming an intermediate-depth, dippingseismic zone within the continental interior, such as thatpresently observed below the Hindu Kush [Priestley et al.,1994; Jackson et al., 2002]. The high-velocity, steeplydipping slab (Figures 8d and 8e) beneath southern Tibetmay result from a similar process.[46] Finally, there is a low-velocity feature extending to
the base of the model beneath Gujarat India (Figures 4 and8e), but this is near the edge of our model and we have lessconfidence in the resolution of this feature than in theresolution of features farther north in the model. This low-velocity anomaly is small in size in the upper parts of themodel but broadens with depth. Kennett and Widiyantoro[1999] noted a similar feature in their P wave tomographicmodel.
6.5. Subduction Zones and Back-Arc Basins
[47] The subduction zones and back-arc basins of thenorthwest Pacific have been imaged in numerous bodywave tomographic models [e.g., van der Hilst et al.,1993] and are not the focus of this paper. However, theydo provide insight into the resolution of our Sv model. Thethickness of the old oceanic lithosphere being subductedbeneath Japan is �100 km [McKenzie et al., 2005], whereasthe thickness of the subducting oceanic lithosphere imagedin the model is 400–500 km, yielding a qualitative estimateof the model resolution, at least in this part of the model.The NW Pacific back-arc basins from the northern part ofthe South China Sea to the Sea of Okhotsk have low-velocity structures extending to 200–250 km depth withwave speeds at 100–150 km depth �8% slow with respectto the reference model (Figures 4, 8a, and 8c).
7. Anisotropy
[48] The pattern of azimuthal anisotropy in our model iscomplex at shallow depths and decreases in both amplitudeand complexity with increasing depth (Figure 4). Much ofthe shallow azimuthal anisotropy is likely to be inheritedfrom past episodes of orogenic deformation and the super-position of a number of such episodes on the continents canresult in an anisotropic fabric that varies over a smallerlength scale than that in the ocean where the plate formationand asthenospheric flow patterns are much simpler. Theazimuthal anisotropy resolution test discussed above showsthat the recovered azimuthal anisotropy by our surface waveanalysis may be unreliable in regions where the pattern ofazimuthal anisotropy changes rapidly with respect to thewavelength of the surface waves.[49] Griot et al. [1998b] measured phase velocity for 619
vertical and 254 horizontal component seismograms forpaths crossing eastern China and Tibet with the highestpath density in eastern China. Their tomographic techniqueis similar to that applied in our study, but they provide noresolution tests for azimuthal anisotropy. They observedstrong lateral variations in azimuthal anisotropy over rela-
tively narrow zones beneath Tibet and conclude that downto 200 km depth the observed pattern of azimuthal anisot-ropy reflected a deformation coherent with the motion on asmall number of major faults extending deep into or throughthe lithosphere. Our path density and azimuthal coverage ofTibet are substantially better than that of Griot et al. [1998b]and while our azimuthal anisotropy observations are broad-ly in agreement with theirs, the resolution tests presented inthis study call into question the conclusions of Griot et al.[1998b] concerning the pattern of the azimuthal anisotropy.[50] Laboratory experiments on olivine aggregates sug-
gest that at deeper depths in the mantle, flow orients crystalsand results in a lattice-preferred orientation (LPO) whichgives rise to azimuthal anisotropy for seismic wave propa-gation. The degree of alignment of olivine crystals isbelieved to be strain-dependent. Simple shear at the baseof a moving plate will produce anisotropy with a fast a axisthat follows the principal extension direction for moderatedeformation and aligns with the flow direction for largedeformation [Zhang and Karato, 1995]. There are a rangeof situations where complications can occur. Kaminski andRibe [2002] show that there is a timescale for crystalalignment along the flow. When the flow changes abruptlyor is disrupted, the fast a axis may not have enough time tofollow the rapid change and to align with the flow. Underwater-rich conditions, the relations between anisotropy andflow are also complicated [Jung and Karato, 2001]. Al-though such conditions may not be common in the uppermantle [Kaminski, 2002] they are plausible in subductionzones or in regions where upwelling material contains alarge amount of water [Jung and Karato, 2001]. If weassume a relatively water-poor olivine, modest simple shearwill produce LPO with a plunging a axis. If the uppermantle anisotropy does result primarily from the preferredalignment of olivine crystals, the direction of fast Sv wavepropagation is expected to be along the projection in thehorizontal plane of the fast a axis [Leveque et al., 1998] sothe strength of the azimuthal anisotropy will graduallyreduce as the a axis departs from the horizontal. Thereforethe slow horizontal motion of the Eurasian plate would beexpected to produce small basal shear and weak azimuthalanisotropy as is observed below �200 km depth (Figure 4).In fact, Debayle et al. [2005] suggest from a global study ofazimuthal anisotropy that the Australian plate is the onlycontinental plate moving fast enough to produce large-scalebasal shear and large amplitude azimuthal anisotropy. Anincrease in the amount of clinopyroxene relative to olivine[Beghein and Trampert, 2003] or the activation of adifferent slip system by high-pressure dislocation creep[Mainprice et al., 2005] may also contribute to reduce thestrength of azimuthal anisotropy below 220 km depth.
8. East Asian Lithosphere
[51] The high wave speed roots of the east Asian cratonsdo not extend deeper than 200–225 km (Figure 4). Nodulesfrom the kimberlite eruptions show that the cratonic rootconsists of depleted harzburgite with a density that is about40 kg m�3 less than fertile mantle consisting of lherzolite.Jordan [1979] shows that the seismic velocity changeassociated with the depletion is only 0.03 km s�1 andPriestley and McKenzie [2006] show the removal of 25%
B10304 PRIESTLEY ET AL.: EAST ASIAN UPPER MANTLE STRUCTURE
15 of 20
B10304
melt results in a Vs change equivalent to a change intemperature of 96�C when the temperature is less thanabout 1100�. McKenzie et al. [2005] suggest that themechanical behavior of both the oceanic and continentalmantle depends primarily on temperature and Priestley andMcKenzie [2006] used the correspondence between the Vs
and thermal structure of the Pacific plate [McKenzie et al.,2005] to obtain an empirical relationship between thetemperature (Q) in �C, wave speed (Vs), and depth (z).They showed that
V ?s ¼ Vs= 1þ bV z� 50ð Þð Þ
V ?s ¼ mQþ cþ A exp� E þ PVað Þ=RT
ð1Þ
where E is the activation energy, Va the activation volume, Tthe temperature in �K, and the constant values
bV ¼ 3:84� 10�4 km�1; m ¼ �2:8� 10�4 km s�1 C�1;
c ¼ 4:72 km s�1; A ¼ �1:8� 1013 km s�1;
E ¼ 409 kJ mol�1; Va ¼ 10� 10�6 m3 mol�1 � 10 cm3 mol�1� �
provide a good fit of Vs(T) for the Pacific lithosphere.Equation (1) can be inverted to obtain T(z) from the valuesof Vs(z) of Figure 4. Figure 11 shows the variation in thethickness of the thermal lithosphere for eastern Asia derivedfrom the Vs model. Partly because velocities at depths ofless than 100 km may be affected by the leakage from thethick low-velocity crust in central Asia, and partly becausethe temperature estimates are more accurate at hightemperature, only those values of T(z) that exceed 1100�Cat a depth of 125 km or more were used to obtain thegeotherms and to estimate the lithospheric thickness.Estimates of lithospheric thickness from Vs and from thenodulemineralogy are independent and agree towithin 20 km[Priestley and McKenzie, 2006]. Priestley and McKenzie[2006] refer to the low-temperature continental roots ascontinental ‘‘cores.’’[52] The north Eurasian core (Figure 11) consists of the
Siberian Platform, the West Siberian Basin and the Euro-pean Platform. This structure is what we refer to above asstable Eurasia and it is this structure which appears tocontrol the deformation associated with central and southernAsia. This is clear in the Baikal region where the earth-quakes of the northeast part of the rift follow the boundarydefined by the lithospheric root and not the mapped surface
Figure 11. Contours of the thickness of that part of the Asian lithosphere in the diamond stability fieldcalculated from the Sv wave speed Asia model. The small black dots show the locations at which thelithospheric thickness was calculated. The color circles show the locations of kimberlite volcanics (red,diamondiferous; yellow, nondiamondiferous). Yellow lines denote the same tectonic features shown inFigure 1; bold black lines denote plate boundaries.
B10304 PRIESTLEY ET AL.: EAST ASIAN UPPER MANTLE STRUCTURE
16 of 20
B10304
position of the craton. Other features in Asia with thickthermal lithosphere are the Hindu Kush zone, the TarimBasin, the western part of the Sino-Korean Craton, theSichuan Basin, and the northern India–southern Tibetregion. The lithosphere is thin beneath the Indian Peninsulaand beneath eastern China.[53] Diamondiferous kimberlites occur on both the east
Sino-Korean Craton and the Indian Peninsula (Figure 11).The diamond-bearing kimberlites in eastern China areOrdovician (�475 Ma) age, indicating that the eastern partof the Sino-Korean Craton had a thermal lithosphereextending into the diamond stability field at the time ofthe kimberlite eruptions, but there is no indication of acratonic root at present. How such a low-density, buoyantlithosphere could be destroyed is puzzling. It would not beexpected to founder because the depleted harzburgite form-ing the lithosphere is lighter than the underlying fertilemantle; a rise in temperature would also increase its buoy-ancy. On the other hand, the continental cores are onlyvisible in Figure 11 because their average velocity is high.Perhaps the extension which eastern China has experiencedsince the Mesozoic has led to a thinning of the depleted rootor the root has been intruded by more fertile mantle materialassociated with the Cenozoic volcanics in eastern China. Inthese cases the depleted root might be too thin or have anaverage velocity too low to be resolved by the low-frequencysurface waves. Perhaps the cratons of southern India haveundergone a similar stretching episode during the disrup-tion of Gondwanaland which may explain why India’shigh-velocity cratonic root, while present in our Sv maps,does not extend to as great a depth as do most othercratonic roots.
9. Summary
[54] We have applied multimode surface wave tomogra-phy to determine the Sv structure of the Asian upper mantle.The relatively short paths (�6000 km) and dense higher-mode coverage have enabled us to build an upper mantlemodel for Asia with a horizontal resolution of a fewhundred kilometers extending to a depth of �400 km. Atshallow depths (<150 km) in the model there is approxi-mately ±9% Sv wave speed heterogeneity, the amplitude ofthe azimuthal anisotropy is large, and the pattern of azi-muthal anisotropy is complex. At deeper depths (>250 km)the Sv wave speed heterogeneity reduces to approximately±2–3%, the amplitude of the azimuthal anisotropy decreases,and its pattern becomes less complex. Above�200 km depththe upper mantle structure of the model is correlated withsurface geology and tectonics; below �200 km depth thestructures primarily reflect the advection of material in theupper mantle, primarily the subducting slabs.[55] The Siberian Platform has a high-velocity root
extending to 200–225 km depth whose eastern boundaryclosely matches the geologically mapped boundary of theplatform along the western boundary of the Verkhoyanskfold and thrust belt, but in the west the high-velocity uppermantle lid extends across the West Siberian Basin as far asthe Ural Mountains where it merges with the high-velocityroot beneath the East European Platform. A prominent low-velocity anomaly extends along the southern boundary ofthe Siberian Platform beneath the Hangay Dome–Baikal
Rift region. The relationship between the fold-and-thrustbelts and the Baikal Rift to the east and south of theplatform with the subsurface location of the platformboundary suggests that the thick high wave speed root ofthe platform is the controlling factor in the deformation ofnortheastern Asia.[56] The western part of the Sino-Korean Craton has a
high-velocity lithospheric root extending to �225 km depth,but the high-velocity root is missing or highly attenuatedbeneath the Archean crust of the eastern part of the craton.This observation is consistent with the petrologic studieswhich show that diamondiferous kimberlites erupted on theeastern part of the Sino-Korean Craton in the Paleozoic,implying the Archean crust was underlain at that time by acool, depleted root extending into the diamond stabilityfield. However, in the same region, basaltic magmasentraining spinel-facies nodules were erupted in the Ceno-zoic showing the lack of such a cool, depleted root at thattime. An isolated high-velocity feature exists at 100 kmdepth beneath the Yangtze Craton, but by 150 km depth theroot expands to the west, merging with the high velocities atthis depth beneath eastern Tibet.[57] In our upper mantle model all of Tibet is underlain
by high velocity material to a depth of 225–250 km.However, because of the smoothing of the surface waves,we cannot rule out a narrow upwelling beneath the plateauas proposed by Tilmann et al. [2003]. High-velocity mate-rial occurs to at least 400 km depth beneath southern Tibetand northern India.[58] We use our Sv wave speed upper mantle model and
the results of Priestley and McKenzie [2006] to produce acontour map of the thermal lithospheric thickness of easternAsia. Our lithospheric model shows an extensive region ofthick lithosphere beneath the Siberian Platform and the WestSiberian Basin that extends west to the European Platform,forming the stable Eurasian craton or core. The easternportion of this structure appears to be controlling thegeometry of continental deformation in this region. Thick,cold lithosphere also underlies Tibet and the Tarim Basinbut is absent from beneath the Indian shield and the easternSino-Korean craton.
[59] Acknowledgments. This study would not have been possiblewithout permanent and temporary seismographs operated in Asia, Europe,and North America. Our study has included data from the ASRO/SRO,CDSN, CNSN, ERI/STA, GEOFON, GEOSCOPE, IRIS-IDA, IRIS-USGS,KNET, and KZNET permanent seismic networks and the Tibetan PlateauBroadband Experiment, Kamchatka Subduction Zone, INDEPTH II,INDEPTH III, and GHENGIS PASSCAL temporary seismic deployments.This research has benefited from discussions with M. Cara, J. Jackson, J.-J.Leveque, and F. Tilmann. Priestley would like to thank both the Institut dePhysique du Globe de Strasbourg and GeoForschungsZentrum, Potsdam,for supporting time to pursue this work. Debayle was supported byprogramme DyETI conducted by the French Institut National des Sciencesde l’Univers (INSU). A number of the figures were prepared using GenericMapping Tool [Wessel and Smith, 1995]. This is Cambridge UniversityDepartment of Earth Sciences contribution ES8481.
ReferencesArtemieva, I., and W. Mooney (2001), Thermal thickness and evolution ofprecambrian lithosphere: A global study, J. Geophys. Res., 106, 16,387–16,414.
Baljinnyam, I., et al. (1993), Ruptures of major earthquakes and activedeformation in Mongolia and its surroundings, Mem. Geol. Soc. Am.,181, 1–59.
Bayasgalan, A., J. Jackson, and D. McKenzie (2005), Lithosphere rheologyand active tectonics in Mongolia: Relations between earthquake source
B10304 PRIESTLEY ET AL.: EAST ASIAN UPPER MANTLE STRUCTURE
17 of 20
B10304
parameters, gravity and GPS mesurements, Geophys. J. Int., 163, 1151–1179, doi:10.1111/j.1365-246X.2005.02764.x.
Beghein, C., and J. Trampert (2003), Probability density function for radialanisotropy: Implications for the upper 1200 km of the mantle, EarthPlanet. Sci. Lett., 217, 151–162.
Boyd, F., M. Pokhilenko, D. Pearson, S. Mertzman, N. Sobolev, andL. Finger (1997), Composition of the Siberian cratonic mantle: Evidencefrom Udachnaya peridotite xenoliths, Contrib. Mineral Petrol., 128,228–246, doi:10.1007/s004100050305.
Brey, G., and T. Kohler (1990), Geothermobarometry in four-phase lherzo-lites II. New thermobarometers, and practical assessment of existingthermobarometers, J. Petrol., 311, 1353–1378.
Cara, M., and J. Leveque (1987), Waveform inversion using secondaryobservables, Geophy. Res. Lett., 14, 1046–1049.
Chemenda, A., J.-P. Burg, and M. Mattauer (2000), Evolutionary model ofthe Himalaya–Tibet system: Geopoem based on a new modelling, geo-logical and geophysical data, Earth Planet. Sci. Lett., 174, 397–409.
Chung, S.-L., et al. (2005), Tibetan tectonic evolution inferred from spatialand temporal variations in post-collisional magmatism, Earth Sci. Rev.,68, 173–196.
Cunningham, W. D. (1998), Lithospheric controls on late cenozoic con-struction of the Mongolian Altai, Tectonics, 17, 891–902.
Cunningham, W. D. (2001), Cenozoic normal faulting and regional domingin the southern Hangay region, Central Mongolia: Implications for theorigin of the Baikal rift province, Tectonophysics, 331, 389–411.
Cunningham, W. D., B. Windley, D. Dorjnamjaa, G. Badamgarov, andM. Saandar (1996), A structural transect across the Mongolian WesternAltai; Active transpressional mountain building in central Asia, Tectonics,157, 142–156.
Curtis, A., J. Trampert, R. Snieder, and B. Dost (1998), Eurasian funda-mental mode surface wave phase velocities and their relationship withtectonic structures, J. Geophys. Res., 103, 26,919–26,947.
Debayle, E. (1999), Sv-wave azimuthal anisotropy in the Australian uppermantle: Preliminary results from automated Rayleigh waveform inver-sion, Geophys. J. Int., 137, 747–754.
Debayle, E., and B. Kennett (2000), Anisotropy in the Australasian uppermantle from Love and Rayleigh waveform inversion, Earth Planet. Sci.Lett., 184, 339–351.
Debayle, E., and B. Kennett (2003), Surface-wave studies in the Australianregion, Geol. Soc. Aust. Spec. Publ., 22, 19–34.
Debayle, E., and M. Sambridge (2004), Inversion of massive surface wavedata sets: Model construction and resolution assessment, J. Geophys.Res., 109, B02316, doi:10.1029/2003JB002652.
Debayle, E., J.-J. Leveque, and M. Cara (2001), Seismic evidence for aplume in the upper mantle beneath the northeastern Afro/Arabian con-tinent, Earth Planet. Sci. Lett., 193, 423–436.
Debayle, E., B. Kennett, and K. Priestley (2005), Global azimuthal seismicanisotropy and the unique plate-motion deformation of Australia, Nature,433, 509–512.
Dziewonski, M. A., and D. Anderson (1981), Preliminary Reference EarthModel, Phys. Earth Planet. Inter., 25, 297–356.
Ekstrom, G., J. Tromp, and E. Larson (1997), Measurements and globalmodels of surface wave propagation, J. Geophys. Res., 102, 8137–8157.
Engdahl, E., R. van der Hilst, and R. Bulland (1998), Global teleseismicearthquake relocation with improved travel times and procedures fordepth determination, Bull. Seismol. Soc. Am., 88, 722–743.
Friederich, W. (2003), The s-velocity structure of the East Asian mantlefrom inversion of shear and surface waveforms, Geophys. J. Int., 153,88–102.
Goodwin, A. (1991), Precambrian Geology: The Dynamic Evolution of theContinental Crust, Elsevier, New York.
Griffin, W. L., Z. Andi, S. Y. O’Reilly, and C. G. Ryan (1998), Phanerozoicevolution of the lithosphere beneath the Sino-Korean Craton, in MantleDynamics and Plate Interaction in East Asia, Geodyn. Ser., vol. 27,edited by M. Flower, pp. 107–126, AGU, Washington, D. C.
Griffin, W. L., C. Ryan, F. Kaminsky, S. O’Reilly, L. Natapov, T. Win,P. Kinny, and I. Ilupin (1999), The Siberian lithosphere traverse: Mantleterranes and the assembly of the Siberian Craton, Tectonophysics, 310,1–35.
Griot, D., J. Montagner, and P. Tapponnier (1998a), Phase velocity structurefrom Rayleigh and Love waves in Tibet and its neighboring regions,J. Geophys. Res., 103, 21,215–21,232.
Griot, D., J. Montagner, and P. Tapponnier (1998b), Confrontation of man-tle seismic anisotropy with two extreme models of strain, in central Asia,Geophys. Res. Lett., 25, 1447–1450.
Hofmeister, A. (1999), Mantle values of thermal condutivity and thegeotherm from phonon lifetimes, Science , 283 , 1699 – 1709,doi:10.1126/science.283.5408.1699.
Ionov, D., I. Ashchepkov, H.-G. Stosch, G. Witt-Eickschen, and H. Seck(1993), Garnet peridotite xenoliths from the Vitim volcanic field, Baikalregion: The nature of the garnet-spinel peridotite transition zone in thecontinental mantle, J. Petrol., 34, 1141–1175.
Ionov, D., S. O’Reilly, and I. Ashchepkov (1995), Feldspar-bearing lherzo-lite xenoliths in alkali basalts from Hamar-Daban, southern Baikal region,Russia, Contrib. Mineral Petrol., 122, 174–190.
Ionov, D., S. O’Reilly, and W. Griffin (1998), A geotherm and lithosphericsection for central Mongolia (Tariat region), in Mantle Dynamics andPlate Interaction in East Asia, Geodyn. Ser., vol. 27, edited by M. Flower,pp. 127–153, AGU, Washington, D. C.
Jackson, J. (2002), Strength of the continental lithosphere: Time to abandonthe jelly sandwich?, GSA Today, 12, 4–10.
Jackson, J., K. Priestley, M. Allen, and M. Berberian (2002), Active tec-tonics of the South Caspian Basin, Geophys. J. Int., 148(2), 214–245.
Jackson, J., H. Austrheim, D. McKenzie, and K. Priestley (2004),Metastability, mechanical strength, and the support of mountain belts,Geology, 32, 625–628.
Jahn, B. M., B. Auvray, J. Cornichet, Y. Bai, Q. Shen, and D. Liu (1987),3.5 Ga old amphibolites from eastern Hebei Provience, China: Fieldoccurrence, petrography, Sm-Nd isochron age and REE geochemistry,Precambrian Res., 34, 311–346.
Jahn, B. M., G. Gruau, R. Capdevila, J. Cornichet, A. Nemchin, R. Pidgeon,and V. A. Rudnik (1998), Archean crustal evolution of the Aldan Shield,Siberia: Geochemical and isotopic constraints, Precambrian Res., 91,333–363.
Jaupart, C., and J. Mareschal (1999), The thermal structure and thickness ofcontinental roots, Lithos, 48, 93–114.
Jordan, T. (1979), Mineralogies, densities and seismic velocities of garnetlherzolite and their geophysical implications, in The Mantle Sample:Inclusions in Kimberlites and Other Volcanics, vol. 2, edited by F. Boydand H. Meyer, pp. 155–165, AGU, Washington, D. C.
Jung, H., and S.-I. Karato (2001), Water-induced fabric transitions in oli-vine, Science, 293, 1460–1463.
Kaminski, E. (2002), The influence of water on the development of latticepreferred orientation in olivine aggregates, Geophys. Res. Lett., 29(12),1576, doi:10.1029/2002GL014710.
Kaminski, E., and N. M. Ribe (2002), Timescales for the evolution ofseismic anisotropy in mantle flow, Geochem. Geophys. Geosyst., 3(8),1051, doi:10.1029/2001GC000222.
Kennedy, C., and G. Kennedy (1976), The equilibrium boundary betweengraphite and diamond, J. Geophys. Res., 81, 2467–2470.
Kennett, B. (1995), Approximations for surface-wave propagation in later-ally varying media, Geophys. J. Int., 122, 470–478.
Kennett, B., and S. Widiyantoro (1999), A low seismic wavespeed anomalybeneath northwest India: A seismic signature of the Deccan plume?,Earth Planet. Sci. Lett., 165, 145–155.
Khutorskoy, M., and V. Yarmoluk (1989), Heat flow, structure and evolu-tion of the lithosphere of Mongolia, Tectonophysics, 164, 315–322.
Kiselev, A. (1987), Volcanism of the Baikal rift zone, Tectonophysics, 143,235–244.
Kiselev, A., and A. Popov (1992), Asthenospheric diapir beneath the Baikalrift petrological constraints, Tectonophysics, 208, 287–295.
Kopylova, M., S. O’Reilly, and Y. Genshaft (1995), Thermal state of thelithosphere beneath central Mongolia: Evidence from the deep-seatedxenoliths from the Shavaryn-Saram volcanic centre in the Tariat depres-sion, Hangai, Mongolia, Lithos, 36, 243–255.
Lebedev, S., and G. Nolet (2003), Upper mantle beneath Southeast Asiafrom S velocity tomography, J. Geophys. Res., 108(B1), 2048,doi:10.1029/2000JB000073.
Leveque, J., E. Debayle, and V. Maupin (1998), Anisotropy in the IndianOcean upper mantle from Rayleigh and Love waveform inversion,Geophys. J. Int., 133, 529–540.
Li, Z. (1994), Collision between the North and South China blocks: Acrustal-detachment model for suturing in the region east of the Tanlufault, Geology, 22, 739–742.
Li, Z., L. Zhang, and C. Powell (1995), South China in Rodinia: Part of themissing link between Australia–East Antarctica and Laurentia?, Geology,23, 407–410.
Liu, D. Y., A. Nutman, W. Compston, J. Wu, and Q. Shen (1992), Rem-nants of >3800 Ma crust in the Chinese part of the Sino-Korean craton,Geology, 20, 339–342.
Liu, G. (1987), The Cenozoic rift system of the North China Plain and thedeep internal process, Tectonophysics, 133, 277–285.
Logatchev, N. (1993), History and geodynamics of the Lake Baikal rift inthe context of the eastern Siberian rift system: A review, Bull. Cent. Rech.Explor.-Prod. Elf Aquitaine, 17, 353–370.
Logatchev, N., and Y. Zorin (1987), Evidence and causes of the two-stagedevelopment of the Baikal rift, Tectonophysics, 143, 225–234.
B10304 PRIESTLEY ET AL.: EAST ASIAN UPPER MANTLE STRUCTURE
18 of 20
B10304
Logatchev, N., and Y. Zorin (1992), Baikal rift zone—Structure and geo-dynamics, Tectonophysics, 208, 273–286.
Lowman, J., and G. Jarvis (1996), Continental collision in wide aspect ratioand high Rayleigh number two-dimensional mantle convection models,J. Geophys. Res., 101, 25,485–25,497.
Ma, X., G. Liu, and J. Su (1984), The structure and dynamics of the con-tinental lithosphere in north-northeast China, Ann. Geophys., 3, 611–620.
Maggi, A., and K. Priestley (2005), Surface waveform tomography of theTurkish– Iranian Plateau, Geophys. J. Int., 160, 1068–1080.
Mainprice, D., A. Tommasi, H. Couvy, P. Cordler, and D. Frost (2005),Pressure sensitivity of olivine slip systems and seismic anisotropy ofEarth’s upper mantle, Nature, 433, 731–733.
Marquering, H., R. Snieder, and G. Nolet (1996), Waveform inversion andthe significance of surface-wave mode coupling, Geophys. J. Int., 124,258–278.
McKenzie, D., and M. Bickle (1988), The volume and composition of meltgenerated by extension of the lithosphere, J. Petrol., 29, 625–679.
McKenzie, D., J. Jackson, and K. Priestley (2005), Thermal structure ofoceanic and continental lithosphere, Earth Planet. Sci. Lett., 233, 337–349.
McNamara, D. E., T. J. Owens, and W. Walter (1995), Observations ofregional phase propagation across the Tibetan Plateau, J. Geophys.Res., 100, 22,215–22,229.
McNamara, D. E., W. Walter, T. J. Owens, and C. Ammon (1997), Uppermantle velocity structure beneath the Tibetan Plateau from Pn travel timetomography, J. Geophys. Res., 102, 493–505.
Menzies, M. A., and Y. Xu (1998), Geodynamics of the north China craton,in Mantle Dynamics and Plate Interaction in East Asia, Geodyn. Ser.,vol. 27, edited by M. Flower, pp. 155–165, AGU, Washington, D. C.
Menzies, M. A., W.-M. Fan, and M. Zhang (1993), Pleozoic and Cenozoiclithosphere and the loss of >120 km of archean lithosphere, Sino-Koreancraton, China, in Magmatic Processes and Plate Tectonics, edited byH. Orichard et al., Geol. Soc. Spec. Publ., 76, 71–81.
Mitra, S., K. Priestley, A. Bhattacharyya, and V. Gaur (2005), Crustalstructure and earthquake focal depths beneath northeastern India andsouthern Tibet, Geophys. J. Int., 160, 227–248.
Mitrofanov, G., and A. Taskin (1994), Structural relations of the SiberianPlatform with its folded frame, Geotectonics, 28, 1–12.
Molnar, P. (1988), A review of geophysical constraints on the deep structureof the Tibetan Plateau, the Himalaya and the Karakoram, and their im-plications, Philos. Trans. R. Soc. London, Ser. A, 326, 33–88.
Molnar, P., and P. Tapponnier (1975), Cenozoic tectonic of asia: Effects of acontinental collision, Science, 189, 419–426.
Molnar, P., P. England, and J.Martinod (1993),Mantle dynamics, uplift of theTibetan Plateau, and the Indian monsoon, Rev. Geophys., 31, 357–396.
Montagner, J. (1986), Regional three-dimensional structures using long-period surface waves, Annales Geophysicae, 4, 283–294.
Nataf, H.-C., and Y. Ricard (1996), 3SMAC: An a priori tomographicmodel of the upper mantle based on geophysical modeling, Phys. EarthPlanet. Inter., 95, 101–122.
Ni, J., and M. Barazangi (1983), High-frequency seismic wave propagatiobeneath the Indian Shield, Himalayan Arc, Tibetan Plateau and surround-ing regions, high uppermost mantle velocities and different propagationbeneath Tibet, Geophys. J. R. Astron. Soc., 72, 665–689.
Pandey, M., S. Roecker, and P. Molnar (1991), P-waveresiduals at stationsin Nepal: Evidence for a high velocity region beneath the Karakorum,Geophys. Res. Lett., 18, 1909–1912.
Pavlenkova, G., K. Priestley, and J. Cipar (2002), 2D model of the crust anduppermost mantle along rift profile, Siberian craton, Tectonophysics, 355,171–186.
Petit, C., I. Koulakov, and J. Deverchere (1998), Velocity structure aroundthe Baikal rift zone from teleseismic amd local earthquake traveltimesand geodynamic implications, Tectonophysics, 296, 125–144.
Petit, C., J. Deverchere, E. Calais, V. San’kov, and D. Fairhead (2002),Deep structure and mechanical behavior of the lithosphere in the Hangai–Hovsgol region, Mongolia: New constraints from gravity modeling, EarthPlanet. Sci. Lett., 1972, 133–149.
Pilidou, S., K. Priestley, G. Gudmundsson, and E. Debayle (2005), Uppermantle S-wavespeed heterogeneity beneath the North Atlantic from re-gional surface waveform tomography: High resolution image of the Ice-land plume, Geophys. J. Int., 159, 1057–1076.
Priestley, K., and E. Debayle (2003), Seismic evidence for a moderatelythick lithosphere beneath the Siberian Platform, Geophys. Res. Lett.,30(3), 1118, doi:10.1029/2002GL015931.
Priestley, K., and D. McKenzie (2006), The thermal structure of the litho-sphere from shear wave velocities, Earth Planet. Sci. Lett., 244, 285–301.
Priestley, K., C. Baker, and J. Jackson (1994), Implications of earthquakefocal mechanism data for the active tectonics of the south Caspian Basinand surrounding regions, Geophys. J. Int., 118, 111–141.
Rapine, R., F. Tilmann, M. West, J. Ni, and A. Rodgers (2003), Crustalstructure of northern and southern Tibet from surface wave dispersionanalysis, J. Geophys. Res., 108(B2), 2120, doi:10.1029/2001JB000445.
Richter, F., and D. McKenzie (1981), Parameterizations for the horizontallyaveraged temperature of infinite Prandtl number convection, J. Geophys.Res., 86, 1738–1744.
Ritzwoller, M., and A. Levshin (1998), Eurasian surface wave tomography:Group velocities, J. Geophys. Res., 103, 4839–4878.
Ritzwoller, M. H., N. M. Shapiro, M. P. Barmin, and A. L. Levshin (2002),Global surface wave diffraction tomography, J. Geophys. Res., 107(B12),2335, doi:10.1029/2002JB001777.
Schatz, J., and G. Simmons (1972), Thermal conductivity od Earth materi-als at high temperatures, J. Geophys. Res., 77, 6966–6983.
Sengor, A., and B. Natal’in (1996), Paleotectonics of Asia: Fragments of asynthesis, in The Tectonic Evolution of Asia, edited by A. Yin andT. Harrison, pp. 486–640, Cambridge University Press, New York.
Sieminski, A., J. Leveque, and E. Debayle (2004), Can finite-frequencyeffects be accounted for in ray theory surface wave tomography?,Geophys. Res. Lett., 31, L24614, doi:10.1029/2004GL021402.
Song, B., A. Nutman, D. Liu, and J. Wu (1996), 3800 to 2500 Ma crustalevolution in the Anshan area of Kiaoning Provience, northeastern China,Phys. Rev. C, 78, 79–94.
Spetzler, J., and R. Snieder (2001), The effects of small-scale heterogeneityon arrival time of waves, Geophys. J. Int., 144, 786–796.
Suvorov, V., Z. Mishenkina, V. Gennadii, I. Sheludko, V. Seelenzrv, andV. Solovyov (2002), Structure of the crust in the Baikal rift zone andadjacent areas from deep seismic sounding data, Tectonophysics, 351,61–74.
Tain, Z.-Y., P. Han, and K.-D. Xu (1992), The Mesozoic-Cenozoic EastChina rift system, Tectonophysics, 208, 341–363.
Tapponnier, P., and P. Molnar (1979), Active faulting and Cenozoic tec-tonics of the Tien Shan, Mongolia, and Baykal regions, J. Geophys. Res.,84, 3425–3459.
Tarantola, A., and B. Valette (1982), Generalized nonlinear inverse pro-blems, Rev. Geophys., 20, 219–232.
Taylor, L., G. Snyder, R. Keller, D. Remley, M. Anand, R. Wiesli, J. Valley,and N. Sobolev (2003), Petrogenesis of group A eclogites and webster-ites: Evidence from the Obnazhennaya kimberlite, Yakutia, Contrib.Mineral Petrol., 145, 424–443, doi:10.1007/s00410-003-0465-y.
Tilmann, F., J. Ni, and INDEPTH III Seismic Team (2003), Seismic ima-ging of the downwelling Indian lithosphere beneath central Tibet,Science, 300, 1424–1427.
Trampert, J., and J. Spetzler (2006), Surface wave tomography: Finite-frequency effects lost in the null space, Geophys. J. Int., 164, 394–400.
van der Hilst, R., E. Engdahl, and W. Spakman (1993), Tomographic in-version of p and pp data for aspherical mantle structure below the north-west Pacific region, Geophys. J. Int., 115, 264–302.
Van der Voo, R., W. Spakman, and H. Bijwaard (1999), Tethyan subductedslabs under India, Earth Planet. Sci. Lett., 171, 7–20.
Villasenor, A., M. Ritzwoller, A. Levshin, M. Barmin, E. Engdahl,W. Spakman, and J. Trampert (2001), Shear velocity structure of centraleurasia from inversion of surface wave velocities, Phys. Earth Planet.Inter., 123, 169–184.
Wesnousky, S., L. Jones, C. Scholz, and Q. Deng (1984), Historical seis-micity and rates of crustal deformation along the margins of the Ordosblock, north China, Bull. Seismol. Soc. Am., 74, 1767–1783.
Wessel, P., and W. Smith (1995), New version of the generic mapping toolrelease, Eos Trans. AGU, 76, 329.
Windley, B., and M. Allen (1993), Mongolian plateau: Evidence for alate Cenozoic mantle plume under central Asia, Geology, 21, 295–298.
Wittlinger, G., J. Vergne, P. Tapponnier, V. Farra, G. Poupinet, M. Jiang,H. Su, G. Herquel, and A. Paul (2004), Telesesimic imaging of sub-ducting lithosphere and Moho offsets beneath western Tibet, EarthPlanet. Sci. Lett., 221, 117–130.
Woodhouse, J. (1974), Surface waves in a laterally varying layered struc-ture, Geophys. J. R. Astron. Soc., 37, 461–490.
Woodward, R., and P. Molnar (1995), Lateral heterogeneity in the uppermantle and SS-S traveltime intervals for SS rays reflected from the Ti-betan Plateau and its surroundings, Earth Planet. Sci. Lett., 135, 139–148.
Xu, X., and X. Ma (1992), Geodynamics of the Shanxi rift system, China,Tectonophysics, 208, 325–340.
Xu, X., S. Y. O’Reilly, W. L. Griffin, X. Zhou, and X. Huang (1998), Thenature of the Cenozoic lithosphere at Nushan, eastern China, in MantleDynamics and Plate Interaction in East Asia, Geodyn. Ser., vol. 27,edited by M. Flower, pp. 167–195, AGU, Washington, D. C.
Xu, Y., T. Shankland, S. Linhardt, D. Rubie, F. Langenhorst, and K. Klasinski(2004), Thermal diffusivity and conductivity of olivine, wadsleyite and
B10304 PRIESTLEY ET AL.: EAST ASIAN UPPER MANTLE STRUCTURE
19 of 20
B10304
ringwoodite to 20 GPa and 1373 K, Phys. Earth Planet. Inter., 143, 321–336, doi:10.1016/j.pepi.2004.03.005.
Yin, A., and S. Nie (1996), A phanerozoic palinspastic reconstruction ofChina and its neighboring regions, in The Tectonic Evolution of Asia,edited by A. Yin and T. Harrison, pp. 442–485, Cambridge Univ. Press,New York.
Yoshizawa, K., and B. Kennett (2002), Determination of the influence zonefor surface wave paths, Geophys. J. Int., 149, 440–453.
Yuan, X., J. Ni, R. Kind, J. Mechie, and E. Sandvol (1997), Lithosphericand upper mantle structure of southern Tibet from a seismological passivesource experiment, J. Geophys. Res., 102, 27,491–27,500.
Zhang, M., X.-H. Zhou, and J.-B. Zhang (1998), Nature of the lithosphericmantle beneath NE China: Evidence from potassic volcanic rocks andmantle xenoliths, in Mantle Dynamics and Plate Interaction in East Asia,Geodyn. Ser., vol. 27, edited by M. Flower, pp. 197–219, AGU, Wa-shington, D. C.
Zhang, S., and S. Karato (1995), Lattice preferred orientation of olivineaggragate deformed in simple shear, Nature, 375, 774–777.
Zhao, X., R. Coe, Y. Zhou, H. Wu, and J. Wang (1990), New paleomagneticresults from northern China: Collision and suturing with Siberia andKazakhstan, Tectonophysics, 181, 43–81.
Zhou, R., S. Grand, F. Tajima, and X. Ding (1996), High velocity zonebeneath the southern Tibetan Plateau from P-wave differential travel-timedata, Geophys. Res., 23.
Zolutkhin, V., and A. Al’muckhamedor (1988), Traps of the Siberian Plat-form, in Continental Flood Basalts, edited by J. Macdougall, pp. 272–310, Springer, New York.
Zorin, Y., V. Kozhevnikov, M. Novoselova, and E. Turutanov (1989),Thickness of the lithosphere beneath the Baikal rift zone and adjacentregions, Tectonophysics, 168, 327–337.
�����������������������E. Debayle, Ecole et Observatoire des Sciences de la Terre, CNRS and
Universite Louis Pasteur, F-67084 Strasbourg, France. ([email protected])D. McKenzie, S. Pilidou, and K. Priestley, Bullard Laboratories,