1 UPPER REPUBLICAN BASIN TOTAL MAXIMUM DAILY LOAD Waterbody: Prairie Dog Creek from headwaters to Norton (Keith Sebelius) Lake and Norton (Keith Sebelius) Lake Water Quality Impairments: Total Phosphorus and Eutrophication This TMDL serves as a revision for the Eutrophication portion of the existing Norton (Keith Sebelius) Lake Eutrophication/pH/Dissolved Oxygen TMDL approved by EPA on August 7, 2003. 1. INTRODUCTION AND PROBLEM IDENTIFICATION Subbasin: Prairie Dog Counties: Norton, Decatur, Rawlins, Sheridan, Thomas HUC 8: 10250015 HUC 10 (HUC 12): 01 (01, 02, 03, 04, 05, 06, 07) 02 (01, 02, 03, 04, 05, 06, 07) Ecoregion: Western High Plains, Flat to Rolling Cropland (25d) Central Great Plains, Rolling Plains and Breaks (27b) Drainage Area: Approximately 640 square miles Main Stem Water Quality Limited Segments: Prairie Dog Creek (12) in Thomas, Sheridan, and Decatur Counties; N. Fork Prairie Dog Creek (11) in Thomas and Decatur Counties; Prairie Dog Creek (10) in Decatur County; Prairie Dog Creek (8) in Decatur and Norton Counties flowing into Norton Lake. HUC 8: 10250015: Prairie Dog Creek (8, 10, 12) Tributaries: Prairie Dog Cr, N. Fork (11) Designated Uses: For all stream segments: Secondary Contact recreation (b) (stream segment is not open to and accessible by the public under Kansas Law); Expected Aquatic Life Support; Domestic Water Supply; Food Procurement; Ground Water Recharge; Industrial Water Supply; Irrigation Use; Livestock Watering Use.
Transcript
1
UPPER REPUBLICAN BASIN TOTAL MAXIMUM DAILY LOAD
Waterbody: Prairie Dog Creek from headwaters to Norton (Keith Sebelius) Lake and Norton (Keith Sebelius) Lake
Water Quality Impairments: Total Phosphorus and Eutrophication This TMDL serves as a revision for the Eutrophication portion of the existing Norton (Keith Sebelius) Lake Eutrophication/pH/Dissolved Oxygen TMDL approved by EPA on August 7, 2003. 1. INTRODUCTION AND PROBLEM IDENTIFICATION Subbasin: Prairie Dog Counties: Norton, Decatur, Rawlins, Sheridan, Thomas HUC 8: 10250015 HUC 10 (HUC 12): 01 (01, 02, 03, 04, 05, 06, 07) 02 (01, 02, 03, 04, 05, 06, 07) Ecoregion: Western High Plains, Flat to Rolling Cropland (25d) Central Great Plains, Rolling Plains and Breaks (27b) Drainage Area: Approximately 640 square miles Main Stem Water Quality Limited Segments: Prairie Dog Creek (12) in Thomas, Sheridan, and Decatur Counties; N. Fork Prairie Dog Creek (11) in Thomas and Decatur Counties; Prairie Dog Creek (10) in Decatur County; Prairie Dog Creek (8) in Decatur and Norton Counties flowing into Norton Lake. HUC 8: 10250015: Prairie Dog Creek (8, 10, 12) Tributaries: Prairie Dog Cr, N. Fork (11) Designated Uses: For all stream segments: Secondary Contact recreation (b) (stream segment is not open to and accessible by the public under Kansas Law); Expected Aquatic Life Support; Domestic Water Supply; Food Procurement; Ground Water Recharge; Industrial Water Supply; Irrigation Use; Livestock Watering Use.
2
Figure 1. Upper Prairie Dog Creek and Norton Lake watershed base map.
Norton Lake Conservation Pool:
Surface Area = 865 acres Watershed/Lake Ratio = 473:1 Maximum Depth = 12.0 m Mean Depth = 4.9 m Storage Volume = 16,570 Acre-Feet Estimated Retention Time = 0.61 Years Mean Annual Inflow = 5346 acre-feet (2696 cfs) (1998, 2001, 2007, 2008, 2010) Mean Annual Release = 3527 acre-feet (1779 cfs) (1998, 2001, 2007, 2008, 2010) Year Constructed = 1964 Norton Lake Designated Use: Primary Contact Recreation (A), Expected Aquatic Life Support, Domestic Water Supply, Food Procurement, Ground Water Recharge, Industrial Water Supply, Irrigation, and Livestock Watering Use. 303(d) Listings: Kansas Stream segments monitored by Station SC549 cited as impaired in the 2008 and 2010 – 303(d) list for the Upper Republican Basin. Norton Lake has an
3
existing TMDL for Eutrophication that is bundled with pH and Dissolved Oxygen, which was approved by EPA on August 7, 2003. Impaired Use: Expected Aquatic Life, Domestic Water Supply, and Contact Recreation Water Quality Criteria: Nutrients- Narratives: The introduction of plant nutrients into streams, lakes, or wetlands from artificial sources shall be controlled to prevent the accelerated succession or replacement of aquatic biota or the production of undesirable quantities or kinds of aquatic life (K.A.R. 28-16-28e(c)(2)(A)). The introduction of plant nutrients into surface waters designated for domestic water supply use shall be controlled to prevent interference with the production of drinking water (K.A.R. 28-16-28e(c)(3)(A)). The introduction of plant nutrients into surface waters designated for primary or secondary contact recreational use shall be controlled to prevent the development of objectionable concentrations of algae or algal by-products or nuisance growths of submersed, floating, or emergent aquatic vegetation (K.A.R. 28-26-28e(c)(7)(A)).
2. CURRENT WATER QUALITY CONDITION AND DESIRED ENDPOINT Level of Support for Designated Uses under 2010-303(d): Excessive nutrients are not being controlled and are thus impairing aquatic life; domestic water supply; and contributing to objectionable algal blooms that contribute to the eutrophication and impairment of contact recreation within Norton Lake. Level of Eutrophication for Norton Lake:
Fully Eutrophic, Trophic State Index = 56.52 Stream Monitoring Site: KDHE permanent ambient Stream Chemistry sampling station SC549 near Dellville above Norton Lake. Period of Record: 1990-2010 for KDHE station SC549 Lake Chemistry Monitoring Site: Station LM010001 in Norton Lake. Period of Record: 1986-2010 for KDHE station LM010001. Flow Record: Prairie Dog Creek above Keith Sebelius (Norton) Lake, USGS Gage 06847900 for the period of record from 1990-2010. Long Term Flow Conditions: Flow conditions for Prairie Dog Creek above Norton Lake are illustrated in Table 1 and Figures 2, 3, and 4. For purposes of this document the flow regime for Prairie Dog Creek is broken out into three flow conditions: low flow (76-85% exceedance), base flow (26-75%), and high flow (0-25%). The USGS Gage 06847900 along Prairie Dog Creek is within close proximity to the KDHE sampling
4
station SC549. Low flow conditions at the gage often results in an insufficient amount of water to sample at the KDHE sampling location. Table 1. Long Term Flow Conditions as calculated from USGS gage information for the period of record (1990-2010). Location Drainage
Area Mean Flow
90% 75% 50% 25% 10%
USGS Gage 06847900
609 mi2 7.85 0 0.74 3.2 7 11
The monthly average flows over the period of record are the highest during the months of March, May, June and July. The average monthly median flows over the period of record indicate the months with the highest consistent flows. As seen in Figure 3 this consists of the months of March, April, May and June. Prairie Dog Creek is an ephemeral stream upstream of the USGS gaging station between Clayton and Jennings. This is indicated on topographic maps and was visually confirmed by KDHE during a watershed survey. Sustained flow in the stream, or perennial flows, are achieved just upstream of Clayton. As seen in Figure 5, the inflows into Norton Lake are sporadic as flows tend to rise and fall quickly, though flow observations generally indicate Prairie Dog Creek at the USGS Gage 06847900 are indicative of a low flowing creek with brief periods of dryness and high flow runoff events. The average precipitation within the watershed ranges from 20.75 inches/year near Colby to 24.89 inches/year near Norton. Monthly average precipitation amounts are illustrated in Figure 6. The climate within the Prairie Dog Creek watershed is generally considered continental, with large daily and annual variations. This watershed is generally drier than many parts of the state since it lies “to the west of the flow of moisture-laden air from the Gulf of Mexico and to the east of the strong rain-shadow effects of the Rocky Mountains” (Bark, KAES). As a result, the area receives a great deal of precipitation in the form of thunderstorms, which will result in significant runoff. Consistent wind speeds are high in this area of the state, combined with drier periods significant soil loss can occur due to wind erosion. “Conservation practices are necessary to conserve moisture and prevent excessive soil loss” (Bark, KAES).
5
Figure 2. Flow duration curve for USGS gage 06847900 near station SC549 above Norton Lake.
Flow Duration Curve for USGS Gage 06847900 above Norton Lake
0.01
0.1
1
10
100
1000
0 10 20 30 40 50 60 70 80 90 100
% of Flow Exceedance
Flow
(cfs
)
Figure 3. Monthly average and median flows (1990-2010).
Prairie Dog Creek - Monthly Average and Median Flows at USGS Gage 06847900
0
5
10
15
20
25
Janu
ary
Februa
ryMarc
hApri
lMay
June Ju
ly
Augus
t
Septem
ber
Octobe
r
Novem
ber
Decem
ber
Month
Flow
(cfs
)
Avg Median
6
Figure 4. Annual average and median flows at USGS gage 6847900.
Annual Flow Summary for Prairie Dog Creek above Norton Lake at USGS Gage 06847900
Average Median Figure 5. Flow at USGS gage 06847900 above Norton Lake from 2006 to 2010, which illustrates sporadic inflow.
Prairie Dog Creek at USGS Gage 06847900 above Norton Lake from 2006-2010
0.01
0.1
1
10
100
1000
10000
1/1/
06
3/1/
06
5/1/
06
7/1/
06
9/1/
06
11/1
/06
1/1/
07
3/1/
07
5/1/
07
7/1/
07
9/1/
07
11/1
/07
1/1/
08
3/1/
08
5/1/
08
7/1/
08
9/1/
08
11/1
/08
1/1/
09
3/1/
09
5/1/
09
7/1/
09
9/1/
09
11/1
/09
1/1/
10
3/1/
10
5/1/
10
7/1/
10
9/1/
10
11/1
/10
Date
Flow
(cfs
)
7
Figure 6. Monthly average precipitation averages from weather.com.
Monthly Precipitation Averages within the Upper Prairie Dog Subwatershed
0
0.5
1
1.5
2
2.5
3
3.5
4
4.5
5
Janu
ary
Febr
uary
Mar
ch
Apr
il
May
June
July
Aug
ust
Sep
tem
ber
Oct
ober
Nov
embe
r
Dec
embe
r
Month
Prec
ipita
tion
(inch
es)
Colby Norton
Assessment Seasons: Seasonal variability has been accounted for in this TMDL and seasons were defined by the average monthly temperature within Prairie Dog Creek as illustrated in Figure 7. A three season approach was utilized to include: the Spring season consisting of the months of April, May and June; the Summer-Fall season consisting of the months of July, August, September, and October, and the Winter season that includes January, February, March, November, and December. Phosphorus Summary for the Upper Republican Basin: There are seven permanent KDHE stream sampling stations that are active in the Upper Republican basin. Three of these stations, SC225, SC226, and SC227 lie within ecoregion 25c: Western High Plains, Moderate Relief Rangeland. Stations and streams that lie within ecoregion 25c, have low concentrations of phosphorus. However, the other four stream chemistry stations within the basin (SC228, SC229, SC230, and SC549) lie within ecoregion 27b: Central Great Plains, Rolling Plains and Breaks and are all listed as impaired on the 2010-303(d) list for Total Phosphorus with median concentrations exceeding 0.2 mg/L. As seen in Table 2 and Figures 8 and 9, phosphorus concentrations observed at the KDHE stream chemistry sampling stations within the 27b ecoregion located in the Upper Republican Basin are significantly higher.
8
Figure 7. In-stream monthly average temperatures in Prairie Dog Creek at SC549.
Upper Prairie Dog Cr. - Average Monthly In-stream Temperatures at KDHE Station SC549
0
5
10
15
20
25Ja
nuar
y
Febr
uary
Mar
ch
Apr
il
May
June
July
Aug
ust
Sep
tem
ber
Oct
ober
Nov
embe
r
Dec
embe
r
Month
Deg
rees
Cel
sius
Winter
Spring Summer- Fall
Winter
Table 2. KDHE Stream Chemistry Station in the Upper Republican Basin with respective TP concentrations in mg/L.
Station Location Ecoregion Total P Avg Total P Median
Total P – 25%
Quartile
Total P – 75%
Quartile SC225 S. Fk Republican nr St.
Francis 25c 0.05 0.04 0.02 0.06
SC226
Arikaree R. 25c 0.14 0.1 0.05 0.21
SC227 S. Fk Rebulican nr Benkelman, NE
25c 0.07 0.05 0.04 0.10
SC228 Beaver Cr at Cedar Bluffs
27b 0.42 0.39 0.22 0.60
SC229 Sappa Cr nr Beaver City, NE
27b 0.66 0.65 0.38 0.83
SC230 Prairie Dog Cr nr Woodruff
27b 0.86 0.75 0.58 1.14
SC549 Prairie Dog Cr nr Dellvale
27b 0.41 0.33 0.18 0.55
Basin Avgs.
0.38 0.33 0.21 0.50
9
Figure 8. Boxplot of Phosphorus samples at KDHE Stream Chemistry sampling stations within the Upper Republican Basin with median line and mean symbol.
Figure 9.TP summary for combined data from stations in ecoregion 25c (S.F. Republican SC225, Arikaree R. SC226, and S.F Rebulican SC227) and Prairie Dog Creek SC549.
TP SC549TP 25c
1.0
0.8
0.6
0.4
0.2
0.0
Conc
entr
atio
n (m
g/L)
TP Summary for UR Stations in Ecoregion 25c and Upper P. Dog Cr
10
Ortho-phosphate (ortho-P), which is the portion of total phosphorus that is readily available for biological uptake and is soluble, is rarely detected in ecoregion 25b. However, ortho-P is detected in 54-87% of the samples associated with the four stations in ecoregion 27b within the Upper Republican basin. Ortho-P concentrations within the Upper Republican Basin are summarized in Table 3 and Figure 10. Table 3. Ortho-phosphate data summary for the Upper Republican Basin. Non-detect samples have been adjusted to half of the detection limit. Station Ortho-P Avg Ortho-P Median % of Ortho-P
Detections SC225 ND ND 0% SC226 0.06 0.02 21% SC227 0.035 0.02 17% SC228 0.158 0.12 75% SC229 0.313 0.285 68% SC230 0.420 0.40 87% SC549 0.230 0.16 55% Note – Laboratory detection limits for Ortho-phosphate are 0.02 from 1990-2002 and 0.25 mg/L from 2002-2010. Figure 10. Boxplot of raw (unadjusted) Ortho-phosphate samples within the Upper Republican Basin with individual samples delineated.
OP SC549OP SC230OP SC229OP SC228OP SC227OP SC226OP SC225
1.0
0.9
0.8
0.7
0.6
0.5
0.4
0.3
0.2
0.1
0.0
Ort
ho P
Con
cent
rati
on (
mg/
L)
Ortho P Concentration Summary for Upper Republican Basin
11
Phosphorus Condition for Prairie Dog Creek at Station SC549: Phosphorus concentrations within Prairie Dog Creek primarily vary based on season. The majority of the samples were collected during baseflow (26-75%) conditions, which is when total phosphorus (TP) concentration averages were the smallest of the three flow conditions. There is a poor relationship between seasonal TP concentrations and flow as seen in Figures 12 and 13. Variation between the TP concentrations observed during the high flow condition and the baseflow condition is only apparent during the summer-fall season. TP concentrations are the highest during the summer-fall season during high flow conditions. The low flow conditions are difficult to assess due to the lack of samples collected during this condition. KDHE attempted to sample station SC549 twelve times over the period of record during the low flow condition during the summer-fall season, of which samples were only obtained during five of the sampling events. In addition, for samples that were obtained during the low flow condition there was typically less than 0.25 cfs of flow according to the USGS gage information. Based on median phosphorus concentrations for the various flow conditions throughout the seasons the highest phosphorus concentrations are associated with high flow conditions during the summer-fall season. If we look strictly at seasonality, the median phosphorus concentrations are the highest during the spring and summer-fall seasons. Table 4 summarizes the TP average and median concentrations based on the flow condition and season. Table 4. Prairie Dog Creek TP average and median concentrations in mg/L based on season and flow conditions at Station SC549. Number of samples for each condition are noted in the seasonal average columns (n). Flow Condition (% Exceedance)
Spr Avg.
Sum-F Avg.
Spr Sum-F Combine
Avg
Wint Avg.
All Seasons
Avg
All Seasons Median
High (0-25%)
0.562 (8)
0.796 (8)
0.679 (16) 0.191 (7)
0.531 (23) 0.489
Base (26-75%)
0.512 (18)
0.398 (14)
0.462 (32) 0.179 (19)
0.356 (51) 0.286
Low (76-100%)
0.559 (3)
0.516 (4)
0.534 (7) 0.146 (3)
0.418 (10) 0.410
All Flow Conditions
0.531 (29)
0.538 (26)
0.534 (55) 0.178 (29)
0.411 (84) 0.325
All Flow Median
0.483 0.468 0.483 0.150 0.325
Spring = April, May, and June Summer-Fall= July, August, September, and October Winter = January, February, March, November, and December
12
The TP concentrations for the lower quartile, median and upper quartiles are very similar between the spring and summer-fall seasons as seen in Table 5 and Figure 11. Concentrations throughout the winter season are much lower and have less variability between the upper and lower quartile range. Table 5. Prairie Dog Creek TP summary based on season in mg/L. Season Avg. Q25 Median Q75 Max Min Spring 0.531 0.354 0.483 0.700 1.02 0.134 Sum-Fall 0.538 0.307 0.468 0.595 1.57 0.236
Spr, Sum-F Combined
0.534 0.31 0.483 0.68 1.57 0.134
Winter 0.178 0.117 0.150 0.177 0.753 0.028 All Seasons 0.411 0.17 0.325 0.55 1.57 0.028 Seasonal TP concentrations on Prairie Dog Creek at SC549 relative to flow conditions are displayed in Figures 12 and 13. Winter samples are consistent throughout all flow conditions and the Spring and Summer-Fall seasonal samples display similar responses to flow variation. Figure 11. Boxplot of SC549 TP data based on season and flow condition.
TP Low QTP Base QTP High QTP WinterTP Sum-FallTP SpringTPAll Data
1.6
1.4
1.2
1.0
0.8
0.6
0.4
0.2
0.0
TP C
once
ntra
tion
(m
g/l)
Prairie Dog Cr TP Summary by Season and Flow at SC549
13
Figure 12. Prairie Dog Creek seasonal TP concentrations relative to flow condition at SC549.
Upper Prairie Dog Cr - Seasonal TP Concentrations Relative to % of Flow Exceedance
0
0.25
0.5
0.75
1
1.25
1.5
1.75
2
0 10 20 30 40 50 60 70 80 90 100
% of Flow Exceedance
TP C
once
ntra
tion
(mg/
L)
Spring Sum-Fall Winter Figure 13. Seasonal TP concentrations at SC549 relative to flow.
Upper Prairie Dog Cr - Seasonal TP Concentrations Relative to Flow
0
0.2
0.4
0.6
0.8
1
1.2
1.4
1.6
1.8
2
0.01 0.1 1 10 100
Flow (cfs)
TP C
once
ntra
tion
(mg/
L)
Spring Sum-Fall Winter
14
Figure 14. Monthly average TP concentrations over the period of record at SC549.
Prairie Dog Cr - Monthly Average TP Concentrations at SC549
0
0.1
0.2
0.3
0.4
0.5
0.6
0.7
0.8
Janu
ary
Febr
uary
Mar
ch
Apr
il
May
June
July
Augu
st
Sep
tem
ber
Oct
ober
Nov
embe
r
Dec
embe
r
Month
Con
cent
ratio
n (m
g/L)
Figure 15. Average TP daily loads for each month based on average flow values and TP concentrations for each sampling event within each month.
Prairie Dog Creek - Monthly TP Average Daily Load
0
10
20
30
40
50
60
70
Janu
ary
Febr
uary
Mar
ch
April
May
June
July
Augu
st
Sept
embe
r
Oct
ober
Nov
embe
r
Dec
embe
r
Month
TP A
vera
ge D
aily
Loa
d (lb
s/da
y)
15
Figure 16. Annual cumulative TP Load for SC549.
Prairie Dog Creek - Cumulative Annual TP Load
0
1000
2000
3000
4000
5000
60001 12 23 34 45 56 67 78 89 100
111
122
133
144
155
166
177
188
199
210
221
232
243
254
265
276
287
298
309
320
331
342
353
364
Julian Day
TP L
oad
(lbs/
day)
As seen in Figure 14, the winter month concentrations are the lowest for each sampling year, which is followed by significant increases throughout the spring months. The maximum monthly concentration average is observed in July. Concentrations decline throughout the remainder of the summer-fall season into the winter season. The average TP daily loads based on month, as seen in Figure 15, are calculated with the monthly averages for daily flow and TP concentrations. July and August have the highest average daily flow and TP averages within Prairie Dog Creek and therefore account for the months with the highest average daily TP loads within the stream. The annual cumulative TP load based on the monthly average TP daily loads for Prairie Dog Creek is illustrated in Figure 16. The average monthly TP concentrations have generally increased as the average monthly precipitation increases within the watershed as seen in Figure 17.
16
Figure 17. Average Monthly TP Concentration relative to monthly rainfall averaged between Norton and Colby.
Upper Prairie Dog Creek Average Monthly Rainfall and TP Concentrations
0.1
1
10
Janu
ary
Februa
ryMarc
hApri
lMay
June Ju
ly
Augus
t
Septem
ber
Octobe
r
Novem
ber
Decem
ber
Month
TP (m
g/L)
and
Rai
nfal
l (in
ches
)
TP average Rainfall Avg. Ortho-P within Prairie Dog Creek is frequently detected in the spring and summer-fall season and typically not detected during the winter season. The current detection limit is high at 0.25 mg/L, which is most likely why ortho-P is not detected during the winter season since the TP detected concentrations during the winter are less than the ortho-P detection limit. As seen in Table 6 and Figure 18, Ortho-P generally accounts for around 62% of the TP concentration at SC549 based on the Ortho-P:TP ratio.
17
Table 6. Summary of Ortho-Phosphate concentrations based on season and flow condition at SC549 for all samples with Ortho-P analysis, averages include adjusted non-detect values. Condition % of Ortho-P
Winter 20% (4/20) 0.114 0.87 0.257 High Q 92% (12/13) 0.26 0.61 0.48 Base Q 41% (13/32) 0.18 0.73 0.45 Low Q 40% (4/10) 0.23 0.65 0.48 All Data 53% (29/55) 0.209 0.69 0.48 Figure 18. Average monthly TP and Ortho-P concentrations within Prairie Dog Creek. Non-detect Ortho-P samples were assigned a concentration of one half of the respective detection limit.
Prairie Dog Cr - Monthly Average TP and actual Ortho-P for SC549
0
0.1
0.2
0.3
0.4
0.5
0.6
0.7
0.8
Janu
ary
Febr
uary
Mar
ch
Apr
il
May
June
July
Aug
ust
Sep
tem
ber
Oct
ober
Nov
embe
r
Dec
embe
r
Month
Con
cent
ratio
n (m
g/L)
Total POrtho P
18
A regression equation is displayed in Figure 19, which illustrates a very strong relationship between Ortho-P and TP concentrations within Prairie Dog Creek for common samples where Ortho-P was detected above the detection limit. The regression formula was applied to all samples since Ortho-P was not collected for the entire period of record. Once each sample was assigned a calculated Ortho-P concentration based on the regression equation, the calculated Ortho-P portion of the TP was subtracted out to provide a net result of TP if Ortho-P loading was removed. A summary of the expected TP concentration based on flow and season when Ortho-P is removed is illustrated in Table 7. Since the spring and summer-fall season yielded similar values, these seasons were additionally combined. Figure 19. Ortho-P concentrations relative to TP concentrations for common samples in Prairie Dog Creek.
1.00.90.80.70.60.50.40.30.20.1
0.50
0.45
0.40
0.35
0.30
0.25
0.20
0.15
Total P (mg/L)
Ort
ho P
(m
g/L)
S 0.0453539R-Sq 82.3%R-Sq(adj) 81.6%
Prairie Dog Cr - Common Samples of Ortho P and Total P Regression OP = 0.07549 + 0.4227 TP
19
Table 7. Prairie Dog Creek presumed TP concentration at station SC549 if the regression based calculated Ortho-P concentration was removed (TP-Ortho-P). TP-Ortho-P Condition
Spring (mg/L)
Summer-Fall (mg/L)
Spring/Sum-Fall Combined
(mg/L)
Winter (mg/L)
All Seasons
Avg. 0.236 0.245 0.240 0.046 0.175 Median 0.207 0.218 0.213 0.027 0.110 High Q Avg 0.266 0.384 0.329 0.052 0.241 Base Q Avg 0.223 0.160 0.198 0.036 0.141 Low Q Avg 0.257 0.222 0.234 0.086 0.185 High Q Med 0.207 0.300 0.259 0.015 0.220 Base Q Med 0.208 0.103 0.183 0.025 0.099 Low Q Med 0.257 0.175 0.200 0.1 0.136 As Figure 20 indicates the actual Ortho-P concentrations were compared against the regression based calculated Ortho-P concentrations for sampling events that had Ortho-P analyzed. Samples obtained during the spring and summer-fall seasons have strong correlations. Samples for the winter season do not appear to correlate as well due to the high detection limit for Ortho-P for the actual observed Ortho-P concentrations. The regression based calculated Ortho-P concentrations prove to be a better estimate for the winter time Ortho-P concentrations and provide solid estimates for Ortho-P concentrations for the sampling events that did not have Ortho-P analyzed since KDHE did not consistently sample Ortho-P prior to the sampling year of 2000. Figure 20. Actual Ortho-P and calculated Ortho-P concentrations for common samples in Prairie Dog Creek at station SC549.
Prairie Dog Creek - Ortho-P Actual Concentrations vs. Calculated Regression based Ortho-P Concentrations at SC549
0
0.1
0.2
0.3
0.4
0.5
0.6
0 0.1 0.2 0.3 0.4 0.5 0.6
Regression Based Ortho P Concentrations (mg/L)
Ort
ho P
Con
c. (m
g/L)
Spring Sum-Fall Winter 1:1 Line
20
Figure 21. Regression based calculated Ortho-P concentrations relative to % of flow exceedance for all samples.
Prairie Dog Cr - SC549 Ortho P Seasonal Calculated Concentrations
0
0.1
0.2
0.3
0.4
0.5
0.6
0.7
0.8
0 10 20 30 40 50 60 70 80 90 100
% of Flow Exceedance
Con
cent
ratio
n (m
g/L)
SpringSummer-FallWinter
Figure 22. Upper Prairie Dog Cr monthly average calculated Ortho-P and sediment bound phosphorus concentrations.
SC549 - Monthly Average Calculated Ortho P v. Sediment Bound P
0
0.05
0.1
0.15
0.2
0.25
0.3
0.35
0.4
0.45
Janu
ary
Febr
uary
Mar
ch
Apr
il
May
June
July
Augu
st
Sept
embe
r
Oct
ober
Nov
embe
r
Dec
embe
r
Con
cent
ratio
n (m
g/L)
Ortho P Sediment Bound P
21
The calculated Ortho-P concentrations based on the aforementioned regression calculation for each sample is plotted based on the flow condition as seen in Figure 21. Figure 22 illustrates the comparison between the average monthly calculated Ortho-P concentrations and the phosphorus that is likely bound to the sediment. The sediment bound phosphorus is simply the difference between the Total Phosphorus and the Ortho-P Concentrations. Other Relationships: Within Prairie Dog Creek there is a positive relationship between TP and both total suspended solids (TSS) and total organic carbon (TOC) during the spring and summer-fall seasons as seen in Figures 23 and 24. The positive relationship between TP and TSS is expected as phosphorus is typically bound to sediment particles. Strong TP and TSS relationships reflect nonpoint source loadings, whereas point source loadings would tend not to show any relationships at the low flow condition. There is a negative relationship between TP and dissolved oxygen (DO) as seen in Figure 25. Generally during the winter, DO concentrations are higher as TP concentrations and temperatures are lower. The lowest DO concentration detections occurred in the summer-fall season, when higher stream temperatures and lower flows are prevalent. There appear to be three main factors influencing TP concentration in the Prairie Dog Creek above Norton Lake. The first is the effect of the City of Colby’s wastewater on downstream hydrology and nutrient content. The second influence is nonpoint sources in proximity to Norton Lake and stream sampling station SC549 that contribute direct loadings during baseflow or dry weather conditions, particulary since the wastewater load does not flow this far downstream during dry conditions. The final influence is wet weather sources that dominate loading during runoff events.
22
Figure 23. Seasonal relationship between TP and TSS at SC549.
Prairie Dog Cr at SC549 - TP vs. TSS
0
0.2
0.4
0.6
0.8
1
1.2
1.4
1.6
1 10 100 1000
TSS Concentration (mg/L)
TP C
once
ntra
tion
(mg/
L)
SpringSummer-FallWinter
Figure 24. Seasonal relationship between TP and Total Organic Carbon (TOC) at station SC549 for common samples.
Prairie Dog Cr at SC549 - TP vs. TOC
0
0.2
0.4
0.6
0.8
1
1.2
0 2 4 6 8 10 12 14 16
TOC Concentration (mg/L)
TP C
once
ntra
tion
(mg/
L)
SpringSum-FWint
23
Figure 25. Seasonal relationship between TP and DO at station SC549.
Prairie Dog Cr at SC549 - DO vs. TP
0
1
2
3
4
5
6
7
8
9
10
11
12
13
14
15
16
17
18
19
20
0 0.2 0.4 0.6 0.8 1 1.2
TP Concentration (mg/L)
DO
Con
cent
ratio
n (m
g/L)
SpringSummer-FallWinter
Relationship between Phosphorus and Biological Indicators: The narrative criteria of the Kansas Water Quality Standards are based on indications of the prevailing biological community. Excessive primary productivity may be indicated by extreme stream swings in dissolved oxygen or pH as the chemical reactions of photosynthesis and respiration alter the ambient levels of oxygen or acid-base balance of the stream. The relationship between pH and stream temperature is illustrated in Figure 26, which indicates that elevated pH values were observed during a wide range of cooler to moderate stream temperatures. Figure 27 illustrates the relationship between stream pH and the TP concentrations. Generally, the TP concentrations were less than the average concentration when pH values were elevated. On Prairie Dog Creek, dissolved oxygen tends to swing inversely to the ambient temperature of the stream as seen in Figure 28. The seasonal pattern is also apparent in Figure 29, which details the monthly average DO concentrations and temperature at SC549. Higher pH values tend to occur during higher photosynthesis periods. Levels of pH at SC549 have exceeded the pH criterion of 8.5 on five samples, with the last exceedance occurring in 1999 as seen in Figure 30. The average pH at SC549 is 7.95, well within the range of criteria for Kansas waters.
24
Figure 26. Relationship between pH and temperature at SC549.
SC549 - pH vs. Temperature
5
5.5
6
6.5
7
7.5
8
8.5
9
9.5
10
0 5 10 15 20 25 30
Temperature (C)
pH
Figure 27. Relationship between pH and TP at SC549.
SC549 - pH vs. TP
5
5.5
6
6.5
7
7.5
8
8.5
9
9.5
10
0 0.1 0.2 0.3 0.4 0.5 0.6 0.7 0.8 0.9 1 1.1 1.2
TP (mg/L)
pH Series1
25
Figure 28. DO concentrations relative to Temperature over time at SC549.
Prairie Dog Cr SC549 - DO and Temp over time
0
5
10
15
20
25
30
Mar-90
Mar-91
Mar-92
Mar-93
Mar-94
Mar-95
Mar-96
Mar-97
Mar-98
Mar-99
Mar-00
Mar-01
Mar-02
Mar-03
Mar-04
Mar-05
Mar-06
Mar-07
Mar-08
Sampling Date
DO
in m
g/l a
nd T
emp
in d
eg C
Temp Dissolved Oxygen Figure 29. Monthly average DO concentrations relative to Temperature at SC549.
Prairie Dog Creek - SC549 Monthly Averages
0
5
10
15
20
25
Janu
ary
Februa
ryMarc
hApri
lMay
June Ju
ly
Augus
t
Septem
ber
Octobe
r
Novem
ber
Decem
ber
Month
DO
in m
g/l a
nd T
emp
in D
eg C
Dissolved Oxygen (mg/L) Temperature C
26
Figure 30. Prairie Dog Creek pH Levels since 1990.
SC549 - pH over Time
66.2
6.46.66.8
7
7.27.47.67.8
88.28.48.6
8.89
9.29.4
9.69.8
Mar
-90
Mar
-91
Mar
-92
Mar
-93
Mar
-94
Mar
-95
Mar
-96
Mar
-97
Mar
-98
Mar
-99
Mar
-00
Mar
-01
Mar
-02
Mar
-03
Mar
-04
Mar
-05
Mar
-06
Mar
-07
Mar
-08
Mar
-09
Mar
-10
Date
pH
SC549 Current EPA philosophy is predicated on the lowest quartile of stream total phosphorus within an ecoregion as indicative of minimum impact conditions (in the absence of reference streams). This generalization is not tied to specific biological conditions, but represents water quality protection policy guiding EPA’s administration of clean water programs. Figure 31 displays the relationship between lower quartile phosphorus values and Macroinvertebrate Biotic Index (MBI) scores for streams within the four Level IV ecoregions within the Central Great Plains ecoregion of Kansas. Prairie Dog Creek resides largely within ecoregion 27b, the Rolling Breaks and Hills area. Low MBI scores are indicative of high quality biological communities. Kansas protocol has been to delineate the boundaries between full and partial aquatic life support and between partial support and nonsupport as MBI scores of 4.5 and 5.4, respectively. The data of Figure 31, compiled by Region VII of EPA, does not show a definite relationship between the suggested EPA criteria and associated biological use. Conditions of full support span phosphorus levels of 0.070 to 0.160 mg/l. Partial support is indicated on streams with phosphorus levels of 0.020-0.430 mg/L. Apparently, other factors impact the biological community of macroinvertebrates beyond the ambient nutrient levels present in those Central Kansas streams.
27
Figure 31. Lower Quartile Phosphorus Levels and MBI Scores for the Central Great Plains
. A similar pattern emerges if an index of the selected families of water quality sensitive macroinvertebrates is used as the indicator of biological health. Figure 32 shows the lower quartile phosphorus levels versus the percent of individuals comprising Ephemeroptera [mayflies], Plecoptera [stoneflies], and Trichoptera [caddisflies] (EPT). EPT percentages over 48% are viewed as signs of fully supporting environment for aquatic life, while percentages below 30% are deemed non-supportive. Once again, streams in the Central Great Plains show some resilience to higher phosphorus levels impacting clean water species. Identification of a specific threshold of phosphorus concentration is difficult to tie to desired biological conditions.
28
Figure 32. Phosphorus Levels and EPT Scores for Streams in the Central Great Plains.
Current Condition of Norton Lake: Norton (Keith Sebelius) Lake is a Public Water Supply reservoir serving the City of Norton. A eutrophication TMDL for the lake was approved on August 3, 2003. Chlorophyll a averaged 17.0 ppb prior to 2003 and 14.5 ppb in the three sampling events since 2003. The most recent sampling event in 2010 had a chl-a concentration of 18.0 µg/L as seen in Figure 33.
29
Figure 33. Norton Lake chlorophyll a concentrations for sampling years.
Norton Lake - Chlorophyll a Concentrations for the Main Basin
0
5
10
15
20
25
3019
86
1989
1992
1995
1998
2001
2004
2007
2010
Year
Chl
-a (u
g/L)
2003 - Eutrophication
TMDL Approved
The average secchi depth for Norton Lake is 0.975 meters. At the surface, TN averages 1.34 mg/L, TP averages 0.115 mg/ and Ortho-P is generally below the detection limit and estimated to average 0.056 mg/L. The total phosphorus concentration has ranged from a low of 0.043 mg/L in 1998 to a high in 2010 of 0.197 mg/L. The TN concentration over the period of record is primarily influenced by the Kjedahl Nitrogen content, which averages 1.28 mg/L. Data for calculating TN is not available prior to the 1992 sampling event. At the bottom of the lake, TN averages 1.27 mg/L, TP averages 0.210 mg/L and Ortho-P is generally below the detection limit but is estimated to average 0.13 mg/L. A summary of the lake data is detailed for each sampling event in Table 8. The ratio of total nitrogen and total phosphorus is a common ratio utilized to determine which of these nutrients is likely limiting plant growth in Kansas aquatic ecosystems. Typically, lakes that are nitrogen limited have a water column TN:TP ratio < 8 (mass); lakes that are co-limited by nitrogen and phosphorus have a TN:TP ratios between 9 and 21; and lakes that are P limited have a water column TN:TP ratio > 29 (Dzialowski et al., 2005). Norton Lake is consistently found to be co-limited by nitrogen and phosphorus.
30
Table 8. Data summary for Norton Lake over the period of record for KDHE samples. Sample Date
Chla (µg/L)
TKN (mg/L)
TN (mg/L)
TP (mg/L)
TN:TP ratio
Secchi Depth
(m)
DO (mg/L)
pH
7/29/1986 17.15 0.09 7.26 8.4 6/28/1989 16.95 0.085 0.45 8.46 8.4 7/8/1992 25.9 1.5 1.5 0.145 10.35 6.5 8.05 6/6/1995 5.15 2.07 2.14 0.13 16.42 1.5 7.2 8.22 7/13/1998 12.7 0.83 0.94 0.043 22.02 0.89 6.46 7.52 8/7/2001 16.75 0.94 0.97 0.082 11.88 1.15 5.02 8.30 6/15/2004 17.1 1.49 1.56 0.123 12.68 0.6 6.7 8.07 6/25/2007 8.4 1.18 1.25 0.139 9.04 0.79 7.16 8.31 8/16/2010 17.95 0.94 1.02 0.197 5.15 1.45 5 7.91 Average 15.34 1.28 1.34 0.115 12.5 0.98 6.64 8.13 Table 9 lists six metrics measuring the roles of light and nutrients in Norton Lake. Non-algal turbidity (NAT) values < 0.4 m-1 indicates there are very low levels of suspended silt and/or clay. The values between 0.4 and 1.0m-1 indicate inorganic turbidity assumes greater influence on water clarity but would not assume a significant limiting role until values exceed 1.0m-1. Table 9. Limiting factor determinations for Norton Lake.
The depth of the mixed layer in meters (Z) multiplied by the NAT value assesses light availability in the mixed layer. There is abundant light within the mixed layer of the lake and potentially a high response by algae to nutrient inputs when this value is < 3. Values greater than six would indicate the opposite. The partitioning of light extinction between algae and non-algal turbidity is expressed as Chl-a*SD (Chlorophyll a * Secchi Depth). Inorganic turbidity is not responsible for light extinction in the water column and there is a strong algal response to changes in nutrient
31
levels when this value is > 16. Values < 6 indicate that inorganic turbidity is primarily responsible for light extinction in the water column and there is a weak algal response to changes in nutrient levels. Values of algal use of phosphorus supply (Chl-a/TP) that are greater than 0.4 indicate a strong algal response to changes in phosphorus levels, where values < 0.13 indicate a limited response by algae to phosphorus. The light availability in the mixed layer for a given surface light is represented as Zmix/SD. Values < 3 indicate that light availability is high in the mixed zone and there is a high probability of strong algal responses to changes in nutrient levels. Shading values less than 16 indicate that self-shading of algae does not significantly impede productivity. This metric is most applicable to lakes with maximum depths of less than 5 meters (Lake and Westland Monitoring Program 2004 Annual Report). The above metrics conclude that Norton Lake has the following characteristics: inorganic turbidity influences water clarity and contributes to light extinction in the water column with low to moderate responses to changes in nutrient levels, there is moderate light in the mixed layer and a moderate response by algae to nutrient inputs, there is generally a moderately low response by algae to phosphorus; and self-shading of algae does not significantly impede productivity. According to these metrics, Norton Lake is co-limited by phosphorus, nitrogen and light. Another method for evaluating limiting factors is the TSI deviation metrics. Figure 34 (Multivariate Figure) summarizes the current trophic conditions at Norton Lake using a multivariate TSI comparison chart for data obtained by KDHE throughout the period of record. Where TSI(Chl-a) is greater than TSI(TP), the situation indicates phosphorus is limiting chlorophyll a, whereas negative values indicate turbidity limits chlorophyll a. Where TSI(Chl-a)-TSI(SD) is plotted on the horizontal axis, if the Secchi Depth (SD) trophic index is less than the chlorophyll a trophic index, than there is dominant zooplankton grazing. Transparency would be dominated by non-algal factors such as color or inorganic turbidity if the secchi depth index were more than the chlorophyll a index. Points near the diagonal line occur in turbid situations where phosphorus is bound to clay particles and therefore turbidity values are closely associated with phosphorus concentrations. For the years plotted in Figure 34, Norton Lake generally has a surplus of phosphorus and is limited by light and turbidity. Nitrogen also becomes limiting within the lake.
32
Figure 34. Multivariate TSI comparison chart for Norton Lake.
Algal Community Structure: As seen in Table 10, the total cell counts of the algal community in Norton Lake are composed mainly of green or blue-green algae, depending on the year. For the two sampling years where chlorophyll a concentrations were below 10 µg/L, there were no blue-green (cyanobacteria) algae present and these years had low total cell counts relative to the other sampling years. An increasing supply of nutrients, especially phosphorus and possibly nitrogen, will often result in higher growth of blue-green algae because they possess certain adaptations that enable them to out-compete true algae (Soil and Water Conservation Society of Metro Halifax, 2007). Several of the cyanobacteria species possess gas vacuoles that allow them to move within the water column vertically. This selective advantage allows for some species to move within the water column to avoid predation and reach optimal primary productivity. Their movement within the water column may influence chlorophyll a levels within the lake at various depths during the diel cycle.
33
Table 10. Algal Communities observed in the Norton Lake
Percent Composition Sampling Date Total Cell Count
Table 11 summarizes median trophic conditions within Norton Lake in relation to other federal lakes in the state. The median trophic indicator values within Norton Lake do not meet or exceed any of the statewide benchmarks for any of the indicators. Relative to the other Federal Lakes in Kansas, Norton Lake has poor clarity and high levels of nutrients. Table 11. Median trophic indicator values of Norton Lake in comparison with other federal lakes and draft lake nutrient benchmarks in Kansas. The nutrient benchmarks were derived from 47-58 lakes and reservoirs, based on the data collected between 1985-2002. Trophic Indicator
Desired Endpoint: The ultimate endpoint of this TMDL will be to achieve the Kansas Water Quality Standards by eliminating any of the impacts to aquatic life, domestic water supply or recreation associated with excessive phosphorus and objectionable amounts of algae as described in the narrative criteria pertaining to nutrients. There are no existing numeric phosphorus criteria currently for streams or lakes in Kansas. However, KDHE is adopting a chlorophyll a criterion of 0.01 mg/L for reservoirs that serve as a public water supply. The current EPA suggested benchmarks for stream TP in the South-Central Cultivated Great Plains ecoregion is 0.067 mg/L TP over the 10-state aggregate of Level III ecoregions. For lakes, the suggested benchmarks are 0.033 mg/L for phosphorus and 0.0023 mg/L for chlorophyll a. Similar TP benchmarks for Central Great Plains streams and lakes are 0.090 mg/L and 0.032 mg/L, respectively, spanning from Nebraska to Texas. Chlorophyll benchmarks are 0.0058 mg/L for Central Great Plains lakes and reservoirs.
34
Prairie Dog Creek and Norton Lake reside in the 27b ecoregion, the Rolling Plains and Breaks. This area exhibits differences in stream-aquifer interaction, topography, land use and geology from the other three Central Great Plains ecoregions in Kansas. The differences are more striking when looking at the thickness of loess, presence of wetlands and braided streams in Central Nebraska, the Rainwater Basin and the Platte River Valley. Comparable analysis of data from 2000-2010 and restricted to the Kansas stations in the Central Great Plains indicates the lower quartile value of median TP from 113 stations is 0.132 mg/l TP. The lower quartile and median sestonic chlorophyll a from 13 KDHE stations in the Kansas portion of the Central Great Plains is 3.7 and 12 µg/L, respectively. Two metrics will serve to establish if the biological community of upper Prairie Dog Creek reflects recovery, renewed diversity and minimal disruption by the impacts described in the narrative criteria for nutrient on aquatic life, recreation and domestic water supply.
1. Macroinvertebrate Biotic Index (MBI): A statistical measure that evaluates the effects of nutrients and oxygen demanding substances on macroinvertebrates based on the relative abundance of certain indicator taxa (orders and families): for Kansas, MBI values below 4.5 are indicative of fully supported aquatic life communities.
2. Ephermeroptera, Plecoptera and Trichoptera (EPT) abundance as a percentage of the total abundance of macroinvertebrates; for Kansas, EPT percentages over 48% are indicative of fully supported aquatic life communities.
The two endpoints have to initially be maintained over three consecutive years to constitute full support of the designated uses of Prairie Dog Creek. After standards are attained, simultaneous digression of these endpoints more than once every three years, on average, constitutes a resumption of impaired conditions. For Norton Lake, the desired endpoint will be to maintain summer chlorophyll a concentrations below 10 µg/L, with the reductions focused on total nitrogen and total phosphorus, of which the focus is on reducing ortho-phosphate loadings entering the lake. The chlorophyll a endpoint of 10 µg/L is the statewide goal for lakes serving as Public Water Supplies, which will also ensure long-term protection to fully support Primary Contact Recreation within the lake. This will be the initial objective of the TMDL. Attainment in the lake will be followed by assessment of stream biology. Based on the BATHTUB reservoir eutrophication model (see Appendix A), the total phosphorus concentrations entering the lake must be reduced by 76%, and the total nitrogen concentrations entering the lake must be reduced by 45%. Within the total phosphorus reductions, the primary reductions will focus on reducing the ortho-phosphate concentrations entering the lake by 99%. The TP inflow concentrations set in the BATHTUB model correlate to the TMDL concentrations set for Prairie Dog Creek at station SC549 (0.130 mg/L). The resulting total phosphorus and total nitrogen
35
concentration at the KDHE sampling point in the main basin of the lake will be reduced by 61% and 23% respectively based on the BATHTUB output results. Achievement of the endpoints indicates loads are within the loading capacity of the lake, the water quality standards are attained, and full support of the designated uses of the lake has been achieved. Seasonal variation has been incorporated in this TMDL since the peaks of algal growth occur in the summer months and implementation will focus on load reductions during the spring and summer. The established endpoints will be evaluated periodically as phosphorus levels decline in Prairie Dog Creek over time. This TMDL looks to establish management goals for phosphorus concentration in Prairie Dog Creek that would support the biological conditions of the creek. In time, median phosphorus concentrations on Prairie Dog Creek should approach the desired benchmark (0.130 mg/L). At this milestone, another evaluation of the biological indicators should be made, and if the two indicators are indicative of fully supporting the biological integrity of Prairie Dog Creek, the new ambient phosphorus concentrations should be established as numeric criteria to protect the improved conditions from deteriorating. Table 12. Current Conditions and Reduction for Prairie Dog Creek entering Norton Lake based on BATHTUB Modeling. Lake Inflow Current Avg.
Condition TMDL Percent Reduction
Available Phosphorus Annual Load (lbs/year)
11,912 870.6 93%
Available Total Daily Load (lb/day)*
76.0 5.56 93%
Phosphorus Concentration (mg/L)
0.534 0.130 76%
Ortho-phosphate Concentration (mg/L)
0.300 0.001 99%
Available Nitrogen Annual Load (lbs/year)
27,188 16,283 40%
Available Nitrogen Daily Load (lbs/day)*
141.5 84.76 40%
Nitrogen Concentration (mg/L)
1.5 0.825 45%
* - See Appendix B for daily load calculations.
36
The current average condition and the TMDL, based on the BATHTUB modeling results, are detailed in Table 12. Table 13 details the current average lake concentrations and the resulting predicted lake concentrations once the endpoint is achieved as determined by BATHTUB. Table 13. Current Conditions and translating reductions and concentrations with TMDL in place for the main basin of Norton Lake based on BATHTUB output (see appendix A). Main Basin Concentrations
Current Avg. Condition
TMDL Estimated Concentration (BATHTUB)
Percent Reduction
Total Phosphorus Concentration (mg/L)
0.115 0.045 61 %
Total Nitrogen Concentration (mg/L)
1.339 1.027 23%
Chlorophyll a (µg/L)
15.3 9.4 39%
Secchi Depth (m) 0.98 1.1 3. SOURCE INVENTORY AND ASSESSMENT Point Sources: There are seven NPDES permitted facilities within the Prairie Dog Creek watershed above Norton Lake, which are detailed in Table 14 . Of these facilities, the City of Colby’s wastewater treatment facility is the only discharging NPDES point source within the watershed. The City of Colby has recently brought a new plant online, which began operating around the beginning of September in 2008. The old Colby wastewater treatment plant was permitted to discharge to Prairie Dog Creek out of their three-cell holding lagoon. However, the city did not report any discharge to Prairie Dog Creek for the duration of the most recent permit associated with this plant (since October 1, 2006). The permit associated with the old facility states: “This facility is normally operated as non-discharging, with all effluent flows being directed to the storage lagoon system for crop irrigation.” The new City of Colby wastewater treatment facility is designed to provide reclaimed irrigation water to recreational fields within the city. The plant will discharge to an unnamed tributary that flows into Prairie Dog Creek when the reuse of the discharge is not being utilized for irrigation purposes, which is expected during the winter months when irrigation demand is low. There are permit limits and/or monitoring requirements associated with the discharge for Biological Oxygen Demand (BOD), Total Suspended Solids (TSS), pH, Ammonia, Fecal Coliform, E. Coli, Total Phosphorus, Total Kjeldahl Nitrogen, Nitrate, Nitrite, Total Nitrogen, and Flow. The permit states:
37
The new wastewater treatment facility will have the capability for nutrient removal. The permittee will operate the treatment facility to maximize the level of nutrient removal with the goal of achieving the following target effluent levels:
a. Total Nitrogen < 8.0 mg/L as an annual average. b. Total Phosphorus < 1.5 mg/L as an annual average.
The non-overflowing permitted facilities are prohibited from discharging and may contribute a nutrient load under extreme precipitation or flooding events. Such events would not occur at a frequency or for duration sufficient to cause impairment in the watershed. Table 14. NPDES permitted facilities within the Prairie Dog Creek watershed.
A watershed survey was conducted by KDHE staff on August 23, 2011. Prairie Dog Creek was dry throughout the upper portions of the watershed as seen in Photos 1, 2, and 3. Sustained stream flow was first encountered at Clayton as seen in Photo 4. The ephemeral flows in the upper portions of Prairie Dog Creek watershed do not allow for the effluent from the Colby wastewater treatment plant to reach the KDHE sampling station during baseflow or low flow conditions.
38
Photo#1: East of Colby, KS downstream of treatment plant outfall. Prairie Dog Creek channel is mowed in places and dry.
Photo #2: Hwy 83 Bridge South of Oberlin and North of Seldon. Prairie Dog Creek is dry with a vegetated stream channel with livestock crossing in stream channel under bridge.
39
Photo #3: North of Dresden, KS. Farm crossing in stream channel with pipe. Stream bed is dry.
Photo #4: Prairie Dog Creek at Clayton, KS. Sustained flows are achieved.
40
Livestock and Waste Management Systems: There are fourteen certified or permitted confined animal feeding operations (CAFOs) within the Prairie Dog Creek watershed, as detailed in Table 15. All of these livestock facilities have waste management systems designed to minimize runoff entering their operation and detain runoff emanating from their facilities. These facilities are designed to retain a 25-year, 24-hour rainfall/runoff event as well as an anticipated two weeks of normal wastewater from their operations. Typically, this rainfall event coincides with streamflow that occurs less than 1-5% of the time. Though the total potential number of animals is approximately 28,500 head in the watershed, the actual number of animals at the feedlot operations is typically less than the allowable permitted number. According to the National Agricultural Statistics Service, there are 68,000 head of cattle in Decatur County, with a grazing density of 76 head/square mile or 0.11 head/acre. Table 15. CAFOs within the Prairie Dog Creek watershed above Norton lake. Permit # Type Animal Total Units Wasteload
Allocation (lbs/day) A-URTH-C002 Beef 4600 0 A-URTH-C004 Beef 2500 0 A-URTH-BA04 Beef 1000 0 A-URTH-SA01 Swine 500 0 A-URDC-BA08 Beef 800 0 A-URDC-B007 Beef 500 0 A-URDC-SA01 Swine 800 0 A-URNT-C003 Beef 1000 0 A-URNT-B002 Beef 999 0 A-URNT-B004 Beef 999 0 A-URNT-BA03 Beef 150 0 A-URNT-H002 Swine 12000 0 A-URNT-S008 Swine 758 0 A-URNT-S009 Swine 500 0 Based on the watershed survey conducted by KDHE, smaller livestock operations located directly adjacent to Prairie Dog Creek or the contributing ephemeral tributaries in the Prairie Dog Creek watershed may contribute significant nutrients, particularly during runoff events. In addition, there is evidence of winter feeding operations located along Prairie Dog Creek that are likely significant nutrient sources. Land Use: As illustrated in Figure 35 and Table 16 the predominant land use in the Prairie Dog Creek watershed is cultivated cropland and grassland, which accounts for 63% and 31% of the watershed respectively according to the 2001 National Land Cover Data set. Together these account for 94% of the total land in the watershed.
41
Table 16. General Land Use acres in the Prairie Dog Creek watershed. General Land Use Class Area (acres) Percent of Watershed Cultivated Crops 282089 63.5% Grassland 139942 31.5% Developed 16967 3.82% Wetlands 2842 0.64% Open Water 2152 0.49% Forest 216 0.05% Figure 35. Landuse map for Prairie Dog Creek watershed above Norton Lake.
Population Density: According to the 2000 census data from the U.S. Census Bureau, the population of the entire watershed is approximately 7,811 people, and therefore the population density for the watershed is approximately 12.2 people/square mile, with about 70% of the population residing within Colby, KS. Urban areas within the watershed include the Cities of Colby, Dresden, Clayton, Jennings, Norcatur, Leoville, and Selden. Population trends for these cities are declining as noted in Table 17.
42
Table 17. Population trends for urban areas within the Prairie Dog Creek watershed. Town Population 2000
(U.S. Census) Population 2010 (U.S. Census)
Colby 5450 5387 Dresden 51 41 Clayton 66 59 Jennings 146 96 Norcatur 169 151 Selden 201 219 On-Site Waste Systems: Based on the 1990 census data, about 33% of the households in Decatur County and 29% of the households in Norton County utilize septic systems. The households within the watershed that are not served by the sewer systems associated with the cities possessing a NPDES permit are presumably on septic systems. Though they are not likely to contribute significantly to the nutrient impairment within Prairie Dog Creek, failing on-site septic systems can contribute significant nutrient loadings within the watershed. Contributing Runoff: Soil permeability values across the watershed, based on the NRCS STATSGO database indicate over 98% of the watershed has a soil permeability of 1.29 inches/hour, which contributes to runoff during low rainfall intensity events. According to a USGS open-file report (Juracek, 2000), the threshold soil-permeability values are set at 3.43 inches/hour for very high, 2.86 inches/hour for high, 2.29 inches/hour for moderate, 1.71 inches/hour for low, 1.14 inches/hour for very low, and 0.57 inches/hour for extremely low soil-permeability. Runoff is primarily generated as infiltration excess with rainfall intensities greater than soil permeability. As the watersheds’ soil profiles become saturated, excess overland flow is produced. Water Diversions: Irrigation is the leading use for water in the watershed. According to the WIMAS database there are 844 points of diversion in Thomas County, with authorizations for 209,330 acre-feet of groundwater for all uses, with 204,846 acre-feet authorized for irrigation. There are no surface water allocations in Thomas County. Decatur County has a total of 289 points of diversion with 25,904 total acre-feet authorized, of which 24,137 acre-feet is for irrigation. There are 54 acre-feet of surface water authorized in Decatur County. Norton County has 415 points of diversion with a total of 35,057 acre-feet authorized, with 31,788 acre-feet of the total being utilized for irrigation. There are 13,580 acre-feet authorized from surface waters within Norton County. Background Levels: Phosphorus is naturally found in rocks, soil and organic material and is essential for the growth of aquatic and terrestrial vegetation, to include agricultural crops. The natural erosion of soil contributes to the amount of background phosphorus within the watershed that becomes available as nutrients to the ecosystem. However, erosion that may be facilitated by human activities and practices may cause excess runoff and streambank erosion, which contributes to an excess of readily available inorganic
43
phosphorus (ortho phosphorus) and high levels of suspended phosphorus-bound streambed sediment during runoff events. Land use changes such as the removal of riparian forests and wetlands, streambank erosion, urbanization, and agricultural activities, to include manure application to cropland, may significantly affect the levels of total phosphorus in aquatic systems. The typical levels of phosphorus within some streams have been significantly increased due to human activities and land use changes and practices within Kansas, and therefore it is difficult to determine what the actual background phosphorus concentrations within the watershed are expected to be. Background nitrogen loading may be associated with natural biogeochemical transformations. The nitrogen contributions may be associated with soils, wildlife, streamside vegetation or steambed sediment. These background nitrogen levels should result in minimal loading to the watershed. 4. ALLOCATION OF POLLUTANT REDUCTION RESPONSIBILITY Point Source: The current Wasteload Allocation (WLA) is associated with the City of Colby’s new wastewater treatment plant. Since this is a new facility there are nutrient goals established within the NPDES permit that KDHE expects the facility to meet. Based on the available discharge data (09/2008 – 02/2011) the facility is discharging regularly and averaging 0.56 MGD of discharge with an average TP concentration of 3.3 mg/L and average TN concentration of 18.45 mg/L. The treated wastewater will be utilized for irrigation purposes for extended periods of the year as it is utilized for watering the golf course and ball fields in the city and thus it is anticipated that the discharge leaving the plant will be intermittent during the warmer months. If the instream endpoint is to cut the current TP value of 0.31 mg/l by more than half, the reduction in average TP from Colby through BNR from 3.3 mg/L to 1.5 mg/L should accomplish much of the instream goal. The WLA for the City of Colby is set based on an effluent concentration of 1.5 mg/L of TP and 8.0 mg/L of TN at the design flow of 1.0 MGD, based on an annual average. Hence the assigned WLA for the City of Colby is 12.5 lbs/day for TP and 66.5 lbs/day for TN. The discharging concentrations associated with the WLA account for a 55% reduction in the TP and a 57% reduction in the TN concentrations in the effluent. There are over a hundred stream miles between the discharge point and stream monitoring station SC549, therefore the WLA reaching Norton Lake will be much less than the allocations because of adsorption to sediments and absorption by biota. In addition there are hydrology components that limit the WLA delivery to the lake to include impoundments and recurrent dry conditions that contribute to periods of no flow in the stream. The assimilated WLA, which is essentially 0 lbs/day under normal flow conditions, has been combined with the load allocation to establish a total allocation since the WLA is not a known value at the monitoring station. Under extremely high flow events the WLA may likely make it to the monitoring station and the WLA is accounted for within the Total Allocation. However, the high incidence of Ortho-P being detected at SC549 indicates some wastewater may be influencing the nutrient levels on the lower reaches of Prairie Dog Creek. Though this is likely not the case since the majority of the samples utilized to identify the impairment at SC549 were
44
collected when the old Colby WWTP was in operation, when there was typically no discharge from the facility. Therefore the main focus for this TMDL will be nonpoint sources since point sources historically had no contribution to the elevated concentrations seen at SC549. Additional assessment and monitoring of the new Colby plant is necessary to better understand the load contributions associated with Colby’s new plant, and determine if additional treatment beyond BNR will be necessary to achieve stream and lake endpoints. In addition, to ensure this TMDL is met and the biological conditions are adequate throughout all segments of Prairie Dog Creek an additional biological monitoring station in the upper reaches of the watershed below the Colby outfall is necessary. If the biological information indicates the impacts from the Colby effluent are still occurring after the necessary reductions to their effluent nutrient loads established in this TMDL then enhanced nutrient removal and/or irrigation of the wastewater to limit the discharge to the creek will be necessary to meet this TMDL. If subsequent assessment indicates that reduced nutrient wasteloads from Colby are not assimilated to the degree expected by this TMDL or the response of Norton Lake or upper Prairie Dog Creek is not sufficient to attain full support of applicable narrative water quality standards, additional wastewater treatment or alternative disposal of effluent at Colby will need to be considered to further reduce nutrient wasteloads arriving at SC549. Employing enhanced nutrient removal to Colby wastewater reduces the expected goals to annual averages of 0.5 mg/L TP and 5 mg/L TN. The resulting design flow WLA would then be 4.2 lbs/day of TP and 42 lbs/day of TN. All other NPDES permitted facilities and the CAFOs within the watershed have been assigned a Wasteload Allocation of zero since these facilities should not discharge to receiving streams within the watershed during typical hydrologic conditions. Ongoing inspections and monitoring of these facilities should be made to ensure that a 25-year, 24-hour precipitation event does not result in significant pollutant loadings. Nonpoint Sources: The Load Allocation (LA) assigns responsibility for nonpoint source contributors for the TP and TN input into the Prairie Dog Creek watershed. It is likely that runoff transporting nutrient loads associated with animal wastes and cultivated crops where fertilizer has been applied, to include pasture and hay, contribute to the TP impairment within Prairie Dog Creek and the Eutrophication impairment within Norton Lake. The associated TP and TN Load Allocations estimated at site SC549 are indicated in Tables 18a and 18b below, which under all flow scenarios represented in these tables accounts for the Total Allocations. To manage nonpoint nutrient loading, the flow exceedance range from 25-75% should be targeted since this best represents typical base flow conditions during both wet and dry years. The Prairie Dog Creek TP TMDL at KDHE station SC549, expressed as a load duration curve, is illustrated in Figure 36.
45
Table 18a. Prairie Dog Creek TMDL at SC549 based on instream TP concentration of 0.130 mg/L. Flow Condition
Total Allocations = Load Allocation (lbs/day) + Assimilated Wasteload
Allocation (lbs/day)
Margin of Safety
TMDL-TP (lbs/day)
WLA *(lbs/day)
Mean Flow (7.9 cfs)
5.0 0.55 5.55 12.5
10% (12 cfs) 7.58 0.84 8.42 12.5 20% (8 cfs) 5.06 0.56 5.62 12.5 25% (7 cfs) 4.42 0.49 4.91 12.5 30% (6.1) 3.79 0.43 4.28 12.5 40% (4.2) 2.65 0.30 2.95 12.5 50% (3 cfs) 1.9 0.21 2.11 12.5 60% (2 cfs) 0.26 0.14 1.4 12.5 70% (1 cfs) 0.63 0.07 0.70 12.5 75% (0.54 cfs) 0.34 0.04 0.38 12.5 80% (0.17 cfs) 0.11 0.01 0.12 12.5 90% (0 cfs) 0 0 0 12.5 * The assimilated WLA is part of the Total Allocation, since Colby WLA is expected to be reduced in upper reaches prior to arriving at SC549. Table 18b. Prairie Dog Creek TMDL at SC549 based on instream TN concentration of 0.825 mg/L. Flow Condition
Total Allocations = Load Allocation (lbs/day) + Assimilated Wasteload
Allocation (lbs/day)
Margin of Safety
TN TMDL (lbs/day)
WLA *(lbs/day)
Mean Flow (7.9 cfs)
31.68 3.52 35.19 66.5
10% (12 cfs) 48.11 5.35 53.46 66.5 20% (8 cfs) 32.08 3.56 35.64 66.5 25% (7 cfs) 28.07 3.12 31.19 66.5 30% (6.1) 24.46 2.72 27.18 66.5 40% (4.2) 16.84 1.87 18.71 66.5 50% (3 cfs) 12.03 1.34 13.37 66.5 60% (2 cfs) 8.02 0.89 8.91 66.5 70% (1 cfs) 4.01 0.45 4.46 66.5 75% (0.54 cfs) 2.17 0.24 2.41 66.5 80% (0.17 cfs) 0.68 0.08 0.76 66.5 90% (0 cfs) 0 0 0 66.5 * The assimilated WLA is part of the Total Allocation, since Colby WLA is expected to be reduced in upper reaches prior to arriving at SC549
46
Figure 36. Prairie Dog Creek Total Phosphorus TMDL above Norton Lake at KDHE stream chemistry station SC549.
Prairie Dog Creek - Total P TMDL at SC549 above Norton Lake
0.01
0.1
1
10
100
1000
0 10 20 30 40 50 60 70 80 90 100
% of Flow Exceedance
TP L
oad
- lbs
/day
TMDL (0.130 mg/L) Spring Summer-Fall Winter Norton Lake TMDL: Norton Lake is generally co-limited by nitrogen, phosphorus and light. Phosphorus and nitrogen will both be allocated under this TMDL. Load reductions should be focused on ortho-phosphate since it is the primary factor leading to the overall impairment of the watershed above the lake. The general inventory of sources within the drainage area of the lake indicates load reductions should be focused on nonpoint source runoff contribution attributed to livestock facilities and fertilizer applicators. The BATHTUB lake model was utilized for the development of the Norton Lake TMDL. BATHTUB is an empirical receiving water quality model, that was developed by the U.S. Army Corps of Engineers (Walker, 1996), and has been commonly applied in the nation to address many TMDLs relating to issues associated with morphometrically complex lakes and reservoirs (Mankin et. al., 2003; Wang et al, 2005). Norton Lake was segmented into three sections for the BATHTUB model, which included the upper lake (riverine area), middle lake (transitional area), and the Norton Lake dam site (main basin) and is detailed in Figure 37. Atmospheric total nitrogen was obtained from the Clean Air Status and Trends Network (CASTNET), which is available at http://www.epa.gov/CASTNET/sites.html. The CASTNET station from the Konza Prairie (KS) was utilized to estimate the atmospheric TN concentration for the model. Total phosphorus atmospheric loading was estimated using the 1983 study of Rast and Lee. Water quality data from the main basin segment was averaged using the 1986-2007 data from KDHE. Model input data for the lake inflow tributary was derived from the
47
averages from the spring and summer-fall samples from the KDHE stream sampling station (SC549) in Prairie Dog Creek above the lake. The BATHTUB model was calibrated for the main basin and results (see Appendix A) estimate that the lake currently retains 91% of the TP and 55% or the TN load annually. A 61% TP concentration reduction and a 23% TN concentration reduction within the main basin of Norton Lake is necessary to achieve the endpoint for this TMDL. Figure 37. Segmentation diagram of Norton Lake for BATHTUB model input.
Allocations for Norton Lake: Since the model utilized data from SC549 as the tributary inflow, the assimilated WLA is accounted for since any load associated with the WLA contributes to the concentrations at this sampling station. Nonpoint sources are the main contributor for the nutrient input and impairment in Norton Lake. Background levels may be attributed to nutrient recycling and leaf liter. The assessment suggest that runoff transporting nutrient loads associated with animal wastes and cultivated crops where fertilizer has been applied, to include pasture and hay, contribute to the fully eutrophic condition of the lake. Load Allocations for Norton Lake were calculated using the BATHTUB model and are summarized in Table 20. The model presents loads on an annual basis, the translating daily load calculation is displayed in Appendix B. The TMDL for TP entering Norton Lake is the same as the TMDL assigned to Prairie Dog Creek at stream station SC549. The BATHTUB model yielded appropriate annual loads for TP, which were converted to the daily (TMDL) load. To align the daily calculation from the BATHTUB results with the TP TMDL assigned to station SC549, the coefficient of variation (CV) for the TP daily calculation was slightly adjusted so the results matched. Hence, the results of the load duration curve associated with Prairie Dog Creek yields essentially the same results for the inflow of Norton Lake utilizing the BATHTUB model based on average stream flow conditions for TP.
48
The load allocations associated with this TMDL are replacing allocation previously assigned for Norton Lake. Table 19 illustrates the previous TMDL allocations for TP. The previous TMDL utilized the model CNET, which did not accurately account for the actual flow, or lack thereof, within the Prairie Dog Creek watershed that enters Norton Lake. CNET does not calculate nitrogen loads and the previous TMDL assigned initial nitrogen allocations based on a proportional decrease in nitrogen between the current condition of the lake and the desired endpoint by specifying a concentration reduction. This older TMDL will remain in effect for Dissolved Oxygen (DO) and pH until these impairments are no longer present and become delisted. There have been no DO or pH violations since the previous TMDL was approved. Table 19. Norton Lake Old TMDL TP allocations as approved on 08/07/2003.
Description Norton Lake Old TMDL – TP Allocations
TP LA 4,699 lbs/year TP WLA 7,191 lbs/year TP MOS 1,321 lbs/year
TP TMDL 13,211 lbs/year Table 20. Norton Lake Total Annual Load (Long-Term Average Load) from BATHTUB and the calculated TMDL. Description Load Allocation (lbs/year) Norton Lake TMDL
* - See Appendix B for daily load calculation. Defined Margin of Safety: The margin of safety provides some hedge against the uncertainty of variable total phosphorus loads and the endpoints of the TMDL. The margin of safety is explicitly set at 10% of the allowable total phosphorus loads at stream station SC549. The margin of safety for Norton Lake is explicitly set at 10% of the total phosphorus and nitrogen loads that enter into the lake.
49
State Water Plan Implementation Priority: Due to the high magnitude and frequency of excessive total phosphorus concentrations within Prairie Dog Creek and since Norton Lake is utilized as a public water supply and for primary contact recreation, this TMDL will be a High Priority. Unified Watershed Assessment Priority Ranking: The Norton Lake watershed lies within the Prairie Dog Subbasin (HUC8: 10250015) with a priority ranking of 57 (Low priority for restoration). Priority HUC 12s: The Spreadsheet Tool for Estimating Pollutant Load (STEPL) was utilized to identify the top ten priority HUC12s within the watershed. STEPL is a simple watershed model that provides both agricultural and urban annual average sediment and nutrient simulations as well as implementation evaluation of best management practices. Preliminary STEPL results for phosphorus and nitrogen are illustrated in Figures 38 and 39. Based on these results initial priorities should focus on the top three HUC12 subwatersheds in Table 21, which includes the HUC12 of Norton Lake and the two HUC12s immediately upstream of the lake. Table 21. Top ten priority HUC 12 subwatersheds as identified through STEPL.
1. Implement and maintain conservation farming, including conservation tilling, contour farming, and no till farming to reduce runoff and cropland erosion.
2. Improve riparian conditions along stream systems by installing grass and/or forest buffer strips along the stream and drainage channels in the watershed.
3. Perform extensive soil testing to ensure excess phosphorus is not unnecessarily being applied and to recommend appropriate fertilizer applications on cultivated cropland.
4. Minimize activities within riparian areas.
52
5. Ensure land applied manure is being properly managed and is not susceptible to runoff by implementing nutrient management plans.
6. Install pasture management practices, including proper stock density to reduce soil erosion and storm runoff.
7. Ensure proper on-site waste system operations in proximity to the main-stream segments.
8. Ensure that labeled application rates of chemical fertilizers are being followed and implement runoff control measures.
9. Renew state and federal permits and inspect permitted facilities for permit compliance.
10. Utilize state-supported Upper Republican Basin WRAPS process to facilitate load reduction of nutrients to Norton Lake.
Implementation Programs Guidance NPDES and State Permits – KDHE
a. Monitor effluent from the City of Colby’s wastewater treatment plant, ensure compliance with permit goals and limits so nutrient removal is adequate. Continue to monitor the performance of the new plant to ensure proper operation and removal of nutrients.
b. Inspect permitted livestock facilities to ensure compliance. c. New livestock permitted facilities will be inspected for integrity of
applied pollution prevention technologies. d. New Registered livestock facilities with less than 300 animal units will
apply pollution prevention technologies. e. Manure management plans will be implemented, to include proper
land application rates and practices that will prevent runoff of applied manure.
f. Coordinate with Division of Water Resources to ascertain the extent that Colby’s wastewater effluent reaches Norton Lake and SC549.
a. Support new and ongoing Section 319 implementation and demonstration activities conducted under WRAPS projects focused on Prairie Dog Creek and restoring Norton Lake, including demonstration projects and outreach efforts dealing with erosion and sediment control and nutrient management.
b. Provide technical assistance on practices geared to the establishment of vegetative buffer strips.
c. Provide technical assistance on nutrient management for livestock facilities in the watershed and practices geared towards small livestock operations which minimize impacts to stream resources.
d. Support Watershed Restoration and Protection Strategy (WRAPS) efforts for Prairie Dog Creek.
53
e. Incorporate the provisions of this TMDL into WRAPS documents relating to Prairie Dog Creek and Norton Lake, including the 9-element watershed plan governing EPA 319 funding implementation.
Water Resource Cost Share and Nonpoint Source Pollution Control Programs – SCC
a. Apply conservation farming practices and/or erosion control structures, including no-till, terraces, and contours, sediment control basins, and constructed wetlands.
b. Provide sediment control practices to minimize erosion and sediment transport from cropland and grassland in the watershed.
c. Install livestock waste management systems for manure storage. d. Implement manure management plans. e. Re-evaluate nonpoint source pollution control methods.
Riparian Protection Program- SCC
a. Establish or reestablish natural riparian systems, including vegetative filter strips and streambank vegetation.
b. Develop riparian restoration projects along targeted stream segments, especially those areas with adequate sustained baseflows.
c. Promote wetland construction to reduce runoff and assimilate sediment loadings.
d. Coordinate riparian management within the watershed and develop riparian restoration projects.
Buffer Initiative Program – SCC
a. Install grass buffer strips near streams. b. Leverage Conservation Reserve Enhancement Program to hold
riparian land out of production.
Extension Outreach and Technical Assistance – Kansas State University a. Educate agricultural producers on sediment, nutrient, and pasture
management. b. Educate livestock producers on livestock waste management, land
applied manure applications, and nutrient management planning. c. Provide technical assistance on livestock waste management systems
and nutrient management planning. d. Provide technical assistance on buffer strip design and minimizing
cropland runoff. e. Encourage annual soil testing to determine capacity of field to hold
phosphorus. f. Educate residents, landowners, and watershed stakeholders about
nonpoint source pollution and support outreach efforts of Prairie Dog Creek WRAPS projects.
54
Time Frame for Implementation: Pollutant reduction strategies and pollutant source assessments should be initiated within the priority HUC12 subwatersheds in 2011 through the 9-element watershed plan of the WRAPS. Pollutant reduction practices and implementation activities within the priority HUC12 subwatersheds should be initiated by 2011 and continue through 2019. Targeted Participants: The primary participants for implementation will be agricultural and livestock operations immediately adjacent to the streams within the priority subwatersheds. Conservation district personnel and county extension agents should conduct a detailed assessment of sources adjacent to streams within the watershed over 2011. Implementation activities should target those areas with the greatest potential to impact total phosphorus concentrations within Prairie Dog Creek and should be targeted for:
1. Unbuffered cropland adjacent to the stream. 2. Sites where drainage runs through or adjacent to livestock areas. 3. Sites where livestock have full access to the stream and it is their primary
water supply. 4. Conservation compliance on highly erodible areas. 5. Acreage of poor rangeland or overstocked pasture. 6. Poor riparian area and denuded riparian vegetation along the stream. 7. Fields with manure applications.
Milestone for 2014: In accordance with the TMDL development schedule for the State of Kansas, the year 2014 marks the next cycle of 303(d) activities in the Upper Republican Basin to review data from site SC549 and Norton Lake to assess improved conditions. Should the impairment continue, adjustments to source assessment, allocation, and implementation activities may occur. Delivery Agents: The primary delivery agents for program participation will be KDHE, the State Conservation Commission, the Kansas State University Extension Service and the Prairie Dog Creek WRAPS teams. Reasonable Assurances: Authorities: The following authorities may be used to direct activities in the watershed to reduce pollutants and to assure allocations of pollutant sources can be attained:
1. K.S.A. 65-164 and 165 empowers the Secretary of KDHE to regulate the discharge of sewage into the waters of the state.
2. K.S.A. 65-171d empowers the Secretary of KDHE to prevent water pollution
and to protect the beneficial uses of the waters of the state through required treatment of sewage and established water quality standards and to require permits by persons having a potential to discharge pollutants into the waters of the state.
55
3. K.S.A. 2002 Supp. 82a-2001 identifies the classes of recreation use and defines impairment for streams.
4. K.A.R. 28-16-69 through 071 implements water quality protection by KDHE
through the establishment and administration of critical water quality management areas on a watershed basis.
5. K.S.A. 2-1915 empowers the State Conservation Commission to develop
programs to assist the protection, conservation and management of soil and water resources in the state, including riparian areas.
6. K.S.A. 75-5657 empowers the State Conservation Commission to provide
financial assistance for local project work plans developed to control nonpoint source pollution.
7. K.S.A. 82a-901, et. seq. empowers the Kansas Water Office to develop a state
water plan directing the protection and maintenance of surface water quality for the waters of the state.
8. K.S.A. 82a-951 creates the State Water Plan Fund to finance the
implementation of the Kansas Water Plan, including selected Watershed Restoration and Protection Strategies.
9. The Kansas Water Plan and the Upper Republican River Basin Plan provide
the guidance to state agencies to coordinate programs intent on protecting water quality and to target those programs to geographic areas of the state for high priority in implementation.
10. K.S.A. 32-807 authorizes the Kansas Department of Wildlife and Parks to
manage lake resources. Funding: The State Water Plan Fund annually generates $16-18 million and is the primary funding mechanism for implementing water quality protection and pollution reduction activities in the state through the Kansas Water Plan. The state water planning process, overseen by the Kansas Water Office, coordinates and directs programs and funding toward watersheds and water resources of highest priority. Typically, the state allocates at least 50% of the fund to programs supporting water quality protection. This watershed and it’s TMDL are a High Priority consideration for funding. Effectiveness: Nutrient control has been proven effective through conservation tillage, contour farming and use of grass waterways and buffer strips. In addition, the proper implementation of comprehensive livestock waste management plans has proven effective at reducing nutrient runoff associated with livestock facilities. The key to success will be widespread utilization of conservation farming and proper livestock waste management within the watershed cited in this TMDL.
56
6. MONITORING KDHE will continue to collect quarterly to bimonthly samples in each of the three defined seasons every year at Station SC549. KDHE will collect stream chemistry and biological samples in Prairie Dog Creek downstream of the Colby outfall. Based on the sampling data, the extent of any improved conditions will be evaluated in 2014. Norton Lake will continue to be sampled every three years in order to assess the trophic state of the lake, with the next scheduled sampling event in 2010. The improved status of Norton Lake will be evaluated in 2019. If the impairment status continues, the desired endpoints under this TDML will be further evaluated. Both the stream and the lake will be evaluated for possible delisting in 2020. If the endpoint for Prairie Dog Creek and Norton Lake are not being approached, follow up increases with treatment at Colby are anticipated. Biological monitoring for macroinvertebrates will be initiated after 2012 on Prairie Dog Creek to determine the impact to the aquatic life community. 7. FEEDBACK Public Notice: An active internet website was established at www.kdheks.gov/tmdl/ to convey information to the public on the general establishment of TMDLs and specific TMDLs for the Upper Republican Basin. Public Hearing: A Public Hearing on the Upper Republican TMDLs was held in Phillipsburg, KS on February 10, 2010. Basin Advisory Committee: The Upper Republican Basin Advisory Committee met to discuss these TMDLs on March 3, 2010. Milestone Evaluation: In 2014, evaluation will be made as to the degree of implementation which has occurred within the watershed. Subsequent decisions will be made regarding the implementation approach, priority of allotting resources for implementation and the need for additional or follow up implementation in this watershed at the next TMDL cycle for this basin in 2014 with consultation from local stakeholders and WRAPS teams. Consideration for 303(d) Delisting: Prairie Dog Creek and Norton Lake will be evaluated for delisting under section 303(d), based on the monitoring data over 2009-2019. Therefore, the decision for delisting will come about in the preparation of the 2020-303(d) list. Should modifications be made to the applicable water quality criteria during the implementation period, consideration for delisting, desired endpoints of this TMDL and implementation activities might be adjusted accordingly. Incorporation into Continuing Planning Process, Water Quality, Management Plan and the Kansas Water Planning Process: Under the current version of the Continuing Planning Process, the next anticipated revision would come in 2010, which will
57
emphasize implementation of WRAPS activities. At that time, incorporation of this TMDL will be made into the WRAPS. Recommendations of this TMDL will be considered in the Kansas Water Plan implementation decisions under the State Water Planning Process for Fiscal Years 2011-2019. Revised September 9, 2011 Bibliography Bark, L. Dean. Contributing author, Kansas Agricultural Experiment Station in Soil Survey of Decatur County, Kansas, p1-2. Carney, E.. 1992, 1995, 1998, 2001, 2004, 207. Lake and Wetland Monitoring Program Annual Report/Summary. Kansas Department of Health and Environment. Davis, Jessica and Bob Stevens. Phosphorus Sources, Application Timing and Methods factsheet. University of Tennessee Extension, funded in part by USDA-NRCS. Devlin, Daniel L., D.A. Whitney, and K.A. McVay. 2000. Phosphorus and Water
Quality in Kansas. Kansas State University Agricultural Experiment Station and Cooperative Extension Service, publication MF-2463.
Limitation of Phytoplankton Growth in Central Plains Reservoirs, USA; Journal of Plankton Research; 27(6): 587-595.
Juracek, K.E. 2004. Sedimentation and occurrence and trend of selected chemical
constitutes in bottom sediment of 10 small reservoirs in eastern Kansas. U.S. Geological Survey, Scientific Investigation Report 2004-5288. 80 p.
Hamilton, Vernon L., R. C. Angell, and B.D. Tricks. Soil Conservation Service, Soil
Survey of Decatur County, Kansas. United States Department of Agriculture, Soil Conservation Service, in cooperation with the Kansas Agricultural Experiment Station.
Kansas Geological Survey. Water Information Management Analysis System (WIMAS) version 5 for the web database Summary Results. Accessed on web at:
http://hercules.kgs.ku.edu/geohydro/wimas/index.cfm?CFID=402257&CFTOKEN=85388432&jsessionid=5a30238d08ac3f282b7e Site accessed on August 5, 2009.
58
Mallarino, Antonio and John Sawyer. 2002. Phosphorus Application factsheet. Iowa State University Extension. Mankin, K.R., S. Wang, J.K. Koeliker, D.G. Huggins and F. deNoyelles Jr., 2003.
Watershed lake water quality modeling: verification and application. Journal of Soil and Water Conservation 58(4): 188-196.
Murphy, Sheila. General Information on Phosphorus, City of Boulder and USGS Water
Quality Monitoring. Accessed on internet at http://bcn.boulder.co.us/basin/data/BACT/info/TP.html on January 20, 2009.
Perry, C.A., D.M. Wolock and J.C. Artman, 2004. Estimates of Flow Duration , Mean
Flow and Peak-Discharge Frequency Values for Kansas Stream Locations, USGS Scientific Investigation Report 2004-5033.
Suplee, M.W., V. Watson, M. Teply and H. McKee, 2009, How Green is Too Green? Public Opinion of What Constitutes Undesirable Algae Levels in Streams, Journal of the American Water Resources Association, 45(1): p. 123 – 140. U.S. EPA. 2000. Nutrient Criteria Technical Guidance Manual: Rivers and Streams. U.S.Environmental Protection Agency, Washington, DC. EPA-822-B00-002. Walker, W.W. Jr., 1996. Simplified procedures for eutrophication assessment and
prediction: user manual. Instructional Report W-96-2. U.S. Army Engineer Waterways Experiment Station. Vicksburg, MS.
Wang, S.H., D.G. Huggins, L. Frees, C.G. Volkman, N.C. Lim, D.S. Baker, V. Smith and
F. deNoyelles Jr., 2005. An integrated modeling approach to total watershed management: water quality and watershed management of Cheney Reservoir, Kansas, USA. Water and Air and Soil Pollution 164: 1-19.
59
Appendix A. BATHTUB Model Summary
Input Files – Current Condition – Norton Lake
60
Model Output – Current Condition Predicted v. Observed
Norton Lake Main Basin
61
Model Output – Overall Water and Nutrient Balances – Current Condition
62
Model Output with 76% TP and 45% TN concentration reductions at Inflow.
63
Model Output with 76% TP and 45% TN concentration reductions at Inflow. Norton Lake Predicted vs. Observed
64
Model Output with 76% TP and 45% TN concentration reductions at Inflow. Norton Lake
65
Goodness of Fit (Calibration / Validation)
T = Student’s t-statistic testing for significant difference between observed and predicted means using three alternative measures of error: observed error only, T(1); error typical of model development data set, T(2); and observed and predicted error, T(3). Tests of model applicability are normally based upon T(2) and T(3). However, if an appropriate sedimentation model is selected, T(1) can then be used as a basis for deciding whether calibration is appropriate.
The BATHTUB model was calibrated for the main basin (Norton Dam) and calibrated for TP, TN, Chlorophyll a, Secchi Depth, Organic N, and Ortho-P. The appropriate model options within BATHTUB were selected and the calibration factors were adjusted to calibrate the simulated values closer to the observed values (for the calibrated parameters) for the main basin. Organic N and Organic P values are inputs to the BATHTUB model. KDHE does not directly measure Organic N, however this is calculated from TKN-NH3 for the KDHE data.
BATHTUB Modeling Results: Error bar plot (mean + standard deviation of TN, TP, Chla, and Secchi depth parameters) estimated by BATHTUB model.
66
67
68
Daily Load Calculations for BATHTUB Appendix B – Conversion to Daily Loads as Regulated by EPA Region VII The TMDL has estimated annual average loads for TN and TP that if achieved should meet the water quality targets. A recent court decision often referred to as the “Anacostia decision” has dictated that TMDLs include a “daily” load (Friend of the Earth, Inc v. EPA, et al.). Expressing this TMDL in daily time steps could be misleading to imply a daily response to a daily load. It is important to recognize that the growing season mean chlorophyll a is affected by many factors such as: internal lake nutrient loading, water residence time, wind action and the interaction between light penetration, nutrients, sediment load and algal response. To translate long-term averages to maximum daily load values, EPA Region 7 has suggested the approach describe in the Technical Support Document for Water Quality Based Toxics Control (EPA/505/2-90-001)(TSD). Maximum Daily Load (MDL) = (Long-Term Average Load) * e ]5.0[ 2σσ −Z where ( )1ln 22 += CVσ CV = Coefficient of variation = Standard Deviation / Mean Z = 2.326 for 99th percentile probability basis LTA= Long Term Average LA= Load Allocation MOS= Margin of Safety Parameter LTA CV e ]5.0[ 2σσ −Z MDL LA MOS
(10%) TP 870.6
lbs/yr 0.42 2.33 5.56
lbs/day 4.99 lbs/day
0.57 lbs/day
TN 16,283 lbs/yr
0.3 1.90 84.76 lbs/day
76.29 lbs/day
8.47 lbs/day
69
Maximum Daily Load Calculation Annual TP Load = 870.6 lbs/yr Maximum Daily TP Load = [(870.6 lbs/yr)/(365 days/yr)]*e ])4.0*(5.0)4.0*(326.2[ 2− = 5.56 lbs/day Annual TN Load = 16,283 lbs/yr Maximum Daily TN Load = [(16283 lbs/yr)/(365 days/yr)]*e ])294.0*(5.0)294.0*(326.2[ 2− = 84.76 lbs/day Margin of Safety (MOS) for Daily Load Annual TP MOS = 87.1 lbs/yr Daily TP MOS = [(87.1 lbs/yr)/(365 days/yr)]*e ])4.0*(5.0)4.0*(326.2[ 2− =0.57 lbs/day Annual TN MOS = 1628 lbs/yr Daily TN MOS = [(1628 lbs/yr)/(365 days/yr)]*e ])294.0*(5.0)294.0*(326.2[ 2− = 8.47 lbs/day Source- Technical Support Document for Water Quality-based Toxics Control (EPA/505/2-90-001)


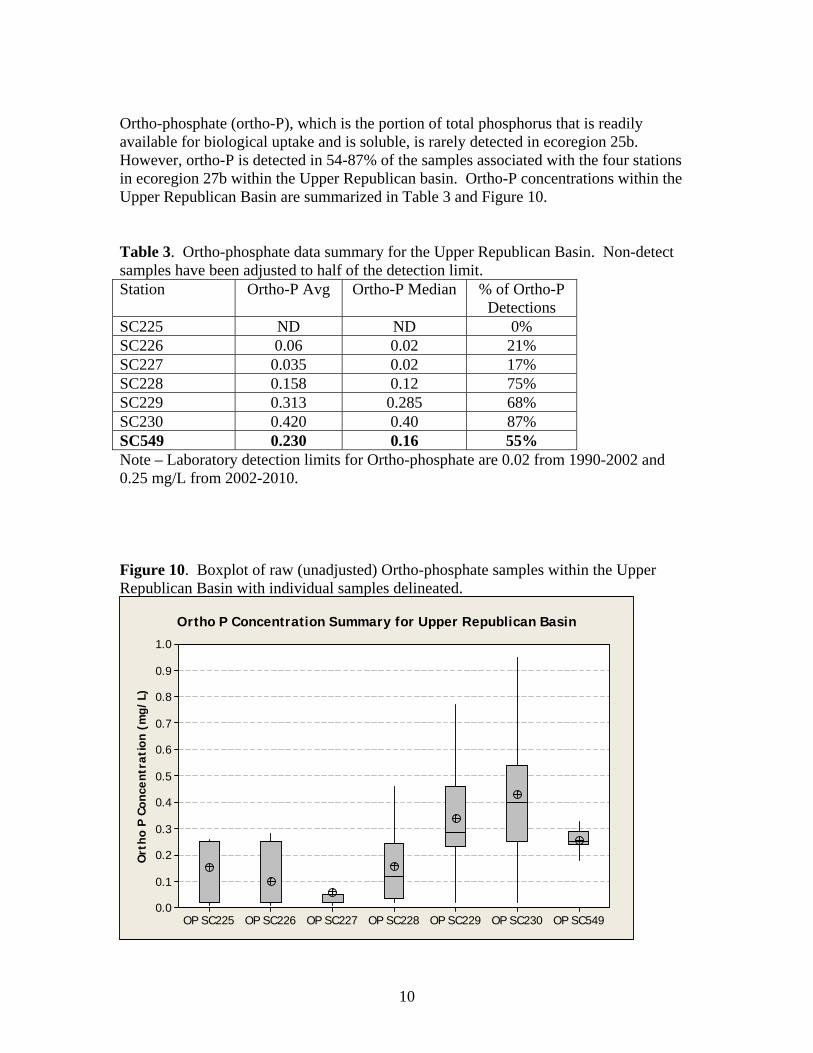


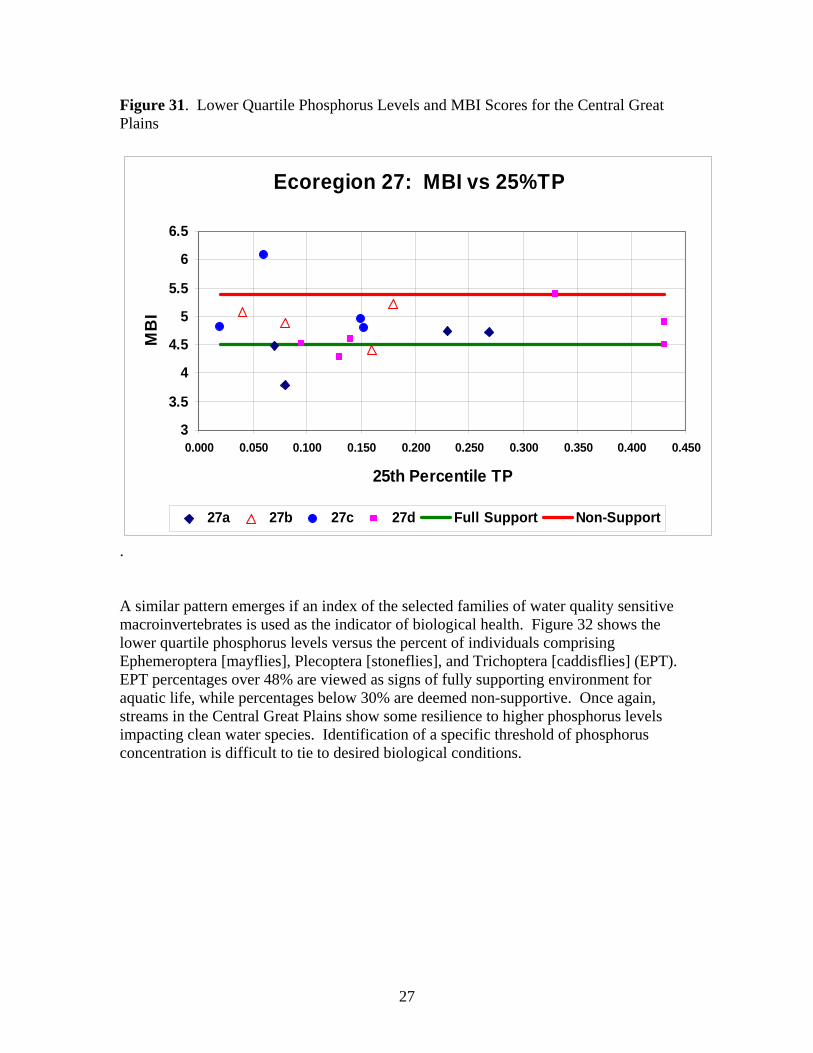


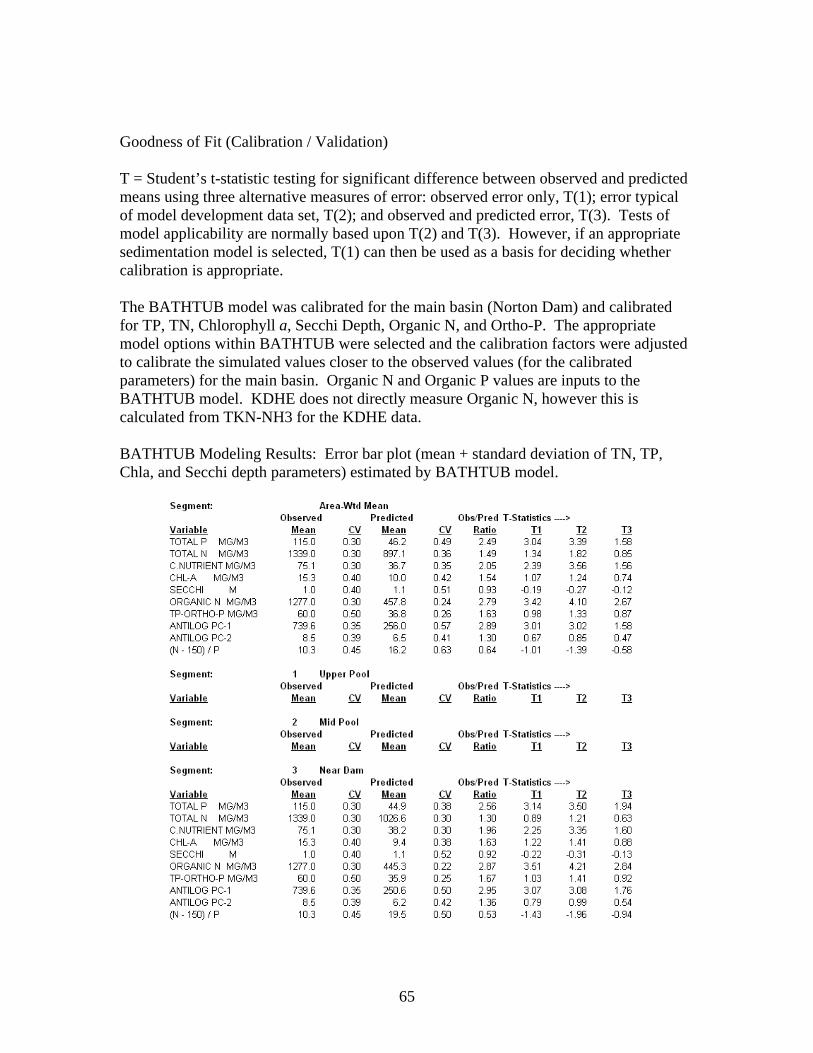


![[XLS] · Web view3.5000000000000003E-2 0.05 2.5000000000000001E-2 3.5000000000000003E-2 0.05 2.5000000000000001E-2 4.4999999999999998E-2 0.05 2.5000000000000001E-2 0.04 0.05 2.5000000000000001E-2](https://static.documents.pub/doc/80x56/5c8e2bb809d3f216698ba826/xls-web-view35000000000000003e-2-005-25000000000000001e-2-35000000000000003e-2.jpg)

