36
Upping the RAP: Putting Research into Practice NAPA Webinar Rebecca McDaniel, NCSC Matthew Beeson, INDOT November 15, 2012

Upping the RAP: Putting Research into Practice
NAPA Webinar Rebecca McDaniel, NCSC Matthew Beeson, INDOT
November 15, 2012

Investigation of Low and High Temperature Properties of Plant-Produced RAP Mixtures
Study funded by FHWA Thanks to participating contractors,
Audrey Copeland, Gerry Huber. http://www.fhwa.dot.gov/publications/research/
infrastructure/pavements/11058/

Growing Interest/Changing Practices
Higher RAP contents in more mixtures.
More fractionating.
More interest in recycling asphalt shingles (high binder contents).
More specs based on binder replacement.

Previous RAP Research
Often laboratory studies and some field performance evaluations
Typically lower RAP contents and little comparison of RAP contents This study was intended to compare different
RAP contents and binder grades in plant produced mixtures.
Conventional Wisdom
RAP will stiffen mix More RAP will stiffen mix more Improves rut resistance at high temperatures May reduce fatigue resistance May worsen thermal cracking Need softer virgin binder to compensate
Current US Guidelines
Adjust grade of binder added to account for the hard, oxidized binder in the RAP 0 to 15% RAP, no binder grade change 16-25% RAP, decrease virgin binder grade Over 25% RAP, test RAP binder to determine appropriate
virgin grade (or allowable RAP content)
Percentage by weight of RAP in the mixture. Based on non-fractionated mixes with about 5%
binder in RAP and new mix (mostly lab mixes). Many states have modified these.

Questions
At what RAP content do you need to change grades?
Effect of RAP on low temperature cracking?
Are things different when plant mixes are tested?

Approach Evaluated 5 sets of plant-produced mixes
with up to 40% RAP and 2 virgin binders Compared mix properties: Dynamic modulus Low temperature properties and cracking Estimated blending Fatigue (TFHRC) (not presented today)
Also tested extracted/recovered binders (not discussed today)

Five Contractors
RAP Content*
Binder Grade 0% 15% 25% 40%
PG 58-28 X X
PG 64-22 X X X X
*By mass of mix

Mix Designs Contractors designed 9.5 mm mixes Two coarse, three fine
Full mix design on one mixture Adjust for changes in RAP content Keep gradations consistent while using existing
stockpiles Generally within 3% on any sieve
Typically one point verification Substantial spec compliance

Mix Production Routine processing and production RAP crushed and screened Four used 12.5 mm screen One used 15.9 mm (5/8 in.) screen
Plant types – parallel and counter-flow drums, double drum, and aggregate dryer with separate mixing drum
Sampled from one truck at plant – loose mix and gyratory samples

Dynamic Modulus Test
0
0*εσ
=E
Stress
Strain
Time
• Rutting • Fatigue Cracking
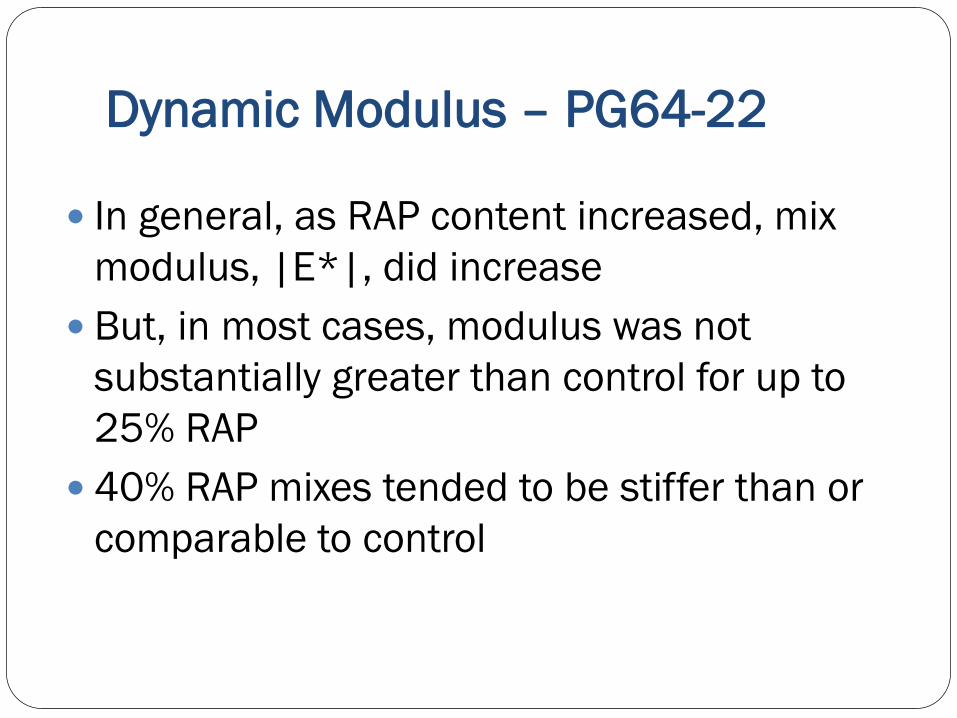
Dynamic Modulus – PG64-22
In general, as RAP content increased, mix modulus, |E*|, did increase
But, in most cases, modulus was not substantially greater than control for up to 25% RAP
40% RAP mixes tended to be stiffer than or comparable to control

One Example - Mix |E*|
100
1000
10000
100000
1.E-03 1.E-02 1.E-01 1.E+00 1.E+01 1.E+02 1.E+03 1.E+04 1.E+05
|E*|,
MPa
Reduced Frequency, Hz
PG64-22
Mix1-A (0%0 RAP)
Mix1-B (15% RAP)
Mix1-C (25% RAP)
Mix1-D (40% RAP)

Modulus with PG58-28 Use of PG58-28 generally reduced mix
modulus
Mixes with 40% RAP were much stiffer than with 25% RAP
In some cases, mix with 25% RAP and PG58-28 was much less stiff than control

Example – PG64-22 vs PG58-28
100
1000
10000
100000
1.E-03 1.E-02 1.E-01 1.E+00 1.E+01 1.E+02 1.E+03 1.E+04 1.E+05 1.E+06 1.E+07 1.E+08
|E*|,
MPa
Reduced Frequency, Hz
PG64-22 versus PG58-28
Mix4-C (25% RAP)
Mix4-E (25% RAP)
Mix4-D (40% RAP)
Mix4-F (40% RAP)
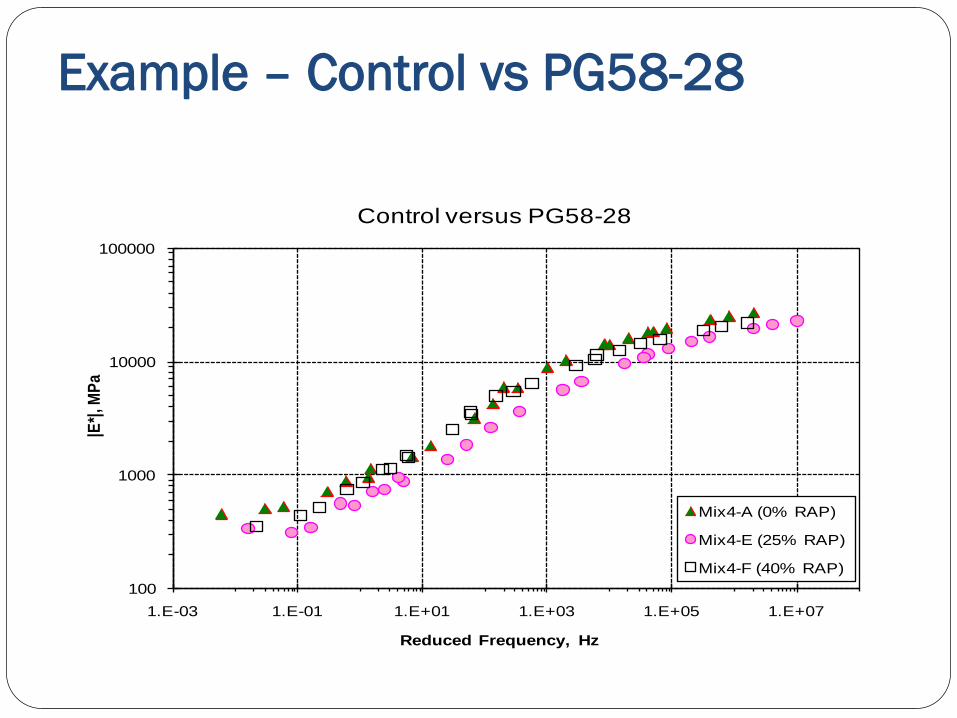
Example – Control vs PG58-28
17
100
1000
10000
100000
1.E-03 1.E-01 1.E+01 1.E+03 1.E+05 1.E+07
|E*|,
MPa
Reduced Frequency, Hz
Control versus PG58-28
Mix4-A (0% RAP)
Mix4-E (25% RAP)
Mix4-F (40% RAP)

Statistical Analysis
ANOVA and comparison of means test at different temperatures showed: Mixes with PG64-22 either not significantly
different OR
40% RAP mix was different from the others
Mixes with PG58-28 were sometimes different from each other (25% and 40% RAP)

Low Temperature Mix Tests
With PG64-22 15 to 25% RAP changed Tc by ~2°C (warmer) 40% RAP changed Tc by ~4°C
With PG58-28 25% RAP was comparable to control 40% RAP mix was ~1°C warmer than control

IDT Strength Example
-28
-22
-16
-10
2000
2500
3000
3500
JH-A JH-B JH-C JH-D JH-E JH-F
Pvmt. Cracking Tem
perature, °C St
reng
th, k
Pa
Mixes
Strength
Temperature
A B C D E F

Possible Effects of RAP Binder
RAP aggregate with oxidized binder film
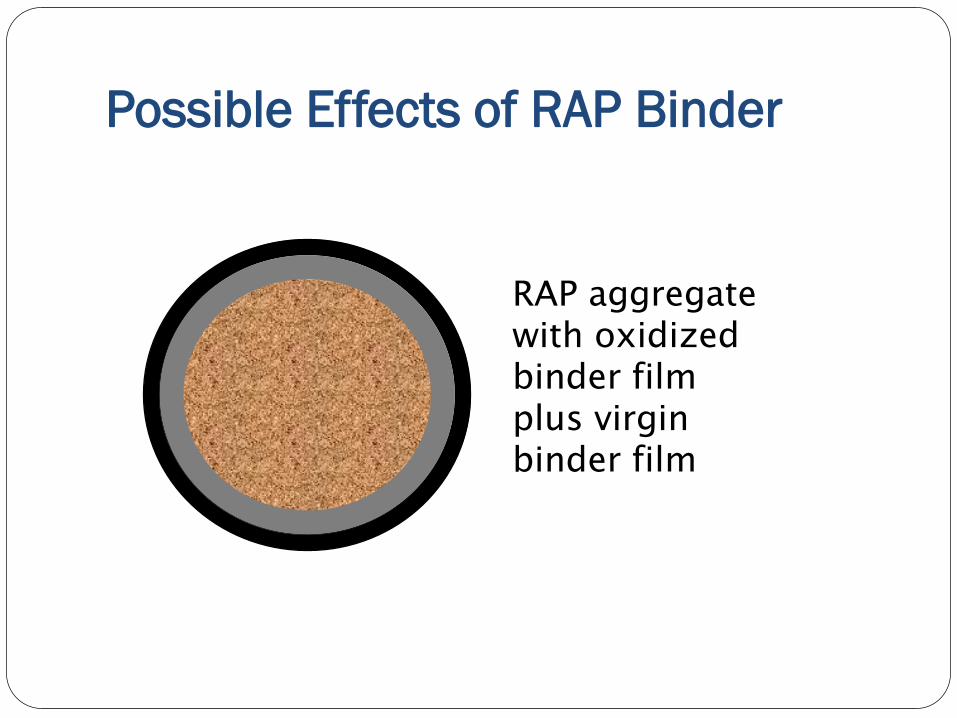
Possible Effects of RAP Binder
RAP aggregate with oxidized binder film plus virgin binder film

Possible Effects of RAP Binder
If RAP and virgin binders do not blend, effective binder properties will be those of the virgin binder only.

Possible Effects of RAP Binder
If RAP and virgin binders blend or merge, effective binder properties will be determined by the amount of blending that occurs.
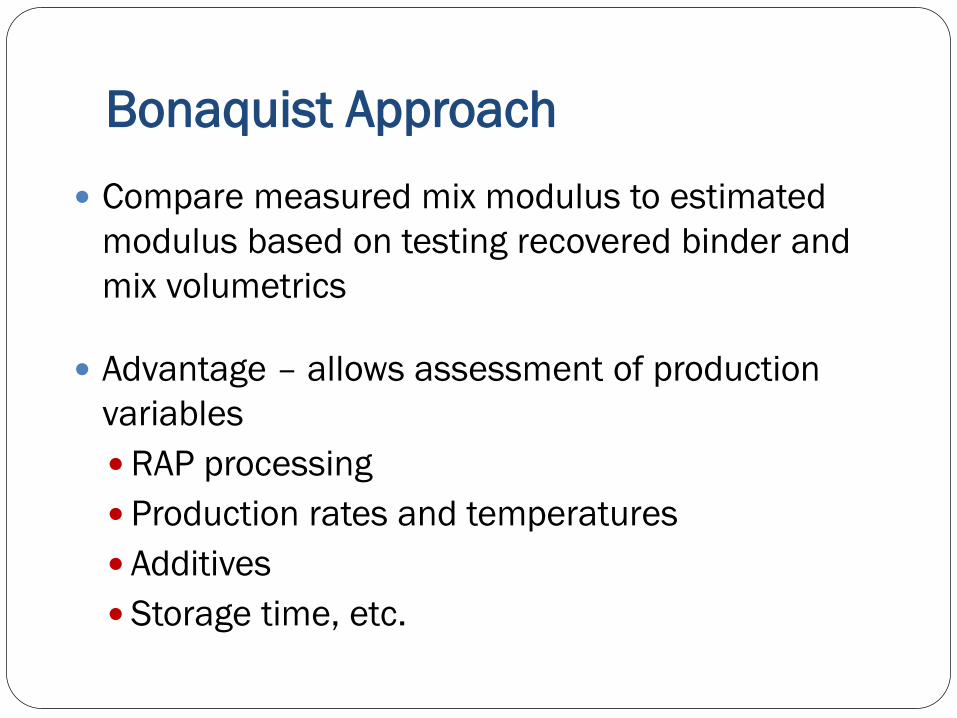
Bonaquist Approach Compare measured mix modulus to estimated
modulus based on testing recovered binder and mix volumetrics
Advantage – allows assessment of production variables RAP processing Production rates and temperatures Additives Storage time, etc.

Thorough Blending
1.E+02
1.E+03
1.E+04
1.E+05
1.E-04 1.E-03 1.E-02 1.E-01 1.E+00 1.E+01 1.E+02 1.E+03 1.E+04 1.E+05 1.E+06 1.E+07
Mod
ulus
, |E*
| MPa
Reduced Frequency, Hz
Estimated
Measured

Poor Blending
1.E+02
1.E+03
1.E+04
1.E+05
1.E-04 1.E-03 1.E-02 1.E-01 1.E+00 1.E+01 1.E+02 1.E+03 1.E+04 1.E+05 1.E+06 1.E+07
Mod
ulus
, |E*
| MPa
Reduced Frequency, Hz
Estimated
Measured

Summary of Blending Mix A Mix B Mix C Mix D Mix E Mix F
RAP % 0 15 25 40 25 40
PG 64-22 64-22 64-22 64-22 58-28 58-28
Contractor 2 Good Good Good Poor Good Good
Contractor 3 Good Partial Good Good Good Good
Contractor 4 Good Good Poor Poor Good Good
Contractor 5 Good Good Good Good Good Good

Blending Analysis
Two cases indicated good blending for all RAP contents, two showed less for some mixes
Relates to other comparisons IDT indicated little effect of binder grade in
the cases with questionable blending
Results were not totally consistent Not simple; many factors can affect blending
and testing

Conclusions
As RAP content increased, mix modulus generally increased
No statistically significant differences between mix moduli with PG64-22 except for some mixes with 40% RAP
Use of softer virgin binder did reduce modulus

Conclusions Significant blending of RAP and virgin binders was
observed in most cases, especially up to 25%
Low temperature mix testing showed slight change in critical cracking temperature at up to 25% RAP with no grade change
Critical cracking temperatures were lower with PG58-28, but -26 but may not be needed

Overall Conclusions Findings suggest no grade change needed for
RAP contents ≤25%
Binder grade should be one grade softer for 40% RAP mixes
Applicable to these materials and conditions; not necessarily true elsewhere
Review your typical materials, especially typical RAPs, to explore applicability
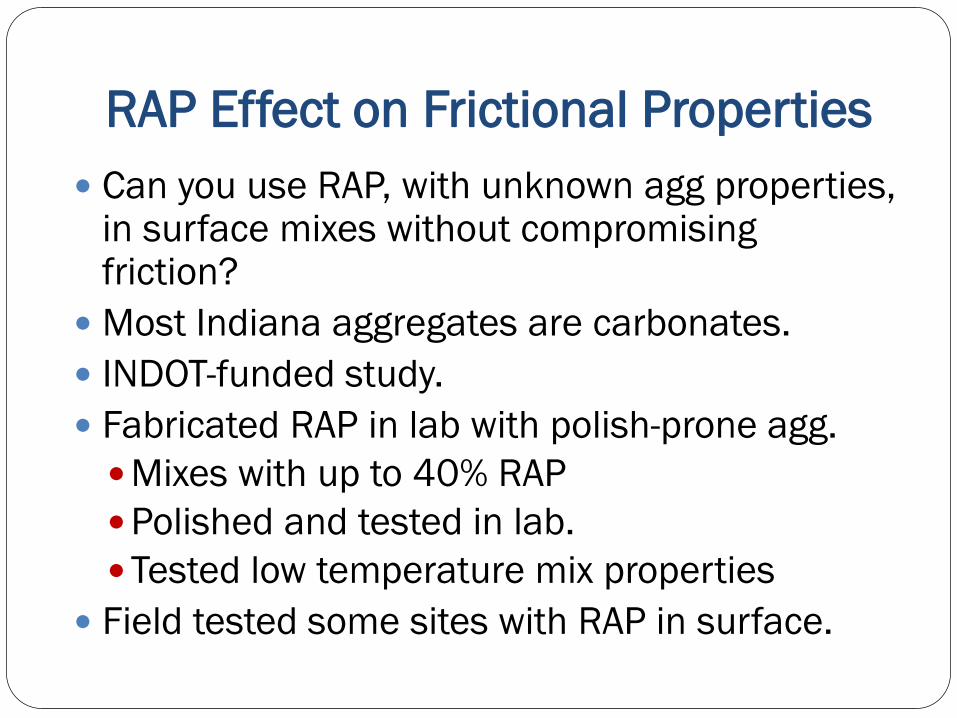
RAP Effect on Frictional Properties Can you use RAP, with unknown agg properties,
in surface mixes without compromising friction?
Most Indiana aggregates are carbonates. INDOT-funded study. Fabricated RAP in lab with polish-prone agg. Mixes with up to 40% RAP Polished and tested in lab. Tested low temperature mix properties
Field tested some sites with RAP in surface.

Surface Characteristics

Findings of Friction Study Up to 25% RAP in surface mixes can be
allowed with no appreciable loss of friction. Finer RAP fractions are used (100% passing
9.5mm, 95% passing 4.75mm) This may be relaxed in future based on another study.
Field friction levels were acceptable on existing pavements.
Mix testing confirmed minimal effect on low temperature properties up to 25%
http://docs.lib.purdue.edu/jtrp/1497/

Know Your Materials
Here is what Indiana DOT did to evaluate their typical materials and revise their specifications for RAP mixes.


