21
UPSIDE DOWN: The $400 Billion Federal Asset Building Budget Ida Rademacher, CFED Jillien Meier , Annie E. Casey Foundation September 23, 2010
| Date post: | 25-Dec-2015 |
| Category: |
Documents |
| Upload: | rolf-howard |
| View: | 276 times |
| Download: | 0 times |

UPSIDE DOWN:The $400 Billion Federal Asset
Building Budget
Ida Rademacher, CFED Jillien Meier , Annie E. Casey Foundation
September 23, 2010

Why Are Assets Important?
Assets are critical to individuals and households.
Assets allow Americans to plan for the future, buy homes, prepare for retirement, send their children to college, and weather unexpected financial storms.

Why Are Assets Important?
Assets are less evenly distributed among Americans than is income:□ Richest 20%of households own 87% of assets. □ One in five US households owe more than they own □ One in four US households lack enough liquid assets to
survive, after the loss of a job, even at the poverty line for three months.
□ Minority families have 1/10th the net assets of white families.

Why Study Asset-Building Policies?
The federal government has helped millions of Americans invest in their families’ future through asset-building.
Until 2004, however, no one had looked comprehensively at how much asset-building policies cost, where the money went, and who benefited.
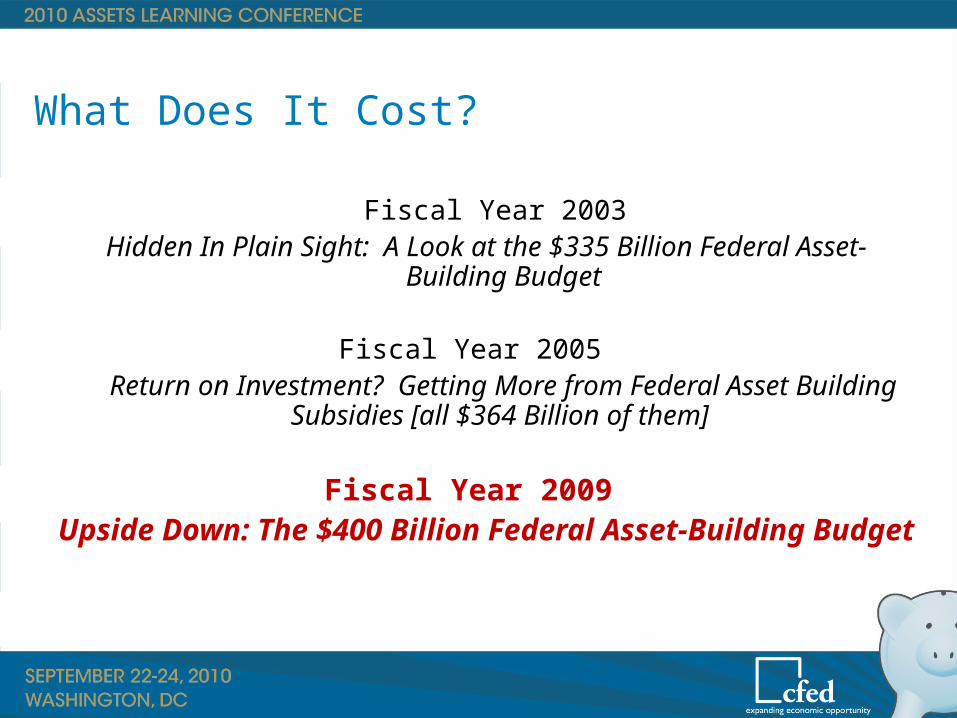
What Does It Cost?
Fiscal Year 2003 Hidden In Plain Sight: A Look at the $335 Billion Federal Asset-Building
Budget
Fiscal Year 2005 Return on Investment? Getting More from Federal Asset Building
Subsidies [all $364 Billion of them]
Fiscal Year 2009 Upside Down: The $400 Billion Federal Asset-Building Budget

How Big is this Asset-building Budget?
$384 billion is a lot of money. To Put this in perspective…
□ The entire non-military Federal discretionary budget for 2011 is about $520 billion
□ ~10 times the size of the budgets for HUD or Education or Homeland Security
□ ~20 times the size of the budget for Administration for Children and Families

What’s Included?
Policies have to fit 3 criteria:□ Asset building for individuals and households□ Specific, explicit federal policies□ Available to most of the general public, but also
are the result of some personal action
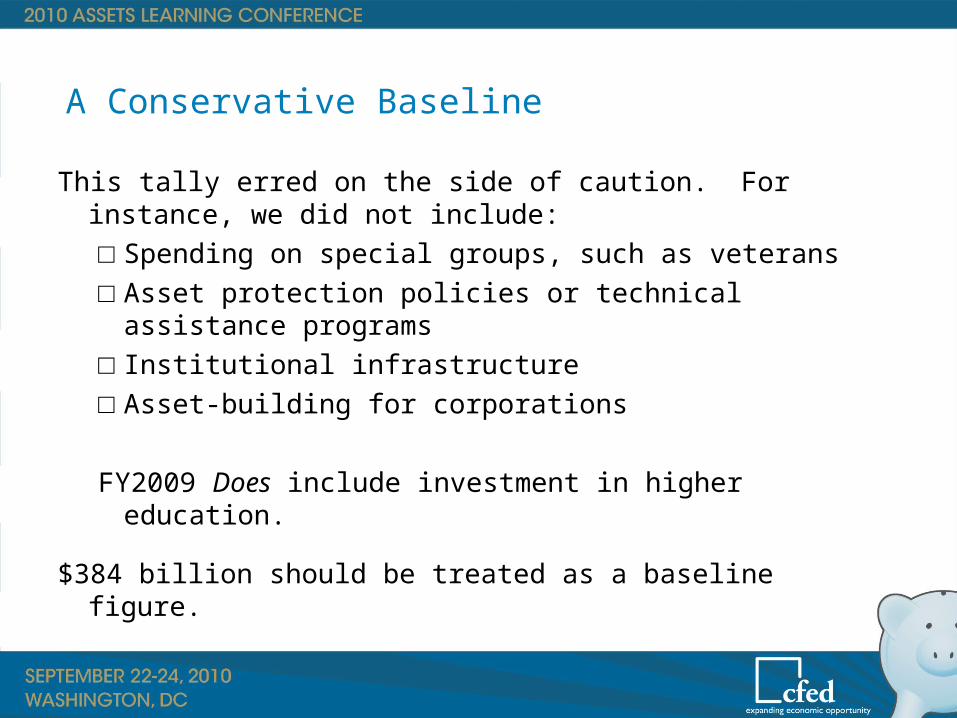
A Conservative Baseline
This tally erred on the side of caution. For instance, we did not include:□ Spending on special groups, such as veterans□ Asset protection policies or technical assistance programs□ Institutional infrastructure□ Asset-building for corporations
FY2009 Does include investment in higher education.
$384 billion should be treated as a baseline figure.

Where Does the Money Go?
It includes direct outlays and tax expenditures promoting four different kinds of assets:
» Homeownership = $110.5 billion » Retirement accounts = $53.2 billion» Savings and investment = $142.5 billion » Small business development = $1.0 billion » Postsecondary education = $35.3 billion
Nearly $300 of tax expenditures for every $1 of direct outlays

Homeownership Federal asset budget allocates $137.6 billion for
homeownership- all but $1.1 billion through tax expenditures 80% of tax deductions accrue to top 1/5 of taxpayers $1.1 billion in direct outlays vs. $15 billion for rental
assistance programs□ Easier for low-income families to get help paying rent than
for paying a mortgage Many homeowners don’t take the mortgage deduction
because it is not large enough to make a difference in their tax liability.

Savings and Investment
Families need savings to weather crises and provide for future generations
Primary incentives for savings and investment are embedded in the tax code
99.98% of total federal government investment in savings is through tax expenditures □ Reduced tax rates on dividends and long-term capital gains
0.02% is spent on IDAs □ 1/5000 of federal funding for savings and investment

Savings Rate by Income Quintile
Saving by Income Quintile
Lowest Second Third Fourth Fifth Saving as a percent of aftertax
household income (2007) -94.3 -13.6 6.0 18.2 35.9 Percentage of families that saved
(2007) 33.7 45.1 57.8 66.8 78.9
Sources: Department of Labor, Bureau of Labor Statistics; Board of Governors of the Federal Reserve System.

Retirement
78 million workers have no access to a retirement plan at work
Retirement saving is down 10% from 2009 Economic downturn has led to a decreased
contributions from employees and employers Unclear whether federal asset policies around
retirement savings are encouraging new savings For IRAs, government gained more in tax revenue
than gave up in deferred taxes
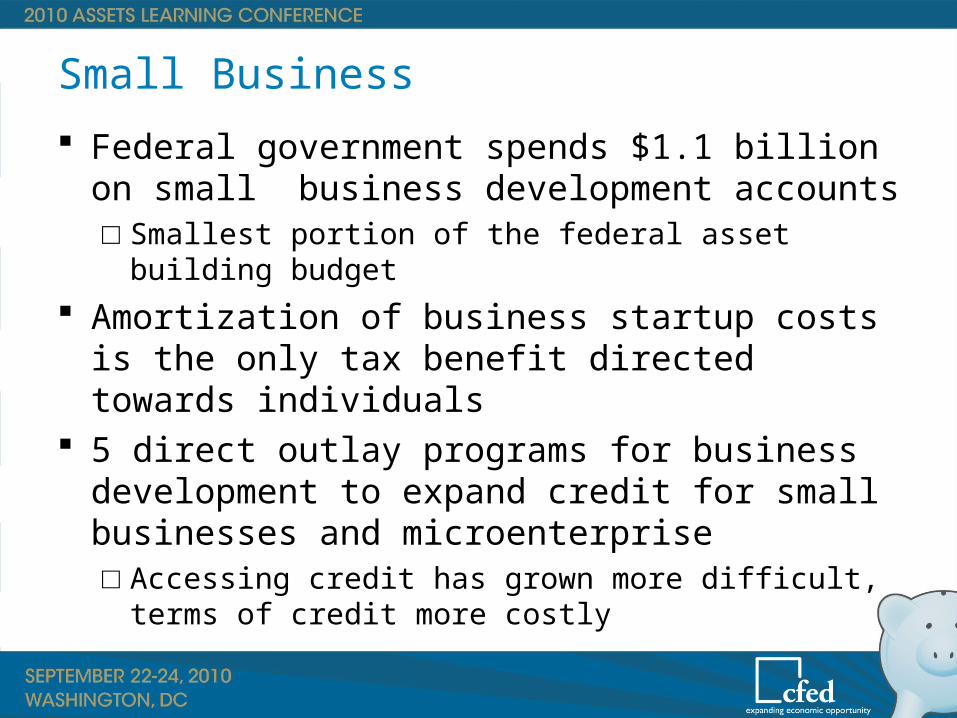
Small Business
Federal government spends $1.1 billion on small business development accounts□ Smallest portion of the federal asset building budget
Amortization of business startup costs is the only tax benefit directed towards individuals
5 direct outlay programs for business development to expand credit for small businesses and microenterprise□ Accessing credit has grown more difficult, terms of credit
more costly

Postsecondary Education
$50 billion in direct outlays and tax expenditures through federal asset budget
Education policies intentionally progressive and skewed towards low-income and moderate-income families
Asset-building opportunities not tied to size of assets Direct expenditures on student aid through the Pell
Grant program accounted for 71% of the total federal asset budget for postsecondary education

Who Benefits?
Many programs are theoretically universal.
Some are specifically aimed at the middle class and the poor.
In practice, however, the data show that the major beneficiaries are those with the most assets already.

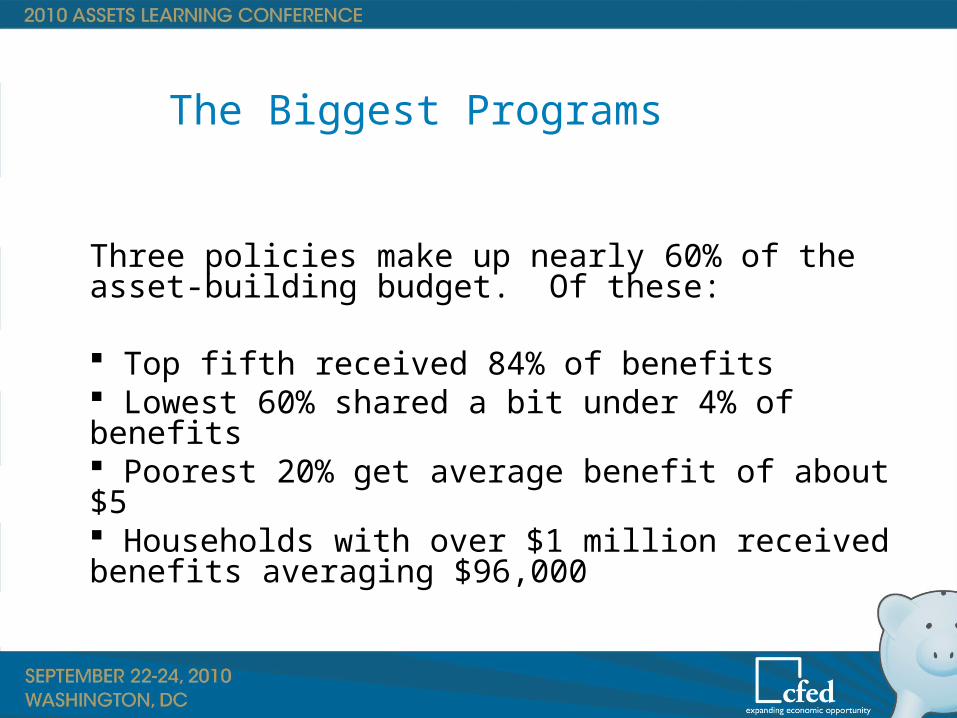
The Biggest Programs
Three policies make up nearly 60% of the asset-building budget.
Mortgage interest deductionProperty tax deductionPreferential rates on capital gains and dividends
The Biggest Programs
Three policies make up nearly 60% of the asset-building budget. Of these:
Top fifth received 84% of benefits Lowest 60% shared a bit under 4% of benefits Poorest 20% get average benefit of about $5 Households with over $1 million received benefits averaging $96,000

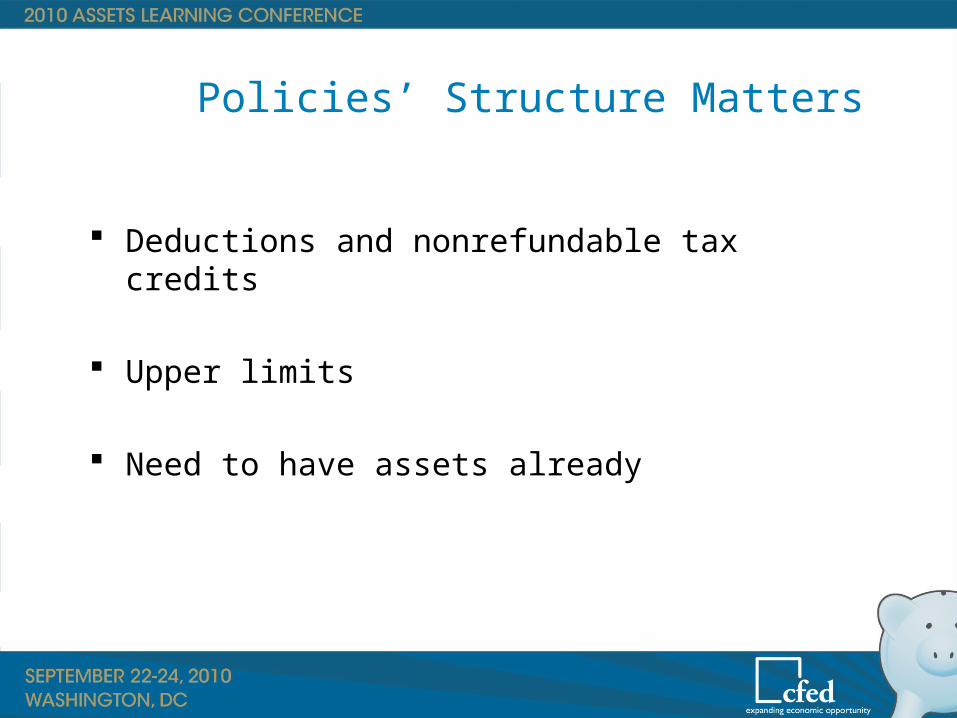
Policies’ Structure Matters
Deductions and nonrefundable tax credits
Upper limits
Need to have assets already

Conclusion
Assets can mean self-sufficiency, upward mobility, and greater economic security.
The federal government already spends at least $384 billion promoting asset-building.
Given the importance of these policies, and the size of this budget, a more deliberate and informed federal asset building policy is now needed.


