IntroductionThis document will describe the correct procedure for measuring upstream linear distortion on a DSP meter. For this example, we will be using the 360 DSP, though the procedure is the same on all DSP meters with DOCSIS cable modems.
Upstream Linear Distortion analysis takes advantage of the pre-equalization function of the CMTS. The feature must be activated in the CMTS prior to testing.
The objective of pre-equalization is to improve upstream performance in the presence of certain RF impairments. These impairments include, but are not limited to, frequency response, micro-reflections, and group delay. The CMTS looks at messages coming from the cable modem and evaluates the signal quality of the messages. If the CMTS determines that the messages can be improved by pre-equalization, the CMTS sends equalizer adjustment values to the cable modem. The cable modem then applies these equalizer adjustment values, called coefficients, to its pre-equalizer. The result is that the cable modem transmits a pre-distorted signal to compensate for impairments between the cable modem and the CMTS.
As the pre-distorted signal traverses the HFC network, it will experience the effects of RF impairments. By the time the pre-distorted signal from the cable modem arrives at the CMTS, it will no longer have any of the original pre-distortion, as the RF impairments will have transformed it back into a near-ideal signal that the CMTS intended to see. These signals are illustrated with time delay equalizer taps and can be evaluated for distance to fault.
Upstream linear distortion analysis takes the EQ taps from the cable modem and displays their values. It also calculates and displays the in channel response and group delay graph.
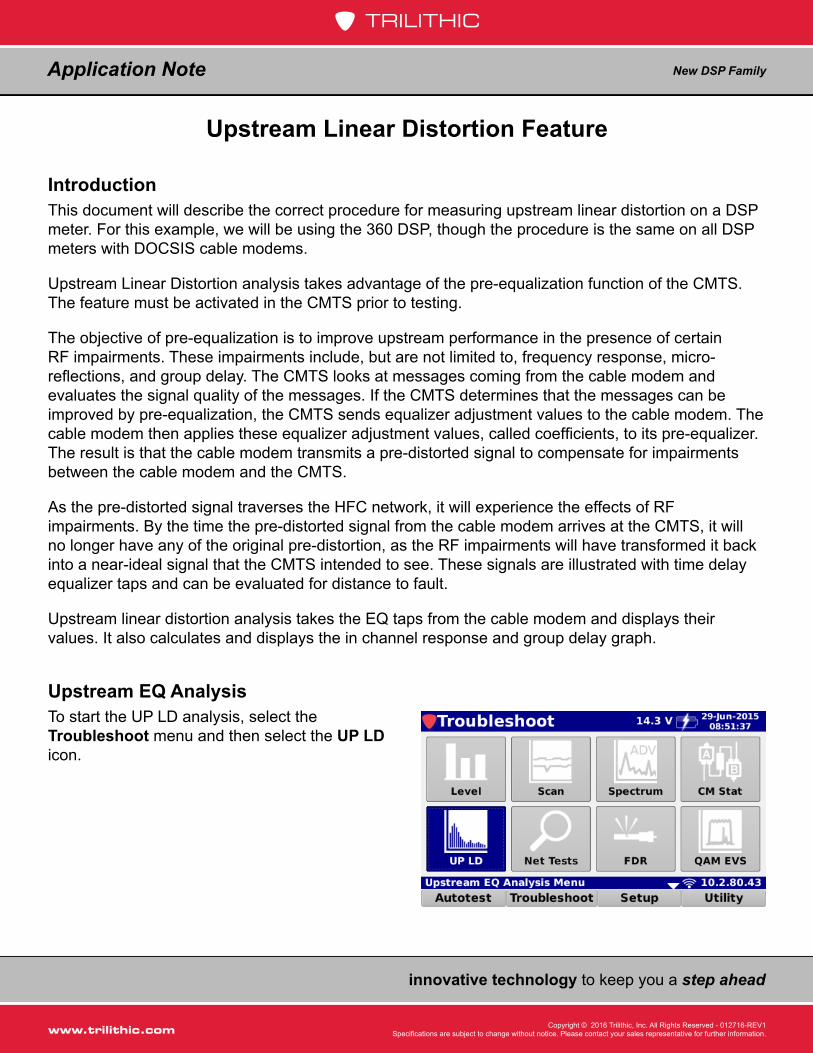
Upstream EQ AnalysisTo start the UP LD analysis, select the Troubleshoot menu and then select the UP LD icon.
innovative technology to keep you a step ahead
www.trilithic.com
innovative technology to keep you a step ahead
www.trilithic.comPage 2
New DSP FamilyApplication Note
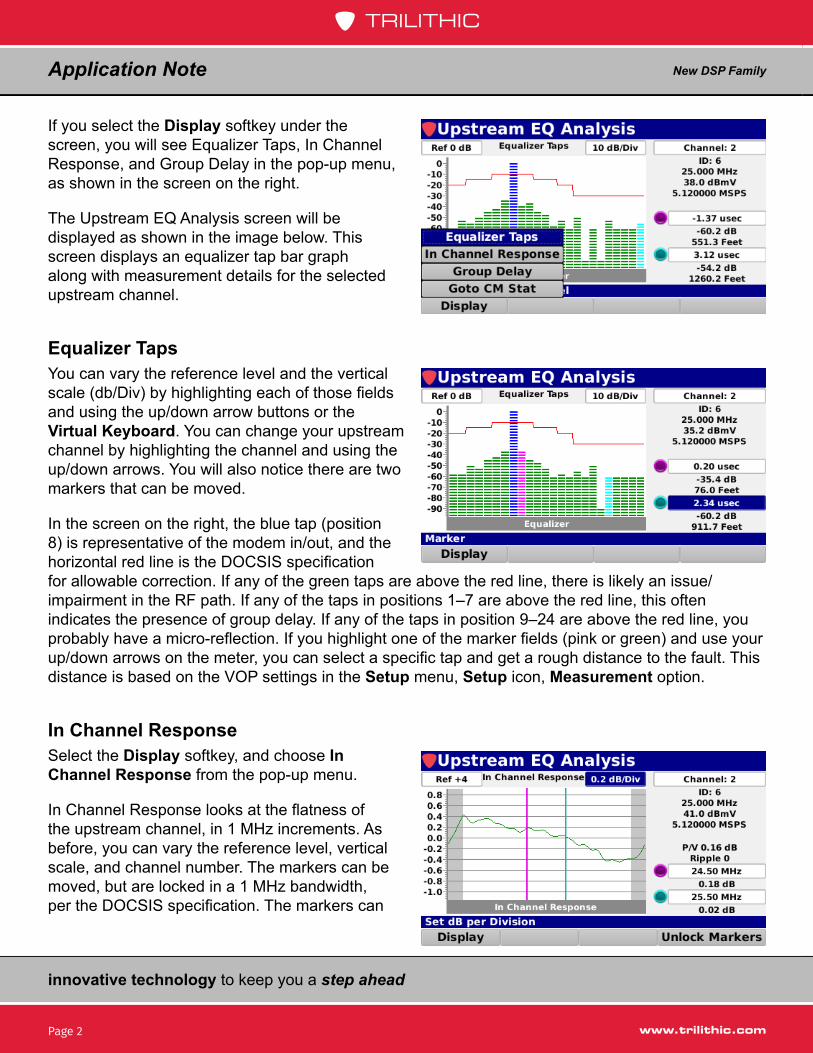
If you select the Display softkey under the screen, you will see Equalizer Taps, In Channel Response, and Group Delay in the pop-up menu, as shown in the screen on the right.
The Upstream EQ Analysis screen will be displayed as shown in the image below. This screen displays an equalizer tap bar graph along with measurement details for the selected upstream channel.
Equalizer TapsYou can vary the reference level and the vertical scale (db/Div) by highlighting each of those fields and using the up/down arrow buttons or the Virtual Keyboard. You can change your upstream channel by highlighting the channel and using the up/down arrows. You will also notice there are two markers that can be moved.
In the screen on the right, the blue tap (position 8) is representative of the modem in/out, and the horizontal red line is the DOCSIS specification for allowable correction. If any of the green taps are above the red line, there is likely an issue/impairment in the RF path. If any of the taps in positions 1–7 are above the red line, this often indicates the presence of group delay. If any of the taps in position 9–24 are above the red line, you probably have a micro-reflection. If you highlight one of the marker fields (pink or green) and use your up/down arrows on the meter, you can select a specific tap and get a rough distance to the fault. This distance is based on the VOP settings in the Setup menu, Setup icon, Measurement option.
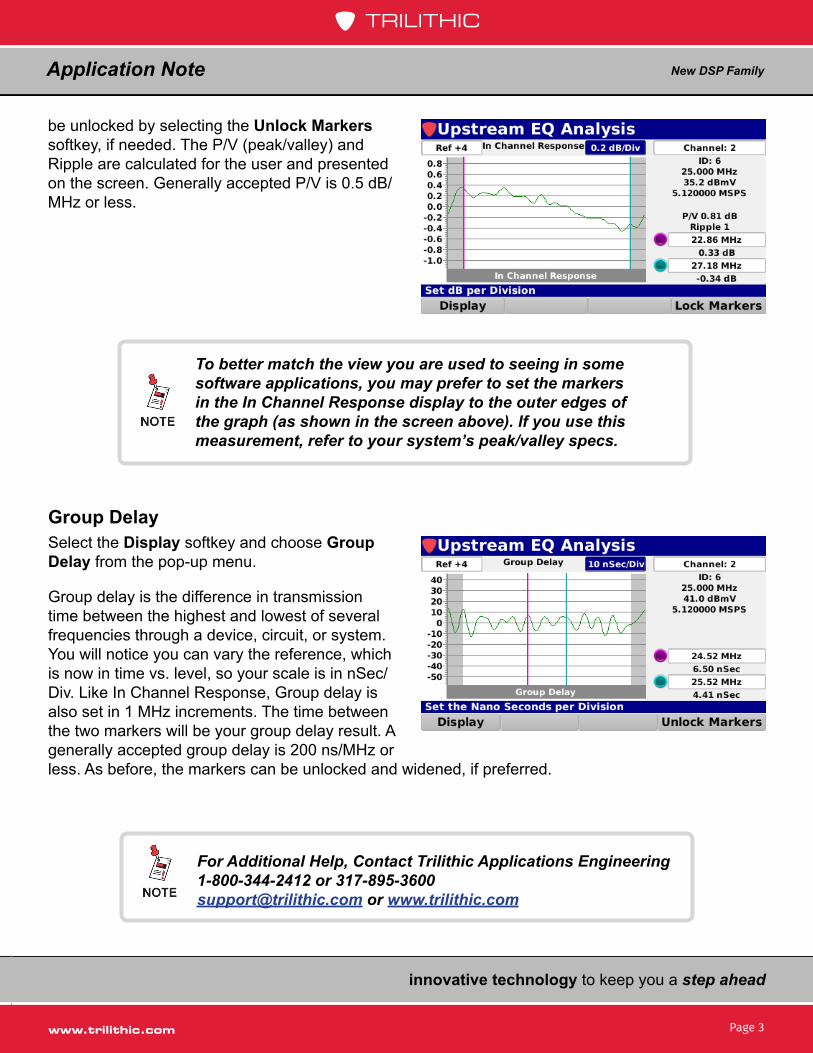
In Channel ResponseSelect the Display softkey, and choose In Channel Response from the pop-up menu.
In Channel Response looks at the flatness of the upstream channel, in 1 MHz increments. As before, you can vary the reference level, vertical scale, and channel number. The markers can be moved, but are locked in a 1 MHz bandwidth, per the DOCSIS specification. The markers can
innovative technology to keep you a step ahead
www.trilithic.com
innovative technology to keep you a step ahead
www.trilithic.com Page 3
New DSP FamilyApplication Note
be unlocked by selecting the Unlock Markers softkey, if needed. The P/V (peak/valley) and Ripple are calculated for the user and presented on the screen. Generally accepted P/V is 0.5 dB/MHz or less.
For Additional Help, Contact Trilithic Applications Engineering 1-800-344-2412 or [email protected] or www.trilithic.com
To better match the view you are used to seeing in some software applications, you may prefer to set the markers in the In Channel Response display to the outer edges of the graph (as shown in the screen above). If you use this measurement, refer to your system’s peak/valley specs.
Group DelaySelect the Display softkey and choose Group Delay from the pop-up menu.
Group delay is the difference in transmission time between the highest and lowest of several frequencies through a device, circuit, or system. You will notice you can vary the reference, which is now in time vs. level, so your scale is in nSec/Div. Like In Channel Response, Group delay is also set in 1 MHz increments. The time between the two markers will be your group delay result. A generally accepted group delay is 200 ns/MHz or less. As before, the markers can be unlocked and widened, if preferred.