52
Natural Energy URANIUM
Natural EnergyURANIUM

Contents
05 Uranium: Australia’s next billion dollar export industry
06 High density energy
08 Australia’s rich endowment
12 Australia: A secure and reliable supplier
19 The opportunity for Australia
22 Creating opportunities: education and training partnerships
24 Releasing uranium’s energy
30 Uranium’s place in nuclear medicine
32 The safe production of uranium
36 Connecting cultures: Kintyre Project Indigenous Land Use Agreement
39 Environmental protection
42 World leading environmental science: Arid Recovery
44 Dispelling uranium myths
Natural EnergyURANIUM
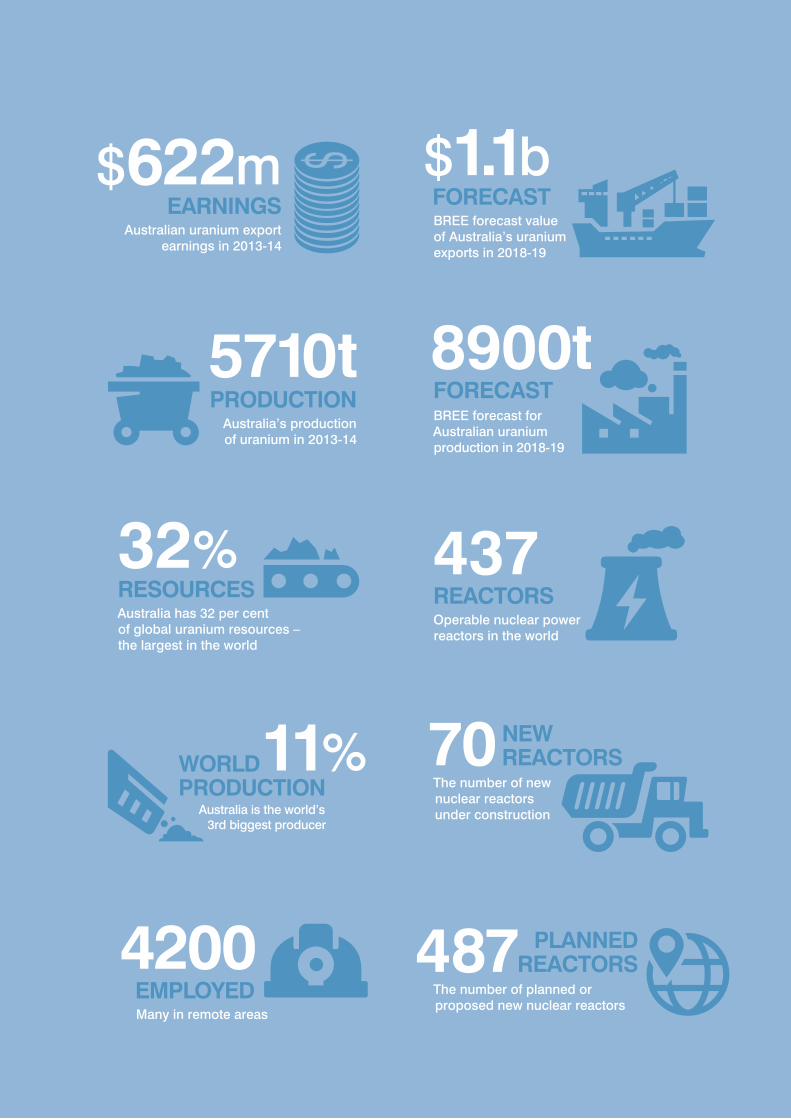
FORECASTBREE forecast value of Australia’s uranium exports in 2018-19
$1.1bEARNINGS
Australian uranium export earnings in 2013-14
$622m
5710tPRODUCTION
Australia’s production of uranium in 2013-14
8900tFORECASTBREE forecast for Australian uranium production in 2018-19
4200EMPLOYEDMany in remote areas
487 PLANNED REACTORS
The number of planned or proposed new nuclear reactors
437REACTORSOperable nuclear power reactors in the world
RESOURCESAustralia has 32 per cent of global uranium resources – the largest in the world
32%
70NEW REACTORS
The number of new nuclear reactors under construction
WORLD PRODUCTION
Australia is the world’s 3rd biggest producer
11%

Underground mining, Olympic Dam, South Australia (BHP Billiton)

5Uranium: Natural Energy
AUSTRALIA IS ENDOWED WITH THE WORLD’S LARGEST RESOURCES OF URANIUM AND IS THE WORLD’S THIRD BIGGEST EXPORTER.1
The Bureau of Resources and Energy Economics (BREE) forecasts that uranium will be a billion dollar Australian export industry by 2018-192, fuelled by the world’s growing demand for energy and rising interest in nuclear energy as a low emissions energy source.
BREE predicts that the combination of nuclear energy’s ability to provide reliable base load power, relatively cheap operating costs and low carbon emissions will see ‘substantial expansion in nuclear power generating capacity, particularly in emerging economies’.3
Beyond energy production, uranium will continue to support the use of nuclear technology in medicine for life saving diagnosis and treatment.
Australia is well placed to capitalise on this demand growth and expand its role as a secure, reliable and sustainable uranium producer. While it possesses approximately a third of the world’s low-cost uranium, Australia has claimed only 11 per cent of the world uranium market.4
A substantial opportunity awaits.
URANIUM: AUSTRALIA’S NEXT BILLION DOLLAR INDUSTRY

6 Minerals Council of Australia
HIGH DENSITY ENERGY
Uranium is mildly radioactive in its natural form and is present in most rocks as well as in rivers, streams and oceans. It is about as common as tin and is more abundant than gold, silver or mercury.5
Generally speaking, uranium mining is no different to other mining.
Uranium ore is mined in open cut or underground operations (sometimes with other metals such as gold and copper) or through in-situ recovery from boreholes drilled into the deposit. It is processed into uranium oxide (U3O8).
URANIUM IS THE HEAVIEST NATURALLY OCCURRING METAL IN THE EARTH’S CRUST.
The energy content of uranium oxide6
drum of uranium oxide1

7Uranium: Natural Energy
Uranium oxide has a uranium content of more than 80 per cent. It is sometimes referred to as yellowcake, though it is usually khaki in colour. This is the form in which Australia exports its uranium.
Uranium has extremely high energy density meaning a small amount of uranium can generate a large amount of energy. One kilogram of uranium produces the same energy as 11 tonnes of coal or 8,500 m3 of natural gas.8 Wind has low energy density – less than 1/10th that of wood. Wood has half the density of coal. Coal has half the density of octane.
The release of energy from splitting a uranium atom is 2 million times greater than breaking the carbon-hydrogen bond in molecules of wood, coal or oil.9
In 2012-13, Australia exported 8,391 tonnes of uranium oxide. This amount of uranium generated the same amount of electricity as Australia’s total annual electricity production of 253TWh, and in energy units, was more than a quarter of Australia’s exported energy.
The annual output of the world’s largest solar farm or the southern hemisphere’s largest wind farm can come from approximately just two shipping containers of uranium oxide.7
Macarthur Wind FarmIvanpah Solar Electric Generating System (SEGS)
Location: Mojave Desert, California
Footprint: 3,500 acres
Build cost: $2.2 billion
Capacity: 392 MW
Location: Victoria, Australia
Footprint: 5,500 acres
Build cost: $1 billion
Capacity: 420MW (140 x 3MW turbines)
1,835 av Australian households for one year

Australia’s uranium resource accounts for 32 per cent (1,174 kt) of global Reasonably Assured Resources (RAR).10
South Australia hosts 80 per cent of Australia’s resources. The Northern Territory has 10 per cent, Western Australia 6 per cent, Queensland 3 per cent and New South Wales 1 per cent.
Around 9 per cent of Australia’s economic demonstrated resources of uranium are inaccessible for mining:
• The Jabiluka deposit is under a long-term care and maintenance agreement and will not be mined without agreement from the Traditional Owners
AUSTRALIA’S RICH ENDOWMENTAUSTRALIA HAS 90 KNOWN URANIUM DEPOSITS AND THE WORLD’S LARGEST URANIUM RESOURCE.
• The World Heritage Committee added the Koongarra Project Area to the Kakadu World Heritage Area in 2011 and the Australian Government incorporated the deposit into Kakadu National Park in 2013.12
Nevertheless, Australia’s uranium resources have increased in recent decades, mainly as a result of ongoing drilling and evaluation of known deposits including Olympic Dam, Ranger 3 Deeps, the Beverley-Four Mile deposits, and deposits at Wiluna, Yeelirrie, Carnarvon and Westmoreland.

Source: Joint report by the OECD Nuclear Energy Agency and the International Atomic Energy Agency11
CHART 1 World Reasonably Assured Resources (RAR)
Note: Recoverable resources as of 1 January 2013, tonnes U RAR < USD 130/kgU (i.e. approx. US$59/lbU).
Other
Ukraine
Mongolia
China
Brazil
South Africa
United States
Russian Federation
Namibia
Kazakhstan
Niger
Canada
Australia
241.1
84.8
108.1
120
155.1
175.3
207.4
216.5
248.2
285.6
325
357.5
1,174
0 200 400 600 800 1,000 1,200Quantity (kt)
Ranger uranium mine, Northern Territory (Energy Resources of Australia)

10 Minerals Council of Australia
Uranium resources by state
Sou
th A
ustr
alia
Nor
ther
n Te
rrito
ry
Wes
tern
Aus
tral
ia
Que
ensl
and
New
Sou
th W
ales
80% 10% 6% 3% 1%
DARWIN
BRISBANE
ADELAIDE
HOBART
PERTH
MELBOURNE
CANBERRA
SYDNEY
Hillview
ManyingeeKintyre
Bigrlyi
SkalValhalla
Red Tree
Carley Bore
Lake Way
Thatcher SoakOlympic Dam
NapperbyCappers
Nolans Bone
Huarabagoo
Jabiluka
RangerKoongarra
Junnagunna
Andersons Lode
Oobagooma
Ben Lomond
Maureen
E1
Angela
Warrior
Carrapateena
Blackbush Crocker Well
Honeymoon
Toongi
Four Mile EastFour Mile WestBeverley
Oban
Mulga Rock
Double 8
Nowthanna
Anketell
Yeelirrie
0 750 km
1,500 – 3,000 (t)
3,000 – 10,000 (t)
10,000 – 50,000 (t)
50,000 – 1,000,000 (t)
>1,000,000 (t)
CHART 2 Uranium resource range (tonnes U) Total identified resources (RAR + Inferred)
Source: Geoscience Australia

11Uranium: Natural Energy
Exploration
Uranium exploration in Australia has been focused in four main areas:
• South Australia’s Gawler Craton/Stuart Shelf and Frome Embayment
• Western Australia’s Paterson Province, North Yilgarn and the Carnarvon and Canning Basins
• Northern Territory’s Pine Creek and Arnhem Land regions
• Queensland’s Mt Isa and Gulf of Carpentaria regions.13
According to the Australian Bureau of Statistics, uranium exploration expenditure in Australia was $52.3 million in 2013.14
The potential for new uranium discoveries in Australia is high. Geoscience Australia and the Bureau of Resources and Energy Economics reported in the most recent Australian Energy Resource Assessment:
New pre-competitive data released by Geoscience Australia – notably the radiometric map of Australia and regional electromagnetic survey data – are providing a further stimulus to uranium exploration and discovery.15
Source: Australian Bureau of Statistics
CHART 3 Uranium exploration expenditure in Australia
Exploration expenditure $m (LHS)
Share of uranium in total exploration expenditure (RHS)
1994
2002
1998
2006
2010
1995
2003
1999
2007
2011
2012
2013
1992
2000
1996
2004
2008
1993
2001
1997
2005
2009
1991
1990
$m
250
200
150
100
50
0
10
9
8
7
6
5
4
3
2
1
0
%
12 Minerals Council of Australia
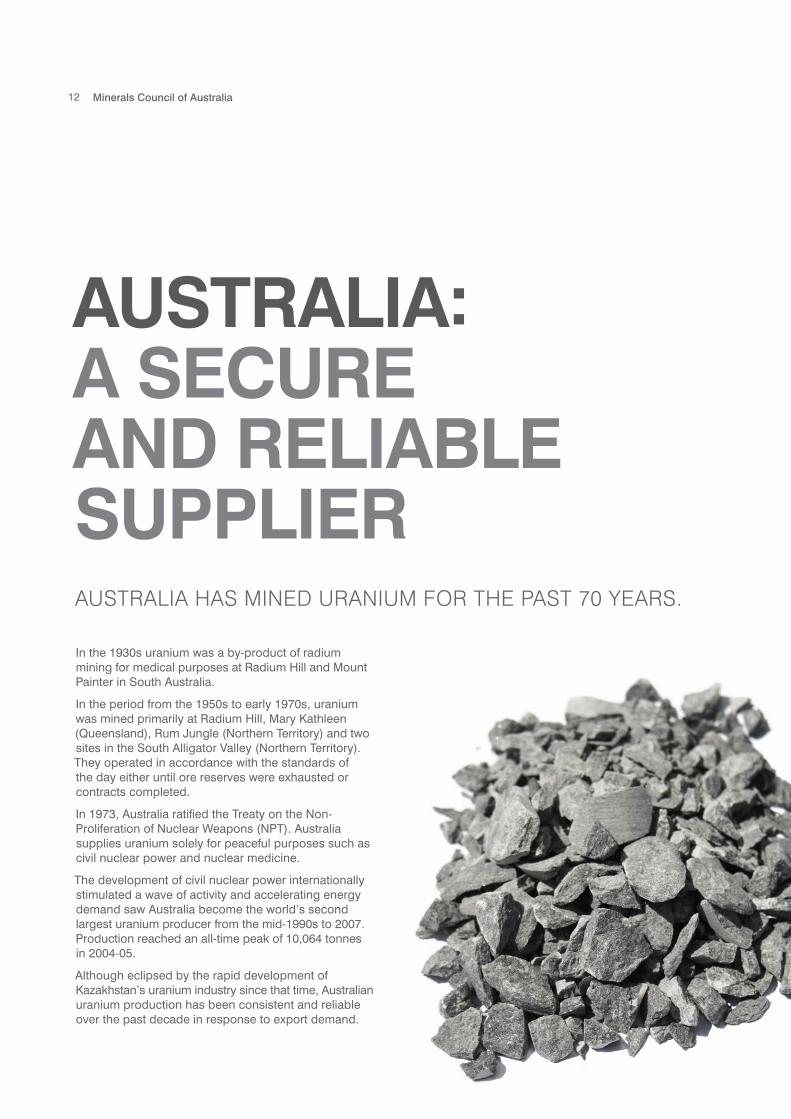
In the 1930s uranium was a by-product of radium mining for medical purposes at Radium Hill and Mount Painter in South Australia.
In the period from the 1950s to early 1970s, uranium was mined primarily at Radium Hill, Mary Kathleen (Queensland), Rum Jungle (Northern Territory) and two sites in the South Alligator Valley (Northern Territory). They operated in accordance with the standards of the day either until ore reserves were exhausted or contracts completed.
In 1973, Australia ratified the Treaty on the Non-Proliferation of Nuclear Weapons (NPT). Australia supplies uranium solely for peaceful purposes such as civil nuclear power and nuclear medicine.
The development of civil nuclear power internationally stimulated a wave of activity and accelerating energy demand saw Australia become the world’s second largest uranium producer from the mid-1990s to 2007. Production reached an all-time peak of 10,064 tonnes in 2004-05.
Although eclipsed by the rapid development of Kazakhstan’s uranium industry since that time, Australian uranium production has been consistent and reliable over the past decade in response to export demand.
AUSTRALIA: A SECURE AND RELIABLE SUPPLIERAUSTRALIA HAS MINED URANIUM FOR THE PAST 70 YEARS.

13Uranium: Natural Energy
Source: World Nuclear Association
CHART 4 Global uranium production, 2013 (tU)
25,000
20,000
15,000
10,000
5,000
2002
2005
2008
2003
2006
2009
2004
2007
2010
2011
2012
2013
Kazakhstan Canada Other Australia Niger Namibia Russia
Stockpile ore, Ranger uranium mine, Northern Territory (Energy Resources of Australia)

14 Minerals Council of Australia
Uranium is Australia’s second largest primary energy fuel type produced.16 Production operates under a best practise regulatory framework reflecting modern expectations of environmental, employee and public safety standards.
Geoscience Australia projects that in the medium to long term, Australia’s uranium production is expected to increase significantly.17 The Bureau of Resources
and Energy Economics and Geoscience Australia attribute this growth to Australia’s ‘stable commercial environment’ and ‘large low cost uranium resources, proposed new mines and increasing export demand’.18
The Australian uranium industry is assessing the feasibility of significant capital investment to expand existing mines and develop new projects. This investment is outlined in Table 2.
Projects Company State Start-up
Production capacity
(kt/U3O8/year)
Capital expenditure ($A million
nominal) Current status
Olympic Dam 1999 expansion
BHP Billiton SA 1999 4.3 1940a Operating
Beverley ISR mine Heathgate Resources SA 2001 1.0 30
Not producing but processing loaded resin from Four Mile ISR well fields
Ranger radiometric sorting plant
Energy Resources of Australia
NT 2008 1.1 19 Operational
Ranger laterite plantEnergy Resources of Australia
NT 2009 0.4 44 Operating
Beverley North satellite ISR operations
Heathgate Resources SA 2011 b b
Not currently operating. The Pannikan Satellite Plant is currently used to load Four Mile uranium on resin for processing at Beverley
Honeymoon ISR mine Uranium One SA 2011 0.34 146Care and Maintenance 1 April 2014
Four Mile ISRQuasar Resources and Alliance Craton Explorer Joint Venture
SA 2014 c 120 Operating
a Capital expenditure covers total expansion of copper-gold-uranium-silver mining.b Uranium-bearing resins from Beverley North ISR operations was processed at the Beverley plant to recover uranium. c Uranium-bearing resins from Four Mile ISR operation is processed at the Beverley plant to recover uranium.
Source: Australian Bureau of Agriculture and Resource Economics and Bureau of Resources and Energy Economics
TABLE 1 Australian mines

15Uranium: Natural Energy
Source: Australian Bureau of Agriculture and Resource Economics and Bureau of Resources and Energy Economics, Draft EIS Energy Resources of Australia, Toro Energy Ltd ASX Release 31 Jan 2014, Energy and Minerals Australia Limited (Vimy Resources Limited) company presentation June 2013,
Energy and Minerals Australia Limited (Vimy Resources Limited) company presentation Oct 2014
TABLE 2 Uranium development projects
Project Company Location Status
Potential production
start
Capacity (kt/U3O8/year
– nominal)
Capital ($A million – nominal)
Ranger 3 DeepsEnergy Resources of Australia
East of Darwin, NT
Pre-feasibility study underway, application for EIS underway
20152.5 – 3.6 (incl.
production from stockpiled LG ore)
250 – 500
Wiluna Toro EnergySouth-east of Wiluna, WA
Feasibility study completed, environmental approvals granted
2017 1.0 315
Yeelirrie CamecoNorth of Kalgoorlie, WA
Under evaluation 2020+ 3.5 NA
KintyreCameco/Mitsubishi Development
North-east of Kalgoorlie, WA
Recommended approval by WA EPA, under appeal awaiting Ministerial decision
2018+ 3.6 500 – 1,000
Mulga RockVimy Resources
North-east of Kalgoorlie, WA
Feasibility study underway 2017+ 1.4 <300
ValhallaSummit Resources/ Paladin Energy
North of Mt Isa, QLD
On hold, QLD Government recently removed the ban on uranium mining
2018+ 4.1 250 – 500
WestmorelandLaramide Resources
North-west of Burketown, QLD
On hold as for Valhalla 2018+ 1.4 250 – 500
Olympic Dam Expansion
BHP BillitonRoxby Downs, SA
Pre-feasibility study completed. Company announced that it would delay the expansion and investigate an alternative less capital-intensive design
NA NA NA
In the medium to long term, Australia’s uranium production will increase significantly, reflecting Australia’s large low cost uranium resources, proposed new mines and increasing export demand.
16 Minerals Council of Australia
Exports
All of Australia’s uranium production is exported. Stringent bilateral agreements specify that Australian uranium may only be used for peaceful purposes in civilian nuclear power reactors to generate electricity, and in other peaceful applications such as the manufacture of radioisotopes for medical applications.
These safeguards agreements ensure the countries to which Australia exports are committed to International Atomic Energy Agency (IAEA) requirements and international nuclear security standards.
Australian mining companies supply uranium under contracts to electricity utilities in the United States, Japan, China, the Republic of Korea, Taiwan and Canada as well as members of the European Union including France, Germany, Sweden and Belgium.
The latest country to sign a civil Nuclear Cooperation Agreement with Australia was India in September 2014, following agreements with Russia in 201019 and the United Arab Emirates in 2012. The UAE’s civil nuclear power program is expected to begin operation in 2017.
Permits to export uranium are issued by the Department of Industry.
The Australian Safeguards and Non-Proliferation Office (ASNO) within the Department of Foreign Affairs and Trade (DFAT) ensures the effective operation of the Australian safeguards system, the physical protection and security of nuclear material and items in Australia. It carries out Australia’s obligations under Australia’s nuclear cooperation agreements with other countries and Euratom, and operates Australia’s bilateral nuclear
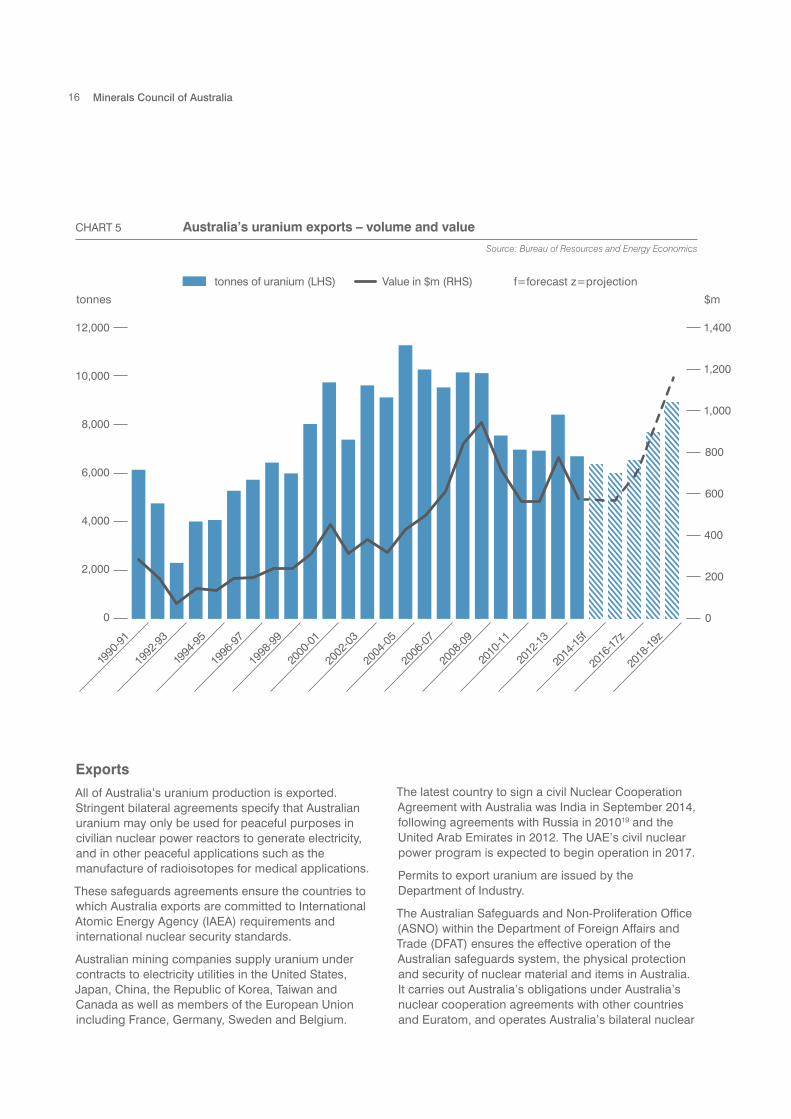
Source: Bureau of Resources and Energy Economics
CHART 5 Australia’s uranium exports – volume and value
1990
-91
2002
-03
1992
-93
2004
-05
1994
-95
2006
-07
1996
-97
2008
-09
2014
-15f
1998
-99
2010
-11
2016
-17z
2000
-01
2012
-13
2018
-19z
tonnes
12,000
10,000
8,000
6,000
4,000
2,000
0
1,400
1,200
1,000
800
600
400
200
0
$m
f=forecast z=projection tonnes of uranium (LHS) Value in $m (RHS)

17Uranium: Natural Energy
cooperation agreements and monitors compliance with the provisions of these agreements.20
Australia’s uranium exports totalled 6,701 tonnes in 2013-14. Export values totalled $622 million.21 These results reflected production disruption at Ranger in the Northern Territory and lower global uranium prices.
In the past decade (2003 to 2013), uranium mining has contributed more than $6.5 billion in export revenue to the Australian economy.
Supported by growing production and world demand, Australia’s uranium export volumes are projected to increase at an average annual rate of 10 per cent to total 8,900 tonnes in 2018-19. Export values are projected to increase at an average annual rate of 17 per cent to total $1.1 billion in 2018-19 (in 2014-15 dollars).22
In the past decade, uranium mining has contributed more than
$6.5 billion in export revenue to the Australian economy.
Exporting uranium to the world
Australian mining companies supply uranium to electricity utilities in:
The Australian Government also has civil Nuclear Cooperation Agreements with:
United States
Japan
China
Republic of Korea
Taiwan
Canada
France
Germany
Sweden
Belgium
India (2014)
UAE (2012)
Russia (2010)

Kintyre camp, East Pilbara, Western Australia (Cameco Australia)

19Uranium: Natural Energy
Australia’s uranium industry generates approximately $620 million per annum in export revenue and approximately 4,000 jobs21, based on capturing just 11 per cent share of the global uranium market. Yet, Australia possesses 32 per cent of the world’s uranium resources. Based on today’s demand, if Australia produced in line with its endowment, exports would be closer to $2 billion per annum generating potentially 10,000 jobs.
The factors that will affect realising the potential of expanding Australian uranium production and exports include:
• Political support for the generation of employment and export earnings
• Significant investment in exploring for new uranium discoveries
• The commercial feasibility of undeveloped deposits
• Creating improved access to port and shipping company options for exporting uranium
• Uranium mining prohibitions being lifted in New South Wales and Victoria.24
There are several major undeveloped deposits that may be developed if proven economically feasible and necessary approvals granted. Table 3 summarises the total ore reserves and mineral resources of the main undeveloped deposits as reported by resources companies.
THE OPPORTUNITY FOR AUSTRALIAAUSTRALIA IS A RELIABLE AND SECURE SUPPLIER OF URANIUM TO THE WORLD MARKET AND IS WELL PLACED TO MEET A SIGNIFICANT PROPORTION OF THE INCREASED DEMAND FOR URANIUM FOR USE AS AN ENERGY RESOURCE.

20 Minerals Council of Australia
DepositsOre Reserves contained U308 (kt)
Minerals Resources contained U308 (kt)
Northern Territory
Jabiluka 2 67.70 73.94
Koongarra 22.30
Bigrlyi 9.60
Angela 9.89
South Australia
Four Mile West 18.70
Crocker Well and Mt. Victoria 6.74
Queensland
Valhalla 34.6
Westmoreland (Redtree, Junnagunna, Huarabagoo, Sue & Outcamp) 25.12
Mt. Isa Region (Skal, Odin, Bikini, Andersons, Watta, Warwai, Mirrioola) 29.70
Western Australia
Yeelirrie 52.50
Kintyre 29.39
Mulga Rock 28.30
Manyingee 10.90
Oobagooma 9.95
Wiluna (Centipede, Lake Way, Millipede, Dawson-Hinkler, Lake Maitland, Nowthanna)
34.65
Bennett Well 8.30
Total 67.70 404.58
Note: Ore reserves and mineral resources are company estimates.
Source: Geoscience Australia, company reports, presentations and independent assessments
TABLE 3 Major undeveloped uranium deposits in Australia
21Uranium: Natural Energy
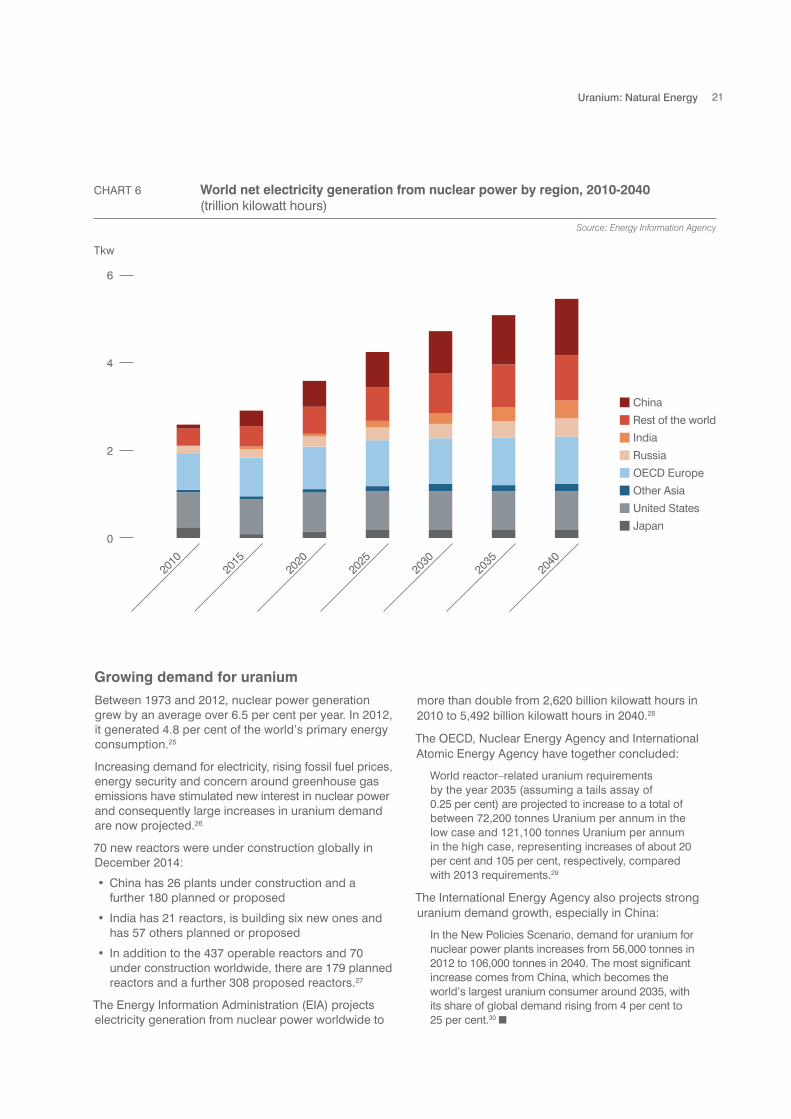
Growing demand for uranium
Between 1973 and 2012, nuclear power generation grew by an average over 6.5 per cent per year. In 2012, it generated 4.8 per cent of the world’s primary energy consumption.25
Increasing demand for electricity, rising fossil fuel prices, energy security and concern around greenhouse gas emissions have stimulated new interest in nuclear power and consequently large increases in uranium demand are now projected.26
70 new reactors were under construction globally in December 2014:
• China has 26 plants under construction and a further 180 planned or proposed
• India has 21 reactors, is building six new ones and has 57 others planned or proposed
• In addition to the 437 operable reactors and 70 under construction worldwide, there are 179 planned reactors and a further 308 proposed reactors.27
The Energy Information Administration (EIA) projects electricity generation from nuclear power worldwide to
more than double from 2,620 billion kilowatt hours in 2010 to 5,492 billion kilowatt hours in 2040.28
The OECD, Nuclear Energy Agency and International Atomic Energy Agency have together concluded:
World reactor–related uranium requirements by the year 2035 (assuming a tails assay of 0.25 per cent) are projected to increase to a total of between 72,200 tonnes Uranium per annum in the low case and 121,100 tonnes Uranium per annum in the high case, representing increases of about 20 per cent and 105 per cent, respectively, compared with 2013 requirements.29
The International Energy Agency also projects strong uranium demand growth, especially in China:
In the New Policies Scenario, demand for uranium for nuclear power plants increases from 56,000 tonnes in 2012 to 106,000 tonnes in 2040. The most significant increase comes from China, which becomes the world’s largest uranium consumer around 2035, with its share of global demand rising from 4 per cent to 25 per cent.30
CHART 6 World net electricity generation from nuclear power by region, 2010-2040 (trillion kilowatt hours)
Source: Energy Information Agency
6
4
2
0
China
Rest of the world
India
Russia
OECD Europe
Other Asia
United States
Japan
2010
2015
2020
2025
2030
2035
2040
Tkw

Creating opportunities through partnershipsLOCAL PARTNERSHIPS ARE CREATING OPPORTUNITIES FOR STUDENTS THROUGH A SCHOOL-BASED APPRENTICESHIP PROGRAM.
An education partnership between Energy Resources of Australia (ERA), the Northern Territory Department of Education and the West Arnhem College is delivering opportunities for students to advance from apprenticeships to traineeships and employment in the uranium industry.
Under the education partnership, ERA actively engages in the schools-based apprentice program to identify and skill tradespeople from the local region.
Seven students from West Arnhem College joined the ERA workforce in 2014 as part of a successful school-based apprenticeships and traineeships education partnership.
For the first time, two Year 12 graduates from West Arnhem College’s Gunbalanya campus, Jai Nabulwad and Kristy Garnarradj, commenced full-time traineeships at ERA. Both Jai and Kristy had previously completed work experience at ERA, and the quality education and training opportunities have led to real employment and career options. The other five students recently commenced school-based apprenticeships with ERA.
College Director Mark Monaghan said the annual intake offers part-time instruction for school-based
apprentices, and full-time employment for trainees, at the Ranger mine.
‘The school-based apprentices are senior students who train at the mine for two days each week, and study at the West Arnhem College Jabiru campus. After they finish Year 12 the apprentices may go on to train with ERA full-time,’ he said.
‘West Arnhem College has trade training centres at Jabiru and Gunbalanya campuses and trainers to complement ERA’s on the job instruction.’
In July 2014 two school-based apprentices from the Northern Territory’s remote Cobourg Peninsula were given a unique opportunity to explore tertiary education opportunities and life away from home.
Siblings Tristan and Shierese Cunningham (pictured) flew to Trinity College, Melbourne with West Arnhem College Child and Family Leader Michelle McColm to participate in a Young Leaders Social Justice Program.
The visit was an extension of Trinity College’s established Indigenous programs and has allowed the students to experience university life first-hand.
Box 1 Education and training partnerships

Box 1 Education and training partnerships
Seven students from West Arnhem College joined the ERA workforce in 2014 as part of a
successful school-based apprenticeships and traineeships education partnership.
ERA school-based apprentices Tristan Cunningham and Shierese Cunningham travel to Trinity College with West Arnhem College Child and Family Leader Michelle McColm

24 Minerals Council of Australia
99.3 per cent of uranium is U-238. Most of the balance is U-235. Both are mildly radioactive. Naturally occurring uranium is typically milled at the mine site to produce uranium oxide. This is the form in which Australia exports uranium.
The nuclear energy cycle begins with the conversion of uranium oxide into uranium hexafluoride gas (UF6). The UF6 gas is drained into 14-tonne metal cylinders and then delivered to the enrichment plant. Although some reactors do not require uranium to be enriched, for most reactors the concentration of the U-235 isotope needs to be enriched from 0.7 per cent to between 3.5 and 5 per cent U-235.
At the enrichment plant, the difference in physical properties of U-238 and U-235 is used to separate the UF6 gas into two streams: U-235 is enriched to the required level with the end product known as low-enriched uranium. The other product stream from the enrichment process is depleted in U-235 and is called ‘tails’, or simply depleted uranium. The enriched uranium is taken to a fuel fabrication facility where it is pressed and ’baked’ at 1,400°C. (UO2’s melting point is 2,865°C.) The pellets are then encased in metal tubes to form fuel rods and arranged into a fuel assembly ready for introduction into a reactor.
Inside the nuclear reactor, the uranium fuel is assembled in such a way that a controlled fission chain reaction can be achieved. The heat created by splitting the U-235 atoms is then used to make steam which spins a turbine to drive a generator, producing electricity.32
RELEASING URANIUM’S ENERGY‘Our future prosperity depends on cheap abundant reliable supplies of electricity...Nuclear’s power-density advantages simply cannot be ignored.’
Robert BryceSenior Fellow, Center for Energy Policy and the Environment, Manhattan Institute31

25Uranium: Natural Energy
Most countries currently using nuclear power use an ‘open fuel cycle’ also known as ‘once through’ cycle. Fuel is used in the reactor to generate power, then removed from the reactor during periodic refuelling. As spent fuel is initially highly radioactive and self-heating, it is stored in dedicated water ponds for some years to allow the radioactivity to decline and the material to cool sufficiently for long-term storage. After a period
of three years or more, the spent fuel assemblies may be moved to ‘dry storage’ to await final deep geological disposal. In some countries, such as France, the spent fuel is reprocessed, with the uranium and plutonium being removed for reuse in fresh fuel and the remaining waste products being solidified for final deep geological disposal.33
Source: Australian Government, Department of the Prime Minister and Cabinet
CHART 7 Schematic of the nuclear fuel cycle
Conversion
Fuel fabrication
Electricity
Spent fuel storage
Power plant
High-level waste
Recycle
Enrichment
Milling
Mining
Reprocessing
For natural uranium fuels
26 Minerals Council of Australia
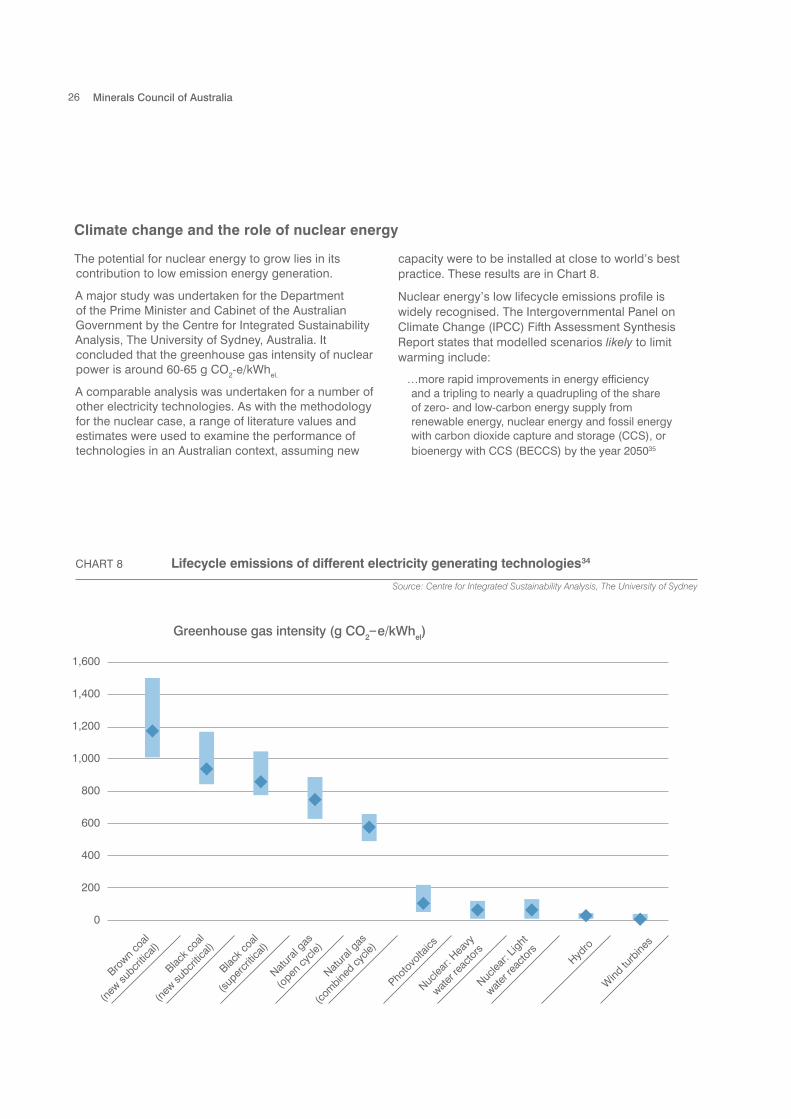
The potential for nuclear energy to grow lies in its contribution to low emission energy generation.
A major study was undertaken for the Department of the Prime Minister and Cabinet of the Australian Government by the Centre for Integrated Sustainability Analysis, The University of Sydney, Australia. It concluded that the greenhouse gas intensity of nuclear power is around 60-65 g CO2-e/kWhel.
A comparable analysis was undertaken for a number of other electricity technologies. As with the methodology for the nuclear case, a range of literature values and estimates were used to examine the performance of technologies in an Australian context, assuming new
capacity were to be installed at close to world’s best practice. These results are in Chart 8.
Nuclear energy’s low lifecycle emissions profile is widely recognised. The Intergovernmental Panel on Climate Change (IPCC) Fifth Assessment Synthesis Report states that modelled scenarios likely to limit warming include:
…more rapid improvements in energy efficiency and a tripling to nearly a quadrupling of the share of zero- and low-carbon energy supply from renewable energy, nuclear energy and fossil energy with carbon dioxide capture and storage (CCS), or bioenergy with CCS (BECCS) by the year 205035
Source: Centre for Integrated Sustainability Analysis, The University of Sydney
CHART 8 Lifecycle emissions of different electricity generating technologies34
Brown c
oal
(new
subcr
itical)
Black c
oal
(new
subcr
itical)
Black c
oal
(super
critic
al)
Natura
l gas
(open
cycle
)
Natura
l gas
(com
bined cy
cle)
Nuclea
r: Hea
vy
water r
eacto
rs
Nuclea
r: Lig
ht
water r
eacto
rs
Photo
volta
ics
Wind
turb
ines
Hydro
Greenhouse gas intensity (g CO2–e/kWhel)
1,600
1,400
1,200
1,000
800
600
400
200
0
Climate change and the role of nuclear energy
27Uranium: Natural Energy
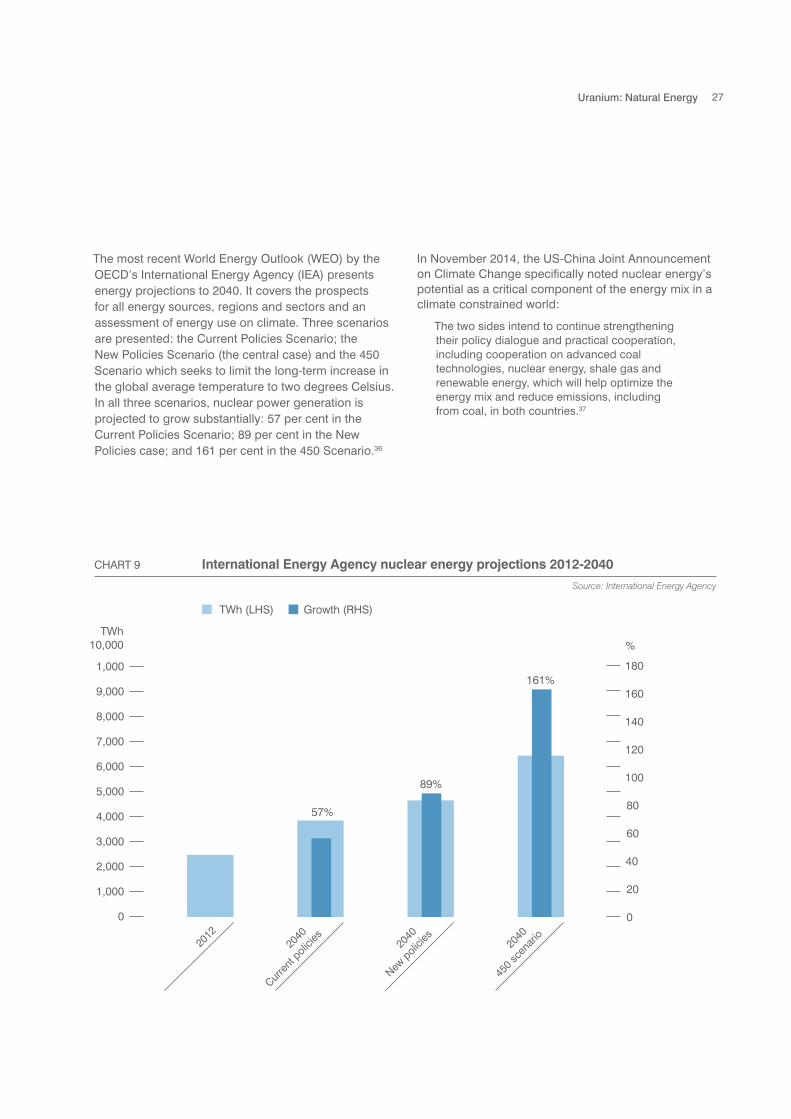
The most recent World Energy Outlook (WEO) by the OECD’s International Energy Agency (IEA) presents energy projections to 2040. It covers the prospects for all energy sources, regions and sectors and an assessment of energy use on climate. Three scenarios are presented: the Current Policies Scenario; the New Policies Scenario (the central case) and the 450 Scenario which seeks to limit the long-term increase in the global average temperature to two degrees Celsius. In all three scenarios, nuclear power generation is projected to grow substantially: 57 per cent in the Current Policies Scenario; 89 per cent in the New Policies case; and 161 per cent in the 450 Scenario.36
In November 2014, the US-China Joint Announcement on Climate Change specifically noted nuclear energy’s potential as a critical component of the energy mix in a climate constrained world:
The two sides intend to continue strengthening their policy dialogue and practical cooperation, including cooperation on advanced coal technologies, nuclear energy, shale gas and renewable energy, which will help optimize the energy mix and reduce emissions, including from coal, in both countries.37
Source: International Energy Agency
CHART 9 International Energy Agency nuclear energy projections 2012-2040
TWh (LHS) Growth (RHS)
1,000
9,000
8,000
7,000
6,000
5,000
4,000
3,000
2,000
1,000
0
2040
Curre
nt p
olicie
s20
40
New p
olicie
s20
40
450 s
cena
rio2012
180
160
140
120
100
80
60
40
20
0
%
89%
57%
161%
TWh10,000

28 Minerals Council of Australia
A clean and cost effective option
The US Energy Information Administration (EIA) has calculated the average levelised costs per unit of output for generating technologies for projects modelled to be brought on line in 2019. Nuclear featured competitively.38
Levelised cost of electricity (LCOE) represents the per-kilowatt hour cost (in real dollars) of building and operating a generating plant over an assumed financial life and duty cycle. Key inputs include capital costs, fuel costs, fixed and variable operations and maintenance costs, financing costs, and an assumed utilisation rate for each plant type.
“I really believe nuclear power has a place in the mix for Australia for all sorts of reasons:
we are a geologically benign environment, we’ve got a large part of the world’s uranium, we are
technically smart and we are committed to moving to a cleaner energy mix.”
Ziggy Switkowski, RMIT Chancellor39
300
250
200
150
100
50
0
Geoth
erm
al
Wind
Advanc
ed nu
clear
Natura
l gas
-fired
conv
entio
nal c
ombine
d cycle
Natura
l gas
-fired
adva
nced
com
bined cy
cle
Natura
l gas
-fired
adva
nced
com
bined cy
cle w
ith C
CS
Natura
l gas
-fired
adva
nced
com
bustio
n tur
bine
Integ
rated
coal-
gasific
tion t
urbine
com
bined cy
cle (I
GCC)
Natura
l gas
-fired
conv
entio
nal c
ombus
tion t
urbine
Hydro
Conve
ntion
al co
al
Biomas
s
Solar P
V
IGCC w
ith C
CS
Wind
–offs
hore
Solar t
herm
al
CHART 10 US average levelised for plants entering service in 2019 (2012 $/MWhr)
Source: US Energy Information Administration
Note: LCOE values for renewable sources (wind and solar) are not directly comparable to those for other technologies as they are intermittent and dependent on the weather or solar cycle.

AREVA’s Belleville nuclear power plant, France (Philippe Bauduin)

About one-third of all hospital procedures involve radiation or radioactivity to diagnose, treat and prevent disease. These procedures are safe, effective and do not require anaesthetic. They are employed in a range of medical specialties, from paediatrics to cardiology and psychiatry.
Nuclear medicine uses safe levels of radiation from radioactive tracers produced from uranium. The tracers, or ‘radiopharmaceuticals’, are injected, inhaled or digested. They emit gamma rays which are digitally
URANIUM’S PLACE IN NUCLEAR MEDICINENUCLEAR MEDICINE IS A VITAL PART OF MODERN HEALTHCARE.

recorded as images by which doctors can determine if the body is functioning normally. The tracers rapidly lose their radioactivity and are quickly and naturally eliminated from the body.
On average, one in two Australians will need a nuclear medicine scan during his or her lifetime. Scans using radiopharmaceuticals commonly diagnose heart, thyroid, lung and kidney conditions and diagnose infection, tumours, fractures and sports injuries.40
Technetium-99, which is sourced from uranium, is the most common radioisotope used in diagnosis. It is used in some 40 million procedures per year which is 80 per cent of all nuclear medicine procedures worldwide. In Australia there are about 560,000 nuclear medicine procedures per year – 470,000 of these use reactor isotopes.41
In addition to its diagnostic applications, nuclear medicine also plays an important therapeutic role. It is commonly used to treat overactive thyroids and
thyroid cancer. Radiopharmaceuticals are also injected into joints, to treat certain types of arthritis and are providing pain relief for sufferers of bone cancer.
Australia is one of the few nations that produce significant quantities of radioisotopes used in medical procedures. The radiopharmaceuticals are manufactured from uranium at Lucas Heights in Sydney’s southern suburbs by the Australian Nuclear Science and Technology Organisation (ANSTO) using its OPAL reactor. The reactor operates on the same principle as power reactors, with fuel enriched in U-235 undergoing a fission reaction. However, research reactors are engineered to produce excess neutrons, rather than heat.
ANSTO’s radiopharmaceuticals are supplied to nuclear medicine centres across Australia and are exported to the US, China, Japan and South Korea.42 These exports currently generate $10 million in export revenue. This is forecast to triple after 2016 with the opening of ANSTO’s new nuclear medicine processing facility.43
On average, one in two Australians will need a nuclear medicine scan during his or her lifetime.
32 Minerals Council of Australia
THE SAFE PRODUCTION OF URANIUMHealth and safety
Uranium emits low levels of radiation which need to be managed in order to protect uranium workers and the public from potentially harmful effects. The principles, regulation and practice of radiation protection in Australia draw on internationally-developed and recognised scientific research and application over a long period. The uranium industry has thoroughly developed best-practice systems and processes for minimising the radiation hazard.
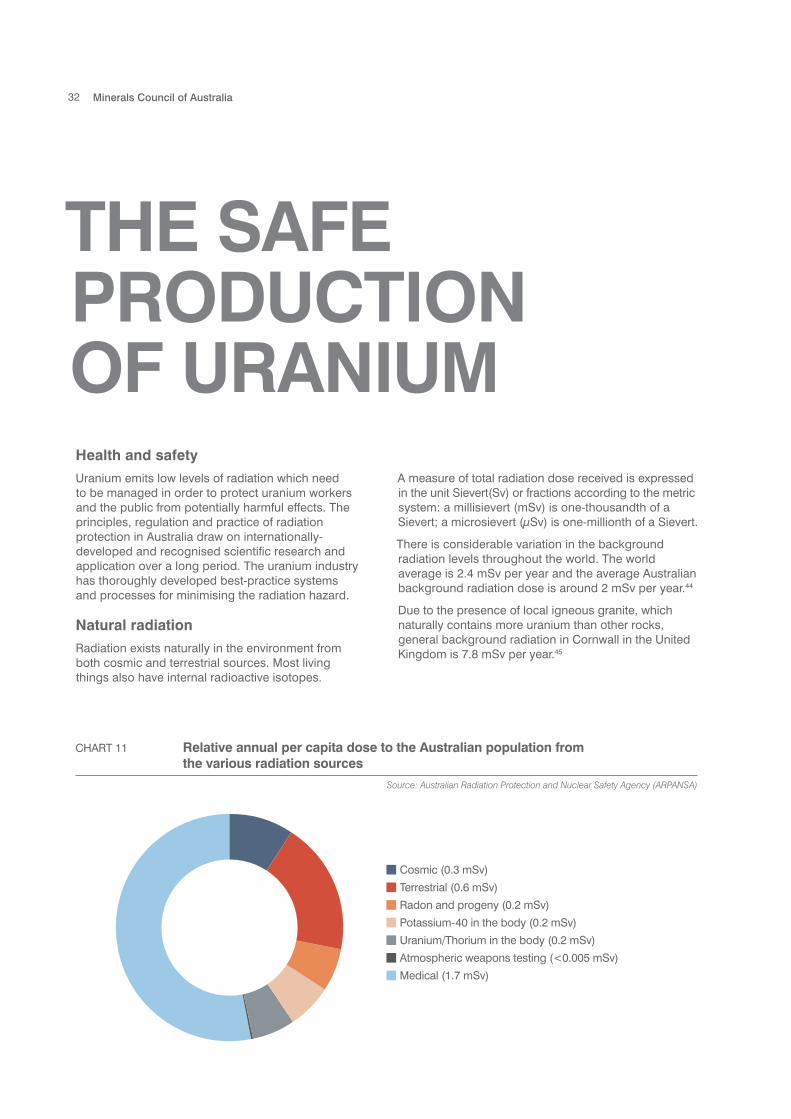
Natural radiation
Radiation exists naturally in the environment from both cosmic and terrestrial sources. Most living things also have internal radioactive isotopes.
A measure of total radiation dose received is expressed in the unit Sievert(Sv) or fractions according to the metric system: a millisievert (mSv) is one-thousandth of a Sievert; a microsievert (μSv) is one-millionth of a Sievert.
There is considerable variation in the background radiation levels throughout the world. The world average is 2.4 mSv per year and the average Australian background radiation dose is around 2 mSv per year.44
Due to the presence of local igneous granite, which naturally contains more uranium than other rocks, general background radiation in Cornwall in the United Kingdom is 7.8 mSv per year.45
Source: Australian Radiation Protection and Nuclear Safety Agency (ARPANSA)
CHART 11 Relative annual per capita dose to the Australian population from the various radiation sources
Cosmic (0.3 mSv)
Terrestrial (0.6 mSv)
Radon and progeny (0.2 mSv)
Potassium-40 in the body (0.2 mSv)
Uranium/Thorium in the body (0.2 mSv)
Atmospheric weapons testing (<0.005 mSv)
Medical (1.7 mSv)
33Uranium: Natural Energy
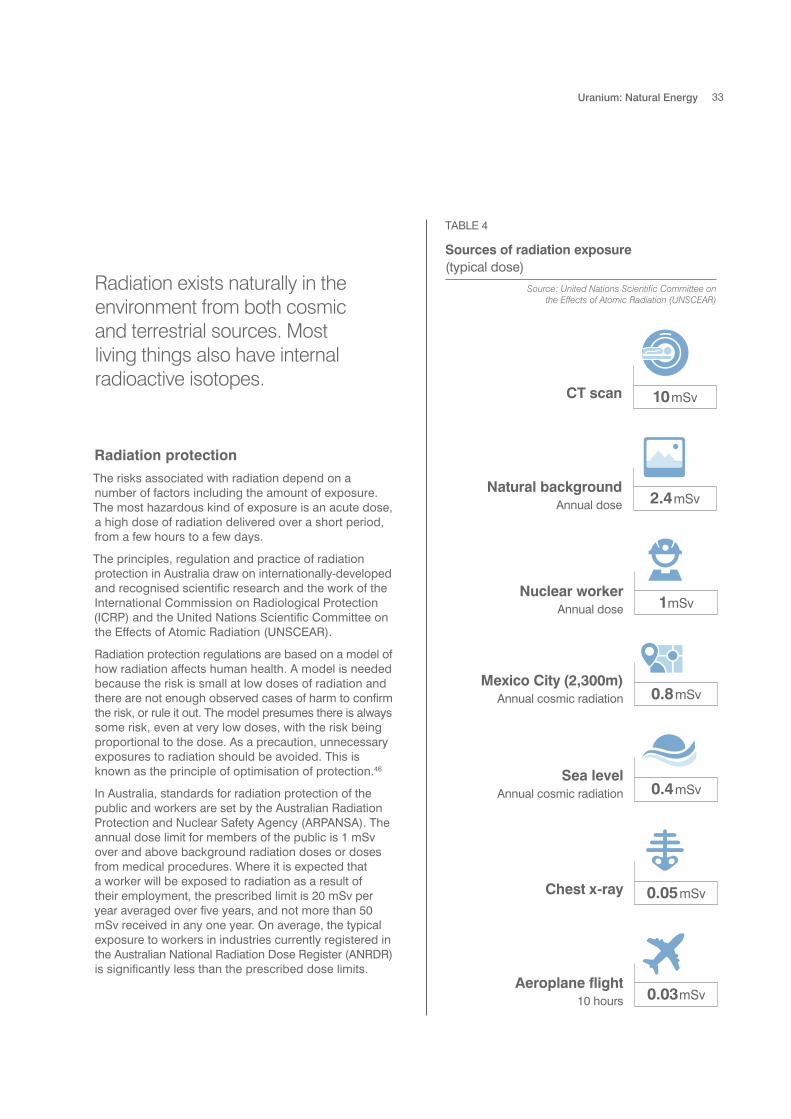
Source: United Nations Scientific Committee on the Effects of Atomic Radiation (UNSCEAR)
TABLE 4
Sources of radiation exposure (typical dose)
CT scan 10mSv
Aeroplane flight10 hours 0.03mSv
Chest x-ray 0.05mSv
Nuclear workerAnnual dose 1mSv
Natural backgroundAnnual dose 2.4mSv
Mexico City (2,300m)Annual cosmic radiation 0.8mSv
Sea level Annual cosmic radiation 0.4mSv
Radiation protection
The risks associated with radiation depend on a number of factors including the amount of exposure. The most hazardous kind of exposure is an acute dose, a high dose of radiation delivered over a short period, from a few hours to a few days.
The principles, regulation and practice of radiation protection in Australia draw on internationally-developed and recognised scientific research and the work of the International Commission on Radiological Protection (ICRP) and the United Nations Scientific Committee on the Effects of Atomic Radiation (UNSCEAR).
Radiation protection regulations are based on a model of how radiation affects human health. A model is needed because the risk is small at low doses of radiation and there are not enough observed cases of harm to confirm the risk, or rule it out. The model presumes there is always some risk, even at very low doses, with the risk being proportional to the dose. As a precaution, unnecessary exposures to radiation should be avoided. This is known as the principle of optimisation of protection.46
In Australia, standards for radiation protection of the public and workers are set by the Australian Radiation Protection and Nuclear Safety Agency (ARPANSA). The annual dose limit for members of the public is 1 mSv over and above background radiation doses or doses from medical procedures. Where it is expected that a worker will be exposed to radiation as a result of their employment, the prescribed limit is 20 mSv per year averaged over five years, and not more than 50 mSv received in any one year. On average, the typical exposure to workers in industries currently registered in the Australian National Radiation Dose Register (ANRDR) is significantly less than the prescribed dose limits.
Radiation exists naturally in the environment from both cosmic and terrestrial sources. Most living things also have internal radioactive isotopes.

34 Minerals Council of Australia
The radiation dose histories of all uranium mine workers are recorded on the Australian National Radiation Dose Register (ANRDR). More than 31,700 individual workers from the uranium mining industry are recorded on the database which is maintained and managed by ARPANSA.
The register tracks a worker’s cumulative dose based on data provided by the employer. It assists in minimising the possibility of a worker receiving a dose greater than the Australian dose limit when moving from one employer to another. The data is available to workers and is also used to generate annual statistics relating to exposure trends to assist in the optimisation of radiation protection.47
Analysis of ANRDR data in July 2014 found the average and maximum annual effective doses trended downwards over the period 2004 to 2013 and the average dose was less than a tenth of the annual dose limit.
Doses received by workers are well below the prescribed limit of 50 mSv in any one year and 20 mSv per year averaged over 5 years.
Recording workers’ radiation dose histories
Source: ARPANSA
CHART 12 Annual dose distribution for all Australian uranium mine workers, 2013
Effective dose (mSv)
7,000
6,000
5,000
4,000
3,000
2,000
1,000
0
0-0.5
0.5-1
1-1.5
1.5-2
2-2.5
2.5-3
3-3.5
3.5-4
4-4.5
4.5-5
5-5.5
5.5-6
6-6.5
6.5-7
7-7.5
7.5-8
No. of workers
67% of workers <0.5mSv
95% of workers <3.5mSv
In 2013, approximately 95 per cent of workers received a dose less than 3.5 mSv per year. 67 per cent
of workers received a dose below 0.5 mSv per year.

35Uranium: Natural Energy
Doses received by workers are well below the prescribed limit of 50 mSv in any one year and 20 mSv per year averaged over 5 years.
Source: ARPANSA
CHART 13 Average and maximum effective dose trends for Australian uranium mine workers, 2004-13
Global average background radiation Maximum effective dose
Average effective dose Annual dose limit
20
18
16
14
12
10
8
6
4
2
0
2005
2008
2006
2009
2004
2007
2010
2011
2012
2013
Dose mSv
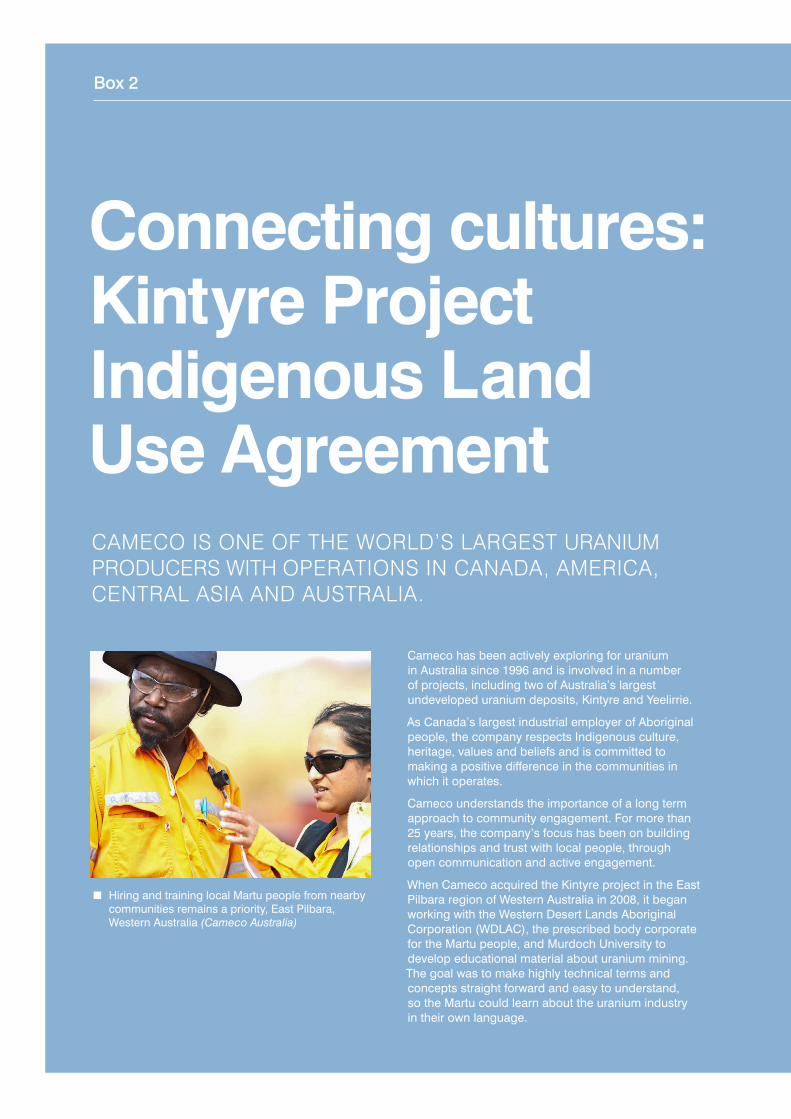
Connecting cultures: Kintyre Project Indigenous Land Use AgreementCAMECO IS ONE OF THE WORLD’S LARGEST URANIUM PRODUCERS WITH OPERATIONS IN CANADA, AMERICA, CENTRAL ASIA AND AUSTRALIA.
Cameco has been actively exploring for uranium in Australia since 1996 and is involved in a number of projects, including two of Australia’s largest undeveloped uranium deposits, Kintyre and Yeelirrie.
As Canada’s largest industrial employer of Aboriginal people, the company respects Indigenous culture, heritage, values and beliefs and is committed to making a positive difference in the communities in which it operates.
Cameco understands the importance of a long term approach to community engagement. For more than 25 years, the company’s focus has been on building relationships and trust with local people, through open communication and active engagement.
When Cameco acquired the Kintyre project in the East Pilbara region of Western Australia in 2008, it began working with the Western Desert Lands Aboriginal Corporation (WDLAC), the prescribed body corporate for the Martu people, and Murdoch University to develop educational material about uranium mining. The goal was to make highly technical terms and concepts straight forward and easy to understand, so the Martu could learn about the uranium industry in their own language.
Box 2 Long term partnerships
Hiring and training local Martu people from nearby communities remains a priority, East Pilbara, Western Australia (Cameco Australia)

Box 2 Long term partnerships
In addition, Cameco met regularly with local Martu communities and learned, especially from the elders, the significance of Martu culture and heritage, and the importance of the land. Cameco and WDLAC completed a social impact study and began training and building local business capacity.
However, the Martu remained skeptical about uranium mining so Cameco invited 11 Martu leaders to Canada to see Cameco’s operations and speak directly with Indigenous peoples, some who had families that had worked for Cameco for two generations.
Noeletta Lee was a member of the delegation who made the trip from Western Desert to northern Saskatchewan. She says her perception and understanding of uranium mining were completely changed.
‘It was not what I was expecting at all. We saw firsthand how Cameco rehabilitated the land after mining. It was so green, with so many trees and new growth.
Cameco met regularly with local Martu communities and learned, especially from the elders, the significance of Martu
culture and heritage, and the importance of the land.
‘In the desert, the main thing we worry about is water. We know water is used to process uranium and we were worried this could affect our water supply. We were able to see how the water is recycled and safely put back into the river system.
‘It was the trip of a lifetime. We got to see every stage of the mining operations, from mining to processing and rehabilitation. We sat down and talked to the First Nation elders and asked them questions about mining and how it affected their country. They live like us. There is a mine, yet people still hunt and gather and live their traditional lives. We were able to learn a lot from them.’
Cameco and the Martu signed an Indigenous Land Use Agreement (ILUA) in October 2012. It was the culmination of more than three years of relationship building with the Martu and provides for a range of business, employment and cultural and community development initiatives which ensure the Martu have a shared stake in the future of the mine.
From Australia’s Western Desert to Canada’s Northern Saskatchewan (Cameco Australia)

Arid Recovery, Olympic Dam, South Australia (BHP Billiton)

39Uranium: Natural Energy
Australia’s regulatory framework attempts to moderate the impact by assessing potential effects as part of the approval process, then subjecting mining to conditions by monitoring operations and by requiring projects to report environmental performance and impact.
The uranium mining industry is subject to additional scrutiny. For example, all uranium projects undergo mandatory assessment under the Environment Protection and Biodiversity Conservation (EPBC) Act. The Northern Territory’s Ranger mine is additionally overseen by the Supervising Scientist – a statutory
ENVIRONMENTAL PROTECTIONALL MINING HAS AN ENVIRONMENTAL IMPACT. AUSTRALIA’S REGULATORY FRAMEWORK MANAGES THIS RISK AND MODERATES THE IMPACTS.
position specifically established for the mine under the Commonwealth Environment Protection (Alligator Rivers Region) Act 1978.
Uranium mining’s regulatory framework is a complex system of federal, state and territory legislation, guidelines and policies administered by a variety of agencies and organisations, covering the full supply chain, from exploration to export and mine closure and rehabilitation. A typical assessment and approval process for a uranium mine in Australia can take more than three years from referral to ministerial approvals.
Source: Queensland Government Department of the Premier and Cabinet
CHART 15 Uranium mining in Australia
Regulation and governance covers the full supply chain
Exploration Production Processing
Export & SafeguardsMine closure & rehabilitation
Transpo
rt
Environment: Impacts / Assessment / Protection Safety & health
Possession & storage Radiation managementLand access & Native Title
Compliance & reporting Royalties & chargesEconomic & community development

40 Minerals Council of Australia
‘Societal expectations related to environmental protection and the safety of workers and the public evolved considerably as the outcomes of the early era of mining became apparent, driving changes in regulatory oversight and mining practices.
Uranium mining is now conducted under significantly different circumstances, with leading practice mining the most regulated
and one of the safest and environmentally responsible forms of mining in the world.’48
Organisation for Economic Co-Operation and DevelopmentNuclear Energy Agency
Tailings management
Tailings are the fine materials and ground rock remaining after the extraction of the valuable mineral from the mined ore. Tailings management broadly encompasses the chemical and physical processes involved in the production and placement of tailings, and the design, approval, development, operation and closure of the facility into which the tailings are impounded.49
Tailings still contain some uranium. While these tailings are less radioactive than the original ore, the acidic or alkali leaching process used to extract the uranium also liberates other potentially hazardous naturally occurring constituents such as heavy metals, similar to other mine processing. Consequently tailings, and the water discharged with the tailings solids, must be isolated, stored, treated and ultimately rehabilitated at mine closure.
Past examples of poor practice in uranium and other mining during periods of less developed regulatory requirements have rightfully been criticised. Those outcomes and their inconsistency with modern expectations of good environmental management have led to greater scrutiny of contemporary mining, and consequently better performance.
Mine rehabilitation
Planning the closure of a uranium mine, as with all mines, begins with the first planning for development and operation of the mine. Rehabilitation works commence during operation and continue well after the mine is closed. Environmental monitoring requirements for uranium mines in Australia can be up to 99 years post closure.
While there are leading practice principles and guidelines for closure planning, each project and each operating mine is unique. The geological, climatic, metallurgical, hydrological, economic and cultural aspects of each mine are unique in themselves and unique in combination.
Rehabilitation and closure plans are regularly reviewed and updated in light of changing technology and practice and to reflect cultural change and changes in expectations of traditional owners and other stakeholders.
A vital principle is for mine operators always to estimate and re-estimate the costs of rehabilitation and mine closure and to make prudent provisions for these estimated costs in company accounts; companies plan for this upfront. In order to secure their licences, companies are required to demonstrate to government that such funds are available, and governments may require them to be held in a government operated trust.

41Uranium: Natural Energy
Uranium packaging and transportation
Uranium oxide is transported by road and/or rail from mine sites to existing authorised container port facilities in South Australia or the Northern Territory for shipment by sea to international customers.
Uranium oxide is transported in 200 litre steel drums in accordance with IAEA requirements. The drums contain between 370 kilograms and 400 kilograms of uranium oxide depending on product density and delivery location.
Each drum has a tight fitting lid that is secured to the drum by means of a steel locking ring and then clamped by a locking ring bolt. The drums are stowed into 20 foot International Organisation for Standardisation (ISO) shipping containers for road, rail and sea transportation.
Uranium oxide that is stored before or during shipment must be placed in a secure area with restricted access. Specialised drum lifting equipment must be used when loading shipping containers.
Drums are secured inside the shipping containers to international standards using a webbed Kevlar-based strapping system. The method for securing drums is approved and audited annually by the Australian Maritime Safety Authority (AMSA) for sea transport.
Uranium oxide is classified by the IAEA as a ‘Low Specific Activity’ LSA-1 material because of the low level of radiation per unit mass. Even in a severe accident, uranium oxide does not pose a fire or explosion hazard.50
Australia has been shipping uranium oxide for more than 30 years. During this period, there have been no incidents that posed risk to public health or to the environment reported in more than 11,000 container movements.
Arid Recovery leads the way on conservationARID RECOVERY IS AUSTRALIA’S PREMIER ARID ZONE CONSERVATION PROGRAM.
Arid Recovery is an independent, not-for-profit conservation initiative that has been restoring Australia’s arid lands since 1997.
Based at Roxby Downs, the program has become a world leader in ecosystem restoration through the use of exclusion fencing, threatened species re-introductions and feral animal and weed control.
The program is supported by local community volunteers, the South Australian Department for Environment, Water & Natural Resources, the University of Adelaide and BHP Billiton. It is centred on a 123km² fenced reserve substantially funded by BHP Billiton’s mine on the giant Olympic Dam copper-uranium deposit. To date, the project has been centred on a 123 km² fenced reserve which is situated partly on the Olympic Dam Mine Lease (7 km²) and partly on adjoining pastoral properties including areas of privately-owned Billa Kalina station and BHP Billiton pastoral lease properties; Roxby Downs Station (49 km²), Mulgaria Station (1 km²), and Stuart Creek Station (66 km²).
Four locally extinct mammal species have been successfully reintroduced to the reserve to date: the Greater Stick Nest Rat, Burrowing Bettong, Greater Bilby and the Western Barred Bandicoot. All four species are now thriving within the reserve. Future re-introductions will be trialled to encourage a variety
of sustainable trophic levels (i.e. both predator and prey species) within the reserve.
The careful management of herbivory through fencing and pest control over a decade has allowed the recovery of long-lived plants (such as mulga); an overall increase in vegetation cover within the reserve; and a major increase in seed reserves including for some species that had never been recorded. There has also been a marked increase in the suite of mammals within the reserve and a higher abundance of bird species than outside the reserve.
Arid Recovery is a world class laboratory and reference site for arid zone recovery because of the establishment of permanent monitoring sites and standard monitoring protocols at its inception, and the deliberate experimental design of its layout. Research visits, guided tours and VIP visits are undertaken within the Arid Recovery fenced habitat.
Arid Recovery is the benchmark for what can be achieved in the restoration of biodiversity in arid areas. It is an acclaimed example of a highly successful partnership between industry, government, the university sector and the community. It showcases modern mining’s ability to co-exist with a sustainable natural habitat, its commitment to responsible environmental management and its active support for world-leading habitat restoration. Arid Recovery is one of the dividends of Australia’s uranium industry.
Box 3 World leading environmental science

Box 3 World leading environmental science
Arid Recovery is the benchmark for what can be achieved in the restoration
of biodiversity in arid areas.
It is an acclaimed example of a highly successful partnership between
industry, government, the university sector and the community.
Arid Recovery, Olympic Dam, South Australia (BHP Billiton)

44 Minerals Council of Australia
DISPELLING URANIUM MYTHSIs uranium mining and transportation safe?
Australian miners working with radioactive ores receive an average of 2 to 5 mSv per year. This is lower than the natural background radiation levels in many well populated parts of the earth. It is well within the acceptable maximum annual dose of 20 mSv per year recommended by the ARPANSA, the ICRP and the IAEA, whose guidelines form the basis of Australian legislation covering mine worker radiation safety.51
Mining operations in Australia are undertaken under the Code of Practice and Safety Guide for Radiation Protection and Radioactive Waste Management in Mining and Mineral Processing, administered by state and territory governments.52
Uranium oxide is classified as a ‘Low Specific Activity’ LSA-1 material by the IAEA because of its low level of radiation per unit mass and strict packaging requirements minimise the risk of radiation exposure from its transport and handling. Uranium oxide remains stable under all conditions of storage, handling and transport.53
There have been no uranium transport incidents that have posed any risk to public health or to the environment in more than 11,000 container movements. Uranium has been transported in Australia from mines to ports for export for more than 30 years.
Since 1977, Australia’s uranium export policy has been ‘to establish a framework of control within which the benefits which many countries see in the peaceful use of nuclear energy can be safely realised.’54
In addition to the International Atomic Energy Agency (IAEA) safeguards, Australia imposes requirements through a network of bilateral safeguards agreements.
The Australian Safeguards and Non-Proliferation Office (ASNO) annual reports affirm that no Australian uranium has been diverted from peaceful purposes.
In 2014, the Nuclear Threat Initiative ranked Australia first in its NTI Nuclear Materials Security Index.55
Contrary to fears that the civilian nuclear power industry would be a pathway to further nuclear weapons production, the past two decades have seen the blending-down of Russian warheads into nuclear fuel for consumption in nuclear power plants in the US. The ‘Megatons to Megawatts’ program saw 500 metric tons of bomb-grade uranium recycled into more than 14,000 metric tons of uranium fuel. This equates to the elimination of 20,000 nuclear warheads.
Is Australian uranium used in nuclear weapons?
ISR well-fields, Beverley Mine, South Australia (Heathgate Resources)

45Uranium: Natural Energy
Source: World Nuclear Association
TABLE 5 Managing nuclear waste
Type of waste By radioactive content By volume
High level 95 per cent 3 per cent
Intermediate level 4 per cent 7 per cent
Low level 1 per cent 90 per cent
‘Fast reactors can be used to burn all existing reserves of plutonium and the nuclear waste from the past and present generation of thermal reactors. With additional uranium mining, there is enough energy in proven deposits
to supply the entire world for many thousands of years.’58
Professor Barry BrookProfessor of Environmental Sustainability at University of Tasmania.
Formerly, Sir Hubert Wilkins Chair of Climate Change and Director of Climate Science, The Environment Institute at University of Adelaide.
Radioactive waste encompasses a range of materials. The most significant high-level waste from a nuclear power reactor is the spent nuclear fuel. It makes up the smallest proportion of the total volume of waste but generates most of the radioactive content.
Low-level waste is made up of lightly-contaminated items like tools and work clothing from power plant operation, medical waste and diodes from watches and makes up the bulk of radioactive wastes.
Intermediate-level wastes include wastes arising from the reprocessing of research reactor fuel, used filters, steel components from within the reactor, effluents from reprocessing and components of decommissioned reactors.
Although spent nuclear fuel is hot and radioactive, it can be handled and stored safely when cooled and shielded by a dense material such as concrete or steel. Water can provide both cooling and shielding, so a typical power reactor will remove the fuel underwater and transfer it to a storage pool. After about five years, spent fuel is typically transferred into dry ventilated concrete casks.56
Spent nuclear fuel can be disposed of in deep geological repositories or reprocessed which reduces the volume of the waste to approximately just 3 per cent of the original volume. Without reprocessing, a 1 GWe nuclear plant typically generates only around 27 tonnes of waste per annum.
Radioactivity dissipates over time. After 40 to 50 years the heat and radioactivity of spent fuel falls to 1/1000th of the level at removal from the reactor. After 1,000 years most radioactivity will have decayed to a level comparable to that of naturally-occurring uranium ore.57
Current global hazardous waste production is approximately 400 million metric tonnes per annum. Radioactive waste from nuclear power plants and the fuel cycle support facilities comprises approximately 0.1 per cent of all global hazardous waste.
The vast majority of spent nuclear fuel is U-238, which is effectively unchanged from when it was drummed at the mine. It is expected that Generation IV fast or breeder reactors will consume U-238 as a fuel source.
Can radioactive waste be safely handled and managed?

46 Minerals Council of Australia
‘I can assure you that none of us are in the pay of the nuclear industry. I was anti-nuclear until I worked on the after effects of the Chernobyl accident
– now I am very pro-nuclear as I realise that we have an unwarranted fear of radiation – probably due to all the rubbish about a nuclear winter we were fed during the cold war.’62
Professor Geraldine ThomasLondon’s Imperial College. Member of the UNSCEAR committee on the health effects of the Chernobyl accident.
The incident at Fukushima rekindled fears about nuclear energy yet no fatalities occurred due to the nuclear incident or consequent radiation leak.
UNSCEAR’s report released in April 2014 concluded its Scientific Findings on the expected long term health implications stating:
No radiation-related deaths or acute diseases have been observed among the workers and general public exposed to radiation from the accident…. The doses to the general public, both those incurred during the first year and estimated for their lifetimes, are generally low or very low. No discernible increased incidence of radiation-related health effects are expected among exposed members of the public or their descendants. The most important
Is the risk of another Fukushima event too great?
health effect is on mental and social well-being, related to the enormous impact of the earthquake, tsunami and nuclear accident, and the fear and stigma related to the perceived risk of exposure to ionizing radiation.59
Nuclear energy has the best safety record of all energy sources when measured as fatalities per unit of energy produced.60 This is a function not only of the industry’s strong safety practices and record, but of uranium’s energy density which allows the production of substantial amounts of electricity for relatively little industrial activity.
A commercial-type power reactor cannot under any circumstances explode like a nuclear bomb – the fuel is not enriched beyond about 5 per cent61, compared with bomb grade uranium at 90 per cent.
Dispelling uranium myths

Benita Alangale at work at Ranger, Northern Territory (Energy Resources of Australia)

48 Minerals Council of Australia
Endnotes
1 World Nuclear Association, Australia’s Uranium2 Bureau of Resources and Energy Economics
(BREE), Resources and Energy Quarterly, September 2014
3 Ibid4 World Nuclear Association, Uranium production
figures 2002-20125 World Nuclear Association, Nuclear Fuel Cycle –
Uranium Mining Overview6 Calculations are based on: a 1 GWe power plant
requiring 230 tonnes of uranium oxide; 1 drum of uranium oxide containing 370kg; average household electricity usage of 6.911 MWh per year; and a 1 GW nuclear power plant producing 7.8 million MWh.
7 Calculations based on: a 1 GWe nuclear power plant producing 7.8 million MWh power from 230 tonnes of uranium oxide with 90% capacity factor; Ivanpah producing 1.1m MWh power per annum (14% of a nuclear plant, 32 tonnes uranium oxide); and Macarthur producing 1.3 MWh power per annum (16% of a nuclear plant, 38 tonnes uranium oxide).
8 World Nuclear Association, Nuclear Fuel Cycle Overview
9 Energy Tribune, William Tucker, Understanding E = mc2
10 Geoscience Australia, Australian Minerals Resource Assessment - Uranium
11 Joint report by the OECD Nuclear Energy Agency and the International Atomic Energy Agency, Uranium 2014: Resources, Production and Demand, Paris.
12 Geoscience Australia, Australian Minerals Resource Assessment - Uranium
13 Geoscience Australia and BREE, 2014, Australian Energy Resource Assessment, 2nd Ed
14 Australian Bureau of Statistics, 8412.0 – Mineral and Petroleum Exploration, Australia, Jun 2014
15 Geoscience Australia, 2014, Australia’s Identified Mineral Resources 2013
16 BREE, 2014 Australian Energy Update, July 2014, Australian Government
17 Ibid18 Geoscience Australia and BREE, 2014, Australian
Energy Resource Assessment, 2nd Ed19 Australian Parliament Hansard, Suspension of
uranium sales to Russia
20 Department of Foreign Affairs and Trade, ASNO Annual Report 2013-14, Australian Government
21 Ibid22 BREE, Resources and Energy Quarterly, September
Quarter 2014 23 Department of Resources, Energy and Tourism,
Australia’s Uranium Industry, Australian Government, June 2012
24 Geoscience Australia and BREE, 2014, Australian Energy Resource Assessment, 2nd Ed
25 International Energy Agency (IEA), Key world energy statistics, 2014 edition
26 Geoscience Australia and BREE, 2014, Australian Energy Resource Assessment, 2nd Ed
27 World Nuclear Association, World Nuclear Power Reactors & Uranium Requirements, 1 December 2014
28 US Energy Information Administration, International Energy Outlook 2013
29 Joint report by the OECD Nuclear Energy Agency and the International Atomic Energy Agency, Uranium 2014: Resources, Production and Demand, Paris
30 IEA, World Energy Outlook, 201431 Robert Bryce, Smaller Faster Lighter Denser
Cheaper, p258, 201432 World Nuclear Association, What is uranium –
How does it work

49Uranium: Natural Energy
33 Department of the Prime Minister and Cabinet, Uranium Mining, Processing and Nuclear Energy Review, Commonwealth of Australia 2006
34 Lenzen, M. (2008) Life cycle energy and greenhouse gas emissions of nuclear energy: A review. Energy Conversion and Management 49, 2178-2199.
35 Intergovernmental Panel on Climate Change (IPCC), Fifth Assessment Synthesis Report, Adopted 1 November 2014
36 IEA, World Energy Outlook, 201437 The White House, US-China Joint Announcement on
Climate Change, Office of the Press Secretary, 12 November 2014
38 US Energy Information Administration, Levelised cost of New Generation Resources in the Annual Energy Outlook 2013
39 Australian Financial Review, Boss True Leaders 2014, 8 August 2014
40 Australian Nuclear Science and Technology Organisation, Benefits of Nuclear Science
41 World Nuclear Association, Radioisotopes in Medicine
42 Australian Nuclear Science and Technology Organisation, ANSTO’s production of Medical Isotopes
43 Clare Pain, Going Global, KnowHow Magazine, Issue 4, December 2014
44 Australian Nuclear Science and Technology Organisation, Cosmic Radiation Exposure when Flying
45 Australian Nuclear Science and Technology Organisation, Measuring Radiation
46 International Commission on Radiological Protection, Annals of the ICRP (Publication 103)
47 Australian Radiation Protection and Nuclear Safety Agency, Australian National Radiation Dose Register, ANRDR Fact Sheet
48 OECD Nuclear Energy Agency, Managing Environmental and Health Impacts of Uranium Mining, NEA No. 7062, c OECD 2014
49 Ibid50 International Atomic Energy Agency, Regulations
for the Safe Transport of Radioactive Material 2012 Edition
51 Government of Western Australia, Guide to Uranium in Western Australia, Department of Mines and Petroleum, May 2013
52 World Nuclear Association, Occupational Safety in Uranium Mining
53 Department of Resources, Energy and Tourism, Australian Government, Guide to Safe Transport of Uranium Oxide Concentrate
54 M Fraser (Prime Minister), ‘Ministerial statement: Government policy on nuclear safeguards,’ House of Representatives, Debates, 24 May 1977, pp. 1700–1705
55 Nuclear Threat Initiative, 2014 NTI Nuclear Material Security Index
56 World Nuclear Association, What are nuclear wastes57 World Nuclear Association, Radioactive Waste
Management58 On line Opinion website, Clean future in nuclear power59 United Nations Scientific Committee on the Effects
of Atomic Radiation, Effects and Risks of Ionising Radiation, UNSCEAR 2013 Report Vol. 1, Report to the UN General Assembly
60 NextBigFuture website, Background information and analysis to help Educators present the full case for Deaths per TWh by Energy Source
61 World Nuclear Association, Safety of Nuclear Power Reactors
62 George Monbiot (Monbiot website), Interrogation of Helen Caldicott’s Responses, Supporting material for article ‘Evidence Meltdown’


For more information on Australia’s uranium industry:
W. www.minerals.org.auE. [email protected]
This publication is part of the overall program of the MCA,
as endorsed by its Board of Directors, but does not necessarily
reflect the views of individual members of the Board.
Minerals Council of Australia
Walter Turnbull Building, Level 3,44 Sydney Ave, Forrest ACT 2603PO Box 4497, Kingston ACT 2604
P. + 61 2 6233 0600 F. + 61 2 6233 0699
W. www.minerals.org.auE. [email protected]
ISBN 978-0-9925333-0-4
Natural EnergyURANIUM


