Page 1
University of South CarolinaScholar Commons
Theses and Dissertations
2017
Urban Accessibility Measurement andVisualization — A Big Data ApproachYuqin JiangUniversity of South Carolina
Follow this and additional works at: https://scholarcommons.sc.edu/etd
Part of the Geography Commons
This Open Access Thesis is brought to you by Scholar Commons. It has been accepted for inclusion in Theses and Dissertations by an authorizedadministrator of Scholar Commons. For more information, please contact [email protected] .
Recommended CitationJiang, Y.(2017). Urban Accessibility Measurement and Visualization — A Big Data Approach. (Master's thesis). Retrieved fromhttps://scholarcommons.sc.edu/etd/4136
Page 2
URBAN ACCESSIBILITY MEASUREMENT AND VISUALIZATION
— A BIG DATA APPROACH
by
Yuqin Jiang
Bachelor of Arts
University at Buffalo, 2014
Submitted in Partial Fulfillment of the Requirements
For the Degree of Master of Science in
Geography
College of Arts and Sciences
University of South Carolina
2017
Accepted by:
Diansheng Guo, Director of Thesis
Michael Hodgson, Reader
Zhenlong Li, Reader
Cheryl L. Addy, Vice Provost and Dean of the Graduate School
Page 3
ii
© Copyright by Yuqin Jiang, 2017
All Rights Reserved.
Page 4
iii
DEDICATION
To my parents, Jian Jiang and Mei Shen.
Page 5
iv
ACKNOWLEDGEMENTS
I would like to thank my research advisor Dr. Diansheng Guo for his help and
support during my research, without which this thesis cannot be finished. He worked
closely with me to figure out technique difficulties and programming problems. He
served as a role-model with his passion, persistence, and determination in scientific
research. I would also like to thank my committee members, Drs. Michael Hodgson and
Zhenlong Li, for their feedback, help and support.
It has been my honor to work in the Department of Geography, University of
South Carolina. I would express my thanks to all the faculty, staff, and fellow graduate
students, for creating this friendly, encouraging, motivating, and family-like environment.
I would thank my best friends, Zixuan Guo and Hanyan Wang, for their supports
and encouragements for more than ten years. I am grateful for all the time we spent
together since teenage.
Above all, my deepest expression of appreciation goes to my parents, Jian Jiang
and Mei Shen. Thanks for being such wonderful parents, teachers, and friends. Thanks
for encouragements during my failures; thanks for calm and rational advice during my
successes; thanks for accompany me during the darkest time. My appreciation also goes
to my cousins, Yiwen Jiang and Shiyu Dai, my aunts and uncles, and my grandparents. It
has always been my greatest honor to have such wonderful family members.
Page 6
v
ABSTRACT
Accessibility measurement has always been an important question in different
areas including transportation, urban planning, politics, and sociology. However, how to
measure transportation accessibility in different areas have been limited to data
availability and technology. Recently, with increasing availability in public transportation
data, we found a gap between current methods and large volume of data now available.
This thesis developed a new method to measure multi-mode transportation data,
including taxi, bus, and subway. Based on this measurement, we can visualize and
understand the spatiotemporal patterns of accessibility in New York City (NYC). With
historical travel records and public transit schedule, Relative Index (RI) is developed in
this thesis to measure and compare the differences in the accessibility in NYC. RI
distribution patterns during different time periods were also compared and analyzed for
more information about transportation in NYC. By the end of this thesis, a practical
application that measured accessibility for nine major hospitals in NYC was provided.
Results in this thesis showed that subways have more impacts about accessibility than
bus. Also, service frequency during different time of a day has affect accessibility.
Page 7
vi
TABLE OF CONTENTS
DEDICATION ....................................................................................................................... iii
ACKNOWLEDGEMENTS ........................................................................................................ iv
ABSTRACT ............................................................................................................................v
LIST OF FIGURES ............................................................................................................... viii
CHAPTER 1 INTRODUCTION .................................................................................................. 1
CHAPTER 2 RESEARCH OBJECTIVES ......................................................................................5
CHAPTER 3 LITERATURE REVIEW .........................................................................................6
3.1 ACCESSIBILITY ....................................................................................................6
3.2 ACCESSIBILITY IN PUBLIC TRANSIT ....................................................................8
3.3 TAXI TRAVEL DATA ANALYSIS .........................................................................11
3.4 RELATIVE ACCESSIBILITY .................................................................................12
3.5 APPLICATION WITH ACCESSIBILITY MEASUREMENT .........................................14
CHAPTER 4 DATA AND STUDY AREA ..................................................................................16
4.1 STUDY AREA: NEW YORK CITY ........................................................................16
4.2 DATA ................................................................................................................18
CHAPTER 5 METHODOLOGY ................................................................................................20
5.1 PUBLIC TRANSIT ACCESSIBILITY .......................................................................21
5.2 TAXI ACCESSIBILITY .........................................................................................22
5.3 RELATIVE INDEX (RI) .......................................................................................22
CHAPTER 6 RESULTS AND DISCUSSION ...............................................................................26
Page 8
vii
6.1 EXPLORATORY ANALYSIS .................................................................................26
6.2 RELATIVE INDEX RESULTS ................................................................................29
CHAPTER 7 DISCUSSION ......................................................................................................34
CHAPTER 8 CONCLUSION AND FUTURE RESEARCH .............................................................37
REFERENCES .......................................................................................................................40
Page 9
viii
LIST OF FIGURES
Figure 4.1 Study Area of NYC ..........................................................................................16
Figure 4.2 Public Transit Accessible Areas ...................................................................... 18
Figure 5.1 Comparison Between OLS and TLS Regressions ........................................... 23
Figure 5.2 Scatter Plot of O-D Pairs String at Penn Station ............................................. 24
Figure 6.1 Travel Time Ratio For 3 AM........................................................................... 28
Figure 6.2 Travel Time Ratio For 3 PM ........................................................................... 28
Figure 6.3 Relative Index For 3 AM ................................................................................. 31
Figure 6.4 Relative Index For 3 PM ................................................................................. 31
Figure 6.5 RI for 9 hospitals in NYC ................................................................................ 34
Page 10
1
CHAPTER 1
INTRODUCTION
Accessibility is a term commonly used in geographical research, transportation
and urban planning, which has been studied for decades and its definition varies in
different research situations, including “interactions between human and lands” (Hansen,
1959), “the ease or difficulty for people to reach their opportunities or services” (Wachs
& Kumagai, 1973), and “the benefits provided by a transportation/land-use system”
(Ben-Akiva & Lerman, 1979). Consequently, the exact measurement of accessibility also
varies according to different circumstances. Traditional accessibility was measured by
generating a static travel scenario or by using self-reported travel dairy. Those methods
not only lack accuracy but also involve subjective bias due to limited samples. Recently,
many public transportation companies, including taxi, bus, and subway companies, have
released their transportation data, which potentially can provide new and more accurate
information for accessibility measurement. However, there is a gap in current literature
between available transportation data and methodologies that are able to process, analyze,
and model information from such travel data.
In this research I propose to develop an approach to the measurement and
visualization of driving accessibility, with big data of taxi trips and public transit uses
(including both bus and subway) in New York City (NYC). Specifically, a relative access
index will be developed and subsequent analyses will be carried out to (1) integrate
Page 11
2
multiple transportation modes and big data of daily mobility, and (2) visualize and
understand the spatiotemporal distribution of accessibility patterns in NYC.
Public transit usually refers to buses and subway systems in urban areas.
Accessibility of public transit has drawn intensive attention in transportation research
from different perspectives. As an environment-friendly commuting and travel mode,
public transportation can help reduce greenhouse gas emissions, traffic congestion, car
accidents, and oil price vulnerability (Litman, 2003). Research also found that public
transportation users have lower obesity rate and present better physical and mental health
(Sallis et al., 2004). Moreover, accessibility of public transportation can be used as an
indicator to measure social equality. For example, accessibility measurements of public
transportation helped researchers to identify socially disadvantaged groups in gender (M.-
P. Kwan et al., 2003; M. P. Kwan, 1999), age (Hess, 2009), socio-economic status
(Niedzielski & Eric Boschmann, 2014), races (Tribby & Zandbergen, 2012), and
disability (Church & Marston, 2003). Traditionally, public transit accessibility was
measured by service frequency estimation or travel situation simulation. Recently, the
increasing availability of public transit usage data opens the possibility to measure public
transit accessibility accurately and dynamically with a big data approach.
Taxis, unlike buses or subways, provide private and convenient location-to-
location transportation services. In the past few years, taxi companies worldwide have
installed Global Positioning System (GPS) equipment in taxicabs. In general, two types
of travel data can be collected from in-car GPS. The first type of data has the entire route
recorded with GPS positions regularly sampled at a certain time interval. The second type
of data only contains information on the origin (pick-up location) and destination (drop-
Page 12
3
off location) of each taxi trip, and the travel distance, duration, and cost, without the
actual driving route of each trip.
Both public transit accessibility and taxi trip data have been studied to reveal
different urban characteristics. Public transit data have been used to analyze job
opportunities (T. Lei, Chen, & Goulias, 2012), food deserts (Burns & Inglis, 2007; Paez
et al., 2010), and activity-based research (Mavoa et al., 2012). Continuous taxi data have
been used for travel condition monitoring and road network analysis (Veloso et al., 2011).
Trip-based taxi data is useful for urban land use and human mobility analysis (Peng et al.,
2012). However, few studies have integrated more than one type of transportation modes
in accessibility measurements.
This project will develop a methodology to quantify and visualize the integrated
accessibility of both taxi and public transit (combining buses and subways) in New York
City, based on big data of public transit uses and taxi trips. Public transit timetable was
provided by the Metropolitan Transportation Authority (MTA) in the General Transit
Feed Specification (GTFS) format. On an average weekday, there are more than 5 million
riders for subway systems and more than 2 million for public buses. For each trip, GTFS
data includes service date, route, stations, departure and arrival time at each station.
Based on this information, the public transit travel time for each origin and destination
pair for given departure time can be calculated. Historical taxi trip data are provided by
the New York City Taxi & Limousine Commission, which is the largest taxi company
that operates the yellow cabs in NYC. For the year of 2013, there were more than 170
millions (173,179,759) taxi trips recorded. Each taxi trip includes information on pick-up
date and time, drop-off date and time, passenger count, trip time in second, trip distance,
Page 13
4
pick-up location (latitude and longitude), drop-off location (latitude and longitude),
payment type, fare amount, surcharge, MTA tax, toll amount, and the total amount.
Page 14
5
CHAPTER 2
RESEARCH OBJECTIVES
Develop a new measurement of accessibility with multi-mode transportation data
including taxi, bus and subway;
Visualize and understand the spatiotemporal patterns of accessibility in NYC, defined
with different type of destinations (or origins) for different applications.
Page 15
6
CHAPTER 3
LITERATURE REVIEW
3.1 Accessibility
In general, the word “accessibility” means “capable of being reached, thus,
implying a measure of the proximity between two points” (Ingram, 1971). In the simplest
case, two places (or points) are connected, which means accessibility exists between
these two places. Measurements of accessibility can be as simple as the length of the
straight line between two points. Considering transportation road network, accessibility
between two places can be measured as the length of road, or the travel time that connect
the two places.
When measuring accessibility from a social or economic perspective, an
“attraction” variable is often added into a distance decay function. Hansen (1959)
introduced a gravity model in accessibility and land-use. For example, as the distance
between home and a shopping center increases, the possibility for one to go to that
shopping center decreases. Different functional forms can be applied to calculate the
distance decay between two locations, including power, exponential, and Gaussian (Scott
& Horner, 2008).
Accessibility in transportation research generally measures how easy, or how
difficult, for people to get to their opportunities or services (Wachs & Kumagai, 1973).
Based on different applications, Geurs and van Wee (2004) grouped accessibility into
Page 16
7
four groups: 1) infrastructure-based accessibility, 2) location-based accessibility, 3)
person-based accessibility, and 4) utility-based accessibility. Infrastructure-based
accessibility measures the performance of road network, such as travel speed and
congestion condition. Location-based accessibility measures places of interest can be
reached, given the original location. Person-based accessibility comes from space-time
geography, which measures places can be reached given individual’s time and space
constraints (M. P. Kwan, 1999; Miller, 1991). Utility-based accessibility measures the
usage of certain transportation mode or the market share of one transportation mode
(Ben-Akiva & Lerman, 1979).
Based on different data types used in accessibility measurements, Páez, Scott, and
Morency (2012) grouped accessibility measurements into two categories: normative
measurement and positive measurement. Normative measurements do not use behavior
data and considers only the performance of transportation. Larsen and Gilliland (2008)
measured food deserts in urban London, ON, Canada, based on walking and public transit
accessibility. Farber, Morang, and Widener (2014) used public transit data to study the
temporal variability of public transportation. Positive measurements use people’s travel
behavior data, which come from survey or behavioral models. For examples, Minocha et
al. (2008) used local trip data to estimate demand factors. Pasch et al. (2009) surveyed
teenagers to study the association between teenagers’ alcohol use and alcohol outlet
locations. Scott and Horner (2008) conducted a travel diary survey for urban opportunity
accessibility.
Accessibility in urban areas has been studied for many applications using
different types of data. Here, I review three major areas of urban accessibility. The first
Page 17
8
area includes studies related to public transit accessibility. Each public transit trip can be
divided into three segments: from one’s origin to transit network, travel inside transit
network, and from transit network to destination. Because of this division, public transit
accessibility has two sub-areas: to/from transit network and in transit network.
Researches in both sub-areas will be reviewed in Section 3.2. The second major area of
research involves taxi travels. Taxi travel data is a direct indicator of accessibility in
terms of monetary or time cost, but more complicated and meaningful information can be
retrieved from taxi travel data. A detailed review of taxi travel data analysis can be found
in section 3.3. The third major area focuses on relative accessibility, which includes
comparison among more than one type of accessibility measurements. Such comparison
can be conducted between accessibility using different transportation modes, during
different time periods, or for different groups of public transit users. Section 3.4 reviews
relative accessibility researches.
3.2 Accessibility in public transit
Accessibility measurements in public transit can be further grouped into two
categories: to/from transit network, and in transit network. To/From transit network
accessibility measures the destination people travel from their original location to transit
stop and travel from the last transit stop to their final destination. The in-transit-network
accessibility considers the travel time on buses or subways, transfer time among different
lines, etc.
Page 18
9
3.2.1. To/From Transit Network
This type of accessibility measures the physical access to transportation network,
defined as how far one person needs to travel to a transit stop, either a bus stop or a
subway station (Currie, 2010). It is also called service area of a transit stop in many
studies. There are two traditional methods to measure service areas: circular buffer
analysis and road network analysis. However, buffer analysis is rarely used due to
overestimation of service areas and served population. Guti and Garc (2008) and Biba,
Curtin, and Manca (2010) compared service area and population inside service areas
using circular buffer analysis and road network analysis. Their results showed that buffer
zone overestimates one-third to half of service areas and served population. Range of this
variance is due to different density of road network. Studies also showed that individuals’
walking speed and maximum tolerant walking distance affect accessibility of public
transit accessibility by changing threshold of service area (El-Geneidy, Tetreault, &
Surprenant-Legault, 2010; Hess, 2009; Mavoa et al., 2012). In addition, other factors,
such as safety, weather, infrastructure (Walton & Sunseri, 2010) and even individual’s
social identity (Murtagh, Gatersleben, & Uzzell, 2012) also affect accessibility to/from
public transit network.
3.2.2. In Transit Network
Slightly different from the general definition of accessibility, public transit
accessibility measures the ease, or difficulty, for passengers to get to their destinations
using public transit systems. The measurement of travel cost varies in different
applications and different research preferences. The most straightforward measurement is
the travel distance, or the length of public transit route between the origin and the
Page 19
10
destination, which can be calculated with road network data (Liu & Zhu, 2004). These
measurements, however, often assume that the travel speed in the network is constant,
which is not true with real transportation conditions.
Compared to the route length, the travel time is a more commonly used in
measurements for travel cost. O'Sullivan, Morrison, and Shearer (2000) developed a tool
to draw isochrones lines for public transit accessibility. Given an original point, their tool
can draw accessible areas that can be reached within a given time threshold using public
transit. Their travel time estimation is based on average travel speed along road network.
Travel-time-based accessibility measurement did not have significant development until
lately due to the lack of data availability. Later studies implemented public transit
timetable into their travel time calculation models to increase accuracy. For example,
Cheng and Agrawal (2010) developed a query-based tool called Time-based Transit
Service Area Tool (TTSAT). Users can set preferred waiting time, maximum transfers,
and time budget. TTSAT will generate accessible areas based on user-preferences and
public transit timetable. T. L. Lei and Church (2010) developed a dynamic model, which,
based on bus timetable, can calculate both accessibility from given origin to all possible
destinations, and accessibility from all possible origins to given destination.
Another important development in accessibility measurement is to measure
accessibility for different time periods of a day. Polzin, Pendyala, and Navari (2002)
included supply and demand during different time periods in one day. Based on the
predicted ridership and available public transit service, their model calculates the
availability regarding the daily trips per capita. Chen et al. (2011) applied temporal
component in job-based accessibility. They used the percentage of reachable workers for
Page 20
11
different types of industrial working places during different time periods in one day.
Their model is able to map accessibility at the block level.
3.3 Taxi Travel Data Analysis
Taxis in urban areas provide convenient and private location-to-location
transportation services based on customers’ request. In the last decade, with the
increasing global positioning system (GPS) technology, many taxi companies have
installed in-car GPS trackers in taxicabs. This tracking data not only helped track taxicabs’
movements for better navigation and dispatching but also guaranteed a safer environment
for taxi drivers. Taxi data have been used for different research objectives in different
cities all over the world, including San Francisco, USA (Herring et al., 2010; Hoque,
Hong, & Dixon, 2012; Hunter et al., 2009), Lisbon, Portugal (Veloso et al., 2011),
Shanghai, China (Peng et al., 2012), Stockholm, Sweden (Jenelius & Koutsopoulos,
2013), and Delft, Netherlands (Zheng & Van Zuylen, 2013).
Taxi data can be grouped into two categories: tracing data and origin-destination
(OD) data. Tracing data consists of taxi trajectories obtained from GPS devices that
record taxi locational information at a certain time interval, usually at 30 seconds or 60
seconds. They are very useful to monitor road network condition and are commonly used
to measure infrastructure-based accessibility. Researchers first plotted locations onto road
network map, then processing data by projecting any off-road points onto road networks.
Based on continuous changes in location, driving speed can be inferred and thus travel
time can be predicted. Hunter et al. (2009) used about 60,000 observations from 50
taxicabs in San Francisco to calculate travel time. Herring et al. (2010) used a
Page 21
12
probabilistic model to estimate arterial traffic condition from 500 taxicabs in San
Francisco. Veloso et al. (2011) used Gamma distribution to model taxicabs’ distribution
over Lisbon, Portugal area. Jenelius and Koutsopoulos (2013) used data from 1500
vehicles in Stockholm, Sweden to estimate travel time between any two points on the
road network. Zheng and Van Zuylen (2013), based on probe cars, created a three-layer
neural network to simulate travel conditions in Delft, Netherlands.
3.4 Relative Accessibility
Relative accessibility compares different accessibility measures. These
comparisons can be between poverty and non-poverty (Niedzielski & Eric Boschmann,
2014), personal identities (Murtagh, Gatersleben, & Uzzell, 2012), genders (M. P. Kwan,
1999), and age groups (Hess, 2009). The most commonly compared pair in transportation
and planning research is between public transportation and private car driving. The travel
time for car-based accessibility uses similar methods as used in infrastructure-based
accessibility measurements and public transit-based accessibility measurements have
been reviewed in section 3.2. In this section, I will review research work on relative
accessibility between public transit and private vehicle.
Implemented from O'Sullivan, Morrison, and Shearer (2000), mapping service
areas from a given location of public transit and driving provides the most direct
comparison between accessibility measurements. Besides visual comparison, travel time
ratio and location-based accessibility measurements are commonly used to quantify
differences in accessibility.
Page 22
13
Mapping the ratio of travel time between public transit and private vehicle is one
of the common methods. Hess (2005) focused on low-wage job accessibility for low-
income adults in the Buffalo-Niagara region. From centroid of each neighborhood, they
calculated a 30-minute travel buffer for automobile driving and public transit riding,
respectively. Their job accessibility measurements were the summations of jobs within
30-minute travel time. They used the ratio of automobile and public transit job
accessibility in each neighborhood. Their results showed that automobile drivers have 2-3
times more job accessibility than public transit users. Salonen and Toivonen (2013) used
travel time ratio of public transit to car to map accessibility to public libraries in Greater
Helsinki area, Netherland. They used three different models for public transit and driving:
(1) a simple model that ignores congestion and parking, (2) an intermediate model that
includes congestion but ignores parking, and (3) an advanced model considering both
congestion and parking. In all three models, the average travel time for public transit is
longer than average travel time for cars. In addition, public transit travel time to the
closest destination is also longer than that for cars. However, this ratio measurement is
calculated at the infrastructure level, by measuring how public transit and taxi are
performing locally. Only one original location can be used at each time. When original
location is determined, it measures accessibility as a property to all possible destinations.
There are studies on location-based accessibility measurements, which often
employ an opportunity index to compare accessibility among different locations. Shen
(2001) studied job opportunities differences between using public transit and driving.
They defined an accessibility score as the ratio of the total number of opportunities to the
total of opportunity seekers for each zone. They generated 775 transportation analysis
Page 23
14
zones in the Boston Metropolitan Area and calculated a job opportunity index for each
zone using public transit and private cars. Their study showed that not many job
opportunities exist if one only uses public transit. For these opportunity-based calculation
methods, researchers need to arbitrarily assign a weight or score to different opportunity
or activity types, or arbitrarily classify service or importance levels for different
opportunities. Compared to ratio measurements, opportunity-based measurements
consider accessibility as a property of original location, but these weights or
classifications are usually based on self-understanding or survey results.
3.5 Applications with Accessibility Measurements
Location based accessibility measures the opportunity and convenience for people
to get to their activity places, such as work places, healthcare facilities, supermarkets,
educational resources, and other activity locations that are essential for people’s daily life.
In the past, many researchers have used accessibility measurements as social indicators to
study social inequality and to examine urban development and planning.
Shen (2001) and Hess (2005) used public transit accessibility to measure spatial
distributions of job opportunities and poverty adults. Their studies identified the spatial
mismatch between job opportunities and labor market. Kawabata and Shen (2007) and
Tribby and Zandbergen (2012) used public transit accessibility to jobs to measure urban
developments and public transportation planning. T. Lei, Chen, and Goulias (2012) and
Chen et al. (2011) examined accessibilities in different types of working and identified
workers in certain sectors to improve their commuting experiences. Niedzielski and Eric
Page 24
15
Boschmann (2014) compared commuting accessibility for poverty workers and non-
poverty workers.
Accessibility measurements are also important in health geography. Lovett et al.
(2002) measured accessibility from each postcodes to local general practitioners. Burns
and Inglis (2007) compared accessibilities to supermarkets (healthy food) and fast food
outlets (unhealthy food) for people from different socio-economic status. Langford, Fry,
and Higgs (2012) measured public transit to primary and secondary healthcare facilities.
Page 25
16
CHAPTER 4
DATA AND STUDY AREA
4.1. Study Area: New York City
This research focuses on the New York City (NYC), which consists of five
boroughs: Brooklyn, Queens, Manhattan, the Bronx, and Staten Island (Figure 4.1). Each
of the five boroughs is a separate county of the state of New York. According to the U.S.
Census Bureau, NYC has an estimated population of 8,491,079 in year 2014 and an area
of about 800 km2. Since Staten Island has a separate subway system that is not connected
to the main subway system and has very limited bus routes connecting to the main areas
of NYC, Staten Island is excluded in this study (Figure 4.1).
Figure 4.1: Study Area of NYC
Page 26
17
NYC has the highest population density of all the major cities in the United States,
which makes NYC an ideal study area for this research for two main reasons. First, the
public transportation ridership is very high in NYC. Due to limited spaces and high land
price, NYC has the lowest car ownership in the United States, with 66% households not
having a private car (Salon, 2009). Therefore, residents’ daily commuting and traveling
rely heavily on public transportation. According to the data from Metropolitan
Transportation Authority (MTA)’s ridership report in 2013, the annual ridership was
more than 1.7 billion for subway and 0.67 billion for transit buses. On an average
weekday, the ridership was about five million for subway and two million for transit
buses. According to the data obtained from the New York City Taxi & Limousine
Commission, there were more than 14 million taxi trips for each month in 2013, i.e.,
roughly half a million taxi trips per day.
Second, NYC has a very complex, dense and effective public transportation
network and a large fleet of taxi cars. In the Manhattan area, bus stops or subway stations
are within walking distance. In 2013, there were 13,437 taxicabs running in NYC. In
addition, there are 21 subway routes with 494 subway stations in NYC. Transit bus
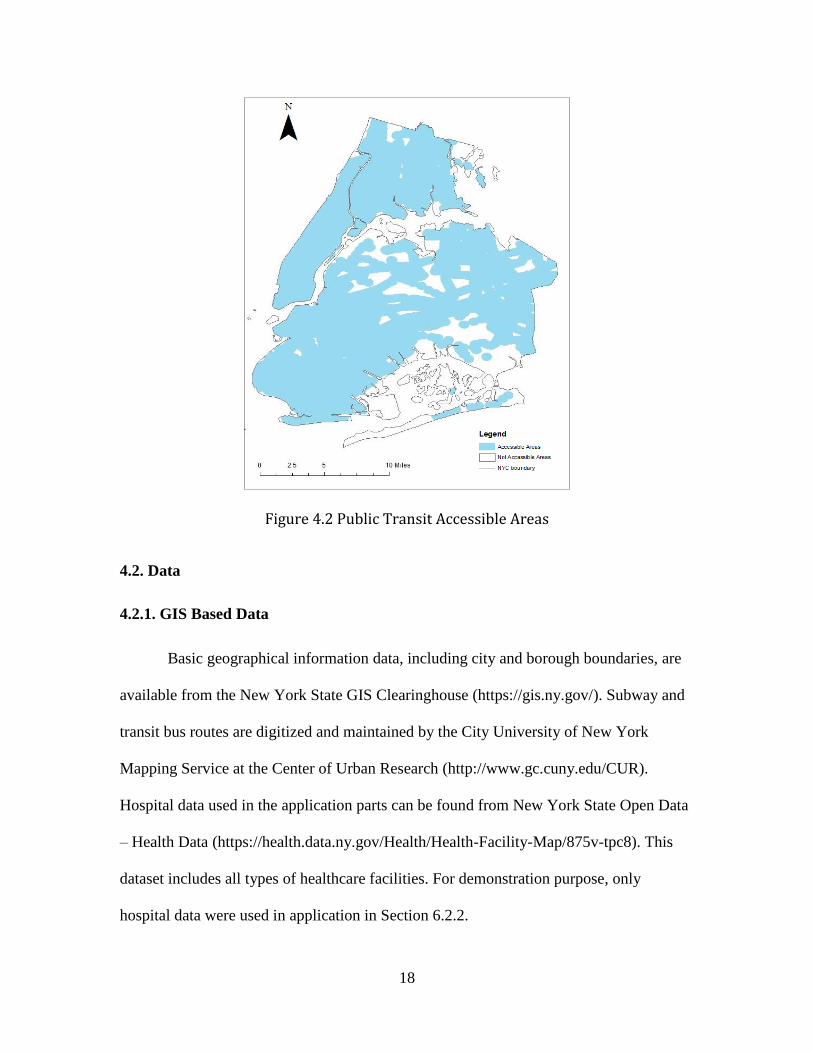
network consists of 237 local routes and 65 express routes (MTA, 2013). Figure 4.2 is a
demonstration of accessible areas of public transit system, assuming the willing walking
distance is 500 meters. This high density of public transportation network and high
diversity in transportation mode choices in NYC provide a strong necessity, an ideal test
bed, and abundant data for the studying, understanding, and use of accessibility.
Page 27
18
Figure 4.2 Public Transit Accessible Areas
4.2. Data
4.2.1. GIS Based Data
Basic geographical information data, including city and borough boundaries, are
available from the New York State GIS Clearinghouse (https://gis.ny.gov/). Subway and
transit bus routes are digitized and maintained by the City University of New York
Mapping Service at the Center of Urban Research (http://www.gc.cuny.edu/CUR).
Hospital data used in the application parts can be found from New York State Open Data
– Health Data (https://health.data.ny.gov/Health/Health-Facility-Map/875v-tpc8). This
dataset includes all types of healthcare facilities. For demonstration purpose, only
hospital data were used in application in Section 6.2.2.
Page 28
19
4.2.2. Taxi Trip Data
The New York City Taxi & Limousine Commission is one of the major taxi
companies operating in NYC. Trip data are available for taxicabs holding license from
the NYC Taxi & Limousine Commission. This research uses the taxi trip data for the
entire year of 2013, which has 13,437 registered taxicabs and 173,179,759 taxi trips in
2013 (i.e. about half a million taxi rides each day), with a total of 1.99 billion dollars for
taxi fare (tips were not included). Information associated with each trip includes: pick-up
data and time, drop-off date and time, passenger count, trip time in second, trip distance,
pick-up location (latitude and longitude), drop-off location (latitude and longitude),
payment type, fare amount, surcharge, MTA tax, toll amount, and total amount. The
average taxi trip time was 799 seconds (about 13 minutes), the average trip distance was
4.65 kilometers and the average fare for a taxi trip was 11.49 dollars.
In this research, it is assumed that that the actual driving route (which is not
available in the data) of each recorded taxi trip is the shortest path (in terms of travel time)
from the origin to the destination.
4.2.3. Public Transit Data
Public transit data for New York City subway and transit buses are published and
maintained by the Metropolitan Transportation Authority (MTA), which is the company
that operates NYC subways and major transit bus routes. The public transit data are in
General Transit Feed Specification (GTFS) format, containing public transportation
schedules and associated geographical information. The structure of GTFS data includes
agency, routes, trips, stops, stop_times, and calendar. Detailed explanation of the GTFS
data format can be found at https://developers.google.com/transit/gtfs/reference.
Page 29
20
CHAPTER 5
METHODOLOGY
This research proposes a Relative Index to measure the relative accessibility
between public transit and taxi. As reviewed in Section 3.4, there are two main
approaches to measure relative accessibility: travel time ratio measurement and
opportunity-based measurement. Travel time ratio is used to measure the relative
performance between taxi and public transit and considers accessibility as a property of
the connection between origin and destination (rather than a property of the location).
Opportunity-based measurement, on the other hand, views accessibility as a property of
the location (rather than the connection), which involves arbitrary decisions on different
types of destinations.
Relative Index developed in this study has three innovations. First, it considers
accessibility as a property of a location but derives the measure as the collective property
of all connections that involve the location. The new measure is calculated with real and
big travel records so that there are much less arbitrary decisions or biases involved
compared to traditional methods. Second, the method uses historical taxi travel records
and public transit timetables to accurately model travel time, rather than using road
network and properties such as speed limit as previous studies do. Third, the new method
and data can enable the measurement of accessibility at high spatiotemporal resolution,
e.g., for different time periods of a day and different days of a week, based on big data of
Page 30
21
taxi trips and transit schedules (which, for example, differ significantly for weekdays and
weekend days). As such, the new method can enable the analysis and understanding of
dynamic accessibility patterns, with time-varying and multimodal accessibility
measurements.
The proposed Relative Index (RI) measurement is derived with a regression
approach. The RI for a given location is defined as the slope of the regression line, with
public transit travel time on y-axis and taxi travel time on x-axis, for all (or a selected
group of) destinations from the given location. This new method can enable both
location-based measurement (by deriving a regression line with data for destinations) and
connection-based measurement (by comparing the travel time ratio of the specific
connection to the regression line), both of which can vary across space and time.
5.1 Public Transit Accessibility
Given an origin, a destination, and a departure time, the total travel time can be
estimated based on the complete public transit schedule, with the arrival and departure
time for each bus or subway train and the estimate of walk time for transfer connections
within the network and to/from origin/destination. The Dijkstra shortest path algorithm is
used to find the travel time using public transportation between the origin and the
destination, including walking time to/from stations, waiting time, riding subways and/or
buses, walking for transfers, and waiting time during transfer. I use the threshold of 500
meters to define a “walkable” distance from an origin location to a public transit and
from the public transit to a destination, calculated using the Manhattan distance.
Page 31
22
5.2 Taxi Accessibility
One of the contributions of this study is to use real big data of historical taxi trip
records (instead of road networks) to estimate the actual travel time between a given
origin and a destination for a specific departure time. As such, it implicitly considers
traffic conditions and other unknown factors in calculating the driving time. Given an
origin, a destination, and a departure time, related Taxi travel records will be retrieved
and processed to estimate the travel time, which can be the average time of all taxi trips
that started from the neighborhood of the origin around the given departure time and
ended near the destination.
5.3 Relative Index (RI)
First, for each origin location, the travel time to each possible destination (i.e.
other public transit stops in the transit network and out of the 500-meter buffer zone
around the transit stop) is obtained with the shortest path algorithm and the public transit
schedule. For each destination, the actual taxi trip time is also obtained from the taxi trips
data, as explained in previous sections.
Then for the given origin, its public transit time and taxi time to each destination
are plotted, with the taxi travel time on the x-axis and the public transit time on the y-axis.
A regression analysis is used to derive a Relative Index between the public transit travel
time and taxi travel time. Specifically, the Total Least Square regression method is used:
𝒚 = 𝜶 + 𝜷𝒙 Eq 5.1
where the slope of this regression line, β, is an overall measurement of how efficient the
public transit system is compared to taxi. Compared to the Ordinary Least Square
Page 32
23
regression (Figure 5.1 left), the Total Least Square regression (Figure 5.1 right) calculates
residuals for both x and y. which allow us to treat α and β symmetrically (Golub & Van
Loan, 1980). In this research, errors exist in both taxi and public transit measurements
and thus the Total Least Square regression is more suitable for this case.
Figure 5.1: Comparison Between OLS and TLS Regression.
In Eq. 1, α (intercept with y-axis) can be understood as the walking time to public
transit system and the waiting time for next bus or subway. Because taxi waiting time is
not available, α is neglected in this measurement. The slope or this regression line, β, is
defined as RI in this measurement.
For one location, RI means the expected change in travel time of public transit
given travel time changes in taxi. For example, if one location has RI of 7.5, it means, for
every minute increasing in taxi travel time, public transit riders should expect 7.5 minutes
increasing using public transit. If one location has RI of 1, it means taxi and public transit
have essentially similar performances. Therefore, high RI means this location has a low
relative accessibility (i.e. not convenient for people to use public transit system compared
to using taxi) and low RI means high relative accessibility, that public transit has similar
Page 33
24
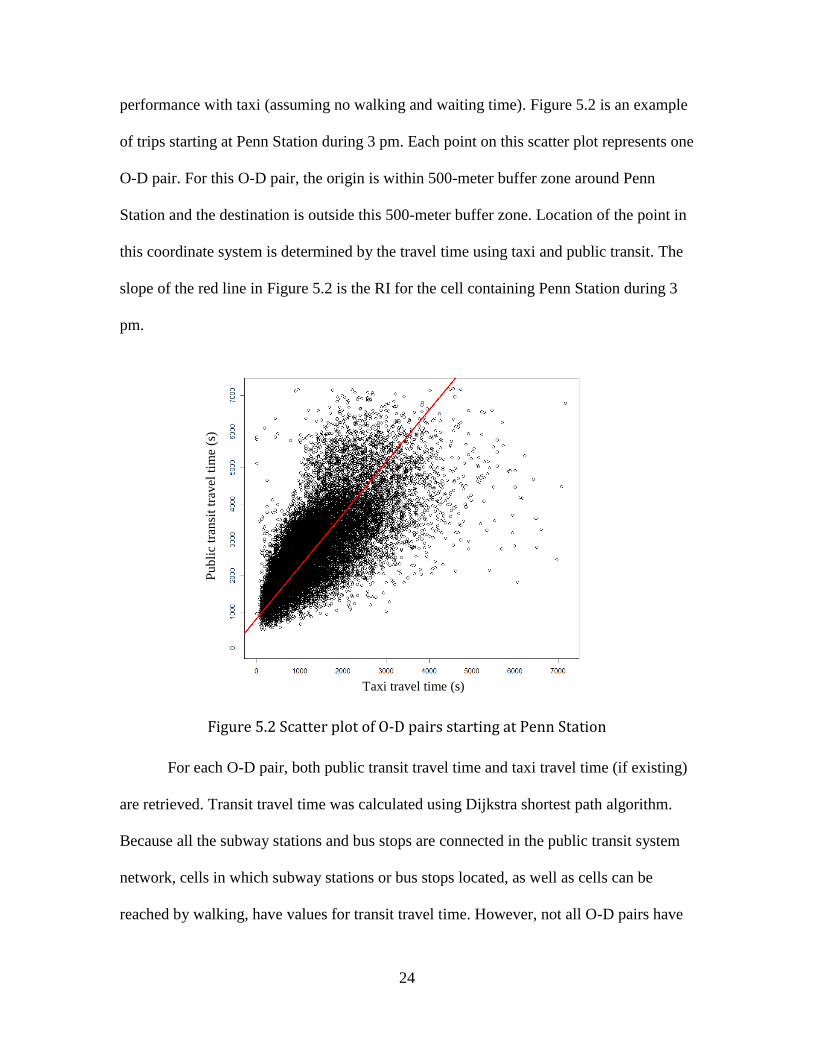
performance with taxi (assuming no walking and waiting time). Figure 5.2 is an example
of trips starting at Penn Station during 3 pm. Each point on this scatter plot represents one
O-D pair. For this O-D pair, the origin is within 500-meter buffer zone around Penn
Station and the destination is outside this 500-meter buffer zone. Location of the point in
this coordinate system is determined by the travel time using taxi and public transit. The
slope of the red line in Figure 5.2 is the RI for the cell containing Penn Station during 3
pm.
Figure 5.2 Scatter plot of O-D pairs starting at Penn Station
For each O-D pair, both public transit travel time and taxi travel time (if existing)
are retrieved. Transit travel time was calculated using Dijkstra shortest path algorithm.
Because all the subway stations and bus stops are connected in the public transit system
network, cells in which subway stations or bus stops located, as well as cells can be
reached by walking, have values for transit travel time. However, not all O-D pairs have
Taxi travel time (s)
Pu
bli
c tr
ansi
t tr
avel
tim
e (
s)
Page 34
25
taxi trips. For O-D pairs have more than one taxi trips, the average time for all taxi trips is
used for taxi travel time of that O-D pair. When calculating RI for origins, only if one
origin has no less than 10 O-D pairs to be considered as a valid location. Similarly, when
calculating RI for a destination, that destination must have no less than 10 O-D pairs. In
others words, to run the regression, no less than 10 points must exist on the scatter plot.
The Relative Index is considered as a property for the origin location and may be
used for further applications, such as travel planning, job housing balancing, and health-
related analysis. RI can also be derived for each destination. For example, one can focus
on public parks in NYC as destinations to analyze the accessibility patterns to green
spaces. One can also select a set of origins and compare their overall accessibility to work
places in NYC.
Page 35
26
CHAPTER 6
RESULTS AND DISCUSSION
This section provides an overview of analysis results. First are results from
exploratory analysis. Maps for travel time ratio between public transit and taxi during
different time periods are provided in the Section 6.1. Section 6.2 present maps of
Relative Index (RI) that calculated using methodology described in section 5. For each
origin, all destinations with valid trips are included and calculated towards RI for that
origin (section 6.2.1). Section 6.2.2, RI of selected destinations are provided and
compared for different time periods during one day. Details of these results are discussed
in section 7.
6.1. Exploratory Analysis
To provide a fundamental understanding of travel time difference between public
transit and taxi trips, travel time ratio is first calculated as following:
𝑻𝒓𝒂𝒗𝒆𝒍 𝒕𝒊𝒎𝒆 𝒓𝒂𝒕𝒊𝒐 = 𝒕𝒊𝒎𝒆𝒑𝒖𝒃𝒍𝒊𝒄 𝒕𝒓𝒂𝒏𝒔𝒊𝒕
𝒕𝒊𝒎𝒆𝒕𝒂𝒙𝒊 Eq. 6.1
Pennsylvania Station (Penn Station) was selected as the original location because it is one
of the most important transit hubs connecting commuting trains from New Jersey and
public transit network in NYC. All taxi trips that started within 500 meters from Penn
Station and have destinations outside the 500-meter buffer zone are used to derive the
Page 36
27
ratio for each specific connection (i.e., from Penn Station to the specific
destination). This method is similar to some relative accessibility measurements reviewed
in section 5.3.
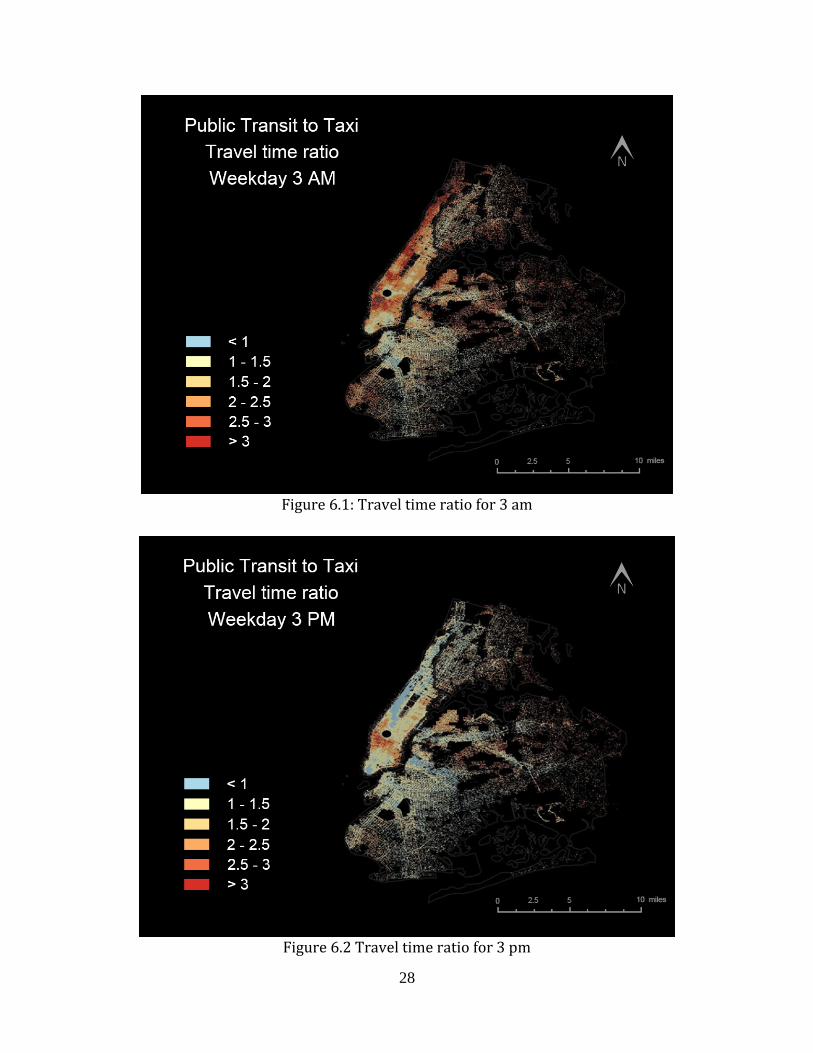
Figure 6.1 and Figure 6.2 show travel time ratio during two different time periods
in a day. The origin (Penn Station) locates at the center of a black hole as short trips (trip
distance less than 500 meters) were excluded in this analysis. In these two maps, blue
colors indicate that the public transit time is shorter than taxi time, while red colors
indicate that a taxi takes less time than public transit to travel from Penn Station to the
destination. For some destinations, the public transit time can be more than three times
longer than taxi travel time.
This exploratory analysis demonstrates the impact of subway frequency. 3 am was
chosen as an example for midnight, when very few public transit services are provided.
At this time, Manhattan area shows 2-3 times longer travel time using public transit than
using taxi. Even though Manhattan is generally considered with the most road
congestions and the most convenient public transit system, during night hours, public
transit accessibility is reduced by limited public transit services.
6.2. Relative Index (RI) Results
RI, as mentioned in Section 5, is measuring accessibility as a property of a given
location, assigning equal weights to all connected O-D pairs. In Section 6.2.1, RI is
computed for each origin, considering trip records from this given origin to all possible
destinations. RI for origin is useful considering how convenient one can go to
Page 37
28
Figure 6.1: Travel time ratio for 3 am
Figure 6.2 Travel time ratio for 3 pm
Page 38
29
different places using public transit compare to using taxi, which is an improvement for
opportunity-based accessibility measurement. RI for destination is calculated and
presented in Section 6.2.2. In this Section, 9 hospitals were selected as destinations in this
research, to indicate how convenient for people to go to hospital when using public
transit compared to using taxi.
6.2.1. RI for Origins
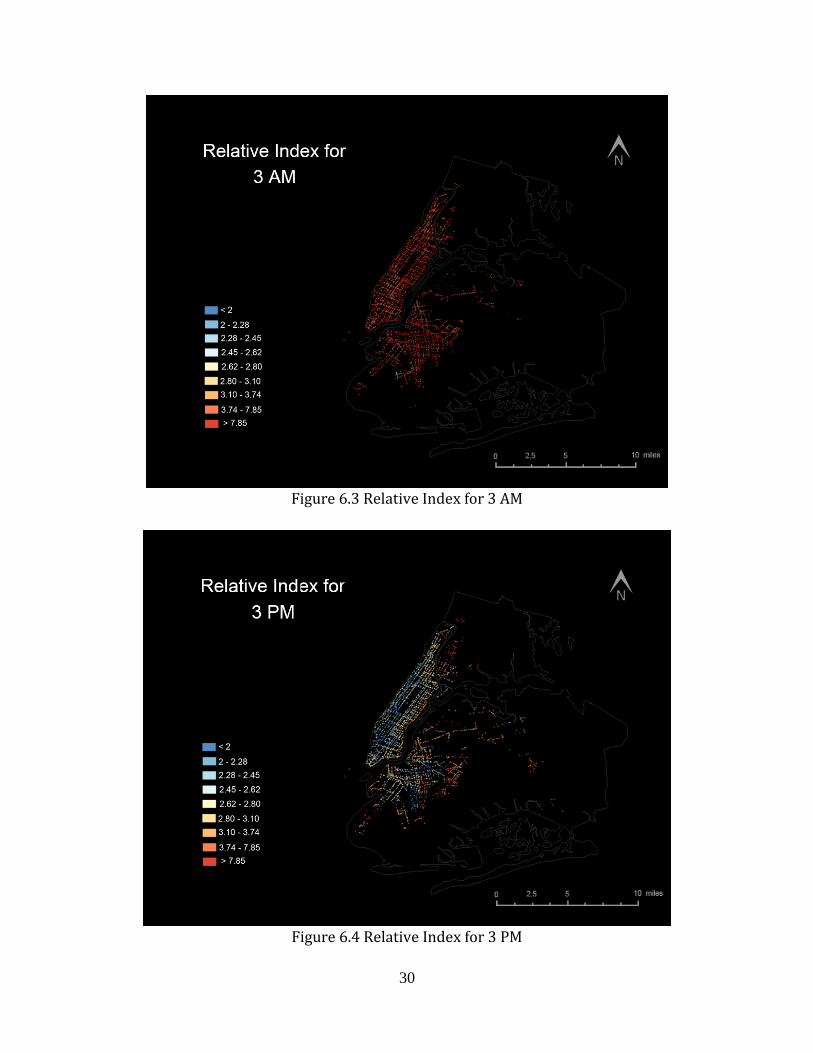
Figure 6.3 and Figure 6.4 are two maps of RI in NYC, for two different time
periods in a day. Figure 6.3 indicates RI for 3am, representing transportation conditions
during night hour and Figure 6.4 shows RI for 3pm, representing that for day hours. In
both figures, red color indicates steep slopes for regression lines, which means longer
travel time public transit needs than taxi, while blue color indicates smaller differences
between public transit and taxi. These break numbers are quantile division of all possible
slopes. In other words, the array of slope values (combined 3 am and 3 pm) was divided
into 9 classes and the amounts of numbers in each class are the same.
For each origin, we first plotted travel time for all the destinations onto a scatter-
plot, similar to Figure . Valid locations were determined according to criteria stated in
Section 5.4. With limited number of trips, many cells have no value, which are
represented in black color.
In Figure 6.3 and Figure 6.4, the majority of Manhattan areas and some parts of
Brooklyn have continuous values. In Queens, only areas along major subway lines and
around some stations have values. Whether one cell has value or not indicates the
transportation demand for people in this cell.
Page 39
30
Figure 6.3 Relative Index for 3 AM
Figure 6.4 Relative Index for 3 PM
Page 40
31
In the map for 3 am, most areas are shown in red color, which means, for every
one more minute traveling in taxi, public transit riders should expect at least 4 more
minutes needed when riding public transit. In most areas (shown in dark red), public
transit riders should expect at least 8 more minutes for public transit. Map for 3 pm is
quite different from the one for 3 am, where the majority of Manhattan is covered by blue
or yellow color. This means the majority of Manhattan areas have low RI, indicating high
public transit accessibility. During day hours, for every one more minute traveling in taxi,
public transit riders should expect less than one or two more minutes increasing in using
public transit system.
6.2.2. RI for Destinations
This section presents result from RI calculation for selected destinations. Nine
major hospitals were selected as destinations. This result provided a practical scenario
about how convenient for people to go to hospitals in 3 am and 3 pm. Similar to
calculation in Section 6.2.1, for each hospital as a destination, the original cell mush have
more than 10 trips to be considered as a valid origin for that O-D pair. Since all of the 9
hospitals have more than 10 O-D pairs, all of the 9 hospitals were included in this
computation. Table 6.1 and Figure 6.5 showed the results of RI for these 9 hospitals as
destinations during 3 am and 3 pm.
Page 41
32
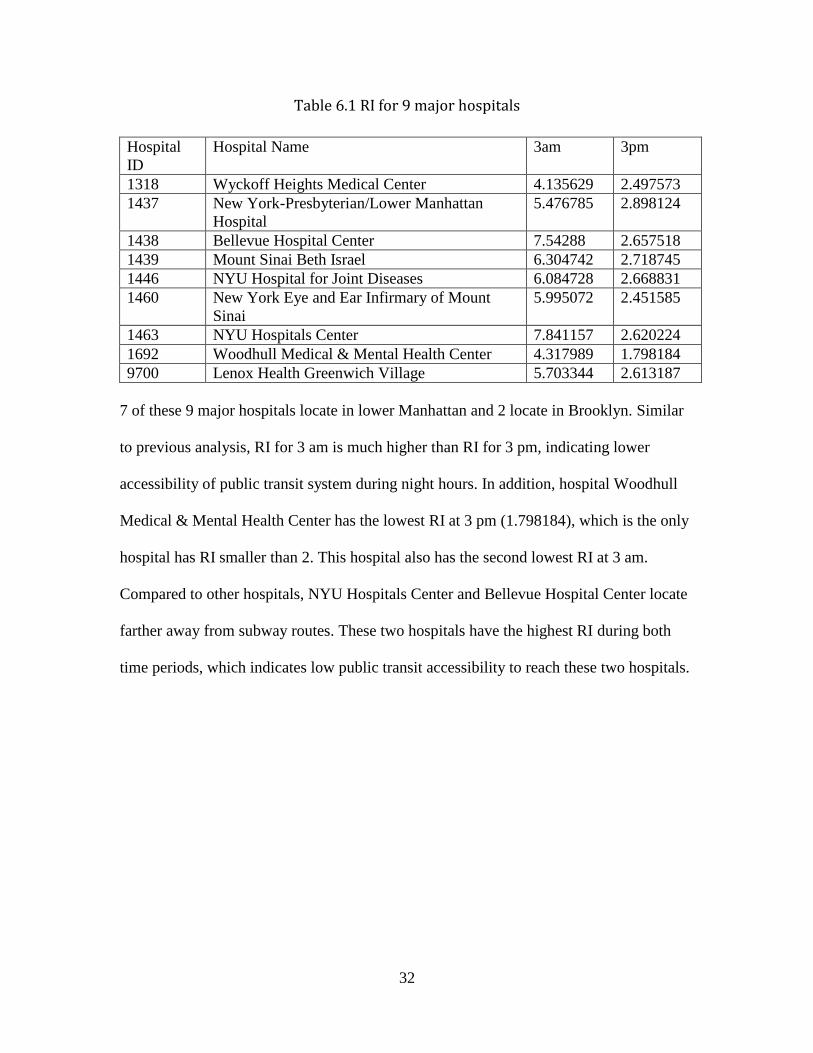
Table 6.1 RI for 9 major hospitals
Hospital
ID
Hospital Name 3am 3pm
1318 Wyckoff Heights Medical Center 4.135629 2.497573
1437 New York-Presbyterian/Lower Manhattan
Hospital
5.476785 2.898124
1438 Bellevue Hospital Center 7.54288 2.657518
1439 Mount Sinai Beth Israel 6.304742 2.718745
1446 NYU Hospital for Joint Diseases 6.084728 2.668831
1460 New York Eye and Ear Infirmary of Mount
Sinai
5.995072 2.451585
1463 NYU Hospitals Center 7.841157 2.620224
1692 Woodhull Medical & Mental Health Center 4.317989 1.798184
9700 Lenox Health Greenwich Village 5.703344 2.613187
7 of these 9 major hospitals locate in lower Manhattan and 2 locate in Brooklyn. Similar
to previous analysis, RI for 3 am is much higher than RI for 3 pm, indicating lower
accessibility of public transit system during night hours. In addition, hospital Woodhull
Medical & Mental Health Center has the lowest RI at 3 pm (1.798184), which is the only
hospital has RI smaller than 2. This hospital also has the second lowest RI at 3 am.
Compared to other hospitals, NYU Hospitals Center and Bellevue Hospital Center locate
farther away from subway routes. These two hospitals have the highest RI during both
time periods, which indicates low public transit accessibility to reach these two hospitals.
Page 42
33
Figure 6.5 RI for 9 hospitals in NYC
Page 43
34
CHAPTER 7
DISCUSSION
In the resulted travel time ratio maps, East part of the Central Park provides a
good example indicating how subway lines are shaping travel time ratio. Subway line 1, 2,
and 3 runs along the area. Assume all subways are running according to timetable and no
delays happen. During rush hours, the average waiting time for line 1, 2, and 3 are 6
minutes and express subway lines only stop at several stations. However, during night
hours, the average waiting time for these lines is 20 minutes. This change in travel time
ratio is noticeable as the blue area, a fast corridor, exists in the east side of Central Park,
which only appears during day hours.
Another fast corridor in Queens also indicates the impacts of subway line 7 and 7
express. Line 7 and 7 express share the same route but 7 express only stops at some major
stations while line 7 stops at all stations. These two subway lines are the only subways
connecting lower Manhattan and residential areas in Queens, where many commuters
from minority races live. Areas, where line 7 and 7 express running through, show less
transit travel time than taxi travel time. Areas around line 7 and 7 express still present
relatively good travel time ratio.
In figure 4 and figure 5, not all locations have enough trip records to be
considered as a valid location in RI measurement. Visual examination of figure 4 and 5
Page 44
35
provided evidences about travel demands for taxis. Since public transit network almost
covers the whole NYC (see Figure 4.2), whether a location is valid or not was actually
determined by the number of taxi trips starting from that location. In figure 4 and 5, most
areas of Manhattan have enough taxi trips to be considered as valid. Outside of
Manhattan, most valid locations are along subway lines. This distribution pattern
indicated taxi travel demand. From this visual examination, NYC provided a good public
transit service to catch people’s travel demands.
At the same time, one may notice that the pattern of subway lines are better
represented by travel demand than the patterns of buses. This shows that, people
preferred to ride subways than buses. Maybe riders preferred to avoid ground traffic
congestion, or subway riding environment.
During 3 am, RI results for NYC was mainly in red or orange colors, even in
Manhattan area, where people would expect the most convenient public transit services.
In 3 pm, Manhattan area shows results as most people would expect. Blue and yellow
color in Manhattan represented high accessibility. This difference between 3 am and 3
pm are resulted from the frequency of subway services during day hours and night hours.
With reduced number of running subways during night hours and consequent longer
waiting time, accessibility for public transit during night is much lower than accessibility
during daytime.
Similar results can be found in results of RI for selected destinations as well. For
all the 9 hospitals, RI during day hours for each hospital is much lower than RI during
night hours. During day hours, RI for these 9 hospitals range from 1.798184 to 2.898124.
During night hours, RI ranges from 4.135629 to 7.841157. The range of RI and RI
Page 45
36
differences for individual hospital indicate several factors work together to affect the
general public transit accessibility. What causes this difference for each individual
hospital requires further research.
Page 46
37
CHAPTER 8
CONCLUSION AND FUTURE RESEARCH
This research developed a new measurement of accessibility that tried to bridge
current methodology with the increasing availability of multimodal transportation data.
Current measurements of accessibility either choose one important location as origin or
destination and measure accessibility from that origin or to that destination, or
researchers arbitrarily assign scores to opportunities and measure scores of different
origins as accessibility. The major contribution of this research is to develop a new
measurement of accessibility to integrate multiple transportation modes. This method
gives equal opportunity for all possible destinations, which reduced subjective bias in
opportunity weighting. To achieve these objectives, this research used historical taxi trip
records and public transit timetable to compute taxi and public transit travel time. Then
all the pairs of origin-destination (O-D) were plotted with taxi travel time on x-axis and
public transit travel time on y-axis. One location must have no less than 10 O-D pairs to
be considered as a valid location. For each valid location, total least square regression
was applied and the slope from regression is defined as RI, representing the measurement
of accessibility.
Mapping RI for NYC, especially during daytime, provided visualization of spatial
accessibility patterns. The east side of Central Park demonstrated the fast corridor created
by express subway lines. Most areas with lower RI, which means better public transit
Page 47
38
accessibility, locate along or near subway lines. Public transit, especially subway systems
in NYC, provided good service to meet people’s travel demands.
RI for different time periods showed the temporal changes of accessibility
patterns in NYC. During night hours, limited public transit services were provided and
less traffic congestion happening on the road. Therefore RI is high during night hours,
indicating low accessibility level of public transit. During daytime, with more frequent
subway running in the NYC and express lines, the accessibility of public transit is higher,
represented as low RI on map. Comparing RI of the same location during different time
of a day indicates the temporal changes of accessibility.
On the other hand, RI can measure accessibility of destination. In this research, 9
major hospitals were chosen as destinations and were compared for how convenient for
people to reach hospital. This application provided practical usage to RI in urban
planning and development.
However, this research shows some limitations and needs further improvement.
First major limitation is about taxi data. Since taxi travel time was retrieved from
historical taxi data, errors existing in taxi data would affect this measurement. For
example, in the map of RI for 3 am (see Error! Reference source not found.), one taxi
trip record with long travel time affected RI for that area. In addition, a 500-meter buffer
zone was applied as taxi trip inclusion area. However, this buffer zone created larger
effects of one incorrect taxi trip records to areas around that point. In future research,
more efforts are needed in early-stage of data clean and filter out incorrect records in taxi
trips. Second limitation of this research is about valid locations. With assumption of 500-
meter walking distance, all the subway stations, bus stops, and 500-meter walking
Page 48
39
accessible areas have public transit time for accessibility measurement. But to calculate
RI, each of these locations must have enough (10 was the threshold used in this research)
taxi trips starting from or stopping at that location to be considered as a valid origin or
destination. Many areas, especially areas other than Manhattan, were not valid in this
research. In future research, either a smoothing algorithm or a scalable filter could be
applied to increase the number of valid locations. Another limitation with public transit
was about possible delays or other unexpected situations. If RI is applied to city
development or travel planning, how to include real-time information and improve
computational speed require further research. In addition, the walking distance of local
people varies in different places. More details about local people’s travel behaviors
require further analysis.
This research also provides one applications of RI that measured accessibility for
people to reach 9 major hospitals in NYC. Similarly, RI can be applied to measure
accessibility for schools, public libraries, or tourism. Also, given standardized data
format for taxi trip records and public transit timetable, this research can be applied to
different cities.
Page 49
40
REFERENCES:
Ben-Akiva, M., & Lerman, S. R. (1979). Disaggregate travel and mobility choice models
and measures of accessibility. Behavioural travel modelling, 654-679.
Biba, S., Curtin, K. M., & Manca, G. (2010). A new method for determining the
population with walking access to transit. International Journal of Geographical
Information Science, 24(3), 347-364. doi:10.1080/13658810802646679
Burns, C. M., & Inglis, A. D. (2007). Measuring food access in Melbourne: access to
healthy and fast foods by car, bus and foot in an urban municipality in Melbourne.
Health Place, 13(4), 877-885. doi:10.1016/j.healthplace.2007.02.005
Chen, Y., Ravulaparthy, S., Deutsch, K., Dalal, P., Yoon, S. Y., Lei, T., Goulias, K.,
Pendyala, R., Bhat, C., & Hu, H.-H. (2011). Development of opportunity-based
accessibility indicators. Transportation Research Record, 2255, 19.
Cheng, C.-L., & Agrawal, A. W. (2010). TTSAT- A New Approach to Mapping Transit
Accessibility. Journal of Public Transportation, 13(1), 18.
Church, R. L., & Marston, J. R. (2003). Measuring accessibility for people with a
disability. Geographical Analysis, 35(1), 83-96.
Currie, G. (2010). Quantifying spatial gaps in public transport supply based on social
needs. Journal of Transport Geography, 18(1), 31-41.
doi:10.1016/j.jtrangeo.2008.12.002
Page 50
41
El-Geneidy, A. M., Tetreault, P., & Surprenant-Legault, J. (2010). Pedestrian access to
transit: Identifying redundancies and gaps using a variable service area analysis.
Paper presented at the Transportation Research Board 89th Annual Meeting.
Farber, S., Morang, M. Z., & Widener, M. J. (2014). Temporal variability in transit-based
accessibility to supermarkets. Applied Geography, 53, 149-159.
Geurs, K. T., & van Wee, B. (2004). Accessibility evaluation of land-use and transport
strategies: review and research directions. Journal of Transport Geography, 12(2),
127-140. doi:10.1016/j.jtrangeo.2003.10.005
Golub, G. H., & Van Loan, C. F. (1980). An analysis of the total least squares problem.
SIAM Journal on Numerical Analysis, 17(6), 883-893.
Guti, J., & Garc, J. C. (2008). Distance-measure impacts on the calculation of transport
service areas using GIS. Environment and Planning B: Planning and Design,
35(3), 480-503.
Hansen, W. G. (1959). How accessibility shapes land use. Journal of the American
Institute of planners, 25(2), 73-76.
Herring, R., Hofleitner, A., Abbeel, P., & Bayen, A. (2010). Estimating arterial traffic
conditions using sparse probe data. Paper presented at the Intelligent
Transportation Systems (ITSC), 2010 13th International IEEE Conference on.
Hess, D. B. (2005). Access to employment for adults in poverty in the Buffalo-Niagara
region. Urban Studies, 42(7), 1177-1200.
Hess, D. B. (2009). Access to public transit and its influence on ridership for older adults
in two US cities. Journal of Transport and Land Use, 2(1).
Page 51
42
Hoque, M. A., Hong, X., & Dixon, B. (2012). Analysis of mobility patterns for urban taxi
cabs. Paper presented at the Computing, Networking and Communications
(ICNC), 2012 International Conference on.
Horner, M. W. (2004). Exploring metropolitan accessibility and urban structure. Urban
Geography, 25(3), 264-284.
Hunter, T., Herring, R., Abbeel, P., & Bayen, A. (2009). Path and travel time inference
from GPS probe vehicle data. NIPS Analyzing Networks and Learning with
Graphs, 12, 1.
Ingram, D. R. (1971). The concept of accessibility: a search for an operational form.
Regional studies, 5(2), 101-107.
Jenelius, E., & Koutsopoulos, H. N. (2013). Travel time estimation for urban road
networks using low frequency probe vehicle data. Transportation Research Part
B: Methodological, 53, 64-81.
Kawabata, M., & Shen, Q. (2007). Commuting inequality between cars and public transit:
The case of the San Francisco Bay Area, 1990-2000. Urban Studies, 44(9), 1759-
1780.
Kwan, M.-P., Murray, A. T., O'Kelly, M. E., & Tiefelsdorf, M. (2003). Recent advances
in accessibility research: Representation, methodology and applications. Journal
of Geographical Systems, 5(1), 129-138.
Kwan, M. P. (1999). Gender and individual access to urban opportunities: a study using
space–time measures. The Professional Geographer, 51(2), 210-227.
Page 52
43
Langford, M., Fry, R., & Higgs, G. (2012). Measuring transit system accessibility using a
modified two-step floating catchment technique. International Journal of
Geographical Information Science, 26(2), 193-214.
doi:10.1080/13658816.2011.574140
Larsen, K., & Gilliland, J. (2008). Mapping the evolution of'food deserts' in a Canadian
city: Supermarket accessibility in London, Ontario, 1961–2005. International
Journal of Health Geographics, 7(1), 1.
Lei, T., Chen, Y., & Goulias, K. (2012). Opportunity-Based Dynamic Transit
Accessibility in Southern California. Transportation Research Record: Journal of
the Transportation Research Board, 2276, 26-37. doi:10.3141/2276-04
Lei, T. L., & Church, R. L. (2010). Mapping transit‐based access: integrating GIS,
routes and schedules. International Journal of Geographical Information Science,
24(2), 283-304. doi:10.1080/13658810902835404
Litman, T. (2003). Integrating public health objectives in transportation decision-making.
American Journal of Health Promotion, 18(1), 103-108.
Liu, S., & Zhu, X. (2004). Accessibility Analyst: an integrated GIS tool for accessibility
analysis in urban transportation planning. Environment and Planning B: Planning
and Design, 31(1), 105-124. doi:10.1068/b305
Lovett, A., Haynes, R., Sünnenberg, G., & Gale, S. (2002). Car travel time and
accessibility by bus to general practitioner services: a study using patient registers
and GIS. Social science & medicine, 55(1), 97-111.
Page 53
44
Mavoa, S., Witten, K., McCreanor, T., & O’Sullivan, D. (2012). GIS based destination
accessibility via public transit and walking in Auckland, New Zealand. Journal of
Transport Geography, 20(1), 15-22. doi:10.1016/j.jtrangeo.2011.10.001
Miller, H. J. (1991). Modelling accessibility using space-time prism concepts within
geographical information systems. International Journal of Geographical
Information System, 5(3), 287-301.
Minocha, I., Sriraj, P., Metaxatos, P., & Thakuriah, P. (2008). Analysis of transit quality
of service and employment accessibility for the greater Chicago, Illinois, Region.
Transportation Research Record: Journal of the Transportation Research
Board(2042), 20-29.
Murtagh, N., Gatersleben, B., & Uzzell, D. (2012). Multiple identities and travel mode
choice for regular journeys. Transportation Research Part F: Traffic Psychology
and Behaviour, 15(5), 514-524. doi:10.1016/j.trf.2012.05.002
Niedzielski, M. A., & Eric Boschmann, E. (2014). Travel Time and Distance as Relative
Accessibility in the Journey to Work. Annals of the Association of American
Geographers, 104(6), 1156-1182. doi:10.1080/00045608.2014.958398
O'Sullivan, D., Morrison, A., & Shearer, J. (2000). Using desktop GIS for the
investigation of accessibility by public transport: an isochrone approach.
International Journal of Geographical Information Science, 14(1), 85-104.
doi:10.1080/136588100240976
Page 54
45
Paez, A., Gertes Mercado, R., Farber, S., Morency, C., & Roorda, M. (2010). Relative
Accessibility Deprivation Indicators for Urban Settings: Definitions and
Application to Food Deserts in Montreal. Urban Studies, 47(7), 1415-1438.
doi:10.1177/0042098009353626
Páez, A., Scott, D. M., & Morency, C. (2012). Measuring accessibility: positive and
normative implementations of various accessibility indicators. Journal of
Transport Geography, 25, 141-153. doi:10.1016/j.jtrangeo.2012.03.016
Pasch, K. E., Hearst, M. O., Nelson, M. C., Forsyth, A., & Lytle, L. A. (2009). Alcohol
outlets and youth alcohol use: Exposure in suburban areas. Health & place, 15(2),
642-646.
Peng, C., Jin, X., Wong, K.-C., Shi, M., & Liò, P. (2012). Collective human mobility
pattern from taxi trips in urban area. PloS one, 7(4), e34487.
Polzin, S., Pendyala, R., & Navari, S. (2002). Development of time-of-day-based transit
accessibility analysis tool. Transportation Research Record: Journal of the
Transportation Research Board, 1799, 7.
Sallis, J. F., Frank, L. D., Saelens, B. E., & Kraft, M. K. (2004). Active transportation and
physical activity: opportunities for collaboration on transportation and public
health research. Transportation Research Part A: Policy and Practice, 38(4), 249-
268.
Salon, D. (2009). Neighborhoods, cars, and commuting in New York City: A discrete
choice approach. Transportation Research Part A: Policy and Practice, 43(2),
180-196. doi:10.1016/j.tra.2008.10.002
Page 55
46
Salonen, M., & Toivonen, T. (2013). Modelling travel time in urban networks:
comparable measures for private car and public transport. Journal of Transport
Geography, 31, 143-153. doi:10.1016/j.jtrangeo.2013.06.011
Scott, D., & Horner, M. (2008). Examining the role of urban form in shaping people’s
accessibility to opportunities: an exploratory spatial data analysis. Journal of
Transport and Land Use, 1(2).
Shen, Q. (2001). A spatial analysis of job openings and access in a US metropolitan area.
Journal of the American Planning Association, 67(1), 53-68.
Tribby, C. P., & Zandbergen, P. A. (2012). High-resolution spatio-temporal modeling of
public transit accessibility. Applied Geography, 34, 345-355.
doi:10.1016/j.apgeog.2011.12.008
Veloso, M., Phithakkitnukoon, S., Bento, C., Fonseca, N., & Olivier, P. (2011).
Exploratory study of urban flow using taxi traces. Paper presented at the First
Workshop on Pervasive Urban Applications (PURBA) in conjunction with
Pervasive Computing, San Francisco, California, USA.
Wachs, M., & Kumagai, T. G. (1973). Physical accessibility as a social indicator. Socio-
Economic Planning Sciences, 7(5), 437-456.
Walton, D., & Sunseri, S. (2010). Factors Influencing the Decision to Drive or Walk
Short Distances to Public Transport Facilities. International Journal of
Sustainable Transportation, 4(4), 212-226. doi:10.1080/15568310902927040
Zheng, F., & Van Zuylen, H. (2013). Urban link travel time estimation based on sparse
probe vehicle data. Transportation Research Part C: Emerging Technologies, 31,
145-157. doi:10.1016/j.trc.2012.04.007