Genevieve Rose H. Lorenzo Manila Observatory Ateneo de Manila University Quezon City, Philippines http://www.observatory.ph/ Urban Air Quality Monitoring Activities in Metro Manila 12 September 2007
Transcript
Genevieve Rose H. Lorenzo Manila Observatory Ateneo de Manila University Quezon City, Philippines
http://www.observatory.ph/
Urban Air Quality Monitoring Activities in Metro Manila
12 September 2007
• Overview of Metro Manila
• Particulate Matter (PM) Monitoring Activities by the Manila Observatory
• PM Monitoring Activities by Other Institutions
• Other Related Activities
• Summary
Outline
Overview of Metro Manila
Municipal Boundary
Major Slum Areas
Other Slum Areas
Major Roads
Low Residential
Medium Residential
High Residential
No data
Fishpond
Reservoir
Agricultural
Military
Water
Vacant
Utilities
Recreational
Parks
Industrial
Institutional
Commercial
LEGEND
Land Use
SCALE
PROJECTION
Universal Transverse MercatorZone 51 Luzon Datum
Sources:
SPOT XS of Metro Manila, 1997Image courtesy of Foundation or the Philippine Environment (FPE), National Mapping andResource Information Authority (NAMRIA) and United States Agency for InternationalDevelopment (USAID)
Land use maps photointerpretedbut verified from the PlanningOffice of Quezon City, Marikina,San Juan, Pasig, Mandaluyong,Pateros, Taguig, Makati, Navotas,Las Piñas, Valenzuela, Muntinlupa, Caloocan and Parañaque
1:100,000
2 0 2 4 6 Km.
N
EW
S
275000
275000
280000
280000
285000
285000
290000
290000
295000
295000
300000
300000
159
0000
1590
000
1595
000
1595
000
1600
000
1600
000
1605
000
1605
000
1610
000
1610
000
1615
000
1615
000
162
0000
1620
000
1625
000
1625
000
1630
000
1630
000
1635
000
1635
000
Metro Manila Land Use (1997)Hierarchy of Urban Centers (2000)
• Metro Manila has a total land area 636 sq. kms, 0.2% of the Philippines total land area.
• It has a population of 9,932,560 (2000 Census), 12,98% of the Philippine population; and its population density is 15,617 persons/sq. kms. http://www.census.gov.ph/data/pressrelease/2002/pr02178tx.html
Overview of Metro Manila
• The Metro Manila Airshed was defined based on the Philippine Clean Air Act. Seven provinces share the Metro Manila Airshed.
Metro Manila Airshed
http://www.emb.gov.ph/mmairshed/
National Capital Region (NCR)
1
23
45
67
Overview of Metro Manila
Makati, Metro Manila
• The view of Makati (a major business center In Metro Manila) is oftentimes obscured by pollutants.
• Particulate Matter (PM) samples are collected on Filter Membranes using Air Samplers.
• Samples are weighed on a Microbalance.
• Samples are analyzed for Ionic and Elemental Content.
PM Monitoring Activities
Monitoring by the Manila Observatory
Manila Observatory, QC (Mixed Site)
PM2.5 Concentrations
0
50
100
150
200
250
300
350
2000 2001 2002 2003 2004 2005 2006
Year
Co
ncen
trati
on
((( ((
g/m
3)
65
15
USEPA Daily Standard
USEPA Annual Standard
• Average measured PM2.5 values at the Manila Observatory were greatest in 2000 and decreased thereafter. The USEPA Annual Standard was exceeded in all years.
PM Monitoring Activities
Results
Manila Observatory, QC (Mixed Site)
PM2.5 Monthly Boxplots (2000-2006)
0
50
100
150
Jan
Fe
b
Ma
r
Ap
r
Ma
y
Ju
n
Ju
l
Aug
Se
p
Oct
Nov
Dec
Month
Co
nce
ntr
ati
on
(
g/m
3)
• Measured PM2.5 values were more widely distributed during the dry season. Average PM2.5 values were least during the wet season.
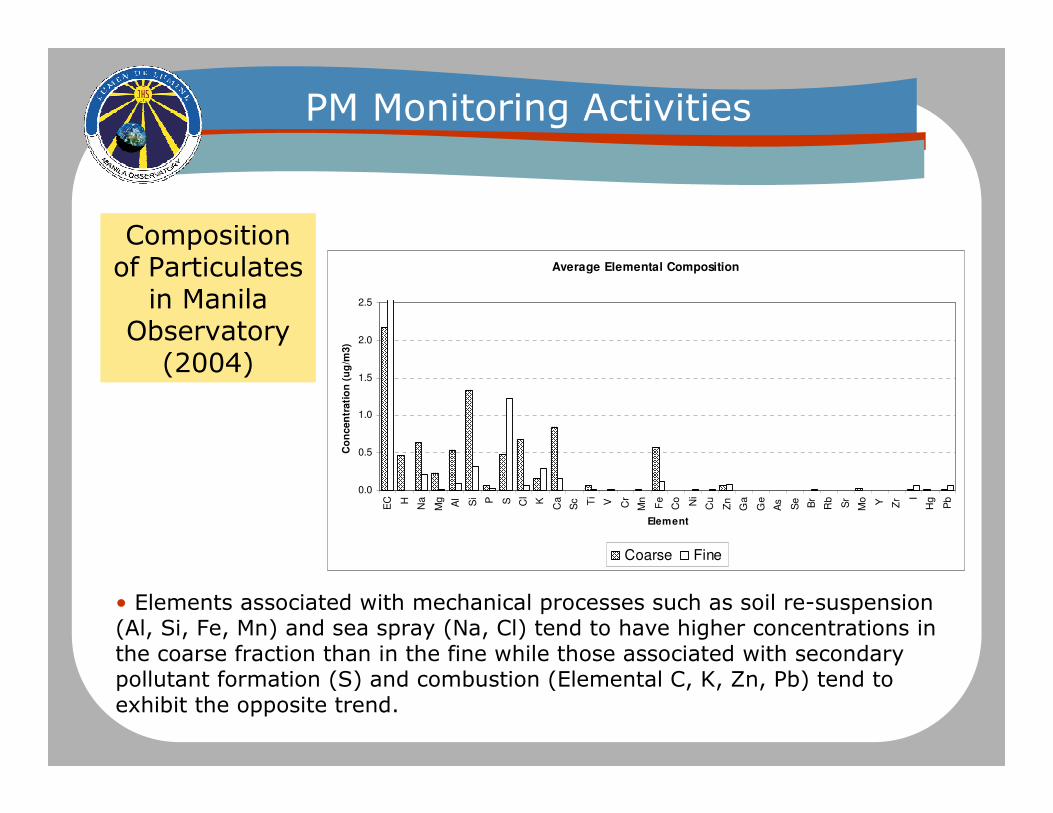
• Elements associated with mechanical processes such as soil re-suspension (Al, Si, Fe, Mn) and sea spray (Na, Cl) tend to have higher concentrations in the coarse fraction than in the fine while those associated with secondary pollutant formation (S) and combustion (Elemental C, K, Zn, Pb) tend to exhibit the opposite trend.
Average Elemental Composition
0.0
0.5
1.0
1.5
2.0
2.5
EC H
Na
Mg Al
Si P S Cl
K
Ca
Sc Ti
V Cr
Mn
Fe
Co Ni
Cu
Zn
Ga
Ge
As
Se Br
Rb
Sr
Mo Y Zr I
Hg
Pb
Element
Co
ncen
trati
on
(u
g/m
3)
Coarse Fine
Composition of Particulates
in Manila Observatory
(2004)
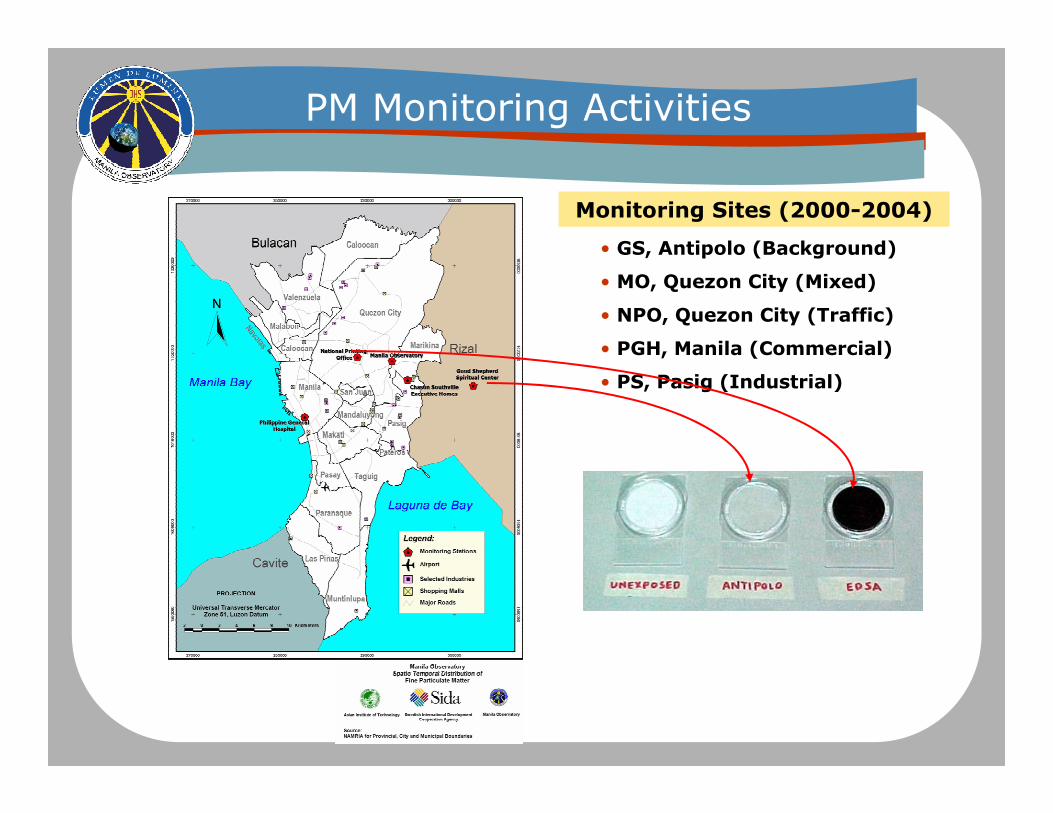
• GS, Antipolo (Background)
• MO, Quezon City (Mixed)
• NPO, Quezon City (Traffic)
• PGH, Manila (Commercial)
• PS, Pasig (Industrial)
PM Monitoring Activities
Monitoring Sites (2000-2004)
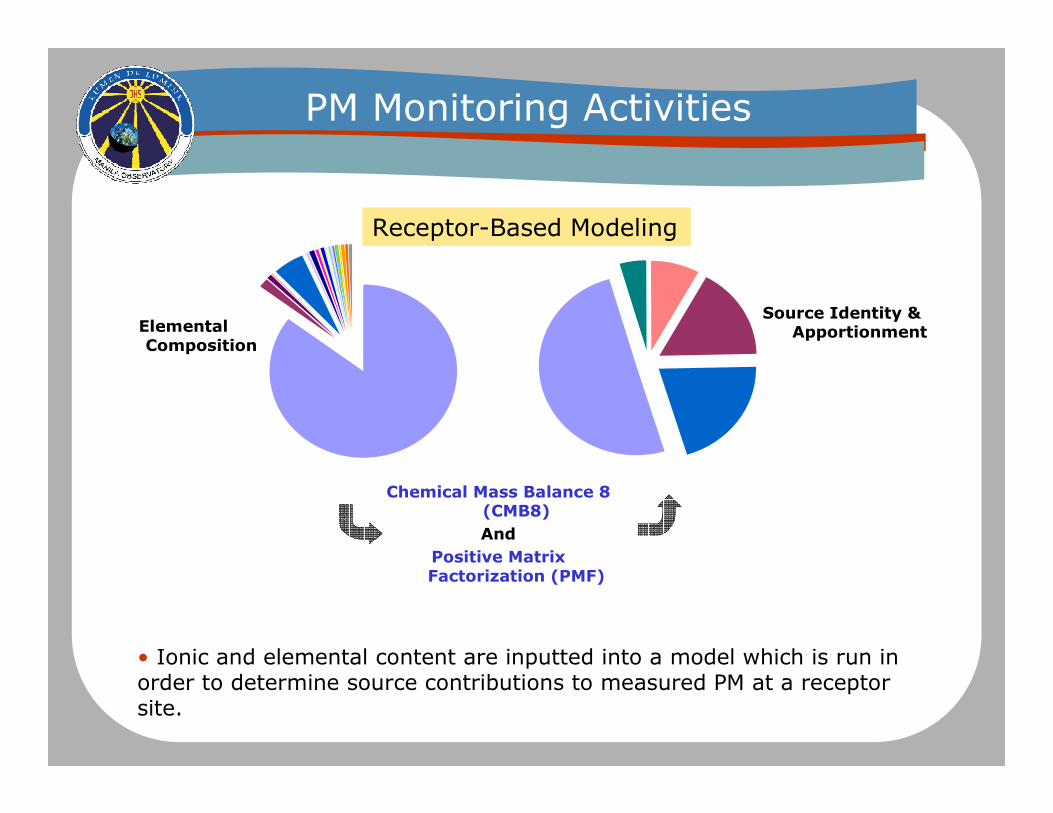
Chemical Mass Balance 8 (CMB8)
And
Positive Matrix Factorization (PMF)
Receptor-Based Modeling
• Ionic and elemental content are inputted into a model which is run in order to determine source contributions to measured PM at a receptor site.
Elemental Composition
Source Identity & Apportionment
PM Monitoring Activities
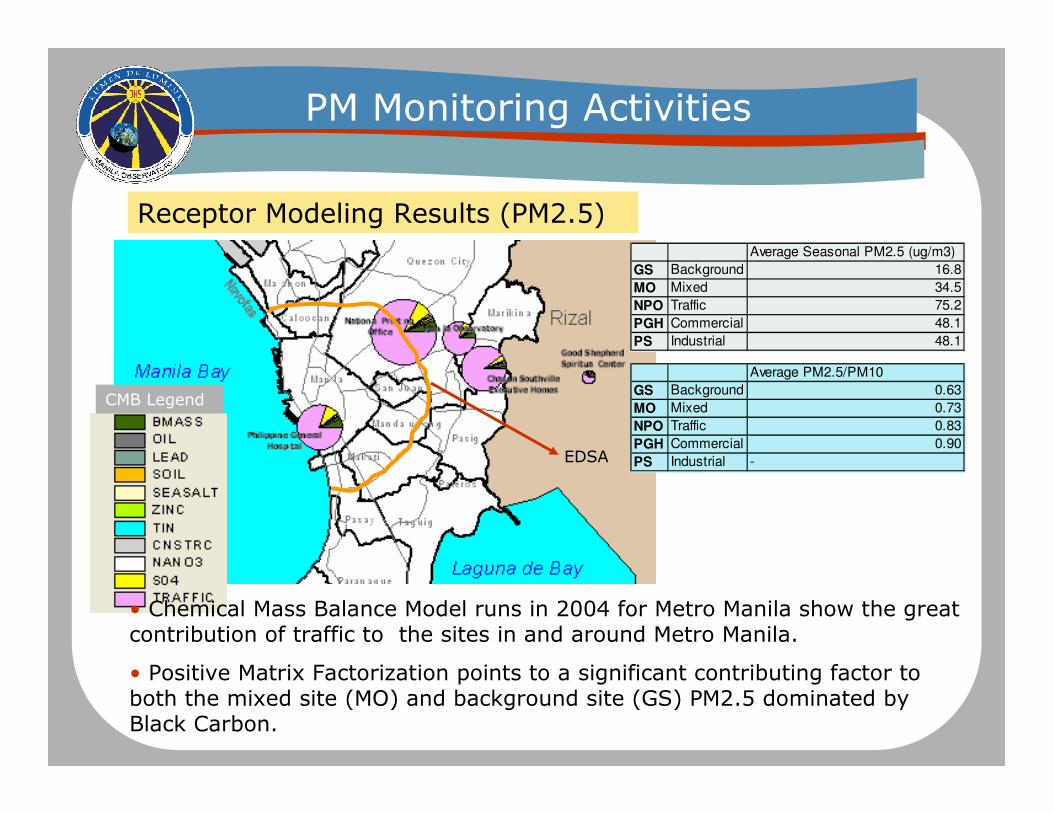
Receptor Modeling Results (PM2.5)
• Chemical Mass Balance Model runs in 2004 for Metro Manila show the great contribution of traffic to the sites in and around Metro Manila.
• Positive Matrix Factorization points to a significant contributing factor to both the mixed site (MO) and background site (GS) PM2.5 dominated by Black Carbon.
Average Seasonal PM2.5 (ug/m3)
GS Background 16.8
MO Mixed 34.5
NPO Traffic 75.2
PGH Commercial 48.1
PS Industrial 48.1
Average PM2.5/PM10
GS Background 0.63
MO Mixed 0.73
NPO Traffic 0.83
PGH Commercial 0.90
PS Industrial -
PM Monitoring Activities
CMB Legend
EDSA
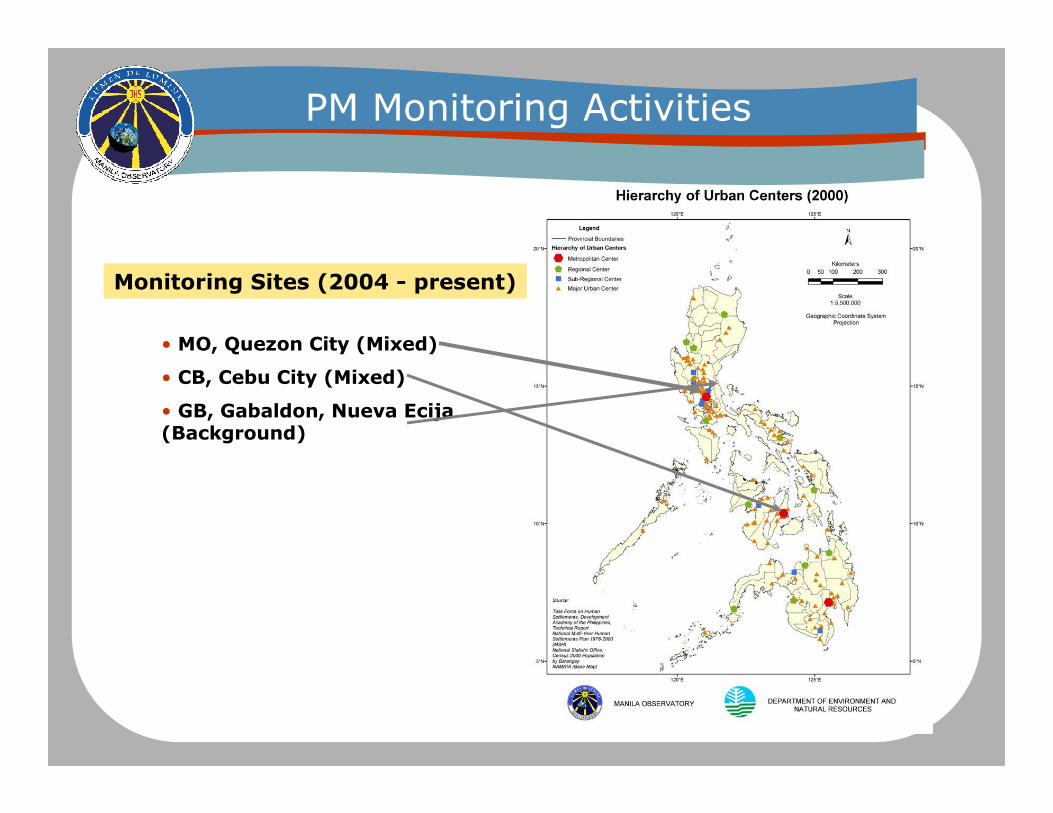
• MO, Quezon City (Mixed)
• CB, Cebu City (Mixed)
• GB, Gabaldon, Nueva Ecija(Background)
PM Monitoring Activities
Monitoring Sites (2004 - present)
Reconstructed Mass of Dry Season PM2.5
Reconstructed Mass of PM2.5
soot, 42%
crustal, 4%smoke, 1%
unaccounted,
30%
seasalt, 3%
sulfate, 8%
trace metals,
7%
ammonium, 4%
nitrate, 1%
soot, 2%
crustal, 3%smoke, 0.9%
unaccounted,
44%
seasalt, 6%
sulfate, 17%
trace metals,
16%
ammonium,
7%
nitrate, 2%
• Contribution to PM2.5 in MO is mostly from combustion; source contributions remain fairly constant across seasons.
• Sulfate and trace metals are the major contributors to PM in Gabaldon.
crustal
2%
NO3-
1%
SO42-
6%
trace
metals
8%
unaccount
ed
59%
smoke
1% soot
16%
seasalt
4%
NH4+
3%
Reconstructed Mass of PM2.5
PM Monitoring Activities
MO (Mixed Site) GB (Background Site) CB (Mixed Site)
DENR - EMB
Monthly averaged PM10 Concentrations in the Metro Manila Airshed Air Quality Monitoring Stations, June –December 2004.
Annual Geometric Mean of Roadside TSPLevels in Metro Manila, 2003 - 2004 (mg/Nm3)
• PM10 levels in 2004 in the designated Metro Manila Air Shed sites increased in December.
• Monitoring by the DENR-EMB(NCR) along roadsides in Metro Manila reveal highest roadside TSP levels along major intersections.
National Air Quality Status Report (2003-2004)
PM Monitoring Activities by Other Institutions
PNRI
• Measured PM10 levels and averages in sites monitored by the PNRI were less than the guideline values set in the Clean Air Act. Fine particulate averages exceeded the USEPA Annual Guideline Values in the same sites.
• Source apportionment using 2002 elemental data for PM2.2 conducted by PNRI showed that the primary source of PM2.2 (about 75%) was fuel combustion.
PM10 Levels in Metro Manila,2004
Fine Particulate Levelsin Metro Manila, 2004
Pollutant Sources for PM10
National Air Quality Status Report (2003-2004)
PM Monitoring Activities by Other Institutions
• Average ozone decreased in 2003.
• Most of the daily 8-hr maximum values of ozone were above the National Ambient Air Quality Guideline Value (NAAQGV). Not as much of the 1-hr maximum values were above the NAAQGV, though enough to exceed the limit set by the CAA.
Receiver (top and right) and Analyzer
0
0.03
0.06
0.09
0.12
8-Hour Daily Max
0
0.035
0.07
0.105
0.14
1-Hour Daily Max
0.07
(1-hr)
0.03
(8-hr)
2003 1-Hr Max
and 8-Hr Max
Other Related Activities
DOAS Manila Observatory, QC (Mixed Site)
Daily Averaged O3 Concentrations
0
0.01
0.02
0.03
0.04
0.05
0.06
0.07
0.08
0.09
2001 2002 2003 2004
Year
Co
ncen
trati
on
(µµ µµ
g/m
3)
0.03 (8-hr)
0.07 (1-hr)
(pp
m)
Manila Observatory, QC (Mixed Site)
Daily Averaged SO2 Concentrations
0
0.01
0.02
0.03
0.04
0.05
0.06
0.07
0.08
0.09
2001 2002 2003 2004
Year
Co
ncen
trati
on
(µµ µµ
g/m
3)
0.03
0.07
Manila Observatory, QC (Mixed Site)
Daily Averaged NO2 Concentrations
0
0.01
0.02
0.03
0.04
0.05
0.06
0.07
0.08
0.09
2001 2002 2003 2004
Year
Co
ncen
trati
on
(µµ µµ
g/m
3)
0.053
0.08
(pp
m)
(pp
m)
• Daily NO2 and SO2 averages were below the 24-hr NAAQGV from 2001 to 2004. Annual averages were also below the guideline values.
• The greatest changes in concentrations happened in 2002, when NO2
concentrations decreased by 27% and SO2 by 19%.
Other Related Activities
• The data shows heavy aerosol loading near the ground. The red color shows high backscattered signals from particulates. The boundary layer height, which is the border between the yellow and the blue signals, is around 1.75km.