Urban Form: How sustainable can it be? Urban Form: How sustainable can it be? OISD Conference 15 January 2008 Prof. Mike Jenks Dr. Nicola Dempsey EPSRC GRANT No:GR/S20529/01 OISD Oxford Brookes University, Heriot Watt University, IESD De Montfort University, Sheffield University, Strathclyde University, Politecnico di Milano
Transcript
Urban Form: How sustainable can it be?
Urban Form:How sustainable can it be?
OISD Conference15 January 2008
Prof. Mike JenksDr. Nicola Dempsey
EPSRC GRANT No:GR/S20529/01OISD Oxford Brookes University, Heriot Watt University, IESD De Montfort University,
Sheffield University, Strathclyde University, Politecnico di Milano
Urban Form: How sustainable can it be?
Background
Urban Form: How sustainable can it be?
Unsustainable cities
• Problems recognised– Loss of agricultural land– Urban sprawl– Long journeys to work– Congestion and carbon
emissions– Environmental
degradation– Health concerns– Social exclusion, etc.
Urban Form: How sustainable can it be?
Sustainable urban form?
• Search for solutions to unsustainable cities• One ‘solution’ might be the compact city…
– … it appears to many to be a ‘ready-made solution’, and one for which a lot is claimed
• These are well known (but untested) urban forms– High density built form– Mixture of uses– The city is ‘contained’– Diverse, in terms of social and economic
activities
Urban Form: How sustainable can it be?
Aims & Scope
Urban Form: How sustainable can it be?
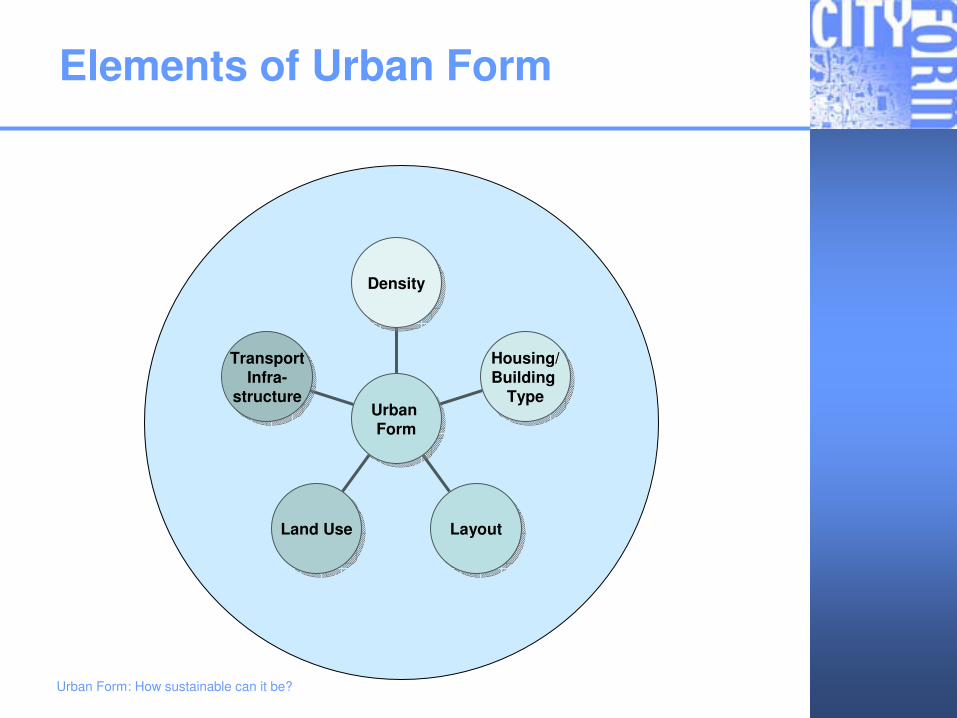
Urban form and sustainability
• To what extent and in what ways does urban form contribute to sustainability?– spatial sustainability– environmental sustainability– transport efficiency– social benefits– economic viability
G L_E_P_SA7 G L_E_P_SA6 G L_E_P_SA2 G L_E_P_SA8 O X_E_P_SA6 O X_E_P_SA4 O X_E_P_SA5 SH_E_P_SA5 ED_M _P_SA4 LS_E_P_SA2 SH_M _P_SA5 SH_M _P_SA7 O X_E_P_SA3 LS_E_P_SA3 O X_C_P_SA4 ED_M _P_SA2 LS_M _P_SA3 O X_M _P_SA4 LS_E_P_SA4 O X_E_P_SA1 SH_C_P_SA4 O X_M _P_SA1 O X_E_P_SA2 LS_E_P_SA6 O X_M _P_SA2 ED_E_P_SA3 SH_E_P_SA4 LS_C_P_SA7 ED_C_P_SA5 SH_E_P_SA2 LS_C_P_SA6 LS_C_P_SA5 SH_E_P_SA3 SH_M _P_SA2 SH_M _P_SA3 LS_C_P_SA4 ED_M _P_SA6 ED_C_P_SA4 O X_C_P_SA3 O X_M _P_SA5 G L_E_P_SA3 SH_E_P_SA1 ED_C_P_SA2 SH_E_P_SA7 SH_M _P_SA6 G L_E_P_SA1 G L_C_P_SA2 ED_M _P_SA1 G L_M _P_SA2 LS_C_P_SA3 O X_M _P_SA3 G L_M _P_SA1 O X_M _P_SA6 LS_E_P_SA7 O X_C_P_SA7 G L_M _P_SA3 O X_C_P_SA2 ED_M _P_SA5 G L_C_P_SA1 LS_E_P_SA5 O X_C_P_SA5 ED_M _P_SA3 ED_E_P_SA5 ED_E_P_SA2 ED_C_P_SA6 SH_C_P_SA3 LS_C_P_SA2 SH_M _P_SA1 ED_E_P_SA4 G L_M _P_SA4 LS_M _P_SA7 SH_C_P_SA5 O X_C_P_SA6 ED_E_P_SA6 G L_C_P_SA6 G L_C_P_SA5 G L_C_P_SA3 LS_M _P_SA6 LS_M _P_SA4 LS_E_P_SA1 G L_E_P_SA5 SH_M _P_SA4 SH_E_P_SA6 LS_M _P_SA2 O X_C_P_SA1 SH_C_P_SA6 G L_C_P_SA4 SH_C_P_SA1 SH_C_P_SA2 SH_C_P_SA7 G L_E_P_SA4 LS_C_P_SA1 LS_M _P_SA1 ED_E_P_SA1 LS_M _P_SA5 ED_C_P_SA3 ED_C_P_SA1
Emst
/Ene
t
(Source: Sergio Porta and Emanuele Strano, Politecnico di Milano)
Urban Form: How sustainable can it be?
Urban form
Urban Form: How sustainable can it be?
Core – Social sustainability
Urban Form: How sustainable can it be?
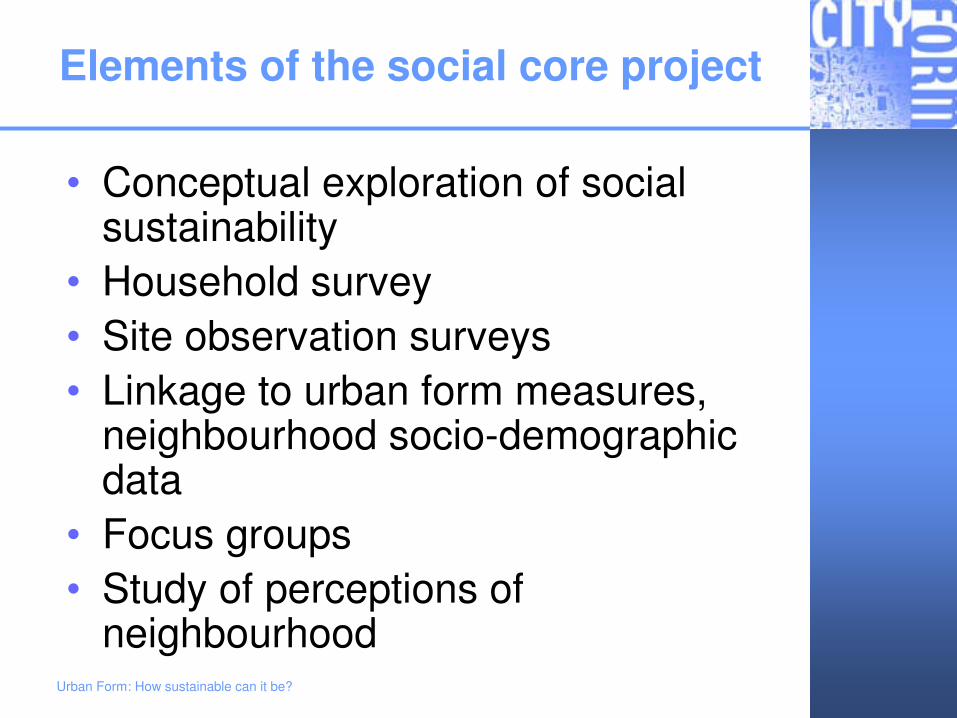
Elements of the social core project
• Conceptual exploration of social sustainability
• Household survey • Site observation surveys• Linkage to urban form measures,
neighbourhood socio-demographic data
• Focus groups • Study of perceptions of
neighbourhood
Urban Form: How sustainable can it be?
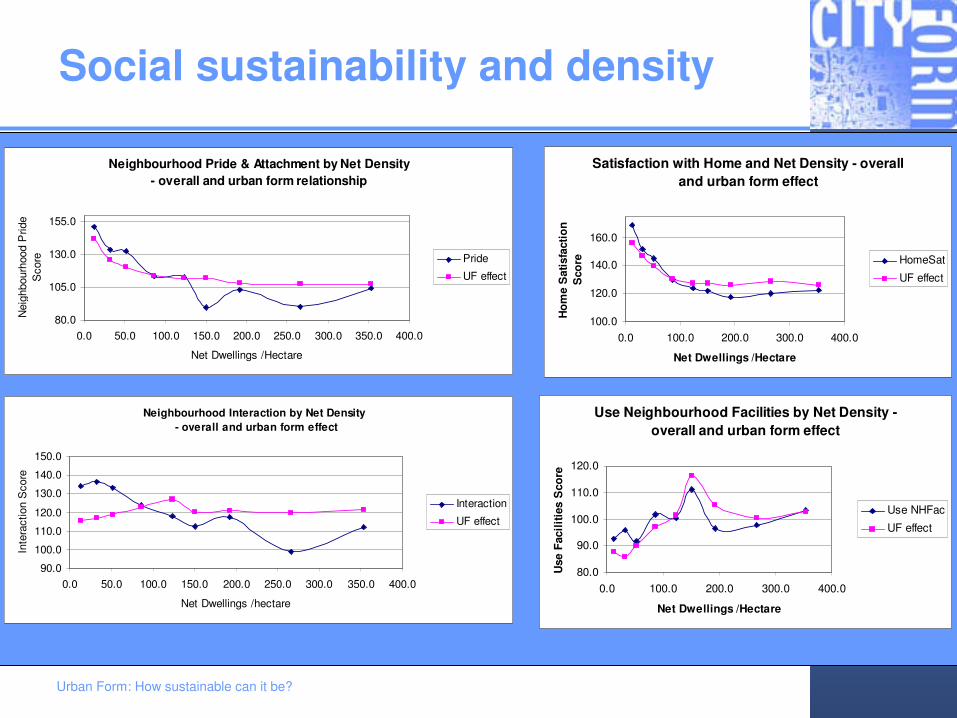
Social sustainability and density
Neighbourhood Pride & Attachment by Net Density - overall and urban form relationship
Satisfaction with Home and Net Density - overall and urban form effect
100.0
120.0
140.0
160.0
0.0 100.0 200.0 300.0 400.0
Net Dwellings /Hectare
Hom
e S
atis
fact
ion
Sco
re HomeSat
UF effect
Use Neighbourhood Facilities by Net Density - overall and urban form effect
80.0
90.0
100.0
110.0
120.0
0.0 100.0 200.0 300.0 400.0
Net Dwellings /Hectare
Use
Fac
ilitie
s S
core
Use NHFac
UF effect
Urban Form: How sustainable can it be?
Core – Economic Sustainability
Urban Form: How sustainable can it be?
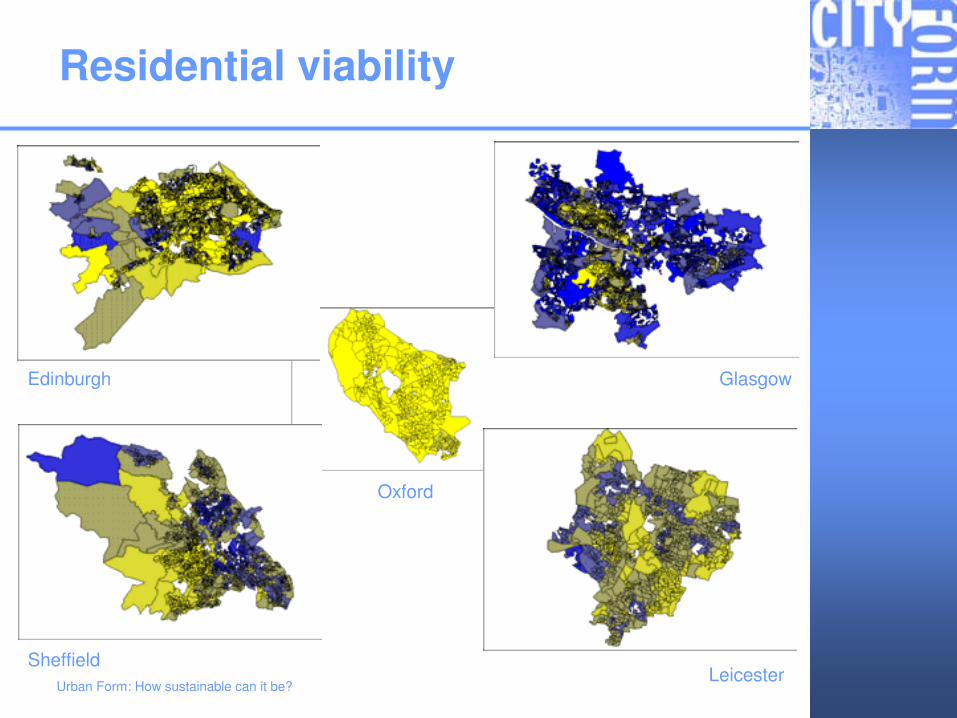
Residential viability
Edinburgh Glasgow
SheffieldLeicester
Oxford
Urban Form: How sustainable can it be?
Viability & urban form
• Offices– Viability dependent on agglomeration
economies traditionally focused on CBD– Rateable values show variations of viability
outside CBD – e.g. Oxford & Sheffield• Retail
– Density impact on trip flows - 10% increase in population = 11.6% increase in trip flows
• Infrastructure– Physical infrastructure costs increase by a
higher than proportional rate with falling density
Urban Form: How sustainable can it be?
Core – Environmental SustainabilityBiodiversity
Urban Form: How sustainable can it be?
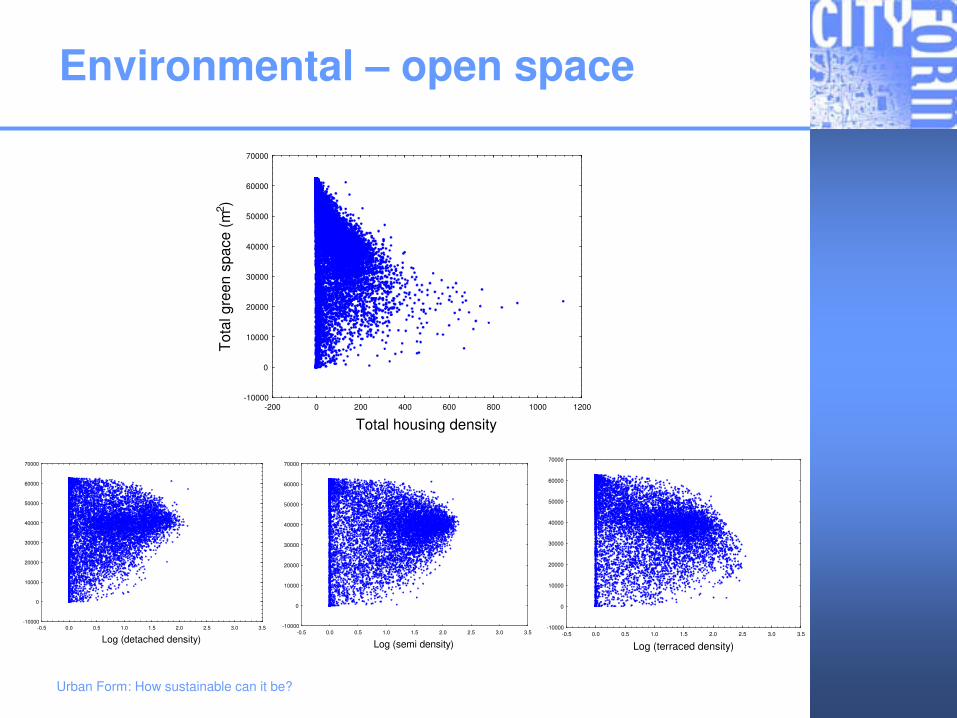
Environmental – open space
-200 0 200 400 600 800 1000 1200
Total housing density
-10000
0
10000
20000
30000
40000
50000
60000
70000
Tota
l gre
en s
pace
(m2 )
-0.5 0.0 0.5 1.0 1.5 2.0 2.5 3.0 3.5
Log (detached density)
-10000
0
10000
20000
30000
40000
50000
60000
70000
-0.5 0.0 0.5 1.0 1.5 2.0 2.5 3.0 3.5
Log (semi density)
-10000
0
10000
20000
30000
40000
50000
60000
70000
-0.5 0.0 0.5 1.0 1.5 2.0 2.5 3.0 3.5
Log (terraced density)
-10000
0
10000
20000
30000
40000
50000
60000
70000
Urban Form: How sustainable can it be?
Environmental – open space
Green space extent
Tree-cover Productivity
High
Low
Urban Form: How sustainable can it be?
Environmental – open space
0
200
400
600
800
1000
1200
1400
0 -
1.5
1.6
- 5.
3
5.4
- 14
.8
14.9
- 3
8.6
38.7
- 9
8.5
98.6
- 2
46
247
- 61
9
620
- 15
55
1556
- 3
021
3022
- 9
799
Housing density
Num
ber
of in
divi
dual
s
0
5
10
15
20
25
0 -
1.5
1.6
- 5.
3
5.4
- 14
.8
14.9
- 3
8.6
38.7
- 9
8.5
98.6
- 2
46
247
- 61
9
620
- 15
55
1556
- 3
021
3022
- 9
799
Housing densityN
umbe
r of
spe
cies
House sparrow
0
50
100
150
200
250
300
350
0 -
1.5
1.6
- 5.
3
5.4
- 14
.8
14.9
- 3
8.6
38.7
- 9
8.5
98.6
- 2
46
247
- 61
9
620
- 15
55
1556
- 3
021
3022
- 9
799
Robin
0
10
20
30
40
50
60
0 -
1.5
1.6
- 5.
3
5.4
- 14
.8
14.9
- 3
8.6
38.7
- 9
8.5
98.6
- 2
46
247
- 61
9
620
- 15
55
1556
- 3
021
3022
- 9
799
Magpie
0
5
10
15
20
25
30
35
0 -
1.5
1.6
- 5.
3
5.4
- 14
.8
14.9
- 3
8.6
38.7
- 9
8.5
98.6
- 2
46
247
- 61
9
620
- 15
55
1556
- 3
021
3022
- 9
799
Chaffinch
0
10
20
30
40
50
60
70
80
0 -
1.5
1.6
- 5.
3
5.4
- 14
.8
14.9
- 3
8.6
38.7
- 9
8.5
98.6
- 2
46
247
- 61
9
620
- 15
55
1556
- 3
021
3022
- 9
799
Urban Form: How sustainable can it be?
Core – Environmental SustainabilityEnergy
Urban Form: How sustainable can it be?
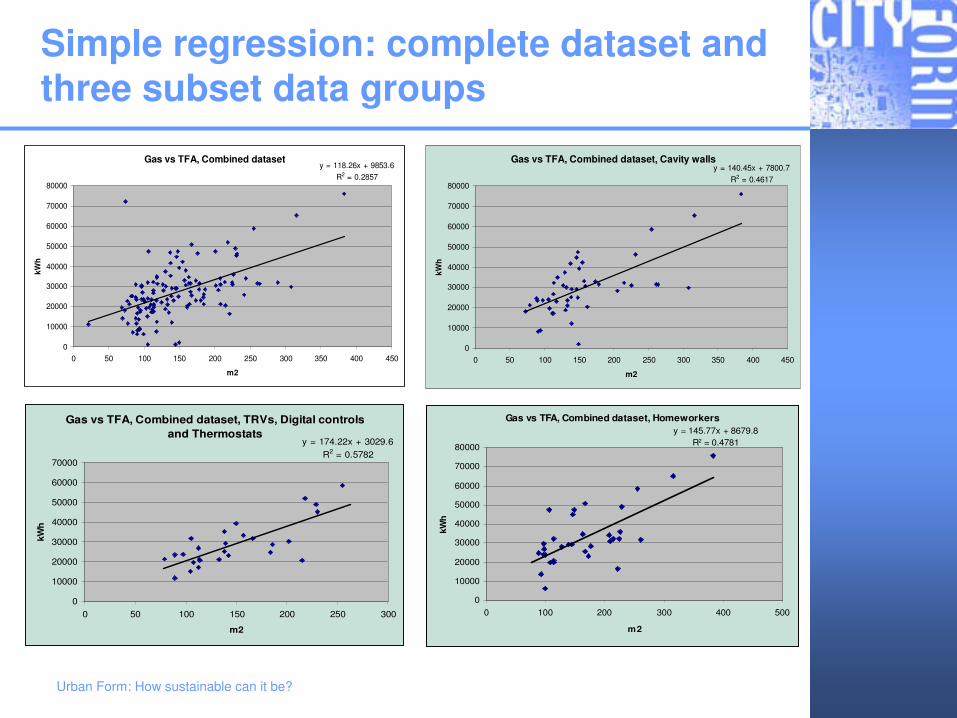
Results
• Simple linear regression: relationships– Significant - total floor area (TFA) and gas consumption – Strong - gas consumption for groups with some fabric types
(cavity filled walls)– Strong - gas consumption against TFA for households with the
highest level of heating system control– Strong - group reporting home-working
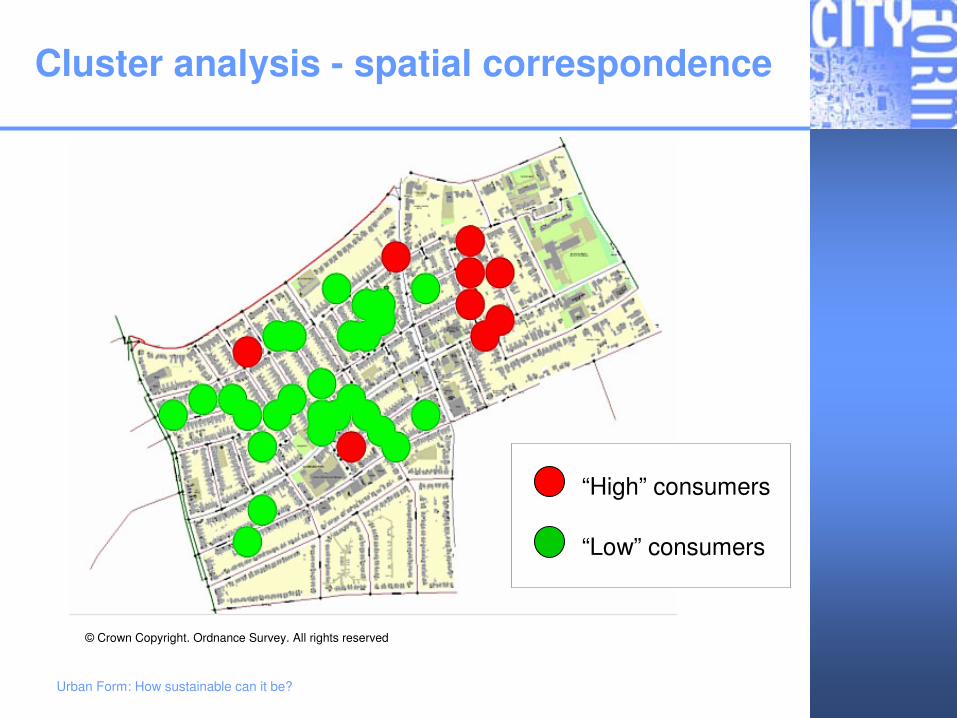
• Cluster analysis– No clusters associated with built form types– Two distinct groups of energy consumers strongly associated
with number of bedrooms • Multiple regression: best models
– Electricity - explained nearly 40% of consumption (TFA, occupancy, home-working, building age, no. of portable heaters, no. of TVs in use, washing machine use)
– Gas - explained nearly 47% of consumption (TFA, occupancy, no. of rooms, no. of bedrooms, home-working, thermostats and heating system controls, wall insulation, boiler type)
Urban Form: How sustainable can it be?
Simple regression: complete dataset and three subset data groups
Gas vs TFA, Combined datasety = 118.26x + 9853.6
R2 = 0.2857
0
10000
20000
30000
40000
50000
60000
70000
80000
0 50 100 150 200 250 300 350 400 450
m2
kWh
Gas vs TFA, Combined dataset, Cavity wallsy = 140.45x + 7800.7
R2 = 0.4617
0
10000
20000
30000
40000
50000
60000
70000
80000
0 50 100 150 200 250 300 350 400 450
m2
kWh
Gas vs TFA, Combined dataset, Homeworkersy = 145.77x + 8679.8
R2 = 0.4781
0
10000
20000
30000
40000
50000
60000
70000
80000
0 100 200 300 400 500
m2
kWh
Gas vs TFA, Combined dataset, TRVs, Digital controls and Thermostats
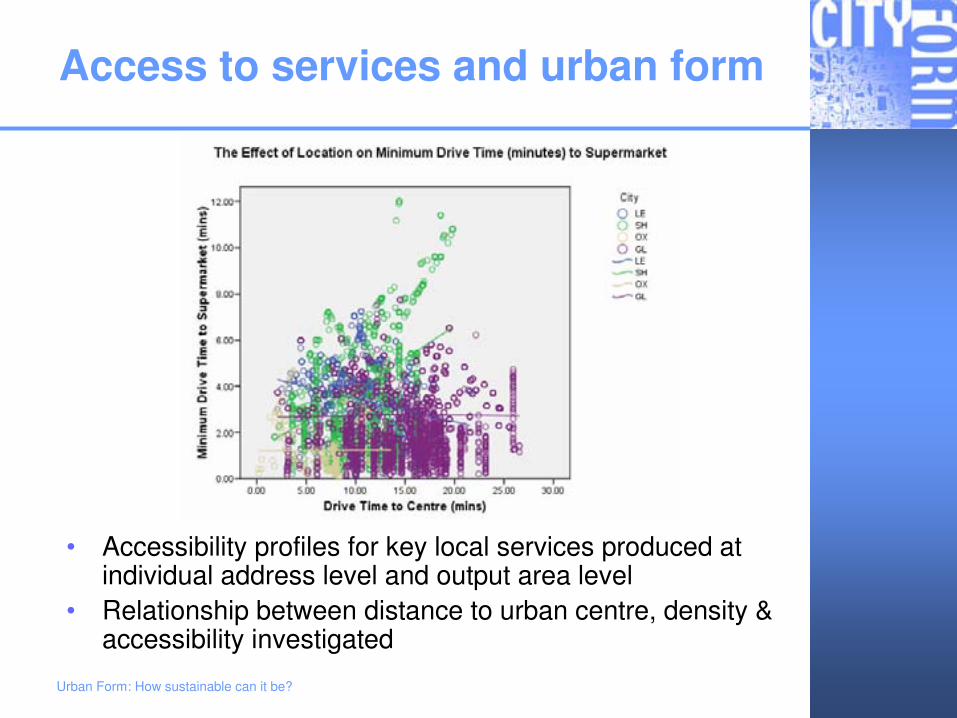
• Accessibility profiles for key local services produced at individual address level and output area level
• Relationship between distance to urban centre, density & accessibility investigated
Urban Form: How sustainable can it be?
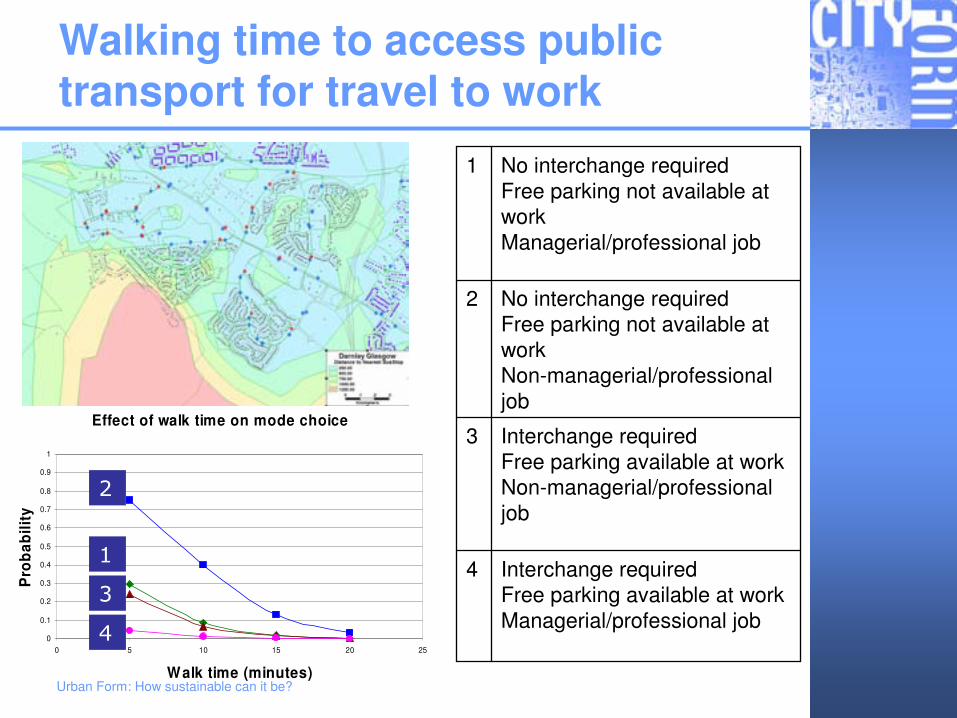
Walking time to access public transport for travel to work
Effect of walk time on mode choice
0
0.1
0.2
0.3
0.4
0.5
0.6
0.7
0.8
0.9
1
0 5 10 15 20 25
Walk time (minutes)
Pro
babi
lity
�
�
�
�
Interchange requiredFree parking available at workManagerial/professional job
4
Interchange requiredFree parking available at workNon-managerial/professional job
3
No interchange requiredFree parking not available at workNon-managerial/professional job
2
No interchange requiredFree parking not available at workManagerial/professional job
1
Urban Form: How sustainable can it be?
Plus projects
Urban Form: How sustainable can it be?
Plus ProjectSustainable Lifestyles
Urban Form: How sustainable can it be?
More later!
• Dr Carol Dair will speak next about this project aiming to establish whether ‘sustainable’development schemes actually lead to sustainable behaviour and lifestyles
Urban Form: How sustainable can it be?
Plus ProjectValuing Open Space
Urban Form: How sustainable can it be?
Valuing open space
3
3.5
4
4.5
1.8 2 2.2 2.4 2.6 2.8 3
log10 Plant species richness
Ref
lect
ion
2.5
3
3.5
4
4.5
1.8 2 2.2 2.4 2.6 2.8 3
log10 Plant species richness
Dis
tinc
t Ide
ntit
y
Urban Form: How sustainable can it be?
0
2
4
6
8
10
12
14
�� �� �� �� ��� �� � � �� ��
Valuing open space
Breeding birds
Native plants
Num
ber o
f spe
cies
Socio-economic MOSAIC group
0
1
2
3
4
5
6
7
8
9
�� ��� � � �� �� �� �� ��
Urban Form: How sustainable can it be?
Plus ProjectUrbanising Suburbia
Urban Form: How sustainable can it be?
Proposals
Urban Form: How sustainable can it be?
Proposals
Urban Form: How sustainable can it be?
Proposals
Urban Form: How sustainable can it be?
Proposals
Urban Form: How sustainable can it be?
Proposals
Urban Form: How sustainable can it be?
Towards integration
Urban Form: How sustainable can it be?
Towards integration
• How far has CityForm answered its original question?
• How do the results integrate?
• Huge number of extensive data sets
• No ‘simple’ story emerges
• More analysis possible– e.g. density
Valuing Open Space
Urbanising Suburbia
CoreSustainable Urban Form
Urban Form
TransportEnvironmental
EconomicSocial
Sustainable Urban
Behaviour & Lifestyles
Urban Form: How sustainable can it be?
Common knowledge?
• Theory, guidance, policy, practice– High density built form– Mixture of uses– Urban form is ‘contained’– Diverse, in terms of social and economic
activities
• So, how far is density a key to achieving sustainable urban form?
Urban Form: How sustainable can it be?
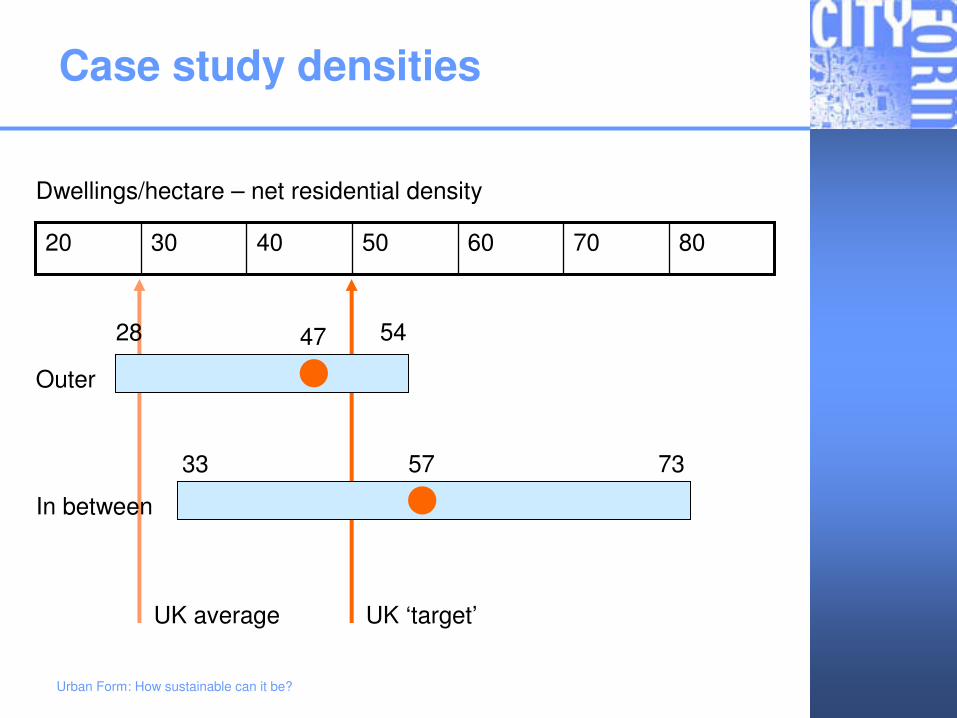
Case study densities
80706050403020
Dwellings/hectare – net residential density
28 47 54
33 57 73
Outer
In between
UK average UK ‘target’
Urban Form: How sustainable can it be?
Density (– illustrative examples)
Low High
Environmental – e.g. wildlife number of species
Low High
Low High
Low High
Social – e.g. satisfaction with home; social interaction
Economic – e.g. increase in population density; increase in retail trips
Transport – e.g. distance travelled increases
Urban Form: How sustainable can it be?
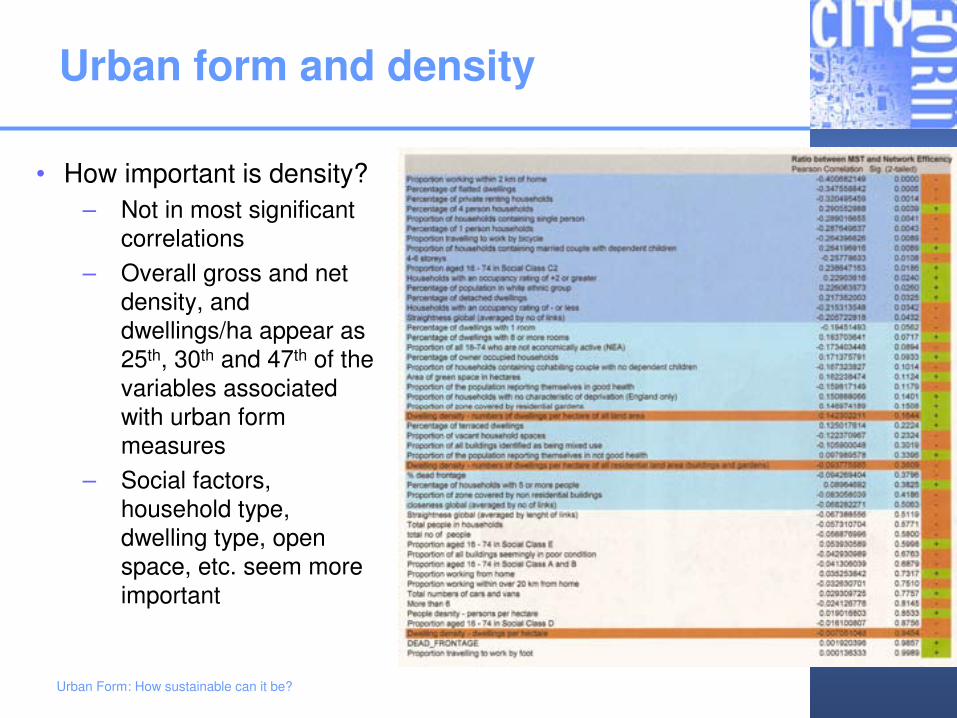
Urban form and density
• How important is density?– Not in most significant
correlations– Overall gross and net
density, and dwellings/ha appear as 25th, 30th and 47th of the variables associated with urban form measures
– Social factors, household type, dwelling type, open space, etc. seem more important
Urban Form: How sustainable can it be?
Sustainable urban form
• “For every problem there is a solution that is simple, neat …. and wrong” (H L Mencken)
• Sustainable urban form is complex, and ‘solutions’ are equally complex
• CityForm measured many of these tricky sustainability factors and thus has a greater understanding of the relationships between them
• Such an understanding enables more rational trade-offs to be made
• It does not permit easy assumptions about urban sustainability, or the propagation of simple ‘rules’ or myths
Urban Form: How sustainable can it be?
Outputs
• Integrated analysis of relationships to urban form– Book ‘Dimensions of the Sustainable City’
(due spring 2008)
– Journal articles (many already, and many in press, or to come)
– Conference papers and presentations internationally (key conferences in UK, USA, Netherlands, Finland, India, Thailand, Malaysia, Japan, UAE, New Zealand, etc.)
– Website (www.city-form.org ongoing)
Urban Form: How sustainable can it be?
CityForm - the future?
• Important data sets, and potential a great deal of further analysis
• Providing evidence-based knowledge of what sustainable urban form reallymeans
• Understanding and research needed at different scales – regional, and neighbourhood