HAL Id: hal-01666512 https://hal.archives-ouvertes.fr/hal-01666512 Submitted on 18 Dec 2017 HAL is a multi-disciplinary open access archive for the deposit and dissemination of sci- entific research documents, whether they are pub- lished or not. The documents may come from teaching and research institutions in France or abroad, or from public or private research centers. L’archive ouverte pluridisciplinaire HAL, est destinée au dépôt et à la diffusion de documents scientifiques de niveau recherche, publiés ou non, émanant des établissements d’enseignement et de recherche français ou étrangers, des laboratoires publics ou privés. URBAN FORM, MOBILITY BEHAVIOR AND DYSFUNCTION OF TRANSPORT SUPPLY: THE CASE OF YAOUNDÉ Jean Patrick Mfoulou Olugu To cite this version: Jean Patrick Mfoulou Olugu. URBAN FORM, MOBILITY BEHAVIOR AND DYSFUNCTION OF TRANSPORT SUPPLY: THE CASE OF YAOUNDÉ . Isabelle Piot-Lepetit. Cameroon in the 21st Century: Challenges and Prospects, 2, Nova Science Publishers, 2017, Environment and People, 978- 1-53612-164-3. hal-01666512
Transcript
HAL Id: hal-01666512https://hal.archives-ouvertes.fr/hal-01666512
Submitted on 18 Dec 2017
HAL is a multi-disciplinary open accessarchive for the deposit and dissemination of sci-entific research documents, whether they are pub-lished or not. The documents may come fromteaching and research institutions in France orabroad, or from public or private research centers.
L’archive ouverte pluridisciplinaire HAL, estdestinée au dépôt et à la diffusion de documentsscientifiques de niveau recherche, publiés ou non,émanant des établissements d’enseignement et derecherche français ou étrangers, des laboratoirespublics ou privés.
URBAN FORM, MOBILITY BEHAVIOR ANDDYSFUNCTION OF TRANSPORT SUPPLY: THE
CASE OF YAOUNDÉJean Patrick Mfoulou Olugu
To cite this version:Jean Patrick Mfoulou Olugu. URBAN FORM, MOBILITY BEHAVIOR AND DYSFUNCTION OFTRANSPORT SUPPLY: THE CASE OF YAOUNDÉ . Isabelle Piot-Lepetit. Cameroon in the 21stCentury: Challenges and Prospects, 2, Nova Science Publishers, 2017, Environment and People, 978-1-53612-164-3. �hal-01666512�
In Cameroon in the 21st Century. Volume 2 ISBN : 978-1-53612-164-3 Editor : Isabelle Piot-Lepetit 2017 Nova Science Publishers, Ins
Chapter 3
URBAN FORM , MOBILITY BEHAVIOR AND DYSFUNCTION OF TRANSPORT SUPPLY:
THE CASE OF YAOUNDÉ*
Jean Patrick Mfoulou Olugu† Centre REMA, FSEG, University of Yaoundé-II, Cameroon
ABSTRACT
The objective of this chapter is to assess the relationship between urban form, mobility behavior, and dysfunction of transport supply in a large African city with high urban growth like Yaoundé in Cameroon. Specifically, the chapter aims at assessing the influence of urban, mobility, and socio-economic characteristics of an origin area on the mobility choice of individuals. Using field data collected by the urban community of Yaoundé in 2010 and statistical tools such as multinomial logits, results show that urban form characteristics, such as human and establishment densities, accessibility, and origin-destination distances influence the choices of individual mobility. The urban form of major cities in Africa, due to a very high urban growth uncontrolled by the local authorities, plays a negative role on the operations of urban transport service in Africa because it promotes an artisanal supply characterized by a low capacity and reduces the efficiency and competitiveness of mass public transportation, which is cheaper. Based on results of this study, recommendations are: controlling urban sprawl, easing of accessibility to public transport, and developing an efficient and competitive mass transportation.
Keywords: urban form, urban mobility, transport supply, agglomeration in Africa, Yaoundé
* This work was funded by the Africa Economic Research Consortium (AERC) to whom I offer my heartfelt thanks. Results and recommendations are those of the author and do not necessarily reflect the opinion of the consortium. † Corresponding Author Email: [email protected]; [email protected].
Jean Patrick Mfoulou Olugu 2
INTRODUCTION Urban mobility is currently becoming an important concern of developing countries with
the principal challenge being the reduction of artisanal supply characterized by a low capacity and the increase of efficiency and competitiveness of mass public transportation. In Africa where the households’ motorization rate is still weak, the main issue appears to be adequate public transportation. The authorities have neglected urban growth and management as a potential means to solve mobility problems. The topic is that current and urban growth affects all sphere of the economy (agriculture, welfare, health, pollution, among others). According to Zhao (2011), urban transport and ways of reducing travel needs in cities must contribute towards achieving carbon reduction targets. The role of developing countries, where urban transport is still done as business as usual, is crucial in achieving this target.
In October 2015, The Africa Sustainable Transport Forum (ASTF) implemented with the support of UNEP1, the World Bank, the SSATP2 program and UN-Habitat3, outlined a harmonized roadmap for achieving sustainable transport in Africa where mass transit system, vehicle emission, and energy efficiency are among some of the priority areas. The ASTF4 agenda focused on challenges in terms of day-to-day realities of sustainable transport in Africa and discussed solutions in the context of green growth and emissions reductions. Prior to the ASTF roadmap, matters of urban mobility were not given full consideration by the authorities adopting the “business as usual” approach (small cars, normal vehicles, traffic jam, high cost, and high number of road fatalities in town) to resolve negative externalities. The underlining observation that tackling urban sprawl and mobility behaviors appears to be the main goal to achieve sustainable transport systems and is particularly evident in large African cities like the metropolitan city of Yaoundé in Cameroon.
The urban structure of Yaoundé is similar to the structure of large agglomerations in Sub-Saharan Africa. The spatial growth is a result of an uncontrolled expansion by the Government. It is characterized by a horizontal, anarchic, and uncontrolled spread creating a functional differentiation of space and forcing to travel long distances, particularly on commuter routes that have only one limited access way to the center. The urbanized area of Yaoundé organizes around the center that is very sparsely inhabited, mostly reserved to activities, and constituting the oldest nucleus whose first developments date back to the early 60s. This scheme reduces the efficiency and competitiveness of mass transportation, with a very strong complementarity of small carriers to craft practices.
In Yaoundé, mobility problems have worsened since the shutdown of the Public Urban Transport Company (SOTUC) in late 1990s. Despite the entry into operation in 2006 of the “Lebus” public transport company, daily mobility remains mainly by taxis of small capacity (61%). Their operation is characterized by frequent stops and disordered, significant negative externalities, and high costs beared by users (Mfoulou et al. 2013). In order to meet the demand center-periphery, minibuses realize up to 9% of trips to remote areas of the city center. In areas where the road is particularly in bad conditions, motorcycles, of which the
1 UNEP: United Nations Environment Programme. 2 SSATP: Africa Transport Policy Program. 3 UN-Habitat: United Nations Human Settlments Programme. 4 ASTF: Africa Sustainable Transport Forum.
Urban Form, Mobility Behavior and Dysfunction of Transport Supply 3
share is estimated at 3% and the number is rapidly and steadily emerging, are used. Despite these initiatives, the issue of mobility still arises with a great acuity.
Law n°2004/003 of April 21, 2004 governing town planning in Cameroon defines the Urbanism Plan as an urban planning document that sets guidelines for the urban land, general densification of soils, and programming equipment. The Master Urban Plan was developed around four objectives for transforming the city of Yaoundé: (i) a more radiant city; (ii) a more welcoming and pleasant city; (iii) a restructured and rebalanced city; and (iv) a more accessible city. But, despite the existence of urbanization and development schemes to facilitate the management of urban space and mobility of citizens, there is an increasing proliferation of new neighborhoods at the periphery of the city or spontaneous ones that accentuates the dysfunction of the transport offer.
Urban development raises many reflections on its consequences and on actions to be taken. Should we react to urban sprawl? If yes how? Should we let the pretext that these are the preferences of individuals? Challenges of sustainable development have revived these discussions and a planner or a local decision-maker must be brought to the question of the effects of planning choices on mobility behavior? Or specifically, what are the consequences of a poorly planned urbanization development on mobility choices and costs? In the current context of reflection on “the city,” these issues need to be asked. But, there is still a very little literature on this topic in Africa. The little knowledge about this area remains very inadequate to inform effectively decisions on urban planning. The objective of this chapter is to evaluate factors that drive urban economic agents to prefer a mode of mobility capabilities such as a small taxi or a motobike that accentuates the dysfunction of the offer in Yaoundé. Specifically, it assesses the impact of urban factors on the choice and costs of mobility in Yaoundé.
URBAN STRUCTURE AND CHARACTERISTICS OF MOBILITY IN YAOUNDÉ
The urban structure of the city of Yaoundé is characterized by a horizontal expansion and
a functional differentiation in the utilization of the urban space. We also observe low levels of public infrastructural services in peripheries. Likewise, demographic and spatial growth is anarchic and uncontrolled due a lack of accessibility and an inappropriate road network (Mfoulou et al. 2013; Ongolo and Epo 2013). According to the IMF5 (2004) and the Cameroon Poverty Reduction Strategy paper, urban sprawl in Cameroon has accelerated over the past 20 years with an average growth rate between 6 and 7%. More recently, the 2009 Growth and Employment Strategy Document of the Government of Cameroon recognizes that both urban and suburban towns and cities are likely to growth. The document also identifies, among others, the need to rehabilitate urban infrastructure and to manage better urban sprawl. For the city of Yaoundé, the urban surface area quadrupled between 1980 and 2001 from less than 4,000 hectares to 16,000 hectares. In 2010, the surface area of the Yaoundé Urban Council (CUY) was approximately of 30,000 hectares (CUY 2010). The increase in the urban surface area has affected mobility patterns in Yaoundé (Mfoulou et al. 2013; Ongolo and Epo 2015). 5 IMF: International Monetary Fund.
Jean Patrick Mfoulou Olugu 4
Legend: Ministries Embassies and Consulates Delegations and City councils. Source: CUY (2010).
Figure 1. Localization of Ministries, Embassies, Consulates, Delegations, City councils (Top) and Banks (Bottom) in Yaoundé.
Urban Form, Mobility Behavior and Dysfunction of Transport Supply 5
Urbanization in Yaoundé is organized around the center that is very few inhabited, mostly reserved to administrative and commercial activities, and constitutes the oldest nucleus whose first developments date back to the early 1960s. The center contains most of the administrative and commercial structures of the country. As it appears in Figure 1 above, almost all official bodies are contained in the central zone. The center is the main attraction of the city. Although local administrative delegations cover the whole city, they have a smaller workforce than central delegations. The commercial center meanwhile focuses on many services such as banks, insurance, and formal trade. It should be noted that some services are spread throughout the city and especially near housing areas. This is particularly the case of bakeries and gas stations. Industrial activities, although scattered throughout the city, are largely located in the South, stretching along the center and periphery. In the city center, the presence of formal activities generates an informal sector: small sellers, restoration, various repairs, etc., and major markets. Generally, the central administrative fabric is characterized by concentrated constructions, but having a low coefficient of footprint (approximately 30%).
The localization of basic services in the city of Yaoundé is dependent on the level of services provided. Indeed, most public schools, better known for their qualities, are situated in the central area or the inner suburbs of the center, while private schools created more recently are built near popular suburbs. High schools also have a greater tendency to concentrate near the city center, on the contrary primary schools are scattered throughout the city. Likewise, a part from the complex of the General Hospital is located within or close to the city center. The “Lebus” company operates on 6 out of the 13 lines of the network defined by the former SOTUC operator. As illustrated in Figure 2, the whole city traffic converges towards the city center.
Source: CUY (2010).
Figure 2. Lines operated by Lebus.
Jean Patrick Mfoulou Olugu 6
Saturation of the central place then leads migrants still many to turn to the periphery in the search of new constructible land; hence, the city explodes and spreads. Districts created consolidate themselves in an urban disorder. These neighborhoods are characterized by a lack of equipment and accessibility. There are about 60 people per hectare. In 2010, the annual production of informal dwellings in Yaoundé was estimated at about 115,000 units, broken down into 2,500 modern structures and 8,500 informal structures (CUY 2010). The management of roads faces recurring blockages due to the urban configuration of the city. The realization of roads (paved or not) involves more expropriations and maintenance difficulties. Several mobility problems actually appear in Yaoundé: the public road network is not adapted to the high proportion of walking; the railway is not structured to favor urban mobility; over 74% of vehicles registered under small capacity have over 15 years of age; and the supply of “Lebus” transportation is inadequate and ineffective. The Yaoundé’s urban form results, as a consequence, in an increase in distance, travel time and modes of transportation based on small capacity vehicles. The 2010 Urban Displacement Plan estimated that small capacity vehicles with up to five seats perform over 86% of the daily traffic volume of Yaoundé. Only 2% of vehicles are minibuses (9 to 12 seats) and buses with over 30 seats. The report also indicates a high level of congestion during peak hours.
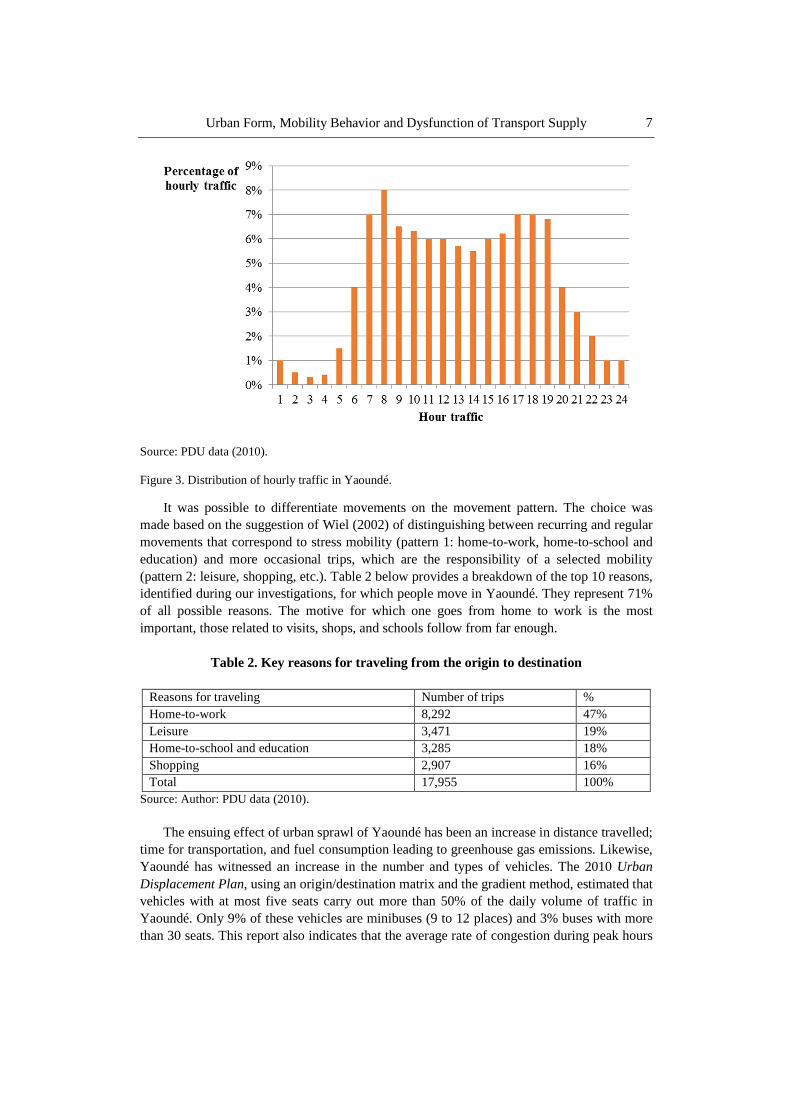
The hourly traffic represents on average 4% of daily traffic. The morning rush hour is between 7 a.m. and 8 a.m. and concentrates transit transport for professional and educational reasons and the evening rush hour is between 5 to 7 p.m. and conrresponds to 7% of the total traffic. The traffic between 10 p.m. and 6 a.m. represents 7.5% of the total (see Figure 3).
Following road network surveys of the city at peak hours, it appears that heavy traffic in Yaoundé reaches a floor of 810 vehicles and a ceiling of 3530 vehicles during a rush hour on relevant roads. This leads to congestion and persistent traffic jams that lengthen travel time, thus promoting increased energy consumption and the emission of exhaust gases. The average travel time recorded in surveys is of 29 minutes. For a round trip, it is about 60 minutes. As against bus users for which the average travel time is of 60 minutes, this timeframe is clearly an obstacle to the use of this type of transportation. However, the congestion of certain channels may increase the travel time from 150 to 200%.
Table 1. Distribution of traffic by type of vehicle in Yaoundé
No Type of vehicle Number of vehicles counted % total Distance in kilometers 1 Motorcycles 133,163 6.10 3,703.43 2 Personal cars 823,540 37.80 49,205.88 3 Taxis 1,065,938 48.80 86,725.17 4 Minibus 41,578 1.90 4,094.06 5 Bus 4,366 0.20 7,188.73 6 Vans 80,771 3.70 4,065.54 7 Trucks 2 Es 13,098 0.60 495.97 8 S + Truck 8,732 0.40 80.56 9 Trailers 7,448 0.30 40.42 10 Others 4,366 0.20 30.25 TOTAL 2,183,000 100% 522269.58
Source: Author: PDU data (2010).
Urban Form, Mobility Behavior and Dysfunction of Transport Supply 7
Source: PDU data (2010).
Figure 3. Distribution of hourly traffic in Yaoundé.
It was possible to differentiate movements on the movement pattern. The choice was made based on the suggestion of Wiel (2002) of distinguishing between recurring and regular movements that correspond to stress mobility (pattern 1: home-to-work, home-to-school and education) and more occasional trips, which are the responsibility of a selected mobility (pattern 2: leisure, shopping, etc.). Table 2 below provides a breakdown of the top 10 reasons, identified during our investigations, for which people move in Yaoundé. They represent 71% of all possible reasons. The motive for which one goes from home to work is the most important, those related to visits, shops, and schools follow from far enough.
Table 2. Key reasons for traveling from the origin to destination
Reasons for traveling Number of trips % Home-to-work 8,292 47% Leisure 3,471 19% Home-to-school and education 3,285 18% Shopping 2,907 16% Total 17,955 100%
Source: Author: PDU data (2010). The ensuing effect of urban sprawl of Yaoundé has been an increase in distance travelled;
time for transportation, and fuel consumption leading to greenhouse gas emissions. Likewise, Yaoundé has witnessed an increase in the number and types of vehicles. The 2010 Urban Displacement Plan, using an origin/destination matrix and the gradient method, estimated that vehicles with at most five seats carry out more than 50% of the daily volume of traffic in Yaoundé. Only 9% of these vehicles are minibuses (9 to 12 places) and 3% buses with more than 30 seats. This report also indicates that the average rate of congestion during peak hours
Jean Patrick Mfoulou Olugu 8
is of 0.3 with about 14 kilometres of saturated roads, that is about 5% of the total distance. The Yaoundé Urban Council has recently indicated that since 2010 these figures have worsened because of the disappearance of the transport supply by buses and urban sprawl. The graphics below simulate car traffic for 2010 and 2030 in the city of Yaoundé using the Unit Passenger Car (UPC).
Source: CUY (2010).
Figure 4. Simulation of car traffic for 2010 and 2030 in the city of Yaoundé using the Unit Passenger Car (UPC).
METHODOLOGY We consider that the location of subsystems (urban form) and social relationships
(socioeconomic characteristics) are inputs in mutual interactions and the choice of the transport system are outputs. It is essential to take into account these interactions to determine what proportion of mobility is explained by characteristics of households and by the urban form. The answer to this question will help us to legitimize or not urban development measures whose the aim is to control the growth of small capacity vehicles (taxis and motorcycle) in Yaoundé. We proceed at the individual level integrating simultaneously explanatory variables in our models relating to characteristics of individuals and the urban form.
Experience shows that individuals with identical characteristics, placed in the same context may not be asked to perform the same choice of mode of transport (Bonne 2004). An individual usually performs the choice that maximizes his utility, but it is imperfectly known (Ben-Akiva and Lerman 1985). Models used in this approach are based on logit formulations. Assuming that an individual i has m comprehensive alternatives to make a choice of transport modes, then the utility from choosing the alternative j (j = 1,…, m) can be represented as follows:
Urban Form, Mobility Behavior and Dysfunction of Transport Supply 9
(1)
where Uij represents the utility derived by a consumer when choosing the mode j, x'ij is the matrix of explanatory variables, εij is unobserved, and β is the vector of model parameters. The utility (Uij) of the consumer i after choosing the mode of transport j is not observed. Only the mode of transport is observed. Thus, the consumer i chooses the mode of transport j if it gives to him a maximum utility or if he acquires from it the maximum satisfaction.
(2) For the choice of transport mode (yi) by the consumer i, it follows that:
(3) With
and P(yi = j ) ≥ 0 (m being the number of transport modes available). This probability depends on the value of the utility of the transport mode with respect to the alternatives. The distribution function of a logistic law can be presented as follows:
(4) To take account of random disturbances, the estimation of model parameters β is made by
using the maximum likelihood.
(5) The interpretation of estimated parameters of a logit model requires caution. Indeed,
estimated parameters only provide information on the positive (β > 0) or negative (β < 0) impact of independent variables. Thus, the quantification of the impact of each variable on the probability P(yi = j) will proceed by calculating of the marginal effects. The marginal effects of a change in an exogenous variable xi
k, ∀k = 1,...,K, (K being individuals’ characteristics) on the probability that the consumer chooses the j th mode, ∀j = 1,...,m, are defined by:
ijijij xU εβ += '
( )imiiij uuuMaxU ,...,, 21=
)';...;';'(
)'(
)),...,,(()(
2211
21
imimiiii
ijij
imiiiji
xxxMax
xP
uuuMaxUPjyP
εβεβεβεβ
+++=
+=
===
∑ ===
m
j i jyP1
1)(
ii
i
xx
x
iiriee
exFyPP
''
'
1
1
1)()1( ββ
ββ −+
=+
====
+===
∑∑ ∑∑∑
≠≠ =
= == =3
1
'
'
1 11 1 1ln)](ln[);(ln
jbase
ij
ij
jbase j
x
xn
i
m
jij
n
i
m
jiij
e
eyjyPyyL
β
β
β
Jean Patrick Mfoulou Olugu 10
(6)
where βjk isthe kth component of βj associated with the explanatory variable xi
k and Pij = P(yi
= j) and δij is the effect of a unit change in an independent variable on the probability that the consumer i uses the alternative j.
Three types of statistical tests are used to validate the quality of the model and often give similar results: the likelihood ratio test (Likelihood ratio), the score test (Score), and the Wald test (Wald). These tests follow the same principle. Generally, they compare the information provided by the reference model, that is to say the one containing the explanatory variables and the information provided by a simplified model. Estimates of the multinomial logit model are generated by:
(7)
where yi represents the mobility choice. A total of five modes are possible: (1) Motorcycle; (2) Personal car; (3) Taxi; (4) Bus and Minibus; and (5) others. CL(VA) is a linear combination of independent variables.
Table 3. Variables and descriptive statistics
Variables Mean Std. Dev. Min Max V1: Type of vehicle 12.82 0.916 1 5 V2: Distance (kilometres from origin to destination) 19.54 22.26 0.5 51.29 V3: Time (time from origin to destination) 0.83 5. 19 0.03 6.60 V4: Speed 26.00 20.78 0.15 120.08 V5: Time of access to public transportation 24.40 21.12 2 70 V6: Distance covered using a taxi in km 4.65 9.14 1 21 V7: Distance covered using a bus in km 12.17 3.61 7 28 V8: Distance covered using a motorcycle in km 2.90 1.15 1 8 V9: Distance covered using a minibus in km) 11.96 3.64 3 59 V10: Distance covered using other types of vehicle in km 29.71 17.53 0 18 V11: Population density (Number of inhabitants per hectare)
26.00 20.78 15 320.08
V12: Density of establishments (Number of establishments per hectare)
14.18 3.00 8 22.25
V13: Distance from the city centre in km 15.66 22.85 0 23.06 V14: Ratio employment to population in % 6.55 14.84 0.13 964.67 V15: Reason of the destination: 1. home-to-work and 0. home-to-school and education
0.52 0.42 0 1
V16: Cost (fuel consumed to cover distance origin to destination)
135.38 36.49 113.67 511.076
V17: Number number of travelers in the vehicle 4.05 77.10 1 80 Source: Author: PDU data (2010).
)(1
kz
K
ziz
kjijk
i
ijij PP
x
Pββδ ∑−=
∂
∂=
=
ii VACL-P
Py ε+=
= )(
(choice)1
choice)(ln
Urban Form, Mobility Behavior and Dysfunction of Transport Supply 11
Data come from surveys conducted by CUY as part of the development of the Urban
Transport Plan (PDU). These surveys focused on the identification of vehicles, the estimation of traffic volumes, and the analysis of the main crossing points, patterns, origins, and destinations of trips. Surveys were designed to measure and define the structure of traffic in Yaoundé and the type of vehicle to obtain information required for the analysis of traffic problems and to provide a better future traffic in the city. Surveys also helped to better understand motives and means used for traveling within the city. The Origin/Destination investigations were performed in same places as traffic counts; 34 points were identified. They were carried out in a continuous manner between 6 a.m. and 10 p.m. Table 3 below shows all variables used to estimate the influence of the urban form on mobility choices. A total of 16,205 to 17,950 individuals were selected to have a consistent sample.
RESULTS The attitude of the consumer in choosing a mode of transport depends on several factors.
The first step to access a transport is to join the road. Accessibility to public transportation seems to be the first significant factor of transport mobility choices. It appears that accessibility to public transit significantly and negatively influences the use of the motorbike and taxi. Contrariwise, this influence is positive on the use of bus. The less the consumer has access to public transportation, the more he uses a motorbike or a taxi. In most cases, the less fortunate urban dwellers use both modes of mobility: first, they use the motorbike to get until the paved road and after they take a taxi. At the opposite, the wealthy city dwellers use their personal car and are generally localized in areas accessible by car.
Table 4. Determinants of mobility choice in Yaoundé
Variables Motocycle Taxis Bus&minibus Others V11: Population density at the origin 0.985*** -0.321*** 0.524*** -0.564*** V5: Time of access to public transportation
-0.290*** -0.058*** 0.096** -0.013
V15: Reason of the destination 0.314* 0.113*** 0.054** 0.065 V17: Number of travelers in the vehicle 0.324*** 0.272*** -0.429*** -0.401*** V2: Distance (kilometres from origin to destination)
0.009*** 0.014*** -0.033** 0.019
V3: Time (time from origin to destination)
0.636*** 0.065*** 0.041*** 0.070
V4: Speed 0.011*** 0.003** 0.001 -0.013 V16: Cost (fuel consumed to cover distance ²origin to destination)
-0.000*** 0.014*** 0.016** 0.010*
Intercept -0.142 0.569** -0.974*** -0.647*** Notes: Number of obs = 16,204; LR chi2 (70) = 5,828.31; Prob > chi2 = 0.0000; LnLikelihood =-14886.867; Pseudo R2 = 0.1637; legend: * p < 0.05; ** p < 0.01; *** p < 0.001. Reference Mode: Personal car. Source: Author: PDU data (2010).
Jean Patrick Mfoulou Olugu 12
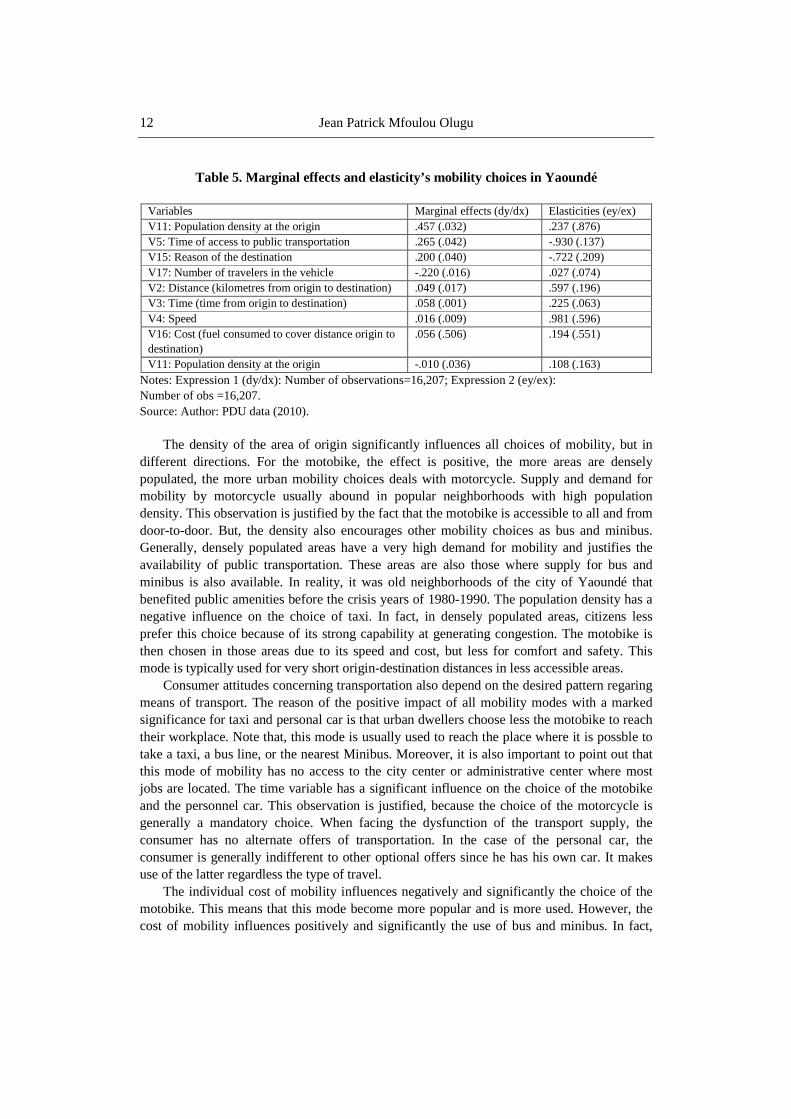
Table 5. Marginal effects and elasticity’s mobility choices in Yaoundé
Variables Marginal effects (dy/dx) Elasticities (ey/ex) V11: Population density at the origin .457 (.032) .237 (.876) V5: Time of access to public transportation .265 (.042) -.930 (.137) V15: Reason of the destination .200 (.040) -.722 (.209) V17: Number of travelers in the vehicle -.220 (.016) .027 (.074) V2: Distance (kilometres from origin to destination) .049 (.017) .597 (.196) V3: Time (time from origin to destination) .058 (.001) .225 (.063) V4: Speed .016 (.009) .981 (.596) V16: Cost (fuel consumed to cover distance origin to destination)
.056 (.506) .194 (.551)
V11: Population density at the origin -.010 (.036) .108 (.163) Notes: Expression 1 (dy/dx): Number of observations=16,207; Expression 2 (ey/ex): Number of obs =16,207. Source: Author: PDU data (2010).
The density of the area of origin significantly influences all choices of mobility, but in
different directions. For the motobike, the effect is positive, the more areas are densely populated, the more urban mobility choices deals with motorcycle. Supply and demand for mobility by motorcycle usually abound in popular neighborhoods with high population density. This observation is justified by the fact that the motobike is accessible to all and from door-to-door. But, the density also encourages other mobility choices as bus and minibus. Generally, densely populated areas have a very high demand for mobility and justifies the availability of public transportation. These areas are also those where supply for bus and minibus is also available. In reality, it was old neighborhoods of the city of Yaoundé that benefited public amenities before the crisis years of 1980-1990. The population density has a negative influence on the choice of taxi. In fact, in densely populated areas, citizens less prefer this choice because of its strong capability at generating congestion. The motobike is then chosen in those areas due to its speed and cost, but less for comfort and safety. This mode is typically used for very short origin-destination distances in less accessible areas.
Consumer attitudes concerning transportation also depend on the desired pattern regaring means of transport. The reason of the positive impact of all mobility modes with a marked significance for taxi and personal car is that urban dwellers choose less the motobike to reach their workplace. Note that, this mode is usually used to reach the place where it is possble to take a taxi, a bus line, or the nearest Minibus. Moreover, it is also important to point out that this mode of mobility has no access to the city center or administrative center where most jobs are located. The time variable has a significant influence on the choice of the motobike and the personnel car. This observation is justified, because the choice of the motorcycle is generally a mandatory choice. When facing the dysfunction of the transport supply, the consumer has no alternate offers of transportation. In the case of the personal car, the consumer is generally indifferent to other optional offers since he has his own car. It makes use of the latter regardless the type of travel.
The individual cost of mobility influences negatively and significantly the choice of the motobike. This means that this mode become more popular and is more used. However, the cost of mobility influences positively and significantly the use of bus and minibus. In fact,
Urban Form, Mobility Behavior and Dysfunction of Transport Supply 13
bus and minibus are not effective and competitive modes. Already, availability is limited to some coverage lines, which do not allow serving the vast majority of the population, usually located on the periphery. The likelihood that an increase in the original density influences the choice of an urban mobility is of 45% (with an elasticity of 1.23), a higher proportion than for all other variables. To influence mobility choices in favor of collective modes, public facilities must move towards urban densification policies. Beyond the urban densification policies, the accessibility to transport infrastructure affects positively mobility choices with a probability of 25%.
The size of the trip also has a high probability (22%) on the choice of a mode of mobility and elasticity of 1.02. An increase in the size of travel affects consumer choices, but that choice is at the detriment of the collective mode because the sign of the effect is negative. This argument militates in favor of a reorganization of collective modes, in particular transportation by bus and minibus. But, with limited park and lines that are tens of kilometers from each other, bus frequencies are very low. Low frequencies are partly due to traffic congestion during peak hours that greatly affects the speed of the bus. According to data from a performance audit report carried out by the Government in 2010, bus traffic decreased from 8.7 million passengers in 2008 to 5,700,000 in 2009; a drop of 35% in a year. In 2010, the bus operator continues to lose traffic. In May 2010, he recorded a total traffic of 379,000 passengers, against about 437,000 for the month of May 2009, a decrease of 13%. The analysis of data of the company on traffic at the beginning of June shows that daily traffic by bus in the city is about 14,000 passengers, i.e., 500 passengers per bus. The huge demand for this mode of mobility let us suggest as a recommendation the reorganization of this service towards greater competitiveness and efficiency; this being only possible through a reorganization of the urban space and the creation of poles of urban concentration where collective modes can grow at the expense of individual modes.
CONCLUSION The main objective of this research was to assess and analyze the impact of the urban
form of mobility in the city of Yaoundé in Cameroon. Specifically, it proved important to assess and analyze the impact of the urban form on consumer choices. The approach has mobilized logit econometric techniques. Data were collected by means of surveys organized by CUY in 2010 as part of the development of the PDU. The following results were obtained: urban density has a significant and very strong influence on the choice of mobility by individuals living in Yaoundé. The high popuation density promotes the use of public transit and therefore reduces the cost of mobility. Beyond the density, availability also plays a decisive role on the choice of the type of mobility. Other variables such as motifs of destinations are equally critical to influence the choices of a type of mobility, but with a very low probability and a lower elasticity. Results also confirm that the population density is inversely correlated with the use of the car and is positively associated with the use of soft modes as motobikes. For a dual effect on the level of congestion and accessibility, options in areas with high population can be shuttles and alternative modes of transport to the car, while it increases the cost of the mobility of transport in low population density areas.
Jean Patrick Mfoulou Olugu 14
REFERENCES
Ben-Akiva, M. & Lerman, S. R. (1985). Discrete Choice Analysis, Theory and Application to Travel Demand. Cambridge: MIT Press, 416p.
Bonnel, P. (2004). Prévoir la demande de transport. Paris: Presses de l'École Nationale des Ponts et Chaussées, 415p.
CUY. (2010). Elaboration du plan de déplacement urbain de la ville de Yaoundé. Rapport Diagnostique. République du Cameroun.
International Monetary Fund (2004) Cameroon: Poverty Reduction Strategy Paper 3rd annual progress report—IMF No. 04/334.
Ongolo, Z. V. & Epo, N. B. (2013). Suburbanization and Inequality in Transport Mobility in Yaoundé (Cameroon): Drawing Public Policy for African Cities. GDN Project on Urbanization and Development – Francophone Africa Project, 30p.
Ongolo Z. V. & Epo B. N. (2015), “Sources of inequality in the cost of transport mobility in the city of Yaoundé, Cameroon.” Development Southern Africa, 32(2), 229-239.
Mfoulou, J. P., Awomo, D. J. C. & Dama, N. M (2013). Structure urbaine et mobilité à Yaoundé. Les cahiers du CEDIMES, 7(2), 9-21.
Zhao, P. (2011). Car use, commuting and urban form in a rapidly growing city: Evidence from Beijing. Transportation Planning and Technology, 34(6), 506-527.
Wiel M. (1999). La transition urbaine ou le passage de la ville pédestre à la ville motorisée. Liège: Editions Mardaga, 225 p.