Urban heat island impacts on building energy consumption: A reviewof approaches and findings
Xiaoma Li a, b, Yuyu Zhou a, *, Sha Yu c, Gensuo Jia d, Huidong Li a, Wenliang Li a, 1
a Department of Geological and Atmospheric Sciences, Iowa State University, Ames, IA, 50014, USAb Horticulture and Landscape College, Hunan Agricultural University, Changsha, 410128, Chinac Joint Global Change Research Institute, Pacific Northwest National Laboratory, College Park, MD, 20740, USAd CAS Key Laboratory of Regional Climate-Environment for Temperate East Asia, Institute of Atmospheric Physics, Chinese Academy of Sciences, Beijing,100029, China
a r t i c l e i n f o
Article history:Received 12 October 2018Received in revised form24 February 2019Accepted 25 February 2019Available online 26 February 2019
Keywords:UrbanizationUrban heat islandBuilding energy consumptionModeling
Urban heat island (UHI) could have significant impacts on building energy consumption by increasingspace cooling demand and decreasing space heating demand. However, the impacts of UHI on buildingenergy consumption were understudied due to challenges associated with quantifying UHI-inducedtemperature change and evaluating building energy consumption. In this study, we reviewed existingliterature for improving the understanding of UHI impacts on building energy consumption. It was foundthat UHI could result in a median increase of 19.0% in cooling energy consumption and a mediandecrease of 18.7% in heating energy consumption. The reported UHI impacts showed strong intercityvariations with an increase of cooling energy consumption from 10% to 120% and a decrease of heatingenergy consumption from 3% to 45%. The UHI impacts also showed clear intra-city variations withstronger impacts in urban center than that in urban periphery. There were significant differences in themethod and the data used to evaluate the UHI impacts in previous studies. Four future research focuseswere recommended to better understand the UHI impacts on building energy consumption.
The building sector is an important component of the energysystem and accounts for approximately 31% (22e57% at theregional level) of global final energy consumption [1]. Globalbuilding energy consumption has been increasing steadily due torapid urbanization, climate change, and other driving factors [2e4].It increased from 1.4 billion tonnes oil equivalent (TOE) in 1970 to3.6 billion TOE in 2010 and was projected to increase to 5.5 billionTOE in 2040 [5]. The large amount of building energy consumptionhas raised great challenges for sustainable development such asinterrupting reliable energy supply, increasing greenhouse gasemissions, and exacerbating air pollution [4,6,7]. It is not surprisingthat a better understanding of building energy consumption,including its spatiotemporal pattern, driving factors, and environ-mental impacts, has become a hot topic attracting attentions ofboth scientific communities and decision makers.
Building energy consumption is influenced by multiple factorssuch as ambient temperature, building characteristics, the perfor-mance and schedule of appliances (e.g., lighting, heating, venti-lating, and air conditioning systems), occupant activities [1,4,8e12],etc. Among them, ambient temperature is one of the most impor-tant factors as it directly drives the operation of cooling/heatingsystem and influences the corresponding building cooling andheating energy consumption, which accounts for about half of thetotal building energy consumption in the United States (U.S.) [2].Ambient temperature is affected by both global and local climatechange. Rising temperature and extreme events caused by climatechange have been identified as one of themost significant drivers ofbuilding energy consumption [13e18]. The review of case studiesshowed that the building peak electricity load would increase up to4.6% for one degree of temperature increase and the correspondingincrease of total electricity consumption was estimated as high as8.5% [19]. Using the long-term modeling results of the integratedGlobal Change Assessment Model (GCAM), Zhou et al. [18] foundthat climate change may decrease the building sector's final energyconsumption by up to 6% in both the U.S. and China by the end ofthis century, but increase cooling energy consumption by 20e35%and 37e41%, respectively in the U.S. and China.
In addition to the warming induced by long-term climatechange, urban areas where more than half of global populationreside also experience local warming with temperature in the ur-ban areas higher than that in the surrounding rural areas, known asurban heat island (UHI) effect. UHI is now a worldwide phenome-non observed in cities regardless of their locations and sizes[20e26]. It is widely acknowledged that the UHI can increasebuilding cooling energy consumption and decrease building heat-ing energy consumption [17,27e30]. Santamouris [31] summarizedthe published case studies and found that the cooling load of typicalbuildings in urban areas is on average 13% higher than that in ruralareas. UHI has small spatial extent as it is usually confined withinurban areas, which only cover 1e3% of global land [32e34]. How-ever the UHI impacts on building energy consumption are non-trivial because a majority of buildings and building energy con-sumption are in urban areas. As urbanization usually increases UHIintensity [24,35], it is projected that cities in future will experienceeven a higher temperature increase compared to the surrounding
rural areas and this would result in a significant change in buildingenergy consumption and total energy demand [36]. Therefore, athorough and quantitative understanding of the UHI impacts onbuilding energy consumption is of great importance for designingsustainable energy infrastructure.
Though it has been widely acknowledged that UHI has signifi-cant impacts on building energy consumption and these impactsshould be explicitly considered in building energy consumptionmodeling, only a limited number of studies quantified this impactsbecause of the challenges in preparing temperature data with andwithout UHI effect and in simulating the corresponding buildingenergy consumption. Currently, our knowledge of the UHI impactson building energy consumption, including their magnitudes,spatiotemporal patterns, driving factors, and ecological and envi-ronmental consequences, are still limited.
In this paper, we performed a comprehensive review of currentcase studies for a better understanding of the UHI impacts onbuilding energy consumption. First, we identified the commonlyused approaches for quantifying the UHI impacts on building en-ergy consumption and their respective advantages and disadvan-tages. Second, we examined the reported quantitative UHI impactsin the literature and their spatial variations within and amongcities. Findings of this review will help better understand differentmodeling approaches and the selection of suitable approaches inpractice. The reviewed quantitative UHI impacts and their spatialvariations within and among cities will help energy infrastructureplanning and investment, especially under the condition of globalclimate change and rapid urbanization. The remainder of this paperwas arranged as follows. Section 2 described the procedure ofliterature search and the extraction of key information. Section 3reviewed current approaches for studying the UHI impacts onbuilding energy consumption and their advantages and limitations.Section 4 summarized previously reported UHI impacts and theirspatial variations within and among cities. Section 5 discussed thechallenges of modeling the UHI impacts on building energy con-sumption and proposed future research focuses. The conclusionswere drawn in Section 6.
2. Status of modeling UHI impacts on building energyconsumption in the literature
The UHI impacts on building energy consumption were usuallymodeled as the difference in the building energy consumptionswith and without UHI effect. It involves three key components. Thefirst is preparing/generating air temperature datasets with andwithout UHI effect, the second is estimating building energy con-sumptions based on these datasets, and the third is comparing theresults of these two estimations. A variety of different approacheshave been used for this purpose in existing studies. These studiesvary in 1) the methods and data for measuring UHI, 2) the modelsand related parameters for estimating building energy consump-tion, and 3) the reported values of the UHI impacts. We reviewedrelevant literature of these different methods and discussed theiradvantages and limitations. We summarized the UHI impacts onbuilding energy consumption at regional and global level bycalculating the median of the UHI impacts (i.e., percent change)reported in the case studies. The spatial variations of the UHI
X. Li et al. / Energy 174 (2019) 407e419 409
impacts within and among cities were also investigated.We searched relevant papers published in peer-reviewed jour-
nals in English from databases of Web of Science, Wiley OnlineLibrary, Scopus, and Google Scholar. We used the search terms of“urban heat island” or “UHI” combined with ‘‘building energy use’’or ‘‘building energy consumption’’ to include relevant articles.During the literature search, we used the “snowballing”method bychecking the bibliographies of relevant articles to ensure acomprehensive review of the literature [37]. We only includedstudies that explicitly reported the quantitative UHI impacts onbuilding energy consumption. Moreover, to have a coherent reviewof the UHI impacts on building energy consumption, we excludedstudies that only reported the UHI impacts on cooling/heating de-gree day, e.g., by Schatz and Kucharik [38] and Vardoulakis et al.[39] and that focused on the role of UHI countermeasures in
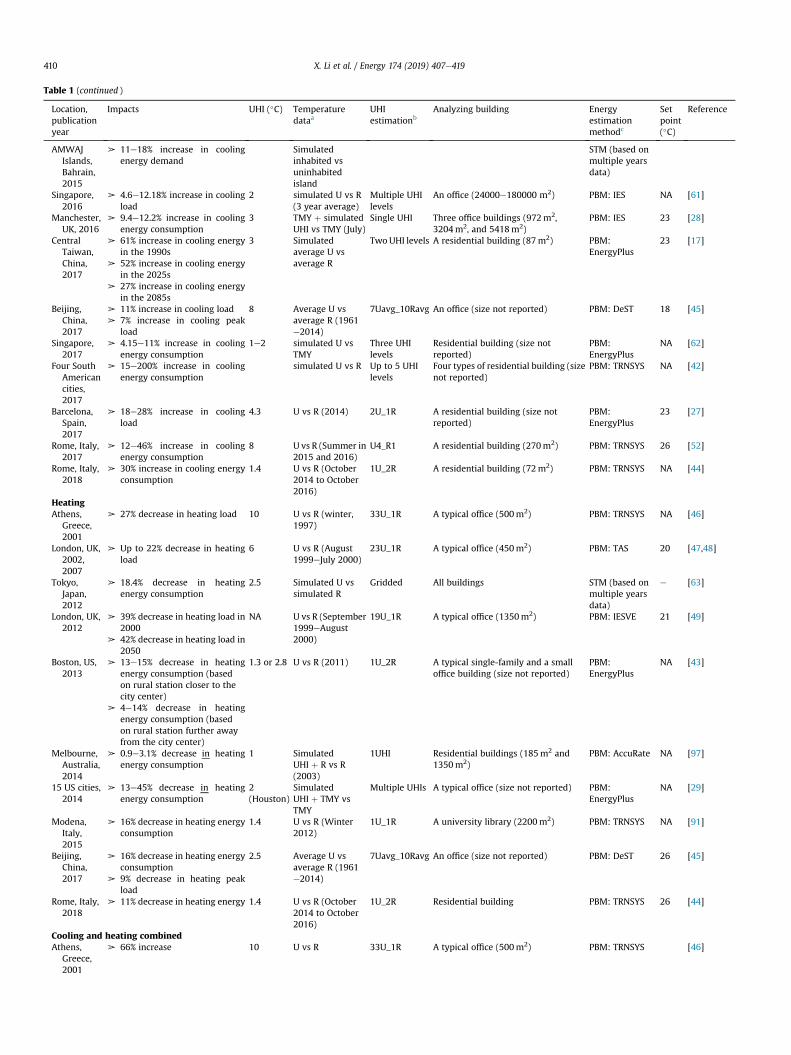
Table 1Summary of UHI impacts on building energy consumption reported in the surveyed 24 p
Location,publicationyear
Impacts UHI (�C) Temperaturedataa
UHIestimat
CoolingWestern
Athens,Greece,2000
➢ 66% (in 1997) and 33% (in 1998,hotter year) increase in coolingenergy
6 U vs R (July in1997 and 1998)
4U_1R
➢ 99% (in 1997) and 30% (in1998) increase in peak coolingpower
Athens,Greece,2001
➢ 120% increase in cooling load 10 U vs R (summer,1997)
33U_1R➢ 100% increase in peak
electricity demandLondon, UK,
2006➢ 19% increase in cooling energy 7 U vs R (one hot
week in 1999 and2000)
1U_1R➢ The impacts are close for a
typical hot week and anextremely hot week
London, UK,2002,2007
➢ Up to 25% increase in coolingload
6 U vs R (August1999eJuly 2000)
23U_1R
Hong Kong,China,2011
➢ 10% increase in air-conditioning demand
1.8 Observed UHI(MayeOctober2010)þTMY vsTMY
4Uavg_
Tokyo,Japan,2012
➢ 27.5% increase in coolingenergy
2.5 Simulated U vssimulated R
Gridded
London, UK,2012
➢33% increase in cooling load in2000
NA U vs R (September1999eAugust2000)
19U_1R
➢ 28% increase in cooling load in2050
Bahrain,2013
➢ Up to 10% increase in coolingelectricity consumption
5 U vs R (2009) 5U_1R
Boston, US,2013
➢ 4e22% or 5e41% increase incooling energy consumptionbased on the selection of ruralstation
1.3 or 2.8 U vs R (2011) 1U_2R
Beijing,China,2014
➢ 11.28% increase for totalcooling electricityconsumption
2.5 U vs R from otherstudy
Single U
➢ 20.4% increase for peak coolingelectricity consumption
Melbourne,Australia,2014
➢ 8.2e11.4% increase in coolingenergy consumption
1 SimulatedUHI þ R vs R(2003)
Single U
15 US cities,2014
➢ 13e35% increase in coolingenergy consumption
2(Houston)
SimulatedUHI þ TMY vsTMY
Multipl
Modena,Italy,2015
➢ 10% increase in cooling energyconsumption
1.4 U vs R (Summer2012)
1U_1R
5 Single U
reducing building cooling energy consumption, e.g., by Santa-mouris et al. [40] and Roman et al. [41]. Finally, 24 peer-reviewedpapers were included for further quantitative analyses as listed inTable 1.
We extracted the following information from the reviewed casestudies: (1) study area (city), (2) UHI impact, specifically the relativechange of building energy consumption by UHI, (3) reportedmaximum UHI intensity, (4) temperature data and method used tocalculate UHI (5) study scale (i.e., the city level), or building typeand size if at the building level, (6) Building energy consumptionmodeling/estimation method, and (7) set-point if using physics-based model. To compare the UHI impacts among cities, wetreated studies of the same city (e.g., London, UK, and Athens,Greece) in different papers and different cities in the same paper(e.g. Refs. [29,42]) as unique samples.
apers.
ionbAnalyzing building Energy
estimationmethodc
Setpoint(�C)
Reference
Simulated for a four-apartmentbuilding (320m2) and upgraded to thecity level residential buildings(177385 dwellings)
PBM: DOE2.1.E 26 [51]
A typical office (500m2) PBM: TRNSYS 26 [46]
A typical office (60m2) PBM: BRE's 3 TC 24 [96]
A typical office (450m2) PBM: TAS 24 [47,48]
1R An office (1296m2) and a residentialflat (95m2)
PBM:EnergyPlus
25.5 [59]
All buildings of nine types at the citylevel
STM (based onmultiple yearsdata)
e [63]
A typical office (1350m2) PBM: IESVE 24 [49]
82 sampled residential house STM (based onmultiple yearsdata)
e [50]
A typical single-family and a smalloffice (size not reported)
PBM:EnergyPlus
NA [43]
HI City level, all buildings STM (based ondata from Mayto September in2005)
e [90]
HI Residential buildings (185m2 and1350m2)
PBM: AccuRate NA [97]
e UHIs A typical office (size not reported) PBM:EnergyPlus
NA [29]
An university library (2200m2) PBM: TRNSYS 17 NA [91]
HI 82 sampled residential house e [89]
(continued on next page)
Table 1 (continued )
Location,publicationyear
Impacts UHI (�C) Temperaturedataa
UHIestimationb
Analyzing building Energyestimationmethodc
Setpoint(�C)
Reference
AMWAJIslands,Bahrain,2015
➢ 11e18% increase in coolingenergy demand
Simulatedinhabited vsuninhabitedisland
STM (based onmultiple yearsdata)
Singapore,2016
➢ 4.6e12.18% increase in coolingload
2 simulated U vs R(3 year average)
Multiple UHIlevels
An office (24000e180000 m2) PBM: IES NA [61]
Manchester,UK, 2016
➢ 9.4e12.2% increase in coolingenergy consumption
3 TMY þ simulatedUHI vs TMY (July)
Single UHI Three office buildings (972m2,3204m2, and 5418m2)
PBM: IES 23 [28]
CentralTaiwan,China,2017
➢ 61% increase in cooling energyin the 1990s
3 Simulatedaverage U vsaverage R
Two UHI levels A residential building (87m2) PBM:EnergyPlus
23 [17]
➢ 52% increase in cooling energyin the 2025s
➢ 27% increase in cooling energyin the 2085s
Beijing,China,2017
➢ 11% increase in cooling load 8 Average U vsaverage R (1961e2014)
7Uavg_10Ravg An office (size not reported) PBM: DeST 18 [45]➢ 7% increase in cooling peak
loadSingapore,
2017➢ 4.15e11% increase in cooling
energy consumption1e2 simulated U vs
TMYThree UHIlevels
Residential building (size notreported)
PBM:EnergyPlus
NA [62]
Four SouthAmericancities,2017
➢ 15e200% increase in coolingenergy consumption
simulated U vs R Up to 5 UHIlevels
Four types of residential building (sizenot reported)
PBM: TRNSYS NA [42]
Barcelona,Spain,2017
➢ 18e28% increase in coolingload
4.3 U vs R (2014) 2U_1R A residential building (size notreported)
PBM:EnergyPlus
23 [27]
Rome, Italy,2017
➢ 12e46% increase in coolingenergy consumption
8 U vs R (Summer in2015 and 2016)
U4_R1 A residential building (270m2) PBM: TRNSYS 26 [52]
Rome, Italy,2018
➢ 30% increase in cooling energyconsumption
1.4 U vs R (October2014 to October2016)
1U_2R A residential building (72m2) PBM: TRNSYS NA [44]
HeatingAthens,
Greece,2001
➢ 27% decrease in heating load 10 U vs R (winter,1997)
33U_1R A typical office (500m2) PBM: TRNSYS NA [46]
London, UK,2002,2007
➢ Up to 22% decrease in heatingload
6 U vs R (August1999eJuly 2000)
23U_1R A typical office (450m2) PBM: TAS 20 [47,48]
Tokyo,Japan,2012
➢ 18.4% decrease in heatingenergy consumption
2.5 Simulated U vssimulated R
Gridded All buildings STM (based onmultiple yearsdata)
e [63]
London, UK,2012
➢ 39% decrease in heating load in2000
NA U vs R (September1999eAugust2000)
19U_1R A typical office (1350m2) PBM: IESVE 21 [49]
➢ 42% decrease in heating load in2050
Boston, US,2013
➢ 13e15% decrease in heatingenergy consumption (basedon rural station closer to thecity center)
1.3 or 2.8 U vs R (2011) 1U_2R A typical single-family and a smalloffice building (size not reported)
PBM:EnergyPlus
NA [43]
➢ 4e14% decrease in heatingenergy consumption (basedon rural station further awayfrom the city center)
Melbourne,Australia,2014
➢ 0.9e3.1% decrease in heatingenergy consumption
1 SimulatedUHI þ R vs R(2003)
1UHI Residential buildings (185m2 and1350m2)
PBM: AccuRate NA [97]
15 US cities,2014
➢ 13e45% decrease in heatingenergy consumption
2(Houston)
SimulatedUHI þ TMY vsTMY
Multiple UHIs A typical office (size not reported) PBM:EnergyPlus
NA [29]
Modena,Italy,2015
➢ 16% decrease in heating energyconsumption
1.4 U vs R (Winter2012)
1U_1R A university library (2200m2) PBM: TRNSYS NA [91]
Beijing,China,2017
➢ 16% decrease in heating energyconsumption
2.5 Average U vsaverage R (1961e2014)
7Uavg_10Ravg An office (size not reported) PBM: DeST 26 [45]
➢ 9% decrease in heating peakload
Rome, Italy,2018
➢ 11% decrease in heating energy 1.4 U vs R (October2014 to October2016)
1U_2R Residential building PBM: TRNSYS 26 [44]
Cooling and heating combinedAthens,
Greece,2001
➢ 66% increase 10 U vs R 33U_1R A typical office (500m2) PBM: TRNSYS [46]
X. Li et al. / Energy 174 (2019) 407e419410
Table 1 (continued )
Location,publicationyear
Impacts UHI (�C) Temperaturedataa
UHIestimationb
Analyzing building Energyestimationmethodc
Setpoint(�C)
Reference
London, UK,2002,2007
➢ Up to 9.5% increase 6 U vs R 23U_1R A typical office (450m2) PBM: TAS [47,48]
London, UK,2012
➢ 0.1% decrease in 2000 NA U vs R 19U_1R A typical office (1350m2) PBM: IESVE [49]➢ 11% increase in 2050
Tokyo,Japan,2012
➢ 1% increase in the commercialsector
2.5 Simulated U vssimulated R
Gridded All buildings STM (based onmultiple yearsdata)
[63]
➢ 8% decrease in the residentialsector
➢ 3.7% decrease in all sectorsBoston, US,
2013➢ 12e15% decrease (based on
rural station closer to the citycenter)
1.3 or 2.8 U vs R 1U_2R A typical single-family and a smalloffice building (size not reported)
PBM:EnergyPlus
[43]
➢ 2e13% decrease (based onrural station further awayfrom the city center)
15 US cities,2014
➢ Increase or decrease based onclimate zone
2(Houston)
SimulatedUHI þ TMY vsTMY
A typical office (size not reported) PBM:EnergyPlus
[29]
Melbourne,Australia,2014
➢ 2.3% decrease for a detachedsingle-story
SimulatedUHI þ R vs R
1UHI Residential buildings (185m2 and1350m2)
PBM: AccuRate [97]
➢ 4.2% decrease for a two-storyhouse
Modena,Italy,2015
➢ 1% decrease 1.4 U vs R 1U_1R A university library (2200m2) PBM: TRNSYS [91]
Beijing,China,2017
➢ 3% decrease 2.5 U vs R reference An office (size not reported) PBM: DeST [45]
Rome, Italy,2018
➢ 1.7% increase or 7.2% decreasebased on the selection of ruralweather station
1.4 U vs R 1U_2R A residential building (72m2) PBM: TRNSYS [44]
a U vs R means temperatures observed from urban and rural observation stations.b Values before U and R mean the number of urban or rural stations, respectively. avg means the average temperature.c PBM means the physics-based model, STM means the statistical model.
X. Li et al. / Energy 174 (2019) 407e419 411
We collected the reported UHI impacts on building energyconsumption (i.e., percentage change) for each sample using thefollowing scheme. We used the mean value of temperature andbuilding energy consumption, if the data were collected frommultiple rural weather stations or multiple buildings. For studieswith data collected from multiple urban weather stations, we usedthe maximum value as many studies reported the maximum UHIimpact. We used current or historical climate data and real buildingoperating conditions when the studies also reported the UHI im-pacts under scenarios of climate and building characteristics. Weaggregated the city level results to the regional and global levels bycalculating the median value as they are not normally distributed.
Fig. 1. Flowchart of modeling the UHI impacts on building energy consumption.
3. Procedures in evaluating UHI impacts on building energyconsumption
The UHI impacts on building energy consumption were evalu-ated by comparing two estimations of building energy consump-tion with and without UHI effect. Practically, the procedureincludes three steps: (1) preparing two temperature datasets withand without UHI effect; (2) Simulating/Estimating building energyconsumption respectively using two temperature datasets; and (3)evaluating the UHI impacts on building energy consumption bycomparing two modeling results (Fig. 1). The remainder of thissection will discuss the detail of each step.
3.1. Temperature data with and without UHI effect
Preparing the two temperature datasets with and without UHI
effect is the first and fundamental step to evaluate the UHI impactson building energy consumption. We grouped the used approachesinto three general categories based on how the temperature data
Table 2Advantages and disadvantages of three common approaches for preparing temperature data with and without UHI effect.
Approaches Advantages Disadvantages
Observed urban and ruraltemperatures
➢ Easy data accessibility ➢ Large uncertainty due to a limited number of rural stations➢ High temporal resolution ➢ Limited spatial coverage of urban stations➢ Long temporal coverage
Simulated urban and observed ruraltemperatures
➢ Better capture of the intra-city variations of UHI ➢ Difficult to simulate urban temperature➢ Effective evaluation of urban (greenspace) planning strategies ➢ Still influenced by the limited number of rural stations
Simulated urban and ruraltemperatures
➢ A full spatial coverage ➢ Time-consuming➢ Effective evaluation of urban (greenspace) planning strategies ➢ Require lots of auxiliary datasets.
X. Li et al. / Energy 174 (2019) 407e419412
were produced (Fig. 1). We summarized their corresponding ad-vantages and disadvantages as listed in Table 2.
3.1.1. Observed urban and rural temperaturesThe most widely used temperature data to study the UHI im-
pacts on building energy consumption are temperatures from in-situ observations in urban and rural areas. Specifically, more thanhalf of the 24 studies used this approach (Table 1 and Fig. 2a). This isnot surprising as the UHI intensity was traditionally defined as
0
1
2
3
4
5
6
7
Num
ber
ofst
udie
s
Simulated Urban and RuralSimulated Urban and Observed RuralObserved Urban and Rural
(a)
Fig. 2. Numbers of studies using different approaches for preparing temperature data with aconsumption (b).
Number of w
Co
un
t
Fig. 3. Histogram of urban and rural weather station number used t
temperature difference between urban and rural areas, and airtemperature from in-situ stations is easily accessible. Most studiesused observation data at only one station (e.g., airport) to representthe rural (UHI-free) background temperature (Fig. 3), except forStreet et al. [43] and Guattari et al. [44] who used rural temperaturedata from two airports. Both of them found large differences in themodeled UHI impacts on building energy consumption usingtemperature data at different rural stations. For example, Streetet al. [43] found the cooling energy of a small office building located
0
1
2
3
4
5
6
7N
umbe
rof
stud
ies
PBM
STM
(b)
nd without UHI effect (a) and using different approaches for estimating building energy
eather stations
o investigate the UHI impacts on building energy consumption.
X. Li et al. / Energy 174 (2019) 407e419 413
in the urban area of Boston, the U.S. was 22% and 42% highercompared to that located in two rural sites, respectively. Guattariet al. [44] found that the difference in the modeled UHI impacts onbuilding energy consumption using temperatures from differentrural stations could be as high as 50% in Rome, Italy. They also foundthat the selection of observation stations could even change thedirection of the UHI impacts on building energy consumption withcooling and heating combined e the annual building energy con-sumption with cooling and heating combined increased by 1.7% inone case while it decreased by 7.2% in the other case [44]. It in-dicates that the modeled UHI impacts on building energy con-sumption are sensitive to the selection of rural stations and usingthe temperature from multiple rural stations could reduce theuncertainty [45].
Multiple urban stations were used in most studies to reveal thespatial variation of UHI within a city and intra-city variations of theUHI impacts on building energy consumption were reported inthese studies (Table 1, Fig. 3). In Athens, air temperature data werecollected from 33 urban stations when investigating the UHI im-pacts on building energy consumption [46]. In London, urban airtemperatures from 19 stations were used to study the UHI impactson building energy consumption [47e49]. Other studies usedobservation data from fewer urban stations, for example, 5 inBahrain [50], 4 inWestern Athens, Greece [51] and Rome, Italy [52],and 2 in Barcelona, Spain [27]. These studies without exceptionshowed strong spatial variations of the UHI impacts on buildingenergy consumption because of the spatial variation of UHIintensity.
The major advantage of using in-situ observed urban and ruraltemperatures is its easy access. Temperature data at thegovernment-sponsored weather stations, such as the Global His-torical Climatology Network-Daily (GHCN-Daily) dataset, are freelyavailable [53,54]. However, the spatial coverage of these data islimited, and the spatial variations of the UHI impacts on buildingenergy consumption cannot be captured well. In addition, thesedata may generate large uncertainty caused by the limited numberof rural stations as discussed above. A possible solution is tospatially interpolate the in-situ observed air temperature to creategridded datawith full spatial coverage [55]. The in-situ observed airtemperature usually showed high inter-annual variations, and theUHI impacts on building energy consumption based on tempera-ture in a single year may include uncertainties. One suggestion is toinvestigate the UHI impacts on building energy consumption basedon the temperature of multiple years [51]. Another suggestion is tobuild typical meteorological year (TMY) data, representing thelong-term typical climate [56,57], and then explore the UHI impactson building energy consumption.
3.1.2. Simulated urban temperatures and observed ruraltemperatures
Instead of using the observed urban temperature, the simulatedurban temperature with UHI effect was used in the secondapproach to study the UHI impacts on building energy consump-tion. Seven of the 24 studies used this approach and these studieswere all conducted after 2010 (Fig. 2a). Generally two schemeswere adopted to develop the UHI influenced urban temperaturedata. In the first scheme, independent data of UHI intensity can befirst built and then assimilated with the UHI-free temperature data(e.g., the TMY without UHI effect [56e58]). Using the morphingmethod, Chan [59] produced the UHI-influenced temperature databased on TMY and UHI intensity calculated using temperatures aturban and rural stations and compared the building energy con-sumptions using these two temperatures (i.e., UHI-influencedtemperature and TMY). Sun and Augenbroe [29] simulated UHIintensity using the Town Energy Budget model and the Interaction-
Soil-Biosphere-Atmosphere model (TEB-ISBA) model, and the UHIintensity was then integrated with TMY to study the UHI impactson building energy consumption of a typical office in 15 repre-sentative cities in the U.S.
In the second scheme, the urban temperatures were simulateddirectly based on the rural temperature and a series of urbanmorphology variables. Using an empirical statistical model [60],Ignatius et al. [61] and Liu et al. [62] estimated urban air temper-atures for specific urban sites based on rural temperatures and aseries of urban variables such as percent pavement, height tobuilding area ratio, wall surface area, green plot ratio, and sky viewfactor. Palme et al. [42] created urban temperature data using theUrban Weather Generator tool based on metrics of four groups: (1)surface (e.g., albedo and emissivity), (2) buildings (e.g., internalgains, schedules of heating, ventilation, and air conditioning(HVAC) system, lighting, occupation, and efficiency), (3) urban ge-ometry (e.g., built-up ratio, buildings’ average height, and facaderatio), and (4) location (e.g., latitude and longitude). The generatedurban temperature, together with the UHI-free rural temperaturewere then used to model the UHI impacts on building energyconsumption.
This approach can generate UHI-influenced urban temperaturein all urban areas, including urban center and urban periphery.Therefore, the UHI impacts on building energy consumption can beevaluated for all urban areas with a high spatial resolution. Sincethe UHI-influenced temperature was simulated based on urbanmorphology variables such as building density and greenspacecoverage, this approach can be easily adapted to test the effec-tiveness of different urban planning strategies to mitigate energyconsumption and emissions. However, this approach has severallimitations. First, the models, specifically empirical models used tocreate the urban temperature data, are usually not widely available[60]. Second, the required high spatial resolution datasets of theurban morphology variables are usually difficult to acquire, espe-cially for large areas, and therefore, previous applications of thisapproach mainly focused on some representative sites [29,42].Moreover, the uncertainty similar to the first method still existsbecause the UHI-free background climate data in rural areas is stilllimited by the number of observation stations.
3.1.3. Simulated urban and rural temperaturesIn the third approach, both UHI-free and UHI-influenced tem-
peratures were simulated with a full spatial coverage using climatemodels. For example, Hirano and Fujita [63] simulated UHI-influenced and UHI-free temperatures based on the actual landuse data and that with urban land replaced by natural land (i.e., anequally mixed land use of “forest” and “wasteland”), respectively.This approach has been widely used to study the impacts of ur-banization on urban climate (i.e., UHI) [64e66], but it was rarelyused to study the UHI impacts on building energy consumption.This approach was also used to study the UHI impacts on buildingenergy demand caused by future urban expansion, based on thesimulated present and future urban temperatures. Using thisapproach, Tewari et al. [36] modeled the impacts of the future ur-ban expansion caused UHI on building energy demand in Arizona,U.S., in the context of climate change and rapid urbanization.
The simulated UHI-influenced and UHI-free temperature usu-ally cover the entire city with a high spatial resolution. This fullcoverage datasets show the potential to explore the intra-cityvariation of UHI intensity and its impacts on building energy con-sumption. The major challenge of this approach is the scarcity ofhigh spatial resolution auxiliary datasets required by climatemodels. In addition, it is computing intensive and time-consumingto prepare high spatial resolution gridded temperatures [67,68].Therefore, the applications of this approach usually focus on a short
X. Li et al. / Energy 174 (2019) 407e419414
period (e.g., a typical heat wave period [36,69]) or a single city[68,70]. These limitations could be solved with the rapid develop-ment of remote sensing technology (e.g., high spatial resolutionremote sensing data) and data process capability (e.g., high per-formance computer).
Fig. 4. Surveyed physics-based softwares or models for evaluating the UHI impacts onbuilding energy consumption. The values are the number of applications.
3.2. Simulation/estimation of building energy consumption
Simulating/Estimating building energy consumptions with andwithout UHI effect is the second step to study the UHI impacts onbuilding energy consumption. Bottom-up and top-down ap-proaches have been developed to estimate or simulate buildingenergy consumption at multiple scales [71e76]. The bottom-upapproaches, including physics-based and empirical statisticalmodeling, were more widely used to estimate the UHI impacts onbuilding energy consumption (Table 3). With a focus on the UHIimpacts on building energy consumption, we briefly summarizedthe methods of building energy consumption estimation used forevaluating the UHI impacts on building energy consumption inprevious studies (Table 3), because thorough reviews of currentmethods can be found in other papers [71,72,77e81].
3.2.1. Physics-based modelsPhysics-based models estimate building energy consumption
following the thermal transfer principles based on the ambienttemperature and physical characteristics of buildings, such asbuilding geometry, HVAC systems, usage patterns, building enve-lope, thermostat set points, occupancy rates and schedules, andinternal loads [11,71,72]. Though these models are complex andrequiring a large number of physical parameters, the widely avail-able software (Table 1 and other review papers [71,72]) makes it themost widely used method for evaluating the UHI impacts onbuilding energy consumption. This approach was used in 20 of the24 surveyed papers (Fig. 2b). EnergyPlus and TRNSYSwere themostused software (Fig. 4 and Table 1).
The physics-based model is good at simulating building energyconsumption at a local scale (e.g., a single building) with a hightemporal resolution (e.g., minutes). Numerous input parametersare usually needed in the simulation. As the simulation can beconducted at each end use level with a high temporal resolution,such models could be used for evaluating the impacts of buildingcharacteristics, HVAC schedule, and others on the UHI impacts onbuilding energy consumption. The most apparent disadvantage ofthe physics-based method is the availability of detailed buildingphysical characteristics whose quality can influence the modelperformance [11,71,82]. As numerous simulations are usuallyneeded for applications over large areas in practice, another limi-tation of this method is the requirement of intensive computationfor large area studies [71,72]. A possible solution to these limita-tions is to develop reference buildings and group simulations basedon climates, city characteristics, and building types [29,42].
Table 3Advantages and disadvantages of two widely used approaches for estimating building e
Approaches Advantages
Physics-based model ➢ Deterministic based on building physics➢ Building level simulation➢ Simulation of multiple end uses➢ Very high temporal resolution➢ Suitable for testing the impacts of building characteristics, c
Statistical model ➢ Empirical-based on real time data➢ Easy calculation➢ Usually applied for the city or higher level➢ Evaluate the impacts of exogenous factors (e.g., economic fa
3.2.2. Statistical modelsThe statistical model is another method to estimate building
energy consumption when studying the UHI impacts on buildingenergy consumption [75,83]. These models were developed basedon the empirical statistical relationship between surveyed buildingenergy consumption and ambient temperature. These models havebeen developed at multiple spatial scales from the building level[84] to the city [85,86] and the national level [87,88], depending onthe availability of energy consumption data. However, the surveyedbuilding energy consumption datasets are usually not widelyavailable and only four of the 24 studies used this method (Table 1).Hirano and Fujita [63] found a strong correlation between buildingenergy consumption (i.e., space cooling and space heating) andambient temperature with R2 higher than 0.94 and built 648 esti-mation equations to quantify the UHI impacts on building energyconsumption in Tokyo, Japan. In another two studies, linearregression models with R2 between 0.76 and 0.89 were developedto investigate the domestic electricity consumption and the in-crease in electricity consumption of air-conditioning caused by theUHI effect in the hot arid region, Bahrain [50,89]. Li et al. [90] built alogistic model with a R2 of 0.9 to estimate building energy con-sumption of electric air-conditioning and the UHI impacts onbuilding energy consumption in Beijing, China.
The statistical model is relatively easy to be implemented as itrequires fewer inputs compared to the physics-based model.Temperature data (e.g., temperature or cooling/heating degreedays) is the key parameter in thesemodels [50,63,89,90]. Moreover,this approach is good at modeling the impacts of exogenous factors(e.g., economic factors and climate) on building energy consump-tion. However, such statistical models were usually developed at
nergy consumption, adapted from Refs. [71,80].
Disadvantages
➢ Require detailed building characteristic data➢ Hard to upscale to the city or higher level➢ Hard to calculate and time-consuming➢ Hard to model the impacts of socioeconomic factors
ooling technologies, etc.➢ Require past records of energy data➢ Black box of the energy process.➢ Difficult in modeling different end uses
ctor) ➢ Coarse resolution in space and time
X. Li et al. / Energy 174 (2019) 407e419 415
the aggregate levels (e.g., city, province/state, and national), whichcould not capture the spatiotemporal variation of the relationshipbetween building energy consumption and ambient temperature.The geographically weighted regression model using large samplesof building level energy consumption could be a possible solutionto this problem. Additionally, it is difficult to evaluate the UHI im-pacts on building energy consumption with the consideration ofchanges in endogenous factors (e.g., building characteristics). Thisquestion could be well answered by the physics-based model.
3.3. Comparing building energy consumption with and without UHIeffect
Comparing the estimated building energy consumptions withand without UHI effect is the last step to evaluate the UHI impactson building energy consumption. The results are usually expressedas percentage change of building energy consumption with UHIeffect compared to that without UHI effect.
4. Findings of UHI impacts on building energy consumption
4.1. Building cooling energy consumption
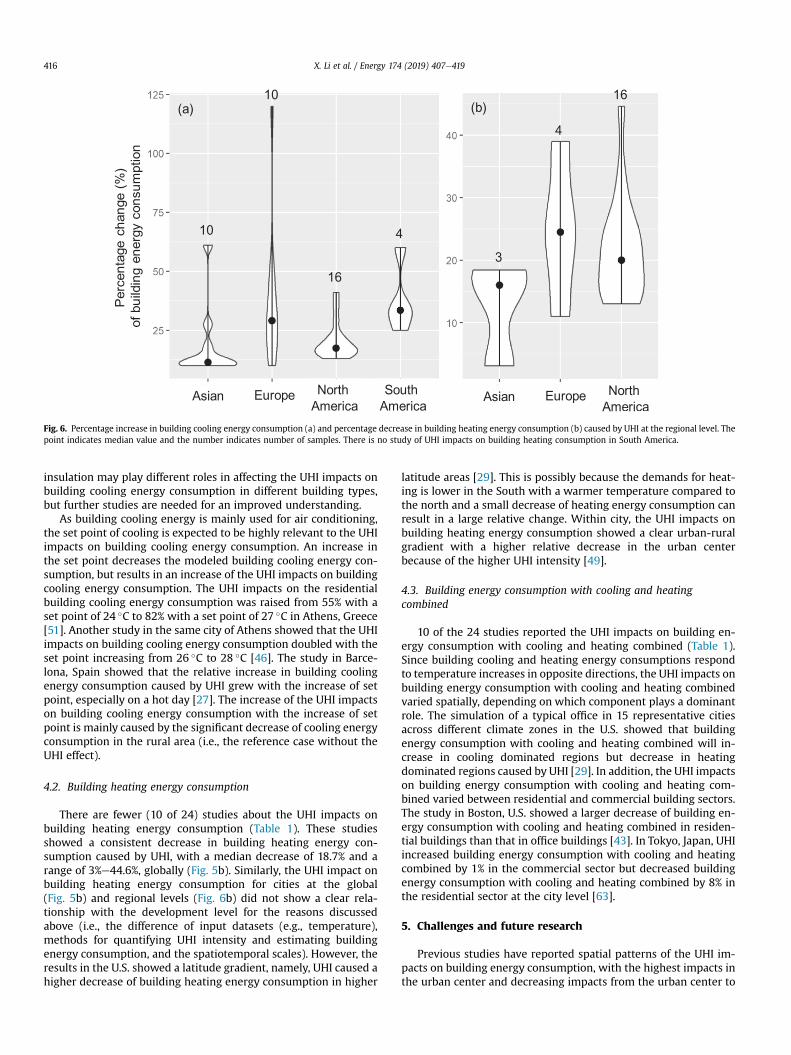
Based on the published cases studies (Table 1), UHI, could in-crease building cooling energy consumption by a median of 19%with great variation, ranging from 10% to 120% globally (Fig. 5). Theglobal median increase of the building cooling energy consumptionis slightly higher than the average of the modeled impacts in 15 U.S.cities (17.25%) [29] and the estimated global average impacts (13%)[31]. There were strong spatial variations in (1) the number ofsamples and (2) the estimated median value of the UHI impact onbuilding energy consumption across regions (Fig. 6a). The reportedUHI impacts on building cooling energy consumption did not showa clear geographical pattern and a relationship with the develop-ment stage of the city (Fig. 5a). It could be mainly caused by the
Fig. 5. Percentage increase in building cooling energy consumption (a) and percentagedecrease in building heating energy consumption (b) by UHI. (Note: The circles areoverlapped for some cities with multiple studies.)
significant differences in the input datasets (e.g., temperature), themethods for quantifying UHI intensity and estimating buildingenergy consumption, the spatiotemporal scales (e.g., the singlebuilding or whole city) (Table 1).
There are clear intra-city variations of the UHI impacts onbuilding cooling energy consumption. The strongest impacts usu-ally occurred in the urban center and the weakest impacts occurredin urban periphery, generally consistent to the intra-city pattern ofthe UHI intensity. In the western Greater Athens, Greece, Hassidet al. [51] found that the urbanized area showed a 15e50% highercooling load and a 30e80% higher maximum electrical cooling loaddepending on the location of urban sites. Based on the observationdata from 26 stations, Santamouris et al. [46] mapped the isolinesof the building cooling energy consumption of a typical building inthe city of Athens. The building cooling energy consumptiondecreased gradually from urban center to urban periphery. Theintra-city variation of the UHI impacts on building cooling energyconsumption was also reported by the simulated building energyconsumptions of 24 sites in London [47,48]. Building cooling energyconsumption increased 2%e10% for four different urban sitescompared to the rural sites in Bahrain [50]. In Rome, Italy, the in-crease in building cooling energy consumption varied between 12%in the peripheral neighborhood and 46% in the city center [52].Similar findings were also reported based on the simulated urbantemperature [29]. For example, by modeling UHI intensity of 58situations (sites) with different urban geometric parametersincluding (1) canyon height, (2) canyon aspect ratio, (3) coverage ofvegetation, and (4) coverage of building, Sun and Augenbroe [29]found higher UHI impacts on building cooling energy consumptionin large city centers than that in other urban areas. Based on thesimulated UHI and TMY, the UHI impacts on building cooling en-ergy consumption for a typical office building in Singapore werecalculated and the impacts ranged between 4% and 12% [61,62].
The UHI impacts on building cooling energy consumption variedamong different building types. The study in Hong Kong, Chinashowed different UHI impacts between office buildings and resi-dential buildings for both magnitude and temporal pattern [59].Specifically, during a hot month (i.e., July), UHI showed strongerimpacts for office buildings, while during a mild month (e.g., Mayand October), residential buildings were more affected by UHI. Astudy in Boston, U.S., reported stronger UHI impacts on buildingcooling energy consumption for office buildings than that for res-idential buildings [43]. At the city level in Tokyo, Japan, UHI causeda higher absolute increase in building cooling energy consumptionfor the commercial sector than the residential sector [63]. Thesimulations in four South American cities showed variations of theUHI impacts on building cooling energy consumption for differenttypes of residential buildings with the highest relative increase forthe detached family, followed by the medium-sized block ofapartments and tall buildings [42]. Nevertheless, Skelhorn et al.[28] found that the increases in building cooling energy con-sumption by UHI in three residential buildings with differentheight, floor area, and layout were close, with a difference lowerthan 3% in Manchester, UK.
Improvement in building thermal insulation can significantlyreduce the UHI impacts on building cooling energy consumption.Guattari et al. [44] found that the UHI impacts on building coolingenergy consumption for a residential building varied with buildingenvelope designs and technologies (18%e41%). Zinzi and Carnielo[52] found that the thermal insulation of the building envelopereduced the UHI impacts on residential building cooling energyconsumption in Rome, Italy. However, the study in Modena, Italydid not report significant influences on themodeled UHI impacts byapplying the cool coating of roof and opaque vertical surfaces in auniversity library [91]. This may indicate that the thermal
Asian Europe NorthAmerica
SouthAmerica
Asian Europe NorthAmerica
(a) (b)Pe
rcentage
change
(%)
ofbuildingenergy
consum
ption
10
10
16
4
3
4
16
Fig. 6. Percentage increase in building cooling energy consumption (a) and percentage decrease in building heating energy consumption (b) caused by UHI at the regional level. Thepoint indicates median value and the number indicates number of samples. There is no study of UHI impacts on building heating consumption in South America.
X. Li et al. / Energy 174 (2019) 407e419416
insulation may play different roles in affecting the UHI impacts onbuilding cooling energy consumption in different building types,but further studies are needed for an improved understanding.
As building cooling energy is mainly used for air conditioning,the set point of cooling is expected to be highly relevant to the UHIimpacts on building cooling energy consumption. An increase inthe set point decreases the modeled building cooling energy con-sumption, but results in an increase of the UHI impacts on buildingcooling energy consumption. The UHI impacts on the residentialbuilding cooling energy consumption was raised from 55% with aset point of 24 �C to 82% with a set point of 27 �C in Athens, Greece[51]. Another study in the same city of Athens showed that the UHIimpacts on building cooling energy consumption doubled with theset point increasing from 26 �C to 28 �C [46]. The study in Barce-lona, Spain showed that the relative increase in building coolingenergy consumption caused by UHI grew with the increase of setpoint, especially on a hot day [27]. The increase of the UHI impactson building cooling energy consumption with the increase of setpoint is mainly caused by the significant decrease of cooling energyconsumption in the rural area (i.e., the reference case without theUHI effect).
4.2. Building heating energy consumption
There are fewer (10 of 24) studies about the UHI impacts onbuilding heating energy consumption (Table 1). These studiesshowed a consistent decrease in building heating energy con-sumption caused by UHI, with a median decrease of 18.7% and arange of 3%e44.6%, globally (Fig. 5b). Similarly, the UHI impact onbuilding heating energy consumption for cities at the global(Fig. 5b) and regional levels (Fig. 6b) did not show a clear rela-tionship with the development level for the reasons discussedabove (i.e., the difference of input datasets (e.g., temperature),methods for quantifying UHI intensity and estimating buildingenergy consumption, and the spatiotemporal scales). However, theresults in the U.S. showed a latitude gradient, namely, UHI caused ahigher decrease of building heating energy consumption in higher
latitude areas [29]. This is possibly because the demands for heat-ing is lower in the South with a warmer temperature compared tothe north and a small decrease of heating energy consumption canresult in a large relative change. Within city, the UHI impacts onbuilding heating energy consumption showed a clear urban-ruralgradient with a higher relative decrease in the urban centerbecause of the higher UHI intensity [49].
4.3. Building energy consumption with cooling and heatingcombined
10 of the 24 studies reported the UHI impacts on building en-ergy consumption with cooling and heating combined (Table 1).Since building cooling and heating energy consumptions respondto temperature increases in opposite directions, the UHI impacts onbuilding energy consumption with cooling and heating combinedvaried spatially, depending on which component plays a dominantrole. The simulation of a typical office in 15 representative citiesacross different climate zones in the U.S. showed that buildingenergy consumption with cooling and heating combined will in-crease in cooling dominated regions but decrease in heatingdominated regions caused by UHI [29]. In addition, the UHI impactson building energy consumption with cooling and heating com-bined varied between residential and commercial building sectors.The study in Boston, U.S. showed a larger decrease of building en-ergy consumption with cooling and heating combined in residen-tial buildings than that in office buildings [43]. In Tokyo, Japan, UHIincreased building energy consumption with cooling and heatingcombined by 1% in the commercial sector but decreased buildingenergy consumption with cooling and heating combined by 8% inthe residential sector at the city level [63].
5. Challenges and future research
Previous studies have reported spatial patterns of the UHI im-pacts on building energy consumption, with the highest impacts inthe urban center and decreasing impacts from the urban center to
X. Li et al. / Energy 174 (2019) 407e419 417
the urban periphery. However, such spatial patterns were mainlydiscovered based on a limited number of selected sites and fewstudies reported the detail of spatial variations in the UHI impacts,mainly due to the data unavailability. Though some geostatisticaltechnologies can be used to spatially interpolate the UHI impacts onbuilding energy consumption from selected sites to the whole city,the spatial detail is still limited in a smooth surface of the UHIimpacts [46]. High spatial resolution gridded air temperaturedatasets with a spatial coverage in both urban and rural areas,instead of the in-situ observed air temperature, can greatly improvethe investigation of spatial patterns of the UHI impacts on buildingenergy consumption. Simulating high spatial resolution gridded airtemperature using climate models such as the study of Hirano andFujita [63] is a potential method and the newly created high spatialresolution gridded air temperature dataset [38,55,92,93] is anotherpotential method.
Though studies were conducted inmany cities around theworldas shown in Fig. 5, it is difficult to compare the results amongdifferent studies because these studies varied greatly in manyfactors such as geographical locations, study periods, backgroundclimates, UHI definition and calculation, the method of buildingenergy consumption estimation, and building characteristics. Sunand Augenbroe [29] compared the UHI impacts on energy con-sumption of a typical office building in 15 representative cities indifferent climate zones in the U.S. and Palme et al. [42] simulatedthe UHI impacts on energy consumption of residential buildings infour South American Pacific coastal cities. Such comparative studiescan be extended to other regions and even global to improve theunderstanding of the UHI impacts on building energy consumption(e.g., regional and global patterns and relationship with city char-acteristics such as geographical locations, sizes, developmentstages). Given the complexity and large variations of the impacts,international and inter-city comparison projects are suggested.Standards such as modeling datasets, model setup (e.g., set points),and reference building for different types, can be designed in theseprojects. In addition, with comparable results, the relationshipbetween the UHI impacts on building energy consumption and UHImagnitude and background climate can be investigated [31].
Studies of UHI impacts on building energy consumption showedan uneven spatial distribution with most of them in North Americaand Europe, but few of them in Africa, Asia, and South America(Fig. 5). The possible reasons are: (1) UHI has a smaller spatialextent in developing countries as their urbanization level is stilllow; (2) UHI impacts were not paid enough attention in developingcountries as the governments focused more on socioeconomicdevelopment instead of the environment; and (3) The required data(including temperature and building characteristic) for studyingthe UHI impacts on building energy consumption are scarcer indeveloping countries. Considering the rapid socioeconomic devel-opment and urbanization in Asia and Africa [94,95], it is expectedthat there will be a significant increase in building energy con-sumption and UHI intensity. Investigating the UHI impacts onbuilding energy consumption in these developing regions shouldbe highlighted in the future.
Previous studies mostly evaluated the UHI impacts on buildingenergy consumption by a spatial comparison using historicaltemperature data, but fewer studies investigated the UHI impactsin a warmer future influenced simultaneously by the global climatechange and the increase of local UHI intensity caused by furtherurban expansion. Kolokotroni et al. [49] compared building energyconsumption of an office building with the location moved fromrural to urban areas and from the present (2010) to 2050 in Londonunder a future climate change scenario. Hwang et al. [17] comparedbuilding energy consumptions for a typical residential apartment inrural and urban areas of central Taiwan, China in a future period of
2075e2099. However, both studies did not consider the increasedUHI intensity due to future urban expansion. A simulation study inArizona, U.S. even showed that the impacts of urban expansion onbuilding energy consumption were higher than that of globalclimate change [36]. Investigation of the UHI impacts caused byurban expansion on building energy consumption in the context ofglobal climate change is highly recommended especially in regionswith an expected high urban expansion. This also alerts us that inaddition to the global climate change, the local urban warmingcaused by urban expansion should be explicitly incorporated inclimate modeling and projection.
6. Conclusions
Although the significance of the UHI impacts on building energyconsumption is widely recognized by the scientific and policycommunities, the quantitative UHI impacts are understudied. Inthis study, we reviewed literature that quantitatively modeled UHIimpacts on building energy consumption. A majority of previousstudies investigated UHI impacts for a typical building using tem-peratures from urban and rural sites based on physics-basedmodels, and a few studies investigated the spatial (both intra-and inter- city) variations of the UHI impacts. We found UHI couldlead to a median of 19% increase in building cooling energy con-sumption and a median of 18.7% decrease in building heating en-ergy consumption. Moreover, the reported UHI impacts showedstrong intercity variations with an increase of cooling energy con-sumption ranging from 10% to 120% and a decrease of heating en-ergy consumption ranging from 3% to 45%. Within a city, the UHIimpacts were found the highest in the urban center and showed adecreasing urban-rural trend, similar to that of UHI intensity.
The major challenge in evaluating UHI impacts is the scarcity ofdata with high spatial resolutions and a large spatial coverage, suchas temperature data with and without UHI effect and building datawith detailed characteristics. These limitations are expected to bepartially addressed in future studies with better temperature data(e.g., the newly created high spatial resolution air temperaturedatasets [55,92]) and reference buildings of different types in avariety of climate zones. In addition, previous studies were mainlyconducted in developed countries (e.g., in North America andEurope) from the spatial perspective (i.e., urban and rural com-parisons), while the rapid urban expansion, with a resulting in-crease in UHI intensity, is expected in developing countries in thecoming decades. More attention can be paid in future studies forthe UHI impacts on building energy consumption in developingcountries (e.g., in Asia and Africa). In addition, investigating UHIimpacts on building energy consumption in the context of com-bined future climate change and urbanization is recommended infuture studies.
Acknowledgments
This study was supported by the National Science Foundation(CBET- 1803920) and National Natural Science Foundation of Chinaproject (Grant # 41861124005). We would like thank three anon-ymous reviewers for their constructive comments and suggestions.
References
[1] Ürge-Vorsatz D, et al. Chapter 10 - energy end-use: building. In: Global energyassessment - toward a sustainable future. Laxenburg, Austria: CambridgeUniversity Press, Cambridge, UK and New York, NY, USA and the InternationalInstitute for Applied Systems Analysis; 2012. p. 649e760.
[2] Kyle P, et al. Climate policy and the long-term evolution of the US buildingssector. Energy J 2010:145e72.
[3] Eom J, et al. China's building energy demand: long-term implications from a
detailed assessment. Energy 2012;46(1):405e19.[4] Ürge-Vorsatz D, et al. Heating and cooling energy trends and drivers in
buildings. Renew Sustain Energy Rev 2015;41:85e98.[5] British Petroleum Company. BP energy outlook - 2018 edition. 2018.[6] Varbanov PS, Kleme�s JJ, Wang X. Methods optimisation, Process Integration
and modelling for energy saving and pollution reduction. Energy 2018;146:1e3.
[7] ürge-Vorsatz D, et al. Mitigating CO2 emissions from energy use in the world'sbuildings. Build Res Inf 2007;35(4):379e98.
[8] Zhao HX, Magoul�es F. A review on the prediction of building energy con-sumption. Renew Sustain Energy Rev 2012;16(6):3586e92.
[9] Li W, et al. Developing a landscape of urban building energy use withimproved spatiotemporal representations in a cool-humid climate. Build En-viron 2018;136:107e17.
[10] Kavousian A, Rajagopal R, Fischer M. Determinants of residential electricityconsumption: using smart meter data to examine the effect of climate,building characteristics, appliance stock, and occupants' behavior. Energy2013;55:184e94.
[11] Yang Z, Ghahramani A, Becerik-Gerber B. Building occupancy diversity andHVAC (heating, ventilation, and air conditioning) system energy efficiency.Energy 2016;109:641e9.
[12] Zhou Y, Gurney K. A new methodology for quantifying on-site residential andcommercial fossil fuel CO2 emissions at the building spatial scale and hourlytime scale. Carbon Manag 2010;1(1):45e56.
[13] Rubio-Bellido C, P�erez-Fargallo A, Pulido-Arcas JA. Optimization of annualenergy demand in office buildings under the influence of climate change inChile. Energy 2016;114:569e85.
[14] Huang J, Gurney KR. The variation of climate change impact on building en-ergy consumption to building type and spatiotemporal scale. Energy2016;111:137e53.
[15] Xu P, et al. Impacts of climate change on building heating and cooling energypatterns in California. Energy 2012;44(1):792e804.
[16] Zhou Y, et al. Modeling the effect of climate change on U.S. state-levelbuildings energy demands in an integrated assessment framework. ApplEnergy 2014;113:1077e88.
[17] Hwang R-L, Lin C-Y, Huang K-T. Spatial and temporal analysis of urban heatisland and global warming on residential thermal comfort and cooling energyin Taiwan. Energy Build 2017;152:804e12.
[18] Zhou Y, Eom J, Clarke L. The effect of global climate change, population dis-tribution, and climate mitigation on building energy use in the U.S. and China.Clim Change 2013;119(3):979e92.
[19] Santamouris M, et al. On the impact of urban heat island and global warmingon the power demand and electricity consumption of buildingsda review.Energy Build 2015;98:119e24.
[20] Zhou W, Wang J, Cadenasso ML. Effects of the spatial configuration of trees onurban heat mitigation: a comparative study. Remote Sens Environ 2017;195:1e12.
[21] Oke TR. The energetic basis of the urban heat island. Q J R Meteorol Soc1982;108(455):1e24.
[22] Santamouris M. Analyzing the heat island magnitude and characteristics inone hundred Asian and Australian cities and regions. Sci Total Environ2015;512e513:582e98.
[23] Imhoff ML, et al. Remote sensing of the urban heat island effect across biomesin the continental USA. Remote Sens Environ 2010;114(3):504e13.
[24] Li X, et al. The surface urban heat island response to urban expansion: a panelanalysis for the conterminous United States. Sci Total Environ 2017;605:426e35.
[25] Peng S, et al. Surface urban heat island across 419 global big cities. Environ SciTechnol 2011;46(2):696e703.
[26] Li H, et al. A new method to quantify surface urban heat island intensity. SciTotal Environ 2018;624:262e72.
[27] Salvati A, Roura HC, Cecere C. Assessing the urban heat island and its energyimpact on residential buildings in Mediterranean climate: Barcelona casestudy. Energy Build 2017;146:38e54.
[28] Skelhorn CP, Levermore G, Lindley SJ. Impacts on cooling energy consumptiondue to the UHI and vegetation changes in Manchester, UK. Energy Build2016;122:150e9.
[29] Sun Y, Augenbroe G. Urban heat island effect on energy application studies ofoffice buildings. Energy Build 2014;77:171e9.
[30] Lowe SA. An energy and mortality impact assessment of the urban heat islandin the US. Environ Impact Assess Rev 2016;56:139e44.
[31] Santamouris M. On the energy impact of urban heat island and globalwarming on buildings. Energy Build 2014;82:100e13.
[32] Zhou Y, et al. A global map of urban extent from nightlights. Environ Res Lett2015;10(5):054011.
[33] Liu Z, et al. How much of the world's land has been urbanized, really? A hi-erarchical framework for avoiding confusion. Landsc Ecol 2014;29(5):763e71.
[34] Zhou Y, et al. A global record of annual urban dynamics (1992-2013) fromnighttime lights. Remote Sensing of Environment; 2018.
[35] Oke TR. City size and the urban heat island. Atmos Environ 1973;7(8):769e79.[36] Tewari M, et al. Impacts of projected urban expansion and global warming on
cooling energy demand over a semiarid region. Atmos Sci Lett 2017;18(11):419e26.
[37] Chapman S, et al. The impact of urbanization and climate change on urbantemperatures: a systematic review. Landsc Ecol 2017;32(10):1921e35.
[38] Schatz J, Kucharik CJ. Urban heat island effects on growing seasons andheating and cooling degree days in Madison, Wisconsin USA. Int J Climatol2016;36:4873e84.
[39] Vardoulakis E, et al. The urban heat island effect in a small Mediterranean cityof high summer temperatures and cooling energy demands. Sol Energy2013;94(0):128e44.
[40] Santamouris M, et al. On the energy impact of urban heat island in Sydney:climate and energy potential of mitigation technologies. Energy Build2018;166:154e64.
[41] Roman KK, et al. Simulating the effects of cool roof and PCM (phase changematerials) based roof to mitigate UHI (urban heat island) in prominent UScities. Energy 2016;96:103e17.
[42] Palme M, et al. From urban climate to energy consumption. Enhancingbuilding performance simulation by including the urban heat island effect.Energy Build 2017;145(Supplement C):107e20.
[43] Street M, et al. Urban heat island in BostoneAn evaluation of urban air-temperature models for predicting building energy use. In: Proceedings ofBS2013: 13th conference of international building performance simulationassociation; 2013.
[44] Guattari C, Evangelisti L, Balaras CA. On the assessment of urban heat islandphenomenon and its effects on building energy performance: a case study ofRome (Italy). Energy Build 2018;158:605e15.
[45] Cui Y, et al. Temporal and spatial characteristics of the urban heat island inBeijing and the impact on building design and energy performance. Energy2017;130(Supplement C):286e97.
[46] Santamouris M, et al. On the impact of urban climate on the energy con-sumption of buildings. Sol Energy 2001;70(3):201e16.
[47] Kolokotroni M, Zhang Y, Watkins R. The London Heat Island and buildingcooling design. Sol Energy 2007;81(1):102e10.
[48] Watkins R, et al. The balance of the annual heating and cooling demandwithin the London urban heat island. Build Serv Eng Technol 2002;23(4):207e13.
[49] Kolokotroni M, et al. London's urban heat island: impact on current and futureenergy consumption in office buildings. Energy Build 2012;47(0):302e11.
[50] Radhi H, Sharples S. Quantifying the domestic electricity consumption for air-conditioning due to urban heat islands in hot arid regions. Appl Energy2013;112(0):371e80.
[51] Hassid S, et al. The effect of the Athens heat island on air conditioning load.Energy Build 2000;32(2):131e41.
[52] Zinzi M, Carnielo E. Impact of urban temperatures on energy performance andthermal comfort in residential buildings. The case of Rome, Italy. Energy Build2017;157:20e9.
[53] Menne, M., et al., Global historical Climatology network-daily (GHCN-Daily),version 3. NOAA National Climatic Data Center. doi:10.7289/V5D21VHZ 2012,Version.
[54] Zhang P, et al. Comparison of MODIS land surface temperature and air tem-perature over the continental USA meteorological stations. Can J Remote Sens2014;40(2):110e22.
[55] Li X, et al. Developing a 1 km resolution daily air temperature dataset forurban and surrounding areas in the conterminous United States. Remote SensEnviron 2018;215:74e84.
[56] Cui Y, et al. Comparison of typical year and multiyear building simulationsusing a 55-year actual weather data set from China. Appl Energy 2017;195:890e904.
[57] Yang L, et al. Building energy simulation using multi-years and typicalmeteorological years in different climates. Energy Convers Manag 2008;49(1):113e24.
[58] Yang L, et al. A new method to develop typical weather years in differentclimates for building energy use studies. Energy 2011;36(10):6121e9.
[59] Chan ALS. Developing a modified typical meteorological year weather file forHong Kong taking into account the urban heat island effect. Build Environ2011;46(12):2434e41.
[60] Jusuf SK, Wong NH. Development of empirical models for an estate level airtemperature prediction in Singapore. In: Proceedings of the second interna-tional conference on countermeasures to urban heat islands; 2009.
[61] Ignatius M, Wong NH, Jusuf SK. The significance of using local predictedtemperature for cooling load simulation in the tropics. Energy Build2016;118(Supplement C):57e69.
[62] Liu Y, et al. Comparing micro-scale weather data to building energy con-sumption in Singapore. Energy Build 2017;152(Supplement C):776e91.
[63] Hirano Y, Fujita T. Evaluation of the impact of the urban heat island on resi-dential and commercial energy consumption in Tokyo. Energy 2012;37(1):371e83.
[64] Wang J, et al. Response of urban heat island to future urban expansion overthe BeijingeTianjineHebei metropolitan area. Appl Geogr 2016;70:26e36.
[65] Cao Q, et al. Impacts of future urban expansion on summer climate and heat-related human health in eastern China. Environ Int 2018;112:134e46.
[66] Li H, et al. Impact of land cover data on the simulation of urban heat island forBerlin using WRF coupled with bulk approach of Noah-LSM. Theor Appl Cli-matol 2017;(6):1e15.
[67] Heaviside C, Vardoulakis S, Cai X-M. Attribution of mortality to the urban heatisland during heatwaves in the West Midlands, UK. Environ Health2016;15(1):S27.
[68] Lauwaet D, et al. Detailed urban heat island projections for cities worldwide:dynamical downscaling CMIP5 global climate models. Climate 2015;3(2):391.
[69] Long Y, et al. Contrasting impacts of urban forms on the future thermalenvironment: example of Beijing metropolitan area. Environ Res Lett2016;11(3):034018.
[70] Argüeso D, et al. Temperature response to future urbanization and climatechange. Clim Dyn 2014;42(7e8):2183e99.
[71] Li W, et al. Modeling urban building energy use: a review of modeling ap-proaches and procedures. Energy 2017;141:2445e57.
[72] Kavgic M, et al. A review of bottom-up building stock models for energyconsumption in the residential sector. Build Environ 2010;45(7):1683e97.
[73] Biswas MAR, Robinson MD, Fumo N. Prediction of residential building energyconsumption: a neural network approach. Energy 2016;117:84e92.
[74] Naji S, et al. Estimating building energy consumption using extreme learningmachine method. Energy 2016;97:506e16.
[75] Tian W, Song J, Li Z. Spatial regression analysis of domestic energy in urbanareas. Energy 2014;76:629e40.
[76] Yu S, et al. Scenarios of building energy demand for China with a detailedregional representation. Energy 2014;67:284e97.
[77] Swan LG, Ugursal VI. Modeling of end-use energy consumption in the resi-dential sector: a review of modeling techniques. Renew Sustain Energy Rev2009;13(8):1819e35.
[78] Ahmad AS, et al. A review on applications of ANN and SVM for buildingelectrical energy consumption forecasting. Renew Sustain Energy Rev2014;33:102e9.
[79] Cerezo Davila C, Reinhart CF, Bemis JL. Modeling Boston: a workflow for theefficient generation and maintenance of urban building energy models fromexisting geospatial datasets. Energy 2016;117:237e50.
[80] Deb C, et al. A review on time series forecasting techniques for building en-ergy consumption. Renew Sustain Energy Rev 2017;74:902e24.
[81] Fumo N. A review on the basics of building energy estimation. Renew SustainEnergy Rev 2014;31:53e60.
[82] Dodoo A, Tettey UYA, Gustavsson L. Influence of simulation assumptions andinput parameters on energy balance calculations of residential buildings.Energy 2017;120:718e30.
[83] Li XX. Linking residential electricity consumption and outdoor climate in atropical city. Energy 2018;157:734e43.
[84] Robinson C, et al. Machine learning approaches for estimating commercialbuilding energy consumption. Appl Energy 2017;208:889e904.
[85] Kohler M, Blond N, Clappier A. A city scale degree-day method to assessbuilding space heating energy demands in Strasbourg Eurometropolis(France). Appl Energy 2016;184:40e54.
[86] Waite M, et al. Global trends in urban electricity demands for cooling andheating. Energy 2017;127:786e802.
[87] Wenz L, Levermann A, Auffhammer M. Northesouth polarization of Europeanelectricity consumption under future warming. Proc Natl Acad Sci Unit StatesAm 2017;114(38):E7910e8.
[88] Auffhammer M, Baylis P, Hausman CH. Climate change is projected to havesevere impacts on the frequency and intensity of peak electricity demandacross the United States. Proc Natl Acad Sci Unit States Am 2017;114(8):1886e91.
[89] Radhi H, Sharples S, Assem E. Impact of urban heat islands on the thermalcomfort and cooling energy demand of artificial islandsda case study ofAMWAJ Islands in Bahrain. Sustain Cities Soc 2015;19(Supplement C):310e8.
[90] Li C, et al. Interaction between urban microclimate and electric air-conditioning energy consumption during high temperature season. Appl En-ergy 2014;117:149e56.
[91] Magli S, et al. Analysis of the urban heat island effects on building energyconsumption. Int J Energy Environ Eng 2015;6(1):91e9.
[92] Oyler JW, et al. Creating a topoclimatic daily air temperature dataset for theconterminous United States using homogenized station data and remotelysensed land skin temperature. Int J Climatol 2015;35(9):2258e79.
[93] Kloog I, et al. Modelling spatio-temporally resolved air temperature across thecomplex geo-climate area of France using satellite-derived land surfacetemperature data. Int J Climatol 2017;37(1):296e304.
[94] United Nations, World Urbanization Prospects. The 2014 revision. PopulationDivision of the Department of Economic and Social Affairs of the United Na-tions Secretariat; 2014.
[95] Seto KC, Güneralp B, Hutyra LR. Global forecasts of urban expansion to 2030and direct impacts on biodiversity and carbon pools. Proc Natl Acad Sci UnitStates Am 2012;109(40):16083e8.
[96] Kolokotroni M, Giannitsaris I, Watkins R. The effect of the London urban heatisland on building summer cooling demand and night ventilation strategies.Sol Energy 2006;80(4):383e92.
[97] Ren Z, et al. Constructing weather data for building simulation consideringurban heat island. Build Serv Eng Technol 2014;35(1):69e82.