Page 1
Urban Park Redevelopment: Neighborhood Benefits and Leisure-Time Physical Activity
Engagement
by
Myra Marie Tetteh
A dissertation submitted in partial fulfillment
of the requirements for the degree of
Doctor of Philosophy
(Health Behavior and Health Education)
in The University of Michigan
2019
Doctoral Committee:
Associate Professor Ritesh Mistry, Co-Chair
Professor Kenneth Resnicow, Co-Chair
Associate Professor Larissa Larsen
Khalil Ligon, Vista Vantage Consulting Group, L3C
Assistant Professor Natalie R. Sampson
Page 2
Myra Marie Tetteh
[email protected]
ORCID iD: 0000-0003-3812-4132
© Myra Marie Tetteh 2019
Page 3
ii
DEDICATION
This dissertation is dedicated to my mother for your endless support and love. Without
you this work would be impossible.
Page 4
iii
ACKNOWLEDGMENTS
First, I thank my Lord and Savior Jesus Christ! I rejoice in You always – especially now!
I thank You for holding my breath in Your hands and for knowing the plans You had for me
before I was even born!
My committee co-chairs, Ken Resnicow and Ritesh Mistry, have shown me so much
patience and have helped me beyond what I could have imagined. Without you two, this
dissertation would have been impossible. Thank you to my committee members Professor
Larissa Larsen, Professor Natalie Sampson, Khalil Ligon, and the additional help from Professor
Vicki Johnson-Lawrence and Professor Lan Deng. Together with this team I have learned so
much. I am grateful for working with each of you who helped me become a researcher.
The Center for Statistical Consultation and Research (CSCAR) provided invaluable
support for my dissertation research, particularly Corey Powell, Manish Verma, and Brady West.
Nicole Scholtz in the Spatial and Numerical Data Services Lab (SAND) Lab spent countless
hours with me on my research over the years and I am thankful for her support.
I thank the Center for Research on Ethnicity, Culture, and Health (CRECH) and the
Rackham Graduate School for supporting my education and research. Dr. Emma Flores, you
were the first representative in the Graduate School I met, and I still remember you encouraging
us to attend a defense to take it in and be encouraged that our day was coming. Thank you!
I am thankful to the School of Public Health – Health Behavior & Health Education
Department for fostering my education and encouraging me to become a researcher. Jackie
Page 5
iv
Cormany, Jenny Crawford, and Candy Ellis, you are the heart and lungs of our Department.
Without you we would fall apart. I thank Professors Amy Schulz and Barbara Israel for
encouraging me from the first day I even considered applying to the program. I will always
appreciate Professor Gary Harper for leading the Admissions Committee in 2014, supervising
my teaching experiences, and always serving as a professional advocate. Without this program, I
would not have met Amel, Carissa, Kazumi, and Sarah. These four amazing women supported
me through tears, shared laughs with me, and pushed me beyond what I thought was possible. I
thank Kirsten Herold in the SPH Writing Lab for helping me form ideas, review my writing, and
for all the great conversations along the way!
This dissertation and my doctoral work would not have been possible without the support
of the City of Detroit, the Michigan Center on Lifestage Environmental Exposures and Disease
(M-LEEaD), the Center for Integrative Approaches to Health Disparities, Blue Cross Blue Shield
of Michigan Foundation, the Center for Health and Research Transformation, mParks, and the
Detroit Greenways Coalition. Thank you sincerely to representatives from the City of Detroit,
Meagan Elliott, Juliana Fulton, Alex Hill, Christina Peltier, Janet Attarian, Caitlin Marcon, and
Cyrus Tetteh for speaking with me on numerous occasions, providing data, and answering my
innumerable questions with patience! My experience at the Detroit Health Department (Detroit
Department of Health and Wellness Promotion) with Harolyn Tarr and Jaye Clement helped me
become a competent public health practitioner! Thank you to my former colleagues from the
University of Michigan including Chris Coombe, Sharon Sand, Carol Gray, Sherita Smith,
Kristina Rice, and Julia Weinert, for your support. I am grateful for my time at the Blue Cross
Blue Shield of Michigan Foundation with Audrey Harvey, Nora Maloy, Sue Shelton, Elba
Huerta, and Jackie Paul, you showed me why research matters in the real world. Thank you to
Page 6
v
Center for Health and Research Transformation. Working and finishing school is challenging,
but my colleagues are beyond understanding. Thank you to mParks for showing me the practice
side of my research, those around the table have inspired me with your passion for service in
parks and recreation! Todd Scott and the Detroit Greenways Coalition, thank you for being a
partner in advocacy in Detroit – from your hard work we have hundreds of miles of bicycle
lanes, an expanding greenway system, and parks in communities that encourage health and
wellness of residents and visitors!
Dr. Rebecca Mandell, Professor Natalie Sampson, and Professor Jamila Kwarteng – you
each encouraged me to apply and told me that I could make it through this process. Thank each
of you for being a supportive ear and providing me with advice along the way. Dr. Jorge Soler,
one of the biggest steps in this program is the promotion from pre-candidate to candidate – thank
you all the help you provided along the way.
I am beyond grateful to my families at Grace Community Church of Detroit, Woodside
Bible Church – Detroit, and Detroit Church for praying for me along the way. Alicia, Aundraya,
Brittany, Celeste, Gillian, Janel, Kiana, Nicole, Nina, and Shantel, each of you have been on this
journey with me. Your support means more to me than I can ever express. You have heard the
cries, anger, and happiness from day one, thank you for everything!
This journey started in 1959 when Jodie Sylvester and Bessie Mae Hargrove sponsored
my grandfather, Jake Tetteh, to come to this country from Ghana. Grandpa, thank you for
instilling in me the importance of education. Though you did not make it to see my high school
graduation and beyond, I hold your lessons near to my heart and know you would be proud to
see the first doctor in the Tetteh Family USA. Grandma, thank you for being the bravest person I
know. You left Ghana to come join grandpa and start a family. Without hearing “hop to it” after
Page 7
vi
school, I would have a lot of incomplete homework. I am thankful we share a name so your
name will be on this degree! Mom, sacrifice is your middle name! There has never been a day
when you didn’t put my needs ahead of your needs. You had me at 17 and always told me I will
not be a statistic. I was there for your college graduation, master’s degree graduation, and soon
doctoral graduation – I am beyond proud of you! Thank you, Uncle George and Aunt Juanita,
for your prayers and helping me stay grounded in the Word! Thank you, Uncle Jodie, for always
being a supportive ear and cheering me on! Thank you, Uncle Walter and Aunt Tanzi, for your
encouragement and laughs! Derrick, Celina, Cyrus, and Chandra – I could not have done this
without you! Morgan, Jadon, Caleb, Paige, and Cameryn – you have no idea how you enriched
my life outside of school with basketball, football, and baseball games, cheerleading, and
garbage bag dresses. Thank you so much!
Finally, I sincerely thank anyone who reads this dissertation! I hope this research
educates you, encourages you to formulate new research questions, and leads you to change the
world!
Page 8
vii
TABLE OF CONTENTS
DEDICATION ................................................................................................................................ ii
ACKNOWLEDGMENTS ............................................................................................................. iii
LIST OF TABLES ....................................................................................................................... viii
LIST OF FIGURES ........................................................................................................................ x
LIST OF APPENDICES ............................................................................................................... xii
Abstract ........................................................................................................................................ xiii
Chapter I Introduction ..................................................................................................................... 1
Chapter II Paper I Associations of Neighborhood Park Redevelopment and Leisure-Time
Physical Activity ........................................................................................................................... 24
Chapter III Paper II Changes in Reported Crime and Blight Fines Following Park
Redevelopment ............................................................................................................................. 50
Chapter IV Paper III Changes in Valid Arm’s Length Residential Property Sales Price Following
Park Redevelopment ..................................................................................................................... 81
Chapter V Discussion ................................................................................................................. 102
Literature Cited ........................................................................................................................... 112
Appendices .................................................................................................................................. 137
Page 9
viii
LIST OF TABLES
Table I.1. Household Median Income, Poverty, and LTPA Engagement ...................................... 3
Table I.2. City of Detroit, Michigan Park Improvement Phases Construction Season .................. 4
Table I.3. Trust for Public Land Rankings ..................................................................................... 9
Table II.1: Study variables ............................................................................................................ 29
Table II.2. Summary Statistics ...................................................................................................... 38
Table II.3. Bivariate Analysis of Park Redevelopment 2006-2015 and Leisure-Time Physical
Activity ......................................................................................................................................... 39
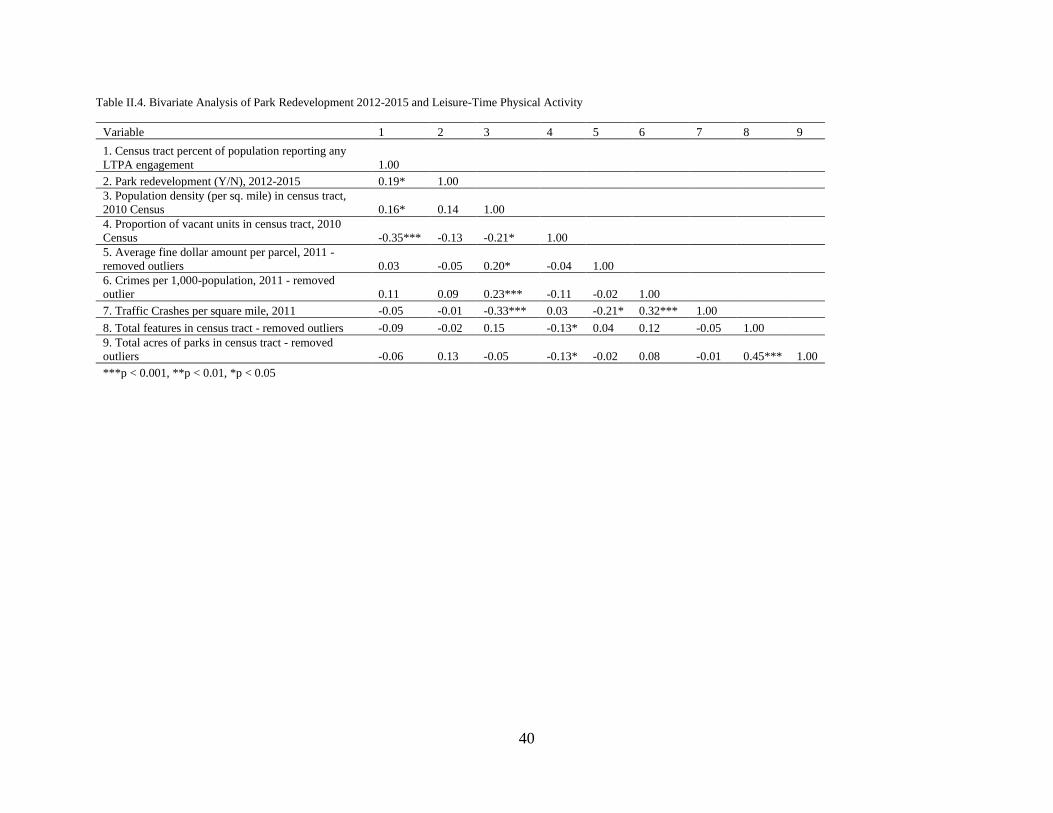
Table II.4. Bivariate Analysis of Park Redevelopment 2012-2015 and Leisure-Time Physical
Activity ......................................................................................................................................... 40
Table II.5. Regression Models of Leisure-Time Physical Activity and Park Redeveloped, 2006-
2015............................................................................................................................................... 42
Table II.6. Regression Models of Leisure-Time Physical Activity and Park Redeveloped, 2012-
2015............................................................................................................................................... 45
Table III.1. Study variables ........................................................................................................... 56
Table III.2. Summary Statistics (Blight) ....................................................................................... 61
Table III.3. Summary Statistics (Crime) ....................................................................................... 62
Table III.4. Bivariate Analysis of Park Redevelopment and Average Blight Fine per Parcel ..... 63
Table III.5. Bivariate Analysis of Park Redevelopment and Reported Crime per 1,000-Population
....................................................................................................................................................... 64
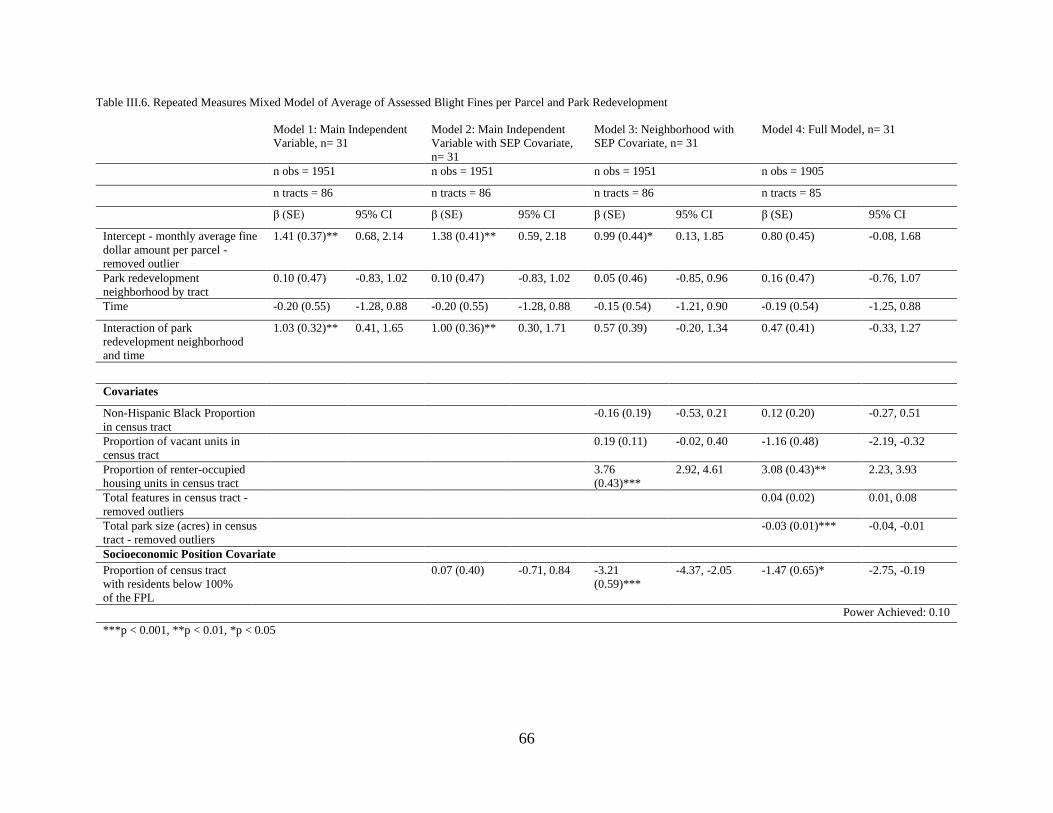
Table III.6. Repeated Measures Mixed Model of Average of Assessed Blight Fines per Parcel
and Park Redevelopment .............................................................................................................. 66
Table III.7. Repeated Measures Mixed Model of All Crime and Park Redevelopment ............... 69
Page 10
ix
Table III.8. Repeated Measures Mixed Model of Violent Crime and Park Redevelopment ........ 73
Table IV.1. Study variables .......................................................................................................... 87
Table IV.2. Summary Statistics .................................................................................................... 91
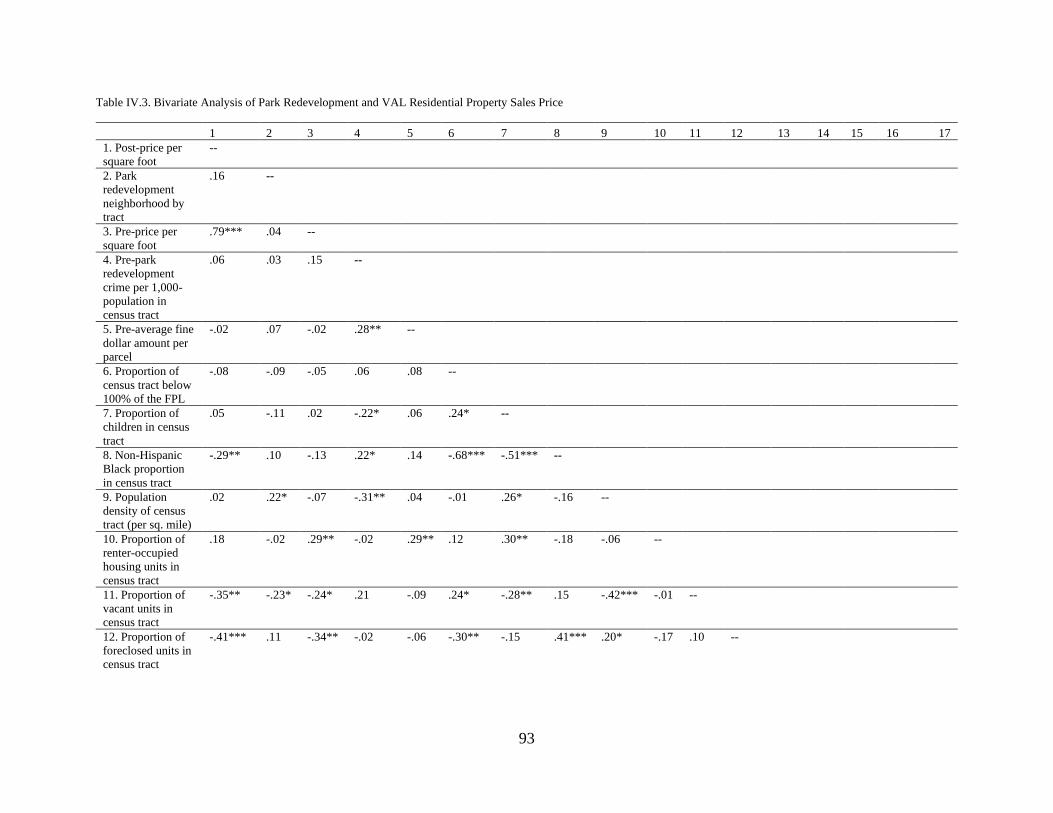
Table IV.3. Bivariate Analysis of Park Redevelopment and VAL Residential Property Sales
Price .............................................................................................................................................. 93
Table IV.4. Regression Models of Valid Arm's Length Residential Property Sales Price and Park
Redeveloped, 2012-2015 .............................................................................................................. 96
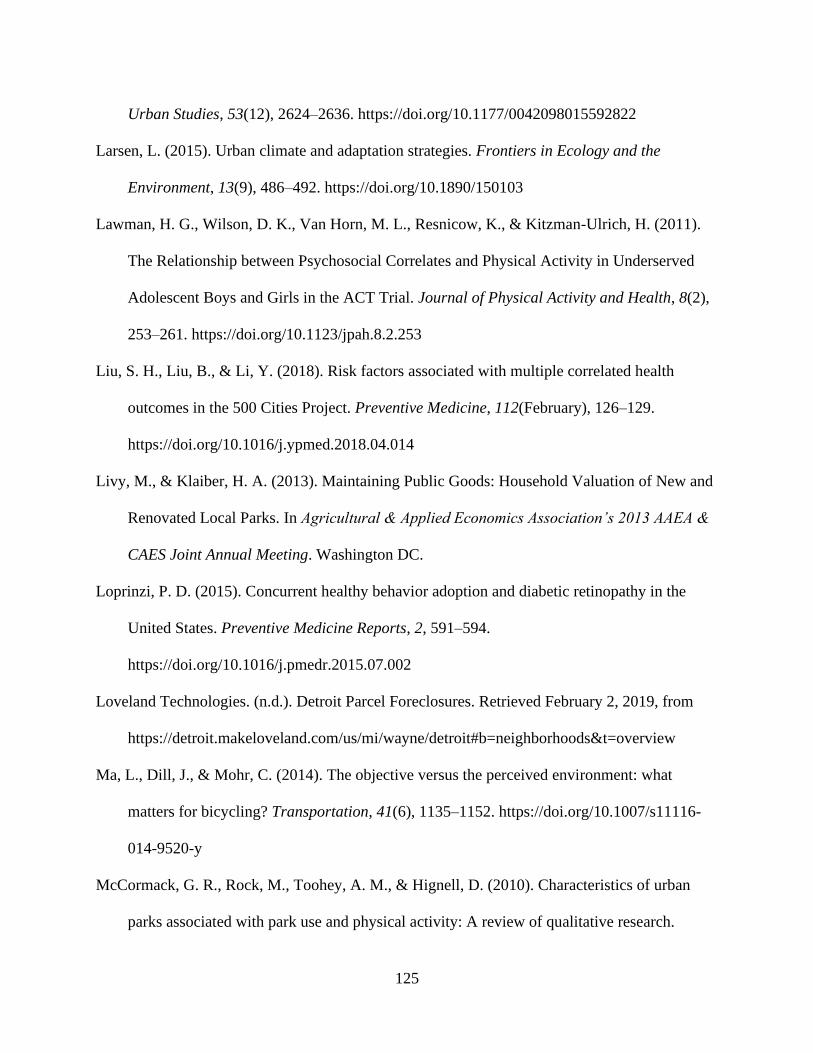
Table A.1. Phase I Parks………………..………………………………………………………138
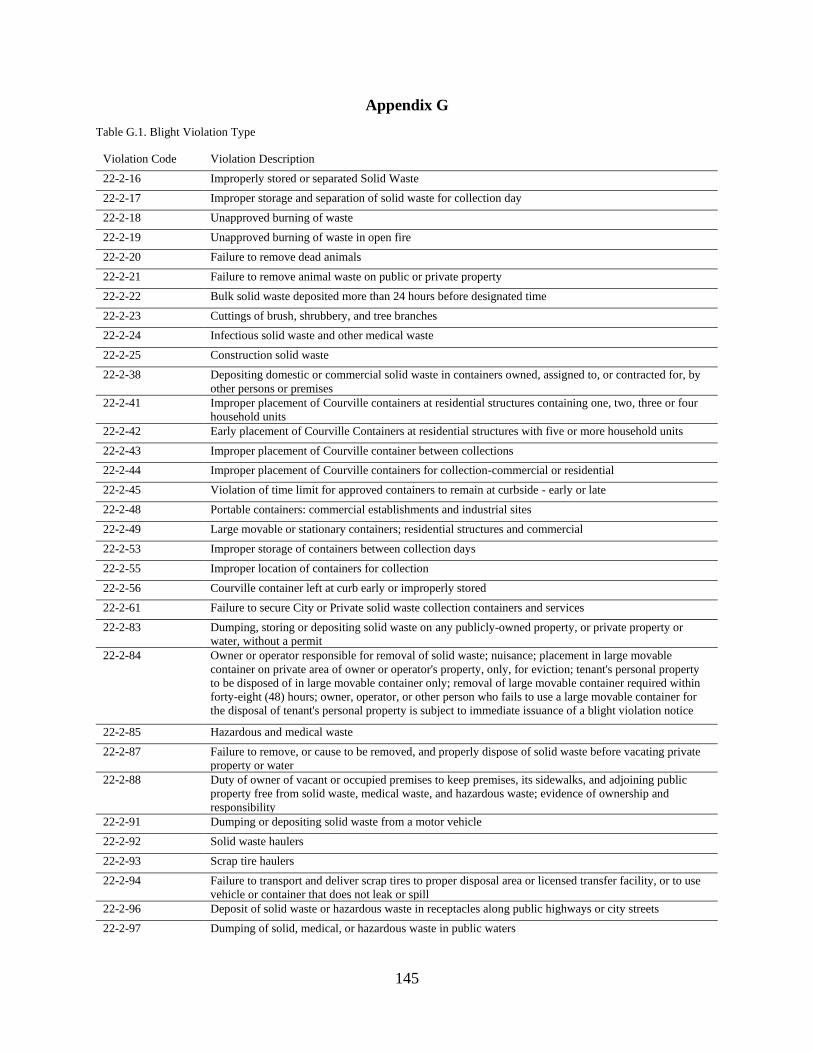
Table G.1. Blight Violation Type………………………………………………………………145
Table H.1. Types of Crime……………………………………………………………………..148
Page 11
x
LIST OF FIGURES
Figure I.1 City of Detroit Park Redevelopment Phases .................................................................. 4
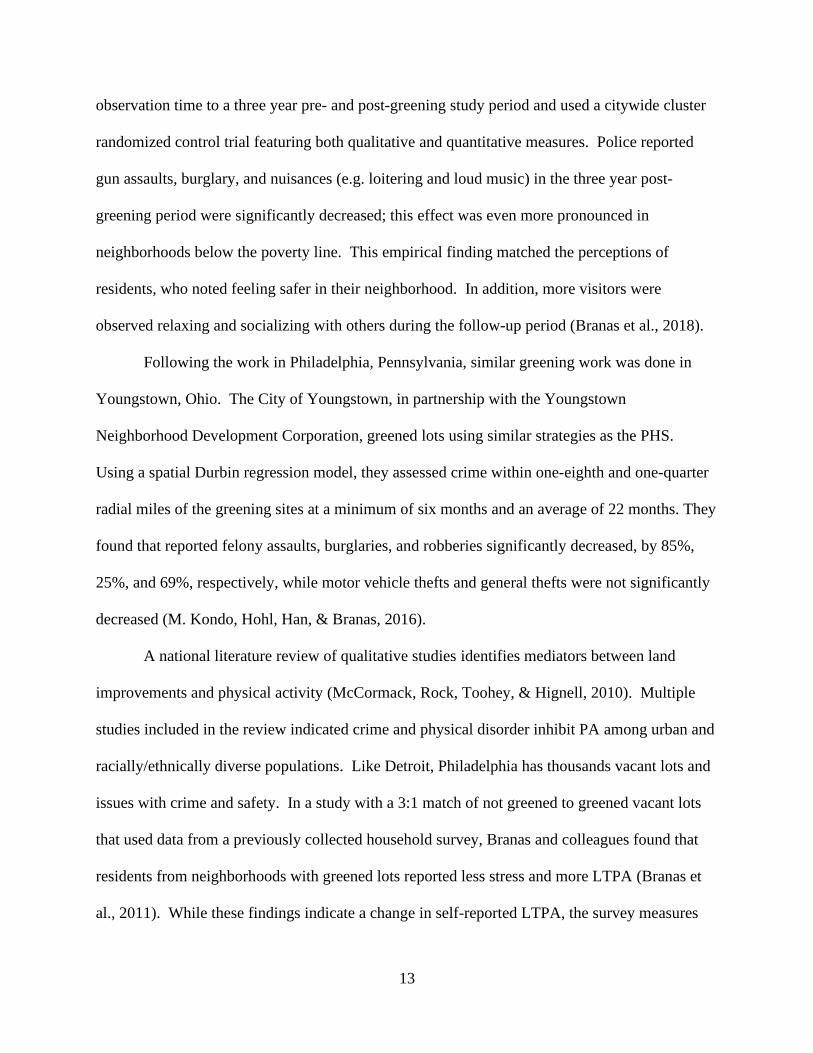
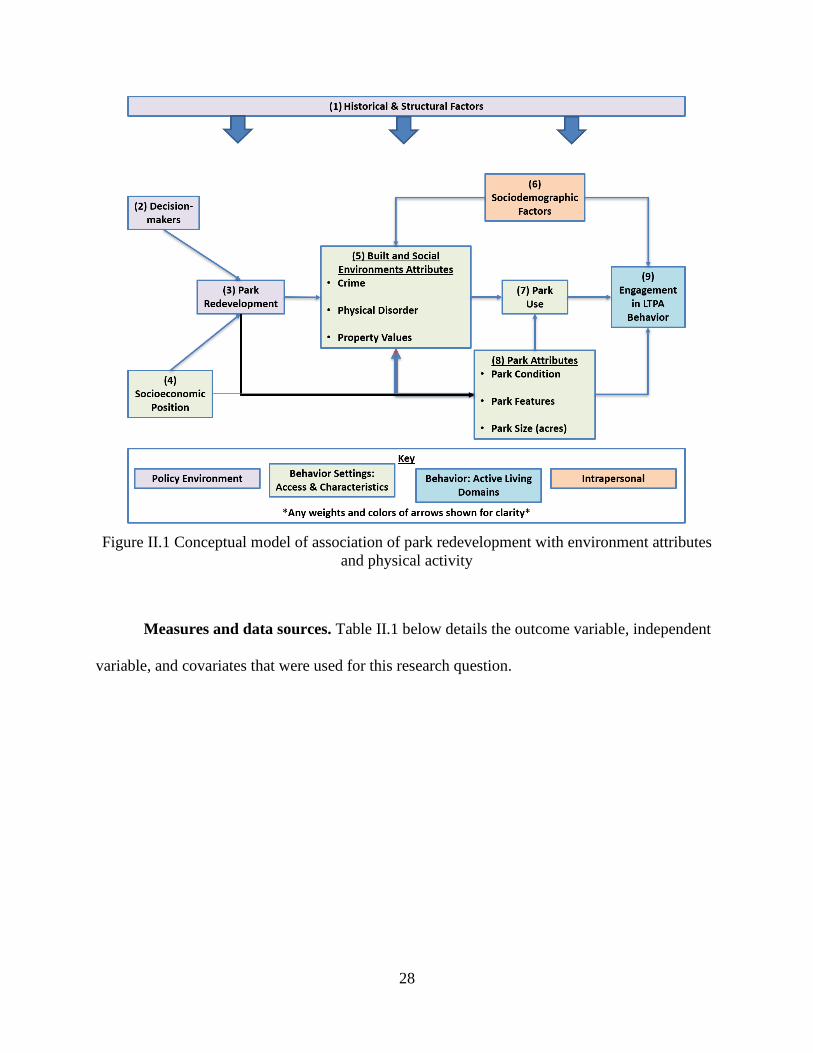
Figure II.1 Conceptual model of association of park redevelopment with environment attributes
and physical activity ..................................................................................................................... 28
Figure II.2 Example of improvement to Wingle Park (2010) ....................................................... 33
Figure II.3 Example of improvement to Muliett Park (2010) ....................................................... 34
Figure II.4 Example of improvement to Littlefield Playfield (2012) ........................................... 35
Figure III.1 Conceptual model of association of park redevelopment with crime and physical
disorder ......................................................................................................................................... 53
Figure III.2 Monthly Repeated Measures Average of Assessed Blight Fines per Parcel and Park
Redevelopment ............................................................................................................................. 67
Figure III.3 Monthly Repeated Measures Mixed Model of Crime per 1,000-population and Park
Redevelopment ............................................................................................................................. 70
Figure III.4 Monthly Repeated Measures Mixed Model of Violent Crime per 1,000-population
and Park Redevelopment .............................................................................................................. 74
Figure IV.1 Conceptual model of association of park redevelopment and property values ......... 83
Figure B.1 City of Detroit Parks……………………………………………………………..…140
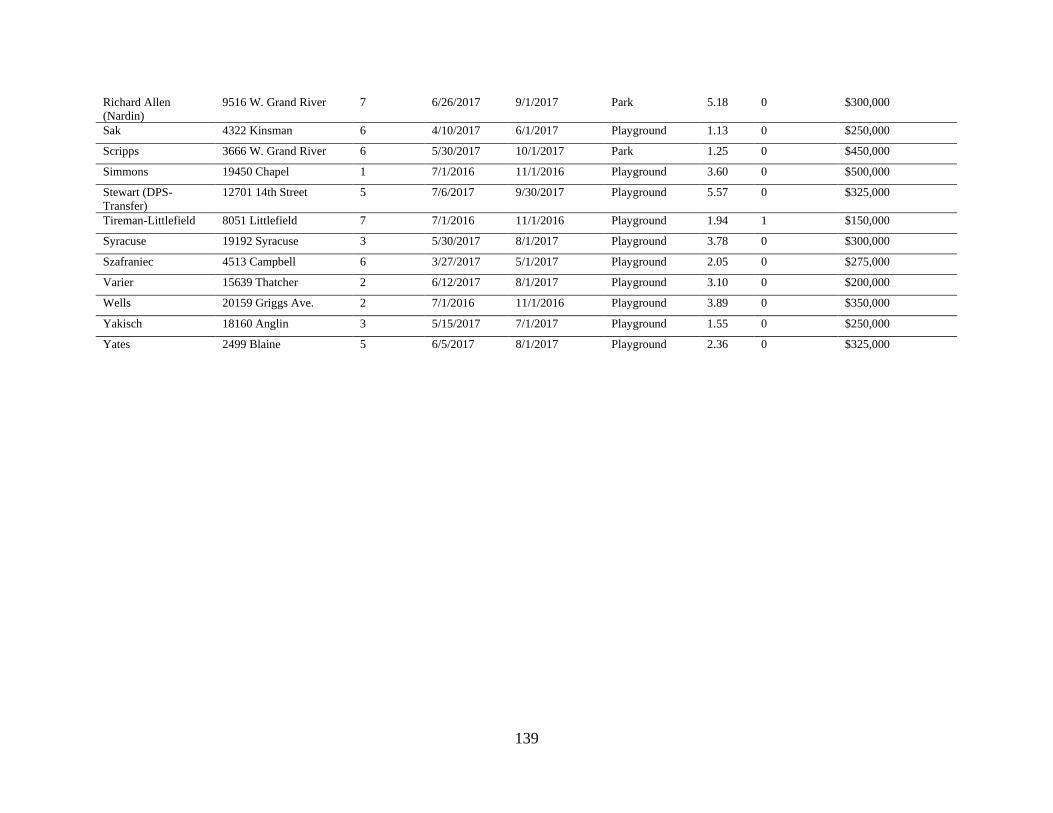
Figure C.1 Paper I Tracts, 2006-2015…………………………………………………………..141
Figure D.1 Paper I Tracts, 2012-2015………………………………….…………………..…..142
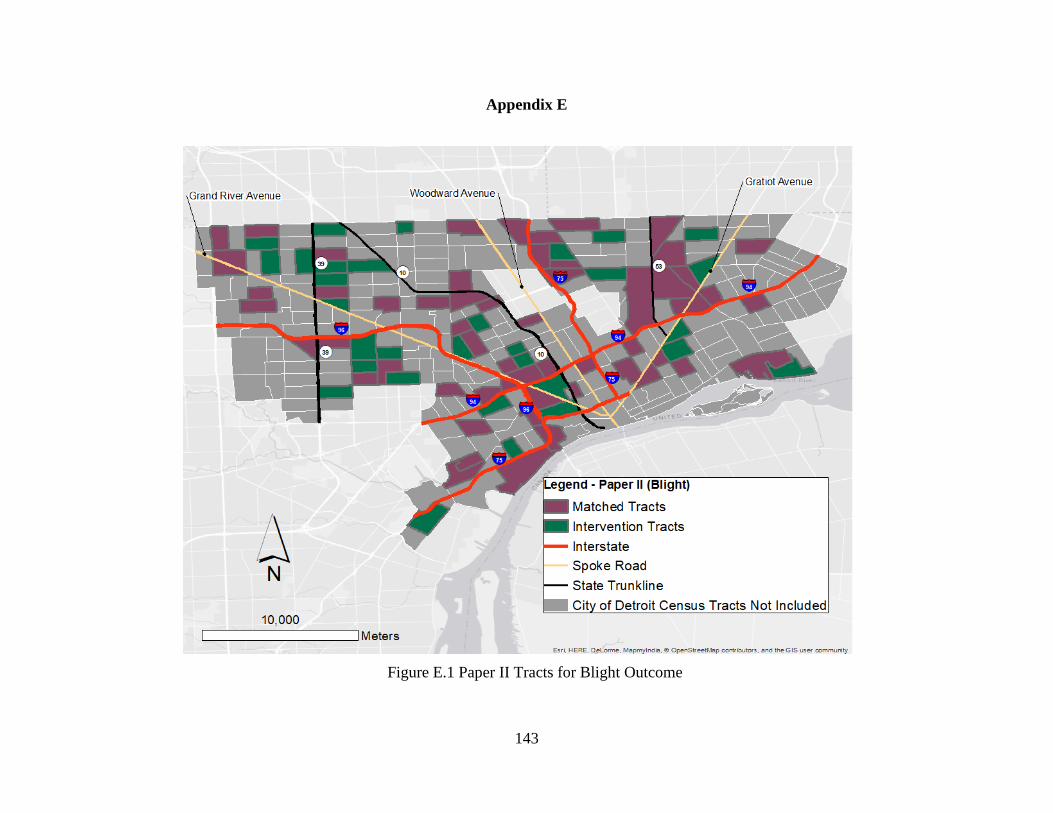
Figure E.1 Paper II Tracts for Blight Outcome…………………………………………………143
Page 12
xi
Figure F.1 Paper II Tracts for Crime Outcome…………………………………………………144
Figure I.1 Paper III Tracts………………………………………………………………………149
Page 13
xii
LIST OF APPENDICES
Appendix A Phase I Parks .......................................................................................................... 138
Appendix B City of Detroit Parks ............................................................................................... 140
Appendix C Paper I Tracts, 2006-2015 ...................................................................................... 141
Appendix D Paper I Tracts, 2012-2015 ...................................................................................... 142
Appendix E Paper II Tracts for Blight Outcome ........................................................................ 143
Appendix F Paper II Tracts for Crime Outcome ........................................................................ 144
Appendix G Blight Violation Type............................................................................................. 145
Appendix H Types of Crime ....................................................................................................... 148
Appendix I Paper III Tracts ........................................................................................................ 149
Page 14
xiii
ABSTRACT
Population-level engagement in adequate leisure-time physical activity (LTPA) can
improve mental and physical health and potentially save billions in health care costs. Despite
these potentially positive outcomes, inadequate LTPA engagement is prevalent in the United
States with urban residents’ living in poverty when compared to residents not living in poverty.
The joint effects of the built and social environments, as they relate to LTPA, is a growing area
of research and advocacy. Related to this, multiple urban neighborhoods across the United
States are redeveloping parks and anticipating various health promotive co-benefits for
neighborhoods. However, assessment of post redevelopment impacts on characteristics such as
crime, physical disorder, and property values are infrequent and a current research gap. This
dissertation uses spatial and quantitative statistical methods to address the question of, “Is park
redevelopment associated with changes in leisure-time physical activity (LTPA), blight crime,
and property values, in neighborhoods with at least one redeveloped park?”
Specifically, this work studies Detroit, Michigan, United States of America which
recently released a redevelopment plan to improve 163 of its 308 parks with 36 done in the first
phase (2016 – 2017). Using the 500 Cities: Local Data for Better Health dataset, this dissertation
will assess differences in LTPA prevalence in census tracts that had parks redeveloped 2006 –
2015 (n= 99) compared to tracts without redeveloped parks (n= 62) (Paper I). The following two
papers compare census tracts (n= 31) with at least one park completed in Phase 1 to matched
Page 15
xiv
census tracts without a redeveloped park, to assess changes to physical disorder (i.e., blight) and
crime (Paper II), and property values (Paper III).
There were several key findings across these studies. The neighborhood percentage of
LTPA was not associated with park redevelopment. While the crime rate per 1,000-population is
increasing in the City of Detroit, neighborhoods with at least one redeveloped park had non-
significant changes in rates of reported crime following park redevelopment compared to
neighborhoods without redeveloped parks. This same research study found that neighborhoods
with at least one redeveloped park had non-significant changes in violent crime rates per 1,000-
population compared to neighborhoods without any redeveloped park. The final question of this
study found that total blight fines per parcel were significantly higher in neighborhoods with at
least one redeveloped park; however, the confounding of total park acres in the census tract made
the association insignificant in the full repeated measures model. Finally, valid arm’s length
(VAL) sales price did not change following park redevelopment. However, the effect of park
redevelopment on VAL differed based on additional greenspace (i.e., greenway) where there was
a higher VAL sales price in neighborhoods with redeveloped parks and additional greenspace.
In addition, neighborhoods with at least one redeveloped park and more than five acres of total
park space reported a lower VAL sales price compared to neighborhoods with more than five
acres of total park space and no redeveloped parks.
These findings more broadly provide urban neighborhoods nationwide with methods to
measure health-related changes in their neighborhoods following park redevelopment and
respond to questions from Detroit residents and decision-makers. Further, decision-makers
should be cautious before making up-front assertions in publicly available published plans that
changes will occur following park redevelopment without first testing the associations.
Page 16
1
Chapter I
Introduction
Scholarly interest in the joint effects of built1 and social2 environments on physical
activity (PA) has increased in recent years (Ding & Gebel, 2012; Ferdinand, Sen, Rahurkar,
Engler, & Menachemi, 2012; Floyd, Taylor, & Whitt-Glover, 2009; Rao, Prasad, Adshead, &
Tissera, 2007; Sallis, Floyd, Rodríguez, & Saelens, 2012; Wen & Kowaleski-Jones, 2012). The
literature suggests that access to parks (Cohen et al., 2010, 2007; Cutts, Darby, Boone, & Brewis,
2009) and characteristics of neighborhood built and social environments (Kelly, Schootman,
Baker, Barnidge, & Lemes, 2007) are inconsistently associated PA. These local environments
may be particularly relevant for leisure-time physical activity (LTPA) levels (Ferdinand et al.,
2012), influencing both opportunities for and the quality of recreational activities.
The benefits of engaging in sufficient PA include preventing and managing health
conditions, such as obesity (Ferdinand et al., 2012; Sallis et al., 2012), cardiovascular disease
(CVD) (Sallis et al., 2012), diabetes (Loprinzi, 2015), and depression/anxiety (Asmundson et al.,
2013; Fetzner & Asmundson, 2015). In the United States, annual health care expenditures
between the years 2006–2011 averaged $1.05 trillion. Of those expenditures, 11.1% were
estimated to be due to insufficient LTPA (Carlson, Fulton, Pratt, Yang, & Adams, 2015).
1 Built environments are man-made surroundings that influence human activity, which include land use (e.g., open
space, green space, connectivity), transportation systems (both motorized and active), buildings, and infrastructure
(e.g., water supply, energy networks) (Environmental Protection Agency, 2016). 2 The social environment includes not only social interactions but factors related to the economy, community, home,
school/daycare, demographics, safety, food security, access to healthcare, discrimination, or violence
(Environmental Protection Agency, 2016).
Page 17
2
Carlson and colleagues (2014) found that annual mean health expenditures increase compared to
individuals with sufficient LTPA by $576 for those who obtain insufficient LTPA and $1,313 for
those who obtain none at all. Given the research indicating links between environmental factors
and LTPA, these statistics underscore the importance of improving environments in ways that
encourage LTPA. This is particularly the case in urban neighborhoods where chronic diseases
and their risk factors are more prevalent (Brawner, Churilla, & Keteyian, 2016; Fitzpatrick, Shi,
Willis, & Niemeier, 2018).
The presence or absence of parks, particularly good quality parks where the features can
be used by the general public safely, are part of the social determinants of health (SDOH). As
defined, the SDOH are “conditions in the environments in which people are born, live, learn,
work, play, worship, and age that affect a wide range of health, functioning, and quality-of-life
outcomes and risks” (Office of Disease Prevention and Health Promotion, 2014). The continual
bombardment of negative environmental conditions, such as crime, blighted properties, and
vacancies in low-income neighborhoods have been linked to chronic stress and post-traumatic
stress disorder (PTSD) (Garvin, Branas, Keddem, Sellman, & Cannuscio, 2013; Phelan & Link,
2015; Williams, Mohammed, Leavell, & Collins, 2010). Specifically, chronic stress and/or
PTSD promote risky behaviors, such as by increasing substance use, and minimize healthy
behaviors, such as by reducing LTPA (Garvin, Branas, et al., 2013).
Studies conducted over several decades have consistently found associations between a
lower socioeconomic position (SEP) and reduced likelihood of meeting activity
recommendations (Ford et al., 1991; Michigan Department of Health and Human Services, 2016;
Yang, Diez-Roux, Auchincloss, Rodríguez, & Brown, 2012). Furthermore, beyond individual
SEP, neighborhood SEP is associated with engagement (Ding & Gebel, 2012; Ferdinand et al.,
Page 18
3
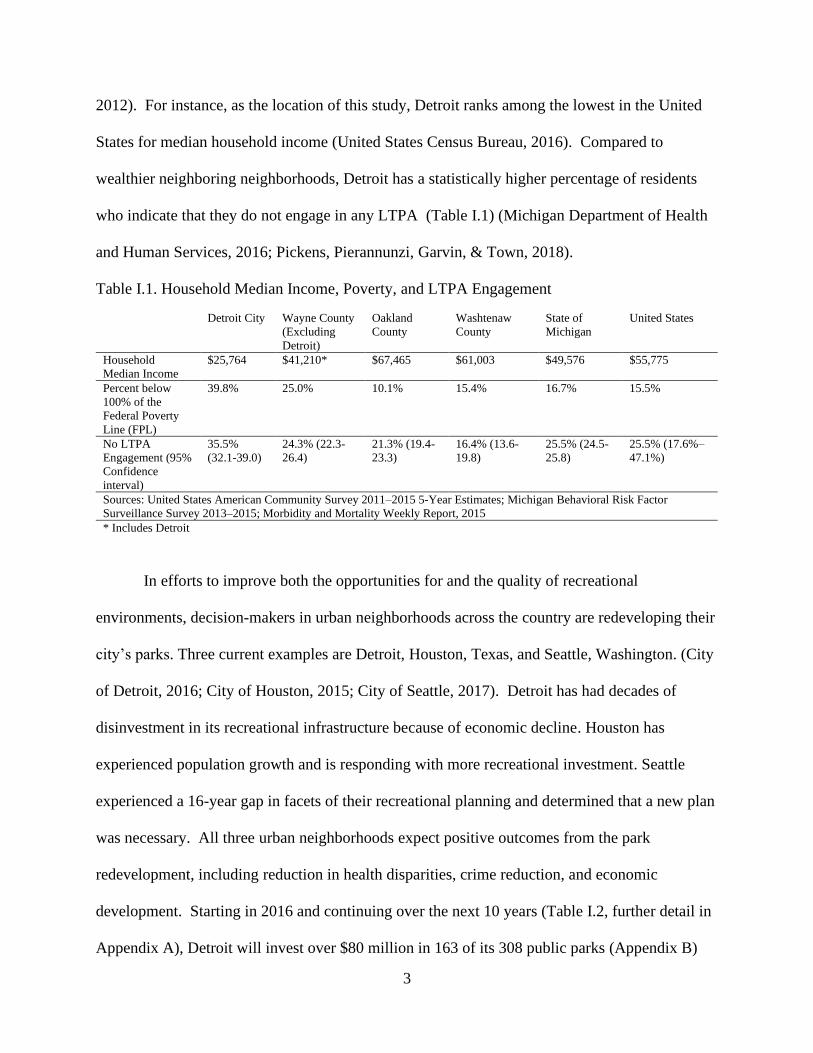
2012). For instance, as the location of this study, Detroit ranks among the lowest in the United
States for median household income (United States Census Bureau, 2016). Compared to
wealthier neighboring neighborhoods, Detroit has a statistically higher percentage of residents
who indicate that they do not engage in any LTPA (Table I.1) (Michigan Department of Health
and Human Services, 2016; Pickens, Pierannunzi, Garvin, & Town, 2018).
Table I.1. Household Median Income, Poverty, and LTPA Engagement
Detroit City Wayne County
(Excluding
Detroit)
Oakland
County
Washtenaw
County
State of
Michigan
United States
Household
Median Income
$25,764 $41,210* $67,465 $61,003 $49,576 $55,775
Percent below
100% of the
Federal Poverty
Line (FPL)
39.8% 25.0% 10.1% 15.4% 16.7% 15.5%
No LTPA
Engagement (95%
Confidence
interval)
35.5%
(32.1-39.0)
24.3% (22.3-
26.4)
21.3% (19.4-
23.3)
16.4% (13.6-
19.8)
25.5% (24.5-
25.8)
25.5% (17.6%–
47.1%)
Sources: United States American Community Survey 2011–2015 5-Year Estimates; Michigan Behavioral Risk Factor
Surveillance Survey 2013–2015; Morbidity and Mortality Weekly Report, 2015
* Includes Detroit
In efforts to improve both the opportunities for and the quality of recreational
environments, decision-makers in urban neighborhoods across the country are redeveloping their
city’s parks. Three current examples are Detroit, Houston, Texas, and Seattle, Washington. (City
of Detroit, 2016; City of Houston, 2015; City of Seattle, 2017). Detroit has had decades of
disinvestment in its recreational infrastructure because of economic decline. Houston has
experienced population growth and is responding with more recreational investment. Seattle
experienced a 16-year gap in facets of their recreational planning and determined that a new plan
was necessary. All three urban neighborhoods expect positive outcomes from the park
redevelopment, including reduction in health disparities, crime reduction, and economic
development. Starting in 2016 and continuing over the next 10 years (Table I.2, further detail in
Appendix A), Detroit will invest over $80 million in 163 of its 308 public parks (Appendix B)
Page 19
4
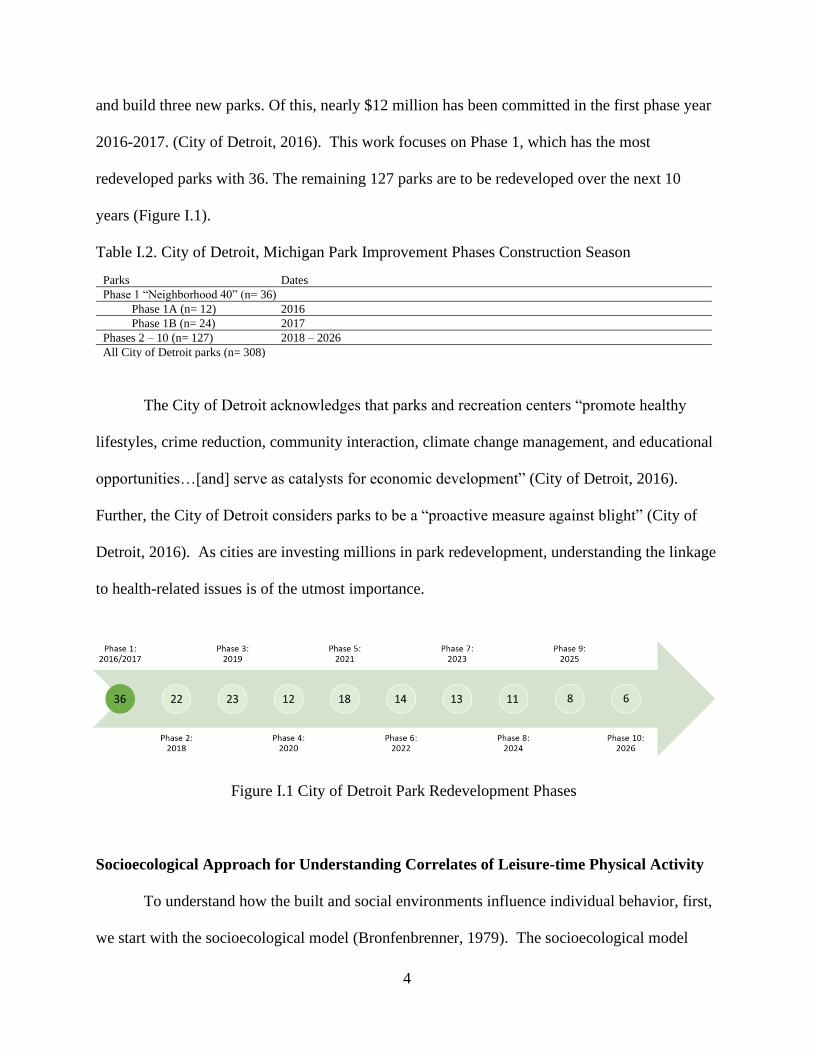
and build three new parks. Of this, nearly $12 million has been committed in the first phase year
2016-2017. (City of Detroit, 2016). This work focuses on Phase 1, which has the most
redeveloped parks with 36. The remaining 127 parks are to be redeveloped over the next 10
years (Figure I.1).
Table I.2. City of Detroit, Michigan Park Improvement Phases Construction Season
The City of Detroit acknowledges that parks and recreation centers “promote healthy
lifestyles, crime reduction, community interaction, climate change management, and educational
opportunities…[and] serve as catalysts for economic development” (City of Detroit, 2016).
Further, the City of Detroit considers parks to be a “proactive measure against blight” (City of
Detroit, 2016). As cities are investing millions in park redevelopment, understanding the linkage
to health-related issues is of the utmost importance.
Socioecological Approach for Understanding Correlates of Leisure-time Physical Activity
To understand how the built and social environments influence individual behavior, first,
we start with the socioecological model (Bronfenbrenner, 1979). The socioecological model
Parks Dates
Phase 1 “Neighborhood 40” (n= 36)
Phase 1A (n= 12) 2016
Phase 1B (n= 24) 2017
Phases 2 – 10 (n= 127) 2018 – 2026
All City of Detroit parks (n= 308)
Figure I.1 City of Detroit Park Redevelopment Phases
Page 20
5
posits that the environment, including policies, behavior settings (e.g. infrastructure),
perceptions, and intrapersonal demographics, influences behaviors. Sallis and colleagues created
an ecological model for active living, which indicates that the active living behaviors (e.g.
LTPA) are an interaction between the individuals and their environment. Individuals and their
environment interact across four ecological model domains: the policy environment (e.g. zoning
codes, recreation investments, and park policies), the access and characteristics of the
neighborhood (e.g. walkability, physical disorder, traffic safety, and recreation environment), the
individual perceived environment (e.g. safety, comfort, and accessibility), and the intrapersonal
characteristics of the individual (e.g. demographics, family situation, psychology) (Sallis et al.,
2006).
Using Sallis and colleagues’ ecological model domains, Figure I.2 demonstrates a
conceptual model indicating the relationship of park redevelopment and attributes of the built
and social environments for promoting urban adult LTPA. The model will form the basis for this
dissertation. Specifically, this dissertation will include research on park redevelopment as an
independent factor and test its relationship to the built and social environment attributes of crime,
physical disorder (i.e., blight), and property values. In addition, this work will measure
engagement in the active living behavior of LTPA as it relates to park redevelopment.
Page 21
6
Establishing & Maintaining Parks in U.S. Cities: Historical and Structural Factors
Racial/ethnic segregation and discrimination have resulted in minority neighborhoods
that face institutional neglect, concentrated poverty, and disinvestment (e.g. absence of grocery
stores, businesses, banks, and recreational facilities such as parks). It is more difficult as a result
to achieve good health in these neighborhoods (Bailey et al., 2017; Sampson, Morenoff, &
Gannon-Rowley, 2002; Sugrue, 1992; Williams et al., 2010). Notably, two specific factors that
have influenced urban parks and LTPA engagement are the federal freeway system expansion
and discriminatory recreation environments. These nationwide factors have directly impacted
urban neighborhoods, including Detroit.
Figure I.2 Conceptual model of park redevelopment, environment attributes, and physical
activity
Page 22
7
The construction of the federal freeway system in the 1950s and 1960s targeted urban
neighborhoods of color and low-income neighborhoods in the U.S. (Brown, Morris, & Taylor,
2009; Rothstein, 2017). The federal freeway system often bulldozed through neighborhoods
with high concentrations of minorities and low-income residents. On January 12, 1967,
President Lyndon B. Johnson created the National Commission on Urban Problems to explore
zoning, housing, building codes, taxation, and development standards. By the time the report
was published, an estimated 1,054,000 housing units had been demolished as part of public
housing development, urban renewal, and the federal freeway (highway) expansion. The
Commission reported:
It has been primarily the poor, the near poor, and lower middle class whose houses have
been demolished. Public housing and most urban renewal sites naturally have been
selected in areas with substandard housing, where by definition few if any of the upper
income groups live and where, according to [Robert] Groberg, at least 57 percent of the
families are poor. The remaining 43 percent are primarily members of the near poor and
lower economic middle class with a sprinkling of those above this level, particularly
among Negroes who find it difficult to find housing elsewhere. The various freeways into
and throughout major cities more often than not avoid the areas where the well-to-do and
affluent live and tend to cut through areas inhabited by families with comparatively low
incomes. This is explained by three factors:
1. to the extent property values are lower in low-income areas, routes through these
areas reduce expenditures for rights-of-way;
2. almost invariably, the more well-to-do families are both more articulate and more
influential in opposing plans for highways through their residential areas; and
Page 23
8
3. some planners actually use highway location as a kind of backdoor slum clearance
device (National Commission on Urban Problems, 1969, p. 82).
The results of new freeway systems not only bulldozed homes, but destroyed other community
assets in their way, including churches, businesses, and parks (Biles, Mohl, & Rose, 2014; Karas,
2015). The assets that remain were often inaccessible due to the sprawling freeway (Gioielli,
2011); thus, they fell into disrepair or their integration within a neighborhood changed (Wineman
et al., 2014). Freeways also affected plans for future development of neighborhood assets such as
parks.
Further, access was affected by discriminatory housing practices, the effects of which
continue to this day despite repeated legal challenges. The Buchanan v. Warley court decision
was the first to challenge discriminatory housing practices in the United States Supreme Court in
1917. The court decision abolished housing discrimination against racial and ethnic minorities
(Supreme Court of the United States, 1917). Later, the Federal Fair Housing Act of 1968 and the
1988 amendment (United States of America, 1968, 1988) reduced discriminatory practices on the
basis of race, color, religion, familial status, and disability. The resulting recreational inequities
from the discriminatory housing practices are still present in urban cities. For instance, in
Baltimore, the Maryland Home Owners Loan Corporation, a New Deal federal agency, worked
together with the Parks and Recreation Board in the 1930s to create separate recreational spaces
in African American and low-income neighborhoods. Their work created smaller, less
resourced, and more congested parks in African American and low-income neighborhoods in
Baltimore, which remain to this day (Anguelovski, 2016; Boone, Buckley, Grove, & Sister,
2009).
Page 24
9
In 1972, the non-profit The Trust for Public Land was founded. It is the most prominent
and well-known organization examining park systems across the United States. Their goal is to
“ensure that every child has easy access [10-minute walk] to a safe place to play in nature” (The
Trust for Public Land, 2017c). To accomplish their goal, they release an annual “ParkScore ®”
that ranks the 100 largest cities in the United States according to their park system for the entire
population regardless of age. Their ranking is based on the acreage, spending, and presence per
capita of four types of facilities: basketball hoops, dog parks, playgrounds, and recreation/senior
centers. It also includes access to the park within a 10-minute walk (approximately 0.5 miles)
using street connectivity networks of the public right-of-way uninterrupted by built environment
barriers such as freeways, train tracks, or water features. The 100 largest cities in the United
States are compared based on where the cities rank given the nationwide median (The Trust for
Public Land, 2017b). Consistently, the City of Detroit ranks near the bottom. In 2015, it ranked
60th (The Trust for Public Land, 2015), and by 2017 the ranking fell to 75th (The Trust for Public
Land, 2017a). The table below (Table I.3) compares Detroit with top-ranked Minneapolis and
the United States as a whole, and includes non-Hispanic Black (NHB) information for
comparison (The Trust for Public Land, 2017c; United States Census Bureau, 2016). The need
for recreational improvements in Detroit is evident.
Table I.3. Trust for Public Land Rankings
Detroit, Michigan Minneapolis, Minnesota United States
TPL Rank, 2015 60 1 --
Non-Hispanic Black (%) 82.7% 18.6% 7.9%
Median Park Size (acres) 2.4 6.8 5.0
Spending per Resident, 2015 $19.00 $224.00 $83.00
Page 25
10
Park Redevelopment
Following the series of “rebellions” (riots) across urban cities in the 1960s, municipalities
were left to try to rebuild (The National Criminal Justice Reference Service, 1968). For decades
these cities experienced the “further deterioration of already inadequate tax bases” (The National
Criminal Justice Reference Service, 1968, p. 10) projected by the Federal Government. The
erosion of the tax base started as early as the 1940s in Detroit when hundreds of thousands of
auto industry jobs disappeared (Sugrue, 2014). Decades later, the City of Detroit – one of the
post-riot urban cities – filed for bankruptcy and has since seen a gradual rebirth. Parks can serve
as starting points to reduce the threats of crime and physical disorder (also referred to as
aesthetics or blight) in post-industrial3 urban neighborhoods. Researchers, private funders and
municipalities assume that park redevelopment is a catalyst for changes in built and social
environments, such as aesthetic improvements, crime reductions, and property sales price
increases (City of Detroit, 2016; City of Houston, 2015; City of Seattle, 2017; Cohen et al.,
2015; Sharkey, 2013). However, there is a dearth of research about the impact of park
redevelopments on built and social environments (Branas, Rubin, & Guo, 2013; Garvin,
Cannuscio, & Branas, 2013).
Municipalities, private donors, and public-private partnerships are spending millions of
dollars on park redevelopment (City of Detroit, 2016; City of Houston, 2015; City of Seattle,
2017; Cohen et al., 2015). Park redevelopment includes replacing existing walkways and adding
new walkways; replacing existing sports facilities and adding new sports facilities; and adding
security phones, lighting, and other features. Urban governments responsible for distributing
general fund dollars during budget decision-making must balance how to allocate funding for
3 Cities where the manufacturing industry is no longer the main source of economic wealth.
Page 26
11
issues such as public safety, which is considered to be essential, over investing in what some
may perceive as non-essentials, such as public recreation (Joassart-Marcelli, 2010). However,
these plans attest that park redevelopment is a method to improve public safety. Further, in some
cases funding is already allocated to recreation. Advocates of park improvements in urban
neighborhoods find that residents may not understand why funding is allocated toward park
redevelopment when poor public safety or other problems are present in their neighborhood (T.
Scott, personal communication, January 31, 2018). The outcomes for neighborhoods after park
redevelopment have rarely been assessed due to the time constraints of city employees (M.
Elliott, personal communication, January 30, 2017) and a need for instruction in replicable
methods. Therefore, with the substantial amount of money from taxes, grants, and government
funding spent on park redevelopment, it is important to assess whether improvements to the built
and social environments are following. This is an area of research that would benefit residents
and city decision-makers alike and help influence future planning efforts.
Park Redevelopment & Environment Attributes
Physical Disorder and Crime. Current research delivers mixed findings as to whether
changes to crime and physical disorder in urban neighborhoods follow park redevelopment.
Research in this area has mostly focused on qualitative studies of the effects of vacant properties
on a neighborhood, not parks (Garvin, Branas, et al., 2013; Garvin, Cannuscio, et al., 2013; Ries
et al., 2008). For example, in qualitative interviews of 29 African American adult residents in
Philadelphia, Pennsylvania, the participants noted that vacant land made their community look
“nasty” and attracted crime. Vacant land tends to take on the appearance of “nature” or a
“prairie.” While this visualization for some seems to be a return to the original natural state, it
signifies the legacy of a lost neighborhood (Nassauer & Raskin, 2014). This natural state of the
Page 27
12
vacant land, as the study participants contend, attracts more physical disorder and crime (Branas
et al., 2013; Galster, 2001) and, with disinvestment and neglect, can also contribute to dropping
property values (Whitaker & Fitzpatrick IV, 2013). Participants in the Garvin study
recommended multiple solutions for the vacant land, including parks for the elderly and
community gardens (Garvin, Branas, et al., 2013).
In the neighborhoods that Garvin and colleagues (2013) surveyed, the non-profit
Pennsylvania Horticulture Society (PHS) performed a greening project which transformed a
previously vacant or dilapidated property. PHS removed debris, added topsoil, planted grass and
trees, and built wooden fences. Following the park-like greening, perceptions of physical
disorder (aesthetics) and reported crime were assessed 3.5 months pre- and post-greening within
a radial half-mile of the greening area and a control area that did not receive the greening
treatment. Following the greening, an unadjusted difference-in-difference analysis within the
radial buffer area found there were non-significant decreases in total reported crime to law
enforcement. However, residents (n = 21) reported feeling safer (p < 0.01) following the
greening in intervention neighborhoods (Garvin, Cannuscio, et al., 2013). The same Garvin
study found that resident survey scores of physical disorder increased in both sites, indicating
that residents perceived that the aesthetics in the neighborhood got worse. Given that the
findings of this study were mixed, the sample size was low, and physical disorder used perceived
measures, future research is warranted. Future studies could expand the length of time for the
assessment, increase the number of intervention locations, and use objective measures of
physical disorder to increase confidence in their conclusions.
Seemingly as a follow-up to the work with PHS, Branas and colleagues (2018) conducted
a study of creating “park-like” settings and studying crime and fear. This study expanded the
Page 28
13
observation time to a three year pre- and post-greening study period and used a citywide cluster
randomized control trial featuring both qualitative and quantitative measures. Police reported
gun assaults, burglary, and nuisances (e.g. loitering and loud music) in the three year post-
greening period were significantly decreased; this effect was even more pronounced in
neighborhoods below the poverty line. This empirical finding matched the perceptions of
residents, who noted feeling safer in their neighborhood. In addition, more visitors were
observed relaxing and socializing with others during the follow-up period (Branas et al., 2018).
Following the work in Philadelphia, Pennsylvania, similar greening work was done in
Youngstown, Ohio. The City of Youngstown, in partnership with the Youngstown
Neighborhood Development Corporation, greened lots using similar strategies as the PHS.
Using a spatial Durbin regression model, they assessed crime within one-eighth and one-quarter
radial miles of the greening sites at a minimum of six months and an average of 22 months. They
found that reported felony assaults, burglaries, and robberies significantly decreased, by 85%,
25%, and 69%, respectively, while motor vehicle thefts and general thefts were not significantly
decreased (M. Kondo, Hohl, Han, & Branas, 2016).
A national literature review of qualitative studies identifies mediators between land
improvements and physical activity (McCormack, Rock, Toohey, & Hignell, 2010). Multiple
studies included in the review indicated crime and physical disorder inhibit PA among urban and
racially/ethnically diverse populations. Like Detroit, Philadelphia has thousands vacant lots and
issues with crime and safety. In a study with a 3:1 match of not greened to greened vacant lots
that used data from a previously collected household survey, Branas and colleagues found that
residents from neighborhoods with greened lots reported less stress and more LTPA (Branas et
al., 2011). While these findings indicate a change in self-reported LTPA, the survey measures
Page 29
14
were designed to assess LTPA in any location, not only in the greened lots, which is a limitation
by not attributing LTPA to the greened lots.
Similarly, Hoehner and colleagues (2005) examined the associations of built and social
environments with LTPA of urban adults in St. Louis, Missouri and Savannah, Georgia at the
census tract level. The cross-sectional study found that residents in neighborhoods free of
garbage, litter, and broken glass had higher odds of reaching recommended LTPA targets. Using
the same dataset, Boehmer and colleagues (2007) examined built and social environments
contributing to inactivity associated with obesity. They found that objectively measured physical
disorder indicators such as graffiti, broken windows, and abandoned cars were directly and
positively associated with environments contributing to obesity.
Researchers in Austin, Texas surveyed newer residents to a New Urbanist-inspired
community in Austin and found that negative perceptions and objective measures of violent and
non-violent crime were associated with decreased recreational walking (Nehme, Oluyomi,
Calise, & Kohl, 2016). The study found the strongest association between recreational walking
and perceived crime. Additionally, a cross-sectional study of residents in Albuquerque, New
Mexico, Chapel Hill/Durham, North Carolina, Columbus, Ohio, and Philadelphia, Pennsylvania
assessed the perceived safety of parks within 0.5 radial miles of residences and the association
between perceived safety and park use (Lapham et al., 2016). The study found that those who
perceived the park as safe or very safe were more likely to visit the park for recreation and/or
social gatherings compared to those who perceived the park to not be very safe or not safe at all.
Further, the reduction of crime also had some financial benefits. Estimates from
Philadelphia indicate that remediation of vacant land returned approximately $26 [sic] to
taxpayers in the first year of the investment from the prevention of violence (Branas et al., 2016).
Page 30
15
Though the authors did not break down these tax savings, this return on investment to taxpayers
may be attributed to fewer responses from emergency personnel responding to crimes.
Crime and blight can be measured using objective and/or perceived indicators. Though
observational and perceived measures had a low agreement, both have been shown to be
associated with LTPA (Orstad, McDonough, Stapleton, Altincekic, & Troped, 2017). An area
for further research is to continue studying the associations between crime and blight and park
redevelopment using objective measures, which are less often employed than perceived
measures.
Property Values. Research indicates there may be additional benefits from parks for the
surrounding neighborhood, such as increasing property values. Open green space increases
property values (Brander & Koetse, 2011) and makes the neighborhood more desirable for other
investment activities (Chrysochoou et al., 2012). Research has repeatedly found that living near
a park is associated with higher property values in urban neighborhoods (Anderson & West,
2006; Brander & Koetse, 2011; Poudyal, Hodges, Tonn, & Cho, 2009). However, in
neighborhoods where the home values are low, the money spent on recreation is lower compared
to neighborhoods with higher home values (Joassart-Marcelli, 2010; Wolch, Byrne, & Newell,
2014). Thus, lower investment based on lower property values may introduce a “chicken and the
egg dilemma,” in which lower park investment and lower property values are cyclical. Lower
property values are inevitable for some cities, such as Detroit. In the decades between the 1960s
and the 2010s, property values fell by 77%. In 2007 at the start of the housing crisis, foreclosures
ran rampant in Detroit in large part due to the disproportionate percentage of subprime loans
(Deng, Seymour, Dewar, & Manning Thomas, 2018; Sugrue, 2014). In contrast, wealthier
neighborhoods which were spared from rampant foreclosures viewed financially supporting
Page 31
16
parks and recreation as a way to increase property values and promote development (Joassart-
Marcelli, 2010).
That perception is corroborated by evidence from other Midwestern cities. Residents in
both Milwaukee, Wisconsin and Minneapolis, Minnesota perceived that remediating brownfields
into residential and park projects would have the greatest impact on property values. Upon
completion, park creation in Milwaukee increased property values of homes within 4,000 radial
feet (1,219.2 meters) by 11.7%. In Minneapolis, the increase was 4.4% for homes within 2,500
radial feet (762 meters). (De Sousa, Wu, & Westphal, 2009). In Milwaukee, the creation of
residential and industrial development did not increase property values as much as the creation of
parks, with the increases being 4.7% and 8.6%, respectively. Similarly, in Minneapolis, both
residential (3.1%) and industrial (3.2%) development did not increase property values as much as
parks (De Sousa et al., 2009). An earlier study of the Twin Cities, Minneapolis and St. Paul,
Minnesota, specifically investigated the effect of open spaces on property values. They found an
increase in home value with increasing proximity to a neighborhood park; however, beyond a
certain park size in acres, there was a drop in the home value. The authors believed that while
living near a park is important, that increased traffic or noise – which is common as the park size
increases – may be a disamenity for residents (Anderson & West, 2006). In contrast, Poudyal
and colleagues investigated the changes in property values for urban parks in Roanoke, Virginia
(Poudyal, Hodges, Tonn, et al., 2009). They found that, when park size increased, houses were
purchased at an average of $160 more than their actual worth.
Finally, although research shows that living near parks increases property values, little is
known about the comparisons of living near newly renovated parks compared to living near a
park that has not recently been redeveloped.
Page 32
17
Detroit Foreclosures. By some estimates, three years after the housing market collapse in
2008, there were on average over 90 foreclosed properties per square mile in Detroit, which is
more than 1/6 of all parcels in Detroit (Cell et al., 2017; Sugrue, 2014). Foreclosures behave like
a contagion on property values. There is evidence indicating that foreclosures between 90–400
meters of a property decrease the sales price anywhere between 1% and 3% for up to five years
after a foreclosure (Biswas, 2012; Harding, Rosenblatt, & Yao, 2009).
Research in Louisville, Kentucky indicates that neighborhood walkability, defined in part
by street connectivity using WalkscoreTM, can reduce foreclosures. Neighborhoods with more
walkability encourage consumers to purchase local goods and create economic resilience. At the
height of the housing crisis (2007–2008), Gilderbloom and colleagues found a negative
association between WalkscoreTM and foreclosure rate (Gilderbloom, Riggs, & Meares, 2015).
Some have suggested that saving homes in “stronger” neighborhoods, based on higher property
values and amenities such as parks, can provide a greater return on investment (Whitaker &
Fitzpatrick IV, 2013).
Detroit and Wayne County received funds from the federal Neighborhood Stabilization
Program (NSP) to mitigate distress in neighborhoods by rehabilitating (i.e. saving homes) or
demolishing properties. Research indicated that the properties in Wayne County were an
“extreme example” of devastation and expanded the NSP to additional census tracts beyond the
originally selected tracts. While other neighborhoods (including Philadelphia, Los Angeles, and
Miami-Dade) included in the study opted to rehabilitate the homes, Wayne County and Detroit
opted to use the funding to primarily conduct demolitions (Nassauer & Raskin, 2014; Schuetz,
Spader, & Cortes, 2016). In an evaluation of the program (2009-2012), Wayne County saw an
increase in vacant properties from 2009–2013, and during the same time period did not see a
Page 33
18
decrease in the number of distressed properties or an increase in valid arm’s length (VAL)4 sales
prices, indicating that the housing market did not recover and vacant homes continued to exist
(Schuetz et al., 2016).
In another examination of the VAL sales prices following the 2007 housing crisis in
Detroit, Deng and colleagues (2018) examined four strong neighborhoods5. Deng and colleagues
found that external funding from the NSP, Habitat for Humanity, the Next Detroit Neighborhood
Initiative, coupled with mobilization efforts by community organizations, resulted in increased
property values in two neighborhoods from 2008–2014 with a third community seeing increases
only in 2009 and 2013. In some cases the improved property values were more than doubled
compared to before the housing crisis (Deng et al., 2018). This finding also held up in a spatial
lag model accounting for the spatial correlation of the data. An expansion of this research for
Detroit could be to include an assessment of more census tracts, including those that are not
considered to be “strong.” As well, the literature supports a positive association between park
improvements and property values, but Detroit has not been studied in that context.
Park Redevelopment & Engagement in Leisure-time Physical Activity
Conventional wisdom leads researchers to believe that when park renovations were
completed, LTPA of the residents would increase. McCormack and colleagues conducted a
systematic review of English-language studies conducted in the United States, Canada, Australia,
Holland (the Netherlands), and the United Kingdom. They found Geographic Information
Systems (GIS) techniques are one of the most common method for examining changes in PA
behavior with built environment changes (including redevelopment of parks and playgrounds)
4 Sales where buyer and seller are both acting in their best interest to get the best deal possible (e.g., a buyer wanting
to spend the least amount, while the seller desires to gain the most amount of money). 5 Census tracts with a proportion of owner-occupied households, property values, and household incomes
comparable or higher than the city of Detroit mean; and active local organizations.
Page 34
19
(McCormack & Shiell, 2011). GIS measures of aesthetics, non-motorized infrastructure (e.g.
greenways), and traffic related concerns are often used to assess PA behavior as it relates to the
built environment. Researchers use multiple methods of defining neighborhoods including local
areas, transportation zones, census districts (e.g. tract or block group), and radial/network
buffers. Using GIS data and with these differences in neighborhood definition, the researchers
noted that measures assessing changes in PA have been inconsistent across studies, with most
studies finding a significant positive association but a few studies finding no association.
For example, in the year following the devastation of Hurricane Katrina (August 29,
2005), researchers compared low-income repopulated African American neighborhoods in New
Orleans where parks were restored to a control group of neighborhoods where parks were not
restored. PA in the neighborhoods was assessed before and after the improvements. The
researchers observed that there was a significant increase in those observed engaging in PA from
baseline to follow-up one year after walking paths were reconstructed (Gustat, Rice, Parker,
Becker, & Farley, 2012). Although the changes were statistically significant, the findings may
not be generalizable to other populations. The extreme devastation and redevelopment of the
neighborhood parks may have created other factors that were not accounted for in this study (e.g.
changes to the physical disorder of the neighborhood during the rebuilding process).
Another study in Los Angeles, California (Cohen et al., 2009) tested whether park
improvements were followed by changes in LTPA. Researchers observed that park use declined
in both the intervention and the control parks. The authors noted that there were other factors
that they failed to account for, such as months-long periods of park closure, that could have
affected the park use. Further, they stated that the decline in park use was “distressing.” This is
Page 35
20
an area where additional research is needed to aid funders and municipalities to improve
neighborhoods and public health.
Cohen and colleagues (2015) in another study of parks in the Bay Area (California) and
in Southern California measured park users’ activity before and after park redevelopment. They
evaluated pre- and post-redevelopment activity in the park using the validated System for
Observing Play and Recreation in Communities (SOPARC) tool (McKenzie & Cohen, 2006)
which measures any park use and translates PA into Metabolic Equivalent of Task (MET)
[energy expended] (Ainsworth et al., 2000). Following the completion of the redevelopment,
they found that park use increased by 233.1% and MET-hours in the park increased by 254.8%,
indicating more PA in renovated parks (Cohen et al., 2015).
When municipalities redevelop parks, they have multiple expectations for changes to the
neighborhood, including decreases in crime and blight, and increases to property values and
LTPA. However, research offers mixed support for these suppositions. Multiple studies
included in this review found objective decreases in crime following redevelopment, which
create neighborhoods more welcoming to LTPA (Branas et al., 2016; Garvin, Cannuscio, et al.,
2013; M. Kondo et al., 2016). These studies did not include behavioral outcomes of LTPA. Two
studies in this review found that greening lots into parks and objective measures of safety were
correlated with LTPA (Branas et al., 2011; Nehme et al., 2016). The studies in the review
overwhelmingly used subjective measures of physical disorder. For example, one study found
that following redevelopment residents perceived the neighborhood around the park to have
more physical disorder (Garvin, Cannuscio, et al., 2013). In addition, studies included in this
review of parks and property values found that parks are related to higher property values
(Anderson & West, 2006; De Sousa et al., 2009; Poudyal, Hodges, & Merrett, 2009) and
Page 36
21
property values are associated with neighborhoods more conducive to PA (W. C. Taylor,
Franzini, Olvera, Carlos Poston, & Lin, 2012).
Study Purpose
The City of Detroit’s park development allows for a natural experiment, in which
changes in the environment can be observed as they are happening. Further, research to date has
not used real time data on, physical disorder fines, crimes, and property values, which is newly
available in Detroit.
Analysis of park redevelopment in the City of Detroit may be a unique case due to its
economic devastation. However, Detroit holds similarities to other urban cities across the
country, including Los Angeles, California, Newark, New Jersey, Atlanta, Georgia, and
Cincinnati, Ohio. These cities each experienced similar “rebellions” during the same time period
(The National Criminal Justice Reference Service, 1968), yet the resulting fallout has been
particularly strong in the case of Detroit. In comparison to other major cities in the Midwest,
including Cincinnati, Cleveland, and Youngstown , Detroit has lost more than 60% of the
population since its peak in 1950 (Dewar & Manning Thomas, 2013) with implications for
disinvestment, blight, and recent efforts towards land reuse.
At the 1950 Census, an estimated 1.8 million residents lived in Detroit. The population
began to decline through the 1950s and 1960s (Eisinger, 2014; Gallagher, 2013; Sugrue, 2014;
United States Census Bureau, n.d.). Prior to the 1967 race riots (Detroit Rebellion), during
1964–1966, an average of 22,000 White residents left Detroit annually. Following the Detroit
Rebellion, the population decline accelerated with an average of 58,000 residents, mostly White,
leaving the City annually between 1967 and 1969 (Safransky, 2014). The continued population
decline has resulted in a smaller tax base, including uncollected taxes, and thus declines in the
Page 37
22
built and social environment (Bentley et al., 2016; Eisinger, 2014; Gallagher, 2013; Sugrue,
2014). These economic challenges have had substantial implications for the social and built
environmental conditions in which Detroit residents currently live. For example, during the 20
years between 1974 and 1994, Detroit closed 113 skating rinks and six swimming pools and
reduced general services responsible for the upkeep of parks. Furthermore, 2,500 police and fire
personnel were laid off, leaving the City vulnerable to crime and blight (Borney & Gallagher,
2013).
As a consequence of these long-term forces exacerbated by the 2008–2009 recession, on
August 18, 2013, Detroit became the largest city in the United States to file for Chapter 9
Bankruptcy and fall under emergency management from the state of Michigan (Eisinger, 2014;
Sugrue, 2014). During the months leading to the bankruptcy, the City attempted to save costs by
proposing cuts to city parks (Eisinger, 2014), among other targets. The City of Detroit
announced approximately six months before bankruptcy that they would close nearly half of the
City-owned parks (Burns, 2013). Private organizations, non-profit organizations, companies,
and residents were able to raise $14 million to keep all the parks open (Eisinger, 2014). In late
2014, Detroit emerged from bankruptcy and has since announced recreational investment to the
sum of over $80 million over 10 years. However, today’s residents still experience an excess of
social and economic adversity compared to their suburban counterparts, which directly impacts
health behaviors and outcomes.
Overarching Research Question
Using the data from the City of Detroit, this dissertation will answer this overarching
question: “Is park redevelopment associated with changes in leisure-time physical activity
(LTPA), blight crime, and property values, in neighborhoods with at least one redeveloped
Page 38
23
park?” The results will inform urban neighborhoods across the country who have experienced
economic/social declines and resurgences to better understand how park redevelopment
influences the built and social environments as well as LTPA. Further, the findings of this work
serve as an important step to changing planning practices on how environments change
following decisions on park redevelopment.
Page 39
24
Chapter II
Paper I
Associations of Neighborhood Park Redevelopment and Leisure-Time Physical Activity
Background and Hypothesis
Insufficient LTPA is a problematic issue across the United States, with more than one in
four Americans reporting engaging in no LTPA (Pickens et al., 2018). Further, multiple studies
show that those living in poverty engage in less LTPA compared to those not living in poverty
(Stalsberg & Pedersen, 2018). There are multiple chronic diseases related to inadequate LTPA,
including obesity, diabetes, hypertension, CVD, cancer, depression, and anxiety (Asmundson et
al., 2013; Ferdinand et al., 2012; Fetzner & Asmundson, 2015; Loprinzi, 2015; Sallis et al.,
2012). These health implications of LTPA underscore the need to understand its environmental
contributors.
Previous research in St. Louis, Missouri and Savannah, Georgia found that residents
reporting more physical disorder in their neighborhood were less likely to engage in LTPA
(Hoehner, Brennan Ramirez, Elliott, Handy, & Brownson, 2005). In another study, Austin,
Texas residents reported that crime in their neighborhood was related to recreational exercise
(Nehme et al., 2016). Finally, Bracy and colleagues found that Baltimore, Maryland residents
reporting more traffic safety (including reduced traffic, speed limits below 30 miles per hour (48
kilometers per hour), and less reckless driving) engaged in an average of 15.7 more LTPA
minutes/week when having one or more recreational facility “nearby” (Bracy et al., 2014).
Page 40
25
Understanding the association of LTPA with park redevelopment across neighborhoods is
beneficial to the goal of decreasing chronic disease and thus reducing health care costs and
improving quality of life. For the United States population, those who have inadequate amounts
of LTPA have higher health care costs compared to those with adequate amounts of LTPA
(Carlson et al., 2015). The difference is in the billions. Finding ways of increasing LTPA can
decrease health care costs and reduce the burden of chronic diseases on individuals.
There are multiple characteristics that relate to sedentary behavior, including poor
facilities. The connection between sedentary behavior and poor facilities suggests that
redeveloped parks could combat some of the sedentary behaviors (Owen et al., 2011). However,
some cities have not developed or redeveloped parks for long stretches of time (City of Detroit,
2016; City of Seattle, 2017), in some cases leaving them uninviting for LTPA. In the case of
Detroit, a low tax base and bankruptcy have made park redevelopment challenging (Safransky,
2014). A potential consequence of aging parks, combined with low socioeconomic resources for
residents, is a reduced likelihood of residents reporting any LTPA (Michigan Department of
Health and Human Services, 2015).
Park redevelopment can bring new features, improved accessibility (e.g. the removal of
gates and the addition of new walkways), and better aesthetics. Cities that are desperate to
improve neighborhoods and health outcomes for residents lean on the common assumption that
redeveloped parks are associated with more LTPA compared to parks that have not been
redeveloped (Cohen, Marsh, Williamson, Golinelli, & McKenzie, 2012). Though this is a
common belief, current research reports mixed associations between park redevelopment and
LTPA. Work in New Orleans following Hurricane Katrina (August 2005) found that increased
PA was observed in parks where walking paths were installed compared to control parks (Gustat
Page 41
26
et al., 2012). However, this finding may not be generalizable to the general population, given the
extreme devastation and redevelopment of the neighborhood. Further, the authors did not report
on possible population changes that may have occurred with residents returning to the
neighborhood. Another study in Los Angeles found that park redevelopment was not followed
with observed and reported increases in LTPA (Cohen et al., 2009). Given these limited
findings, further research is needed to test associations of LTPA with park redevelopment,
especially in Detroit where a large amount of taxpayer and private funding has been spent
redeveloping parks since emerging from the 2013 bankruptcy.
This paper investigates differences in LTPA between neighborhoods, spatially defined by
census tracts, with and without redeveloped parks in Detroit. Using cross-sectional data, this
paper will add to the research findings on whether redeveloped parks are associated with
engaging in any LTPA. We hypothesize that census tract neighborhoods with redeveloped
parks will have a higher mean of engaging in LTPA compared to neighborhoods without park
redevelopment (Figure II.1).
Methods
Geography. Detroit, Michigan (USA) is the largest city in the state of Michigan by both
size and population. The total land area of Detroit is 138.75 square miles (359.36 square
kilometers) (United States Census Bureau, 2017a), which would encompass Boston, Manhattan,
and San Francisco combined. The City is estimated to have 690,000 residents, of which 80% are
non-Hispanic Black (NHB), and 39.8% of households living below the Federal Poverty Line
(FPL) (United States Census Bureau, 2016). Detroit has 382,560 parcels (City of Detroit, 2018).
Census tract boundary data from the 2000 (n = 314) and 2010 Census for all tracts (n =
297) were obtained from the Census Topologically Integrated Geographic Encoding and
Page 42
27
Referencing (TIGER) products (United States Census Bureau, 2017b). There are four
unpopulated tracts due to industry. A shapefile with all roads, residential roads, state roads,
freeways, service drives and other roads in the City of Detroit was obtained from Esri Logistic
Services (Esri, 2018). All spatial data from the City of Detroit was analyzed using ArcGIS
10.4.1 for Desktop (“ArcGIS 10.4.1 for Desktop,” 2015). The spatial data was projected to the
NAD 1983 Michigan meters projection, with the North American 1983 Geographic Coordinate
System.
Sample. This study analyzes LTPA levels in 161 census tracts across the City of Detroit
with parks redeveloped from 2006–2015. 99 of those census tracts have at least one redeveloped
park (parks, n = 115) and 62 census tracts have no redeveloped park (parks, n = 77) (See
Appendices C and D). Some census tracts had multiple parks that were either redeveloped or not
redeveloped, in which case all of the features and acres available to the public were summed.
Page 43
28
Measures and data sources. Table II.1 below details the outcome variable, independent
variable, and covariates that were used for this research question.
Figure II.1 Conceptual model of association of park redevelopment with environment attributes
and physical activity
Page 44
29
Table II.1: Study variables
Variable Type Variable Name/Coded Description Data Source(s)
Dependent
Variable
Leisure-time physical
activity (LTPA) percent of
population in census tract
reporting any LTPA
engagement (continuous)
The 500 Cities Project provided tract-level averages from a
multilevel logistic small area estimate model for the proportion
of residents participating in any LTPA engagement using data
modeled from the 2016 Behavioral Risk Factor Surveillance
System (BRFSS).
Centers for Disease Control and Prevention (Centers for
Disease Control and Prevention, 2017a)
Independent
Variable
Park redevelopment
(dichotomous)
The City of Detroit provided a database indicating park
redevelopment “since 2006” [2006-2015].
City of Detroit (City of Detroit, 2016; J. Fulton, personal
communication, March 15, 2017)
Covariate Park redevelopment age
(dichotomous)
Age of park redevelopment before or after 2012. Google Maps (Google, n.d.)
Covariate Total park acres
(continuous)
Size of the park in acres in the census tract. City of Detroit (City of Detroit, 2016; J. Fulton, personal
communication, March 15, 2017)
Covariate Total park features
(continuous)
Count of the park features (e.g., play area, comfort station) in
the park.
City of Detroit (City of Detroit, 2016; J. Fulton, personal
communication, March 15, 2017)
Covariate Crimes per 1,000-
population (continuous)
A 1,000-population rate of crimes within the census tract of the
redeveloped and not redeveloped neighborhoods from 2011.
City of Detroit Open Data Portal (City of Detroit, 2018)
Covariate Average blight fines per
parcel ($) (continuous)
An average of 2011 fines based on total fines divided by the
number of parcels within the census tract of the redeveloped
and not redeveloped neighborhoods.
City of Detroit Open Data Portal (City of Detroit, 2018)
Covariate Traffic crashes per square
mile (continuous)
A per square mile rate of traffic crashes within the census tract
of the redeveloped and not redeveloped neighborhoods from
2011.
Southeast Michigan Council of Governments (Southeast
Michigan Council of Governments (SEMCOG), 2018a)
Covariate Proportion of vacant
properties (continuous)
Proportion of vacant properties per census tract (B25002). 2000/2010 United States Census data (United States
Census Bureau, 2000, 2010)
Covariate Population density
(continuous)
Total population divided by the tract size in square miles per
census tract (B01003).
2000/2010 United States Census data and Census TIGER
products (United States Census Bureau, 2000, 2010,
2017b)
Page 45
30
Leisure-time Physical Activity. The Behavioral Risk Factor Surveillance System
(BRFSS) is an annual survey on health behaviors, health outcomes, and prevention collected by
the CDC (Centers for Disease Control and Prevention, 2018). In 2015, the Robert Wood
Johnson Foundation and the CDC Foundation started the 500 Cities Project to calculate model-
based small area estimates (SAE) using the 2014 BRFSS data (Centers for Disease Control and
Prevention, 2017a). For estimating census averages of LTPA, the 500 Cities Project used data
from the BFRSS item asking, “During the past month, other than your regular job, did you
participate in any physical activities or exercises such as running, calisthenics, golf, gardening,
or walking for exercise?” To calculate the SAE, researchers used a multilevel regression and
post-stratification (MRP) approach at the census block, block group, and tract level6. The
statistical team used multilevel models, controlling for the BRFSS data of respondent age, sex,
race, and educational attainment, as well as the American Community Survey measure of
residents below 100% of the FPL to estimate findings in census geographic units (Wang et al.,
2017a). This model-based approach for SAE was found to be valid and reliable in subsequent
research studies (Wang, Holt, Xu, & Zhang, 2018; Zhang et al., 2014, 2015). By comparing the
SAE results with results from local survey data from Boston, Massachusetts, Wang and
colleagues found estimates to be reliable and valid, including those for LTPA (Wang et al.,
2017b). Specifically, the correlations between the 500 Cities Project model-based SAE and
direct local data in Boston were moderate-strong for LTPA, and the same moderate-strong
correlation was found in binge drinking, obesity, sleeping less than seven hours, diabetes, high
6 As the CDC explains, “We are not producing estimates for individuals, only census tracts and cities. There is one
estimate per measure for the entire population of each census tract and of each city. The modeling process uses
individual-level responses, and includes county-and state-level contextual effects (fixed and random) to estimate the
probability of developing an outcome at the individual level, given their age, race/ethnicity, sex, education, and
county-level poverty. We will apply these probabilities to the target population (e.g., city or census tract) to derive
the estimated prevalence. So, the Project uses a combination of individual characteristics and responses, as well as
county and state context.” (Centers for Disease Control and Prevention, 2017b)
Page 46
31
blood pressure, and frequent distress (Wang et al., 2017a). Another study validating the SAE
from the 500 Cities Project, conducted in Missouri with direct estimates at the county level for
chronic obstructive pulmonary disease, found the correlation to be significant and positive at
0.69 (Zhang et al., 2015).
Years Since Park Redevelopment. The City of Detroit was unable to provide the dates of
the park renovation due to unavailability and staff constraints (J. Fulton, personal
communication, December 13, 2018). However, in recent years, technological advances (e.g.
Google Maps, Bing Maps) provide detailed street views. In this case, Google Maps street view
was used to assist with dating park redevelopments through the month and year time stamp
indicating when the image was taken (Google, n.d.). Google Maps gathers their photographs by
driving through neighborhoods with a rooftop camera taking several photographs and then
creating a continuous linear image (Google, n.d.). The use of Google images in measuring park
quality is a relatively new and “timely” method (J. S. Wilson & Kelly, 2011). One research
study examined a comparison of Google imagery with direct observation (B. T. Taylor et al.,
2011). The researchers found that there was a strong correlation between the two methods, and
Google imagery took considerably less time. However, Taylor and colleagues reported that
Google imagery was limited and could not detect minute details, such as the presence of dog
litter bags and evidence of well-watered grass. While it appears that researchers have yet to use
Google Maps for retrospective dating of public space redevelopment, this is a relatively simple
assessment and related research supports the method.
Assessing the dates of the park renovation used multiple steps. First, the City of Detroit
provided addresses for all the parks. Following input of each address into Google Maps, the
street view dates were reviewed. To determine the dates of the park renovation, paths, gates, and
Page 47
32
equipment were compared with the dates noted. Given the years of neglect of Detroit parks, in
some cases, the park renovation was easy to notice. However, to further ensure that the same
park was pictured, in addition to the address, landmarks including trees, fire hydrants, and
buildings were included into the determination of renovation (see Figures II.2-II.4). In Figure
II.2, two street trees and a building in the background were used as landmarks, in addition to the
address entered displayed in the lower left corner. In two cases, the Google Map date of
redevelopment was corroborated through news articles (Kozlowski, 2015; WXYZ-TV Detroit,
2014). A dichotomous value was assigned signifying census tracts with newer park
improvements (i.e. 2012–2015). This time range was determined based on research indicating
when residents are enjoy features the most (Livy & Klaiber, 2013) and were supported by local
parks and recreation leaders as an ideal time for park improvements (J. LaFever, C. Summers, &
E. Sheffer personal communication, April 17, 2019).
Page 48
33
Figure II.2 Example of improvement to Wingle Park (2010)
Page 49
34
Figure II.3 Example of improvement to Muliett Park (2010)
Page 50
35
Figure II.4 Example of improvement to Littlefield Playfield (2012)
Page 51
36
Covariates and Environment Attributes. Based on prior research, covariates included
non-Hispanic Black (NHB) proportion, population density per square mile, the proportion of
vacant units in the census tract, the total park acres and park features in the census tract, and, as a
measure of SEP, the proportion of the census tract below 100% of the FPL (Humpel, Owen, &
Leslie, 2002; Joseph & Maddock, 2016b). The SAE of LTPA used NHB proportion and
proportion of the census tract below 100% of the FPL to create its estimates, and so will not be
included in the models (Y. Wang, personal communication, August 21, 2019).
Environment attributes important in the study area (Baldas, 2017; Cell et al., 2017; Smart
Growth America, 2017; Southeast Michigan Council of Governments (SEMCOG), 2018b) and
available from the City of Detroit Data Portal for the analysis of the 2012-2015 park
redevelopment analysis include crime, physical disorder (blight), and traffic crashes.
Data Analysis
Geographic Information Systems Analysis. Data from 2011 sourced from the City of
Detroit Data Portal on blight fines (n = 6,587) with the assessed dollar amount, violent and non-
violent crimes (n = 83,755), and traffic crashes (n = 9,363) were downloaded. Each of these
incidents includes latitude and longitude to map to a corresponding location. Using ArcGIS
10.4.1 for Windows (“ArcGIS 10.4.1 for Desktop,” 2015), these variables were geocoded. Using
the Spatial Join feature, point locations of the previously mentioned variables was joined as a
one-to-many to each census tract. The most common way, based on a previous literature review,
is to use continuous measures of violent and non-violent crimes within the study area when using
comparison groups (Bogar & Beyer, 2015). A continuous measure was used for crime and
traffic crashes; for blight ticket fines, the fine dollar amount for each tract was divided by the
number of assessed tickets during that time period (2011).
Page 52
37
Quantitative Analysis.
Extreme observations. The dependent variable, LTPA, was found to be normally
distributed. However, SAS (“SAS,” 2011) reported extreme observations for the following
variables, which were all evident in skewed histograms: 1) 2011 sum of blight tickets in two
census tracts; 2) 2011 sum tickets dollar amount per ticket in two census tracts; 3) 2011 sum of
crime in one census tract; 4) sum of park features in two census tracts; and 5) park size in acres
in four census tracts. These extreme observations were removed to produce normally distributed
data that were interpretable based on the original measure.
Bivariate Analysis. The bivariate analysis detailed the relationships between all major
study variables as a correlation. For the continuous variables, a Pearson correlation was
completed, and for the categorical variables, a polychoric correlation was completed.
Crosstabulations. The crosstabulations for park redevelopment and LTPA engagement
were calculated. Additional crosstabulations of the park redevelopment and the census tract
falling below 100% of the FPL were calculated.
Linear Regression. Interactions of the population density, proportion of vacancy, total
available acres, and total available features variables were tested.
Associations in census tract level LTPA were measured by a posttest-only nonequivalent
design using a regression model with the proc reg procedure in SAS 9.4 64-bit for Windows
(“SAS,” 2011). Given the outcome variable at the tract level, only the tract-level geography
(adjusted) was analyzed. The subscript c indicated census tract. Two analyses were completed
based on the timing of park improvement: 1) park redevelopment, 2006–2015; and 2) park
redevelopment 2012–2015. Based on data available from the City of Detroit, additional
neighborhood covariates were included in the analysis for parks redeveloped during 2012–2015.
Page 53
38
Given the spatial nature of the data, a Moran’s I in ArcGIS 10.4.1 for Windows will test the
residuals for spatial autocorrelation. The formulas were:
𝐿𝑇𝑃𝐴𝑐 = 𝛽0 + 𝛽1 𝑃𝑎𝑟𝑘 𝑟𝑒𝑑𝑒𝑣𝑙𝑒𝑜𝑝𝑚𝑒𝑛𝑡 𝑐𝑜𝑚𝑚𝑢𝑛𝑖𝑡𝑦, 2006 − 2015𝑐
+ 𝛽2 𝑃𝑜𝑝𝑢𝑙𝑎𝑡𝑖𝑜𝑛 𝐷𝑒𝑛𝑠𝑖𝑡𝑦𝑐 + 𝛽3 𝑉𝑎𝑐𝑎𝑛𝑐𝑦 𝑝𝑟𝑜𝑝𝑜𝑟𝑡𝑖𝑜𝑛𝑐
+ 𝛽4 𝐴𝑣𝑒𝑟𝑎𝑔𝑒 𝑜𝑓 𝑝𝑎𝑟𝑘 𝑓𝑒𝑎𝑡𝑢𝑟𝑒𝑠𝑐 + 𝛽5 𝐴𝑣𝑒𝑟𝑎𝑔𝑒 𝑝𝑎𝑟𝑘 𝑎𝑐𝑟𝑒𝑠𝑐 + 𝜖𝑐
𝐿𝑇𝑃𝐴𝑐 = 𝛽0 + 𝛽1 𝑃𝑎𝑟𝑘 𝑟𝑒𝑑𝑒𝑣𝑙𝑒𝑜𝑝𝑚𝑒𝑛𝑡 𝑐𝑜𝑚𝑚𝑢𝑛𝑖𝑡𝑦, 2012 − 2015𝑐
+ 𝛽2 𝑃𝑜𝑝𝑢𝑙𝑎𝑡𝑖𝑜𝑛 𝐷𝑒𝑛𝑠𝑖𝑡𝑦𝑐 + 𝛽3 𝑉𝑎𝑐𝑎𝑛𝑐𝑦 𝑝𝑟𝑜𝑝𝑜𝑟𝑡𝑖𝑜𝑛𝑐
+ 𝛽4 𝐵𝑙𝑖𝑔ℎ𝑡 𝑓𝑖𝑛𝑒 𝑑𝑜𝑙𝑙𝑎𝑟 𝑎𝑚𝑜𝑢𝑛𝑡 𝑝𝑒𝑟 𝑡𝑖𝑐𝑘𝑒𝑡𝑐
+ 𝛽5 𝑆𝑢𝑚 𝑜𝑓𝑏𝑙𝑖𝑔ℎ𝑡 𝑡𝑖𝑐𝑘𝑒𝑡𝑠 𝑎𝑚𝑜𝑢𝑛𝑡𝑐 + 𝛽6 𝑆𝑢𝑚 𝑜𝑓 𝐶𝑟𝑖𝑚𝑒𝑐
+ 𝛽7 𝑆𝑢𝑚 𝑜𝑓 𝑡𝑟𝑎𝑓𝑓𝑖𝑐 𝑐𝑟𝑎𝑠ℎ𝑒𝑠𝑐 + 𝛽8 𝐴𝑣𝑒𝑟𝑎𝑔𝑒 𝑜𝑓 𝑝𝑎𝑟𝑘 𝑓𝑒𝑎𝑡𝑢𝑟𝑒𝑠𝑐
+ 𝛽9 𝐴𝑣𝑒𝑟𝑎𝑔𝑒 𝑝𝑎𝑟𝑘 𝑎𝑐𝑟𝑒𝑠𝑐 + 𝜖𝑐
Results
Table II.2 includes descriptive statistics for all study variables.
Table II.2. Summary Statistics
Variable N Percentage Mean Median
Standard
Deviation Minimum Maximum
Census tract percent of
population reporting any LTPA
engagement 161 63.75 63.10 5.60 52.50 85.10
Tracts with park
redevelopment, 2006-2015
161 61.49%
Tracts with park redevelopment
after 2012
148 20.27%
Population density (per sq.
mile) in census tract, 2000
Census 161 7199.00 2882.00 7407.00 266.20 17088.00
Proportion of vacant units in
census tract, 2000 Census 161 0.10 0.06 0.09 0.01 0.30
Population density (per sq.
mile) in census tract, 2010
Census 161 5403.10 5510.10 2335.22 650.10 14871.40
Proportion of vacant units in
census tract, 2010 Census 161 0.25 0.23 0.11 0.05 0.68
Average fine dollar amount per
parcel, 2011
161
$23.36 $139.64 $8.24 $0.31 $1,737.00
Crimes per 1,000-population,
2011
143
167.11 114.24 143.33 60.61 980.49
Page 54
39
2011 Traffic crashes per square
mile
161
118.17 57.43 117.04 8.95 281.74
Total features in census tract -
removed outliers 159 8.20 6.00 8.64 1.00 46.00
Total acres of parks in census
tract - Removed Outliers 157 8.01 3.24 13.15 0.11 84.99
Bivariate Analysis. Correlations of the study variables with LTPA found that park
redevelopment from 2006–2015 and park redevelopment from 2012–2015 were both positively
correlated with LTPA (see Tables II.3-II.4). The correlations were statistically significant (p <
0.05), but moderately correlated at 0.17 and 0.19, respectively. Additionally, in the 2010 census
measure, vacancy was correlated with LTPA at -0.35 (p < 0.001). Finally, parks redeveloped
from 2006–2015 were positively and significantly correlated with park size in acres, 0.24 (p <
0.01).
Table II.3. Bivariate Analysis of Park Redevelopment 2006-2015 and Leisure-Time Physical Activity
Variable 1 2 3 4 5 6
1. Census tract percent of population reporting
any LTPA engagement 1
2. Park redevelopment (Y/N), 2006-2015 0.17* 1.00 3. Population density (per sq. mile) in census
tract, 2000 Census 0.00 -0.01 1.00 4. Proportion of vacant units in census tract,
2000 Census -0.04 0.05 -0.21** 1.00 5. Total features in census tract - Removed
Outliers -0.09 0.21 0.09 -0.04 1.00 6. Total acres of parks in census tract -
Removed Outliers -0.06 0.24** 0.03 -0.01 0.45*** 1.00
***p < 0.001, **p < 0.01, *p < 0.05
Page 55
40
Table II.4. Bivariate Analysis of Park Redevelopment 2012-2015 and Leisure-Time Physical Activity
Variable 1 2 3 4 5 6 7 8 9
1. Census tract percent of population reporting any
LTPA engagement 1.00 2. Park redevelopment (Y/N), 2012-2015 0.19* 1.00 3. Population density (per sq. mile) in census tract,
2010 Census 0.16* 0.14 1.00 4. Proportion of vacant units in census tract, 2010
Census -0.35*** -0.13 -0.21* 1.00 5. Average fine dollar amount per parcel, 2011 -
removed outliers 0.03 -0.05 0.20* -0.04 1.00 6. Crimes per 1,000-population, 2011 - removed
outlier 0.11 0.09 0.23*** -0.11 -0.02 1.00 7. Traffic Crashes per square mile, 2011 -0.05 -0.01 -0.33*** 0.03 -0.21* 0.32*** 1.00 8. Total features in census tract - removed outliers -0.09 -0.02 0.15 -0.13* 0.04 0.12 -0.05 1.00 9. Total acres of parks in census tract - removed
outliers -0.06 0.13 -0.05 -0.13* -0.02 0.08 -0.01 0.45*** 1.00
***p < 0.001, **p < 0.01, *p < 0.05
Page 56
41
Park redevelopment, 2006–2015. The association of LTPA in neighborhoods with and
without park redevelopment from 2006–2015 was assessed in five linear regression models
building on related variables from previous models, with three models presented below (Table
II.5). The Moran’s I was significant (p < 0.05), but the spatial models did not yield results
changing the significance or β of the variables, indicating that the linear regression models
(Table II.5) were sufficient for reporting. Interactions of the population density, proportion of
vacancy, total available acres, and total available amenities variables were tested, and no
interactions were found to be significant.
Model 1 presents the main independent variable model of park redevelopment 2006–
2015. The census tract percentage of LTPA on average significantly (p < 0.05) increased (β =
1.92, CI = 1.15, 3.70, R2 = 0.03) in redeveloped compared to non-redeveloped park
neighborhoods. However, as shown in Model 2, when including the 2000 American Community
Survey population density and proportion of vacant units variables, the main independent
variable was no longer significant (β = 0.85, CI = -0.90, 2.61, R2 = 0.14). Finally, in Model 3,
with the inclusion of the variables from Model 2 and the total features and total park acreage in
the census tract, the main independent variable remained insignificant (β = 1.51, CI = -0.27,
3.30, R2 = 0.17). It is important to note that the study was underpowered with a power achieved
of 0.60.
Finally, crosstabulations were done to examine the findings further. Neighborhoods with
a lower proportion of residents living below 100% of the poverty line had 71.76% of their
neighborhoods not receiving park redevelopment (p = 0.005).
Page 57
42
Table II.5. Regression Models of Leisure-Time Physical Activity and Park Redeveloped, 2006-2015
Model 1: Main Independent Variable, n=
161
Model 2: Neighborhood Model, n= 161 Model 3: Full Model, n= 155
β (SE) 95% CI β (SE) 95% CI β (SE) 95% CI
Intercept - Census tract percent
of population reporting any
LTPA engagement
62.57 (0.70)*** 61.18, 63.96 69.77 (6.92)*** 56.11, 83.43 67.21 (7.27)*** 5.85, 81.57
Park redeveloped census tract
(Y/N), 2006-2015
1.92 (0.90)* 1.15, 3.70 0.85 (0.89) -0.90, 2.61 1.51 (0.90) -0.27, 3.30
Covariates
Log-transformed population
density (per sq. mile) in census
tract, 2000 Census
-0.87 (1.74) -4.31, 2.56 -0.06 (1.84) -3.69, 3.57
Proportion of vacant units in
census tract, 2000 Census
-31.25 (7.13)*** -45.33, -17.18 -31.25 (7.13)*** -45.34, -17.16
Total features in census tract -
removed outliers
-0.10 (0.06) -0.21, 0.02
Total acres of parks in census
tract - removed outliers
-0.02 (0.04) -0.10, 0.05
R2 0.03 0.14 0.17
Adjusted R2 0.02 0.12 0.14
Power Achieved: 0.60
***p < 0.001, **p < 0.01, *p < 0.05
Page 58
43
Park redevelopment, 2012-2015. More recent park redevelopment was tested for the
association of LTPA in neighborhoods with and without park redevelopment. This was done
using eight linear regression models building on related variables from previous models, with
four models presented below (Table II.6); unlike the previous examination of park
redevelopment from 2006–2015, this study achieved a power of 0.72. The Moran’s I of residuals
was insignificant indicating that the linear regression models (Table II.6) were sufficient for
reporting. Interactions of the population density, proportion of vacancy, total available acres,
and total available features variables were tested, and no interactions were found to be
significant.
Model 1 presents the main independent variable model of park redevelopment from
2012–2015. The census tract percentage of LTPA was positively and significantly (p < 0.05)
associated with park redevelopment from 2012-2015 (β = 2.53, CI = -0.24, 3.90, R2 = 0.17).
However, in Model 2, the main independent variable was no longer significant (β = 1.77, CI = -
0.26, 3.80, R2 = 0.30) when including the 2010 American Community Survey log-transformed
population density, proportion of vacant units, along with 2011 blight fine per parcel, and the
2011 crimes per 1,000-population variables. Similarly, in Model 3, when including the 2010
American Community Survey log-transformed population density, proportion of vacant units,
along with 2011 blight fine per parcel, and the 2011 crimes per 1,000-population, and the 2011
traffic crashes per square mile, the independent variable was not significant (β = 1.67, CI = -0.36,
3.72, R2 = 0.31). Finally, in Model 4 with all covariates (identical to Model 3 plus park variables
of total features and size in acres) the main independent variable remained insignificant (β =
1.91, CI = -0.29, 3.61, R2 = 0.37).
Page 59
44
Finally, crosstabulations were done. Neighborhoods with a higher proportion of residents
living below 100% of the poverty line had 86.84% of their neighborhoods not having park
redevelopment in their communities (p = 0.03).
Page 60
45
Table II.6. Regression Models of Leisure-Time Physical Activity and Park Redeveloped, 2012-2015
Model 1: Main Independent
Variable, n= 148
Model 2: Neighborhood, Blight,
and Crime Covariates n= 147
Model 3: Traffic Crashes with
Neighborhood, Blight, and
Crime Covariates, n= 147
Model 4: Full Model, n= 144
β (SE) 95% CI
β (SE) 95% CI β (SE) 95% CI
Intercept - Census tract percent of
population reporting any LTPA
engagement
63.12 (0.50)*** 62.13, 64.11 52.27 (8.12)*** 36.20, 68.34 52.87 (8.12)*** 36.79, 68.95 51.43 (8.07)*** 35.45,
67.41
Park redeveloped census tract
(Y/N), 2012-2015
2.53 (1.11)* 0.34, 4.73 1.77 (1.03) -0.26, 3.80 1.67 (1.03) -0.36, 3.72 1.91 (1.02) -0.29, 3.61
Covariates
Log-transformed population
density (per sq. mile) in census
tract, 2010 Census
3.11 (2.07) -0.98, 7.20 3.15 (2.07) -0.93, 7.24 3.93 (2.06) -0.16, 8.02
Proportion of vacant units in
census tract, 2010 Census
-14.21 (4.16)** -22.45, -5.97 -13.83 (4.17)** -22.09, -5.57 -16.72 (4.10)*** -24.84, -
8.60
Average fine dollar amount per
parcel, 2011
-0.001 (0.003) -0.01, 0.01 -0.001 (0.003) -0.01, 0.01 -0.001 (0.003) -0.01, 0.01
Crime rate per 1,000-population,
2011
0.02 (0.004)*** 0.01, 0.03 0.02 (0.004)*** 0.01, 0.03 0.003
(0.002)***
-0.001, 0.02
Traffic crashes per square mile,
2011
-0.01 (0.01) -0.02, 0.01 -0.01 (0.01) -0.02, 0.01
Total features in census tract -
removed outliers
-0.11 (0.06) -0.22, 0.001
Total acres of parks in census
tract - removed outliers
-0.01 (0.04) -0.08, 0.09
R2 0.03 0.30 0.31 0.37
Adjusted R2 0.03 0.27 0.27 0.32
Power Achieved: 0.72
***p < 0.001, **p < 0.01, *p < 0.05
Page 61
46
Discussion
The findings of this study show that park redevelopment was associated with LTPA in
bivariate analysis, but once we included other covariates in the linear regression models, there
was no significant association.
Park Redevelopment and LTPA. This research found that there is some evidence in
the Pearson correlation and the linear regression model that park redevelopment is associated
with model-based reporting of LTPA, with higher levels of LTPA being seen in neighborhoods
that also have redeveloped parks. Further, this work indicated in the unadjusted model that park
redevelopment was positively associated with census tract averages of reporting any LTPA in
models that examined both park redevelopment from 2006–2015 and more recent park
redevelopment from 2012–2015. However, since the correlation describes the relationship
between two variables without the inclusion of the other aspects in the lived environment (e.g.,
vacancy) it has a limited and unrealistic interpretation.
The 500 Cities Project dataset is rather new and has been used in few studies (Browning
& Rigolon, 2018; Fitzpatrick et al., 2018; Liu, Liu, & Li, 2018). However, one study using the
500 Cities Project to study greenspace and obesity found that cities with more greenspace also
had less model-based measured obesity and better mental health (Browning & Rigolon, 2018).
The researchers found no relationship between greenspace and obesity or mental health, which is
similar to our null findings. (Browning & Rigolon, 2018).
The inconsistent relationship between LTPA and greenspace (e.g. parks) is seen in other
research on interventions. In one study that used a validated park observation tool, System for
Observing Play and Recreation in Communities (SOPARC), coupled with resident surveys,
researchers found a decline in LTPA in intervention parks following park redevelopment.
Page 62
47
However, the researchers also found a decline in areas with parks that did not receive any
redevelopment (Cohen et al., 2009). In another study conducted in New Orleans following
rebuilding from Hurricane Katrina, intervention parks with newly constructed paths had more
use for vigorous exercise as evaluated by the System for Observing Play and Leisure Activity in
Youth (SOPLAY) tool. The same increase was identified in self-reported household surveys
(Gustat et al., 2012). Similar to our work, these studies in Los Angeles and New Orleans
indicate that more research is needed to investigate the relationship of parks and LTPA. Future
research could include qualitative information to more fully understand the inconsistent
relationship, such as what types of redevelopment residents relate to their LTPA (e.g., walking
paths, comfort stations, other features).
Poverty and Park Redevelopment. Findings indicated that the City of Detroit is
redeveloping parks in neighborhoods that have less poverty. A recent news article reported that
low-income Detroiters feel as if they are being pushed out of their neighborhoods by
redevelopment that is both more frequently occurring in wealthier neighborhoods or occurring in
neighborhoods that will result in low-income residents moving (Finley, 2014). There has not
been systematic research to back up this anecdotal finding in Detroit; however previous work in
Los Angeles found that funding for recreation redevelopment disproportionately went to
wealthier neighborhoods (Wolch, Wilson, & Fehrenbach, 2005). More recent research in Denver
found a similar finding as Wolch and colleagues (2005), that the city center where wealthier
residents, and presumably healthier residents, live received more funding for park redevelopment
(Rigolon & Németh, 2018). These inequitable redevelopment strategies could exacerbate health
disparities due in part to a lack of development in the community that encourages healthy
behaviors.
Page 63
48
Limitations
This study is not without its limitations. Most notably, the LTPA variable used is a
model-based measure at the tract level derived from a selection of Census and BRFSS variables.
The LTPA data were not directly collected from residents living in census tracts included in our
study; further, since the redevelopment did not change the Census or BRFSS sociodemographics,
it could not detect changes in the neighborhood. In addition, the 500 Cities Project team made
data widely available at the tract level; however, due to work constraints, the CDC was unable to
provide data at the census block or block group levels (J. Holt, personal communication,
December 12, 2018). In addition, it was recommended to use the dataset to detect associations
and cannot assess associations related to an intervention of park redevelopment. Therefore, the
null findings may be attributed to the flaws in the available dataset for this study – which to my
knowledge is the only citywide dataset available – and thus demonstrates the need for adequate
citywide datasets with direct measures.
Further, the LTPA variable only provides dichotomous information, precluding detecting
whether a person is achieving any LTPA even if it is insufficient. Even those who engage in
inadequate LTPA pay approximately $700 less per year than those engaging in no LTPA
(Carlson et al., 2015). An improved LTPA measure for this study would be a two-pronged
measure, including direct observation at the parks pre- and post-park redevelopment, along with
the use of an accelerometer or another technology to measure LTPA in the population. While
validation and reliability of the LTPA estimate used are promising, this self-reported data is not
as strong as other LTPA measurements, including accelerometers (Lawman, Wilson, Van Horn,
Resnicow, & Kitzman-Ulrich, 2011) and pedometers (Schulz et al., 2014). The timing of this
dissertation prevented these observations and objective measures from being employed.
Page 64
49
Given that this study cannot detect causal differences based on park redevelopment and
uses a model-based measure, the findings must not be over-interpreted. However, the findings
indicate that there is some evidence that LTPA and park redevelopment are positively correlated.
More research is needed examining the relationship between park redevelopment and LTPA in
urban neighborhoods.
Blight fines, crimes, and traffic crashes were sourced from the City of Detroit Data
Portal, which introduces another possible limitation on this study. The Data Portal was opened
for public access in April 2018 based on a commitment from the Detroit City Charter (City of
Detroit, 2012, 2018). Given the date of the opening, it is probable that some data from 2011
have data entry errors from the backlog of entries and may not be as reliable as more recent data.
Some data entry errors were noticed during the geocoding process for the data, as some of the
latitude and longitude coordinates far outside of Detroit were incorrectly coded. However, the
City of Detroit is one of a few but growing number of cities with open data portals. Thus, having
access to this pinpoint data is a unique opportunity for enriching the data analysis.
Despite these limitations, this research adds to the literature by increasing the
understanding of associations of LTPA in urban areas with and without redeveloped parks.
Further, it uses geographic information systems and regression, an understudied coupling of
methods. Finally, though this research does not support the hypothesis that there are associations
of park redevelopment’s effects on LTPA, it demonstrates the need for further research.
Page 65
50
Chapter III
Paper II
Changes in Reported Crime and Blight Fines Following Park Redevelopment
Background and Hypothesis
Researchers, private funders and municipalities assume that park redevelopment is a
catalyst for built and social environmental changes, particularly reductions in physical disorder
(i.e. blight) and crimes (City of Detroit, 2016; City of Houston, 2015; City of Seattle, 2017;
Cohen et al., 2015; Sharkey, 2013). When the City of Detroit released its 2016 plan to redevelop
163 of its 308 parks, the City claimed that parks and recreation “promote healthy lifestyles,
crime reduction, community interaction, climate change management, and educational
opportunities…[and] serve as catalysts for economic development” (City of Detroit, 2016).
Furthermore, city planners consider parks to be a “proactive measure against blight” (City of
Detroit, 2016). These arguments for park redevelopment are similar to those made by planners
from other urban cities with similar redevelopment activities (City of Houston, 2015; City of
Seattle, 2017).
Though the City government and developers have high hopes for park redevelopment, the
literature does not consistently support that the redevelopment is a catalyst for reductions in
crime and blight. The literature has focused more on vacant properties than parks, which have
distinct differences. For example, remediated vacant properties can be transformed for multiple
uses, including parks, whereas park redevelopment signifies transforming an existing park into a
Page 66
51
higher quality park. A study in Philadelphia, Pennsylvania conducted qualitative interviews of 29
African American adult residents in that city. Participants shared their perception that vacant
land made the neighborhood look “nasty” and attracted crime. These residents noted that they
wanted the vacant land to be turned into other land uses, namely parks (Garvin, Branas, et al.,
2013) as a way to decrease the “nasty” areas and crime. As a follow-up to this work, the non-
profit Pennsylvania Horticulture Society (PHS) performed a greening project in neighborhoods.
The PHS transformed previously vacant or dilapidated properties by removing debris, adding
topsoil, planting grass and trees, and building a wooden fence (essentially creating pocket parks).
Following the greening, objective reports of physical disorder (aesthetics) and subjectively
perceptions of crime were assessed (3.5 months pre- and post-greening) within a radial half-mile
of the greening area as well as in a control area that did not receive the greening treatment.
Following the greening, residents did not perceive changes in physical disorder. There were
non-significant decreases in total reported crime to law enforcement. However, residents (n = 21)
reported feeling safer (p < 0.01) following the greening in intervention neighborhoods (Garvin,
Cannuscio, et al., 2013).
Following this work, Branas and colleagues (2018) conducted a cluster randomized
control trial, also in Philadelphia, to study if creating “park-like” settings reduces crime and fear
in residents. The study used both qualitative and quantitative measures. Police reported gun
assaults, burglary, and nuisances (e.g. loitering and loud music) significantly decreased in the
three-year post-period. This effect was even more pronounced in neighborhoods with residents
below the federal poverty line (FPL). This objective finding matched the perceptions of
residents, who noted feeling safer in their community. In addition, more visitors were observed
relaxing and socializing with others in the follow-up period (Branas et al., 2018).
Page 67
52
In another urban city, Youngstown, Ohio, in partnership with the Youngstown
Neighborhood Development Corporation, greened lots using efforts similar to those of the PHS.
They examined within one-eighth and one-quarter radial miles of the greening sites at a
minimum of six months and an average of 22 months. They found that felony assaults,
burglaries, and robberies statistically significantly decreased, by 85%, 25%, and 69%,
respectively, while motor vehicle thefts and general thefts were not significantly decreased (M.
Kondo et al., 2016).
While researchers have studied whether the transformation of vacant properties to parks
changes blight and crime, there is room to research whether redevelopment of existing parks
reduces blight and crime. The parks are already known as recreational sites. The redevelopment
of a communal gathering area differs slightly from adding a park space. Further, as noted,
neighborhoods eager to transform parks have rarely studied the effects afterwards.
This paper will assess changes to physical disorder (i.e. blight violations) and crime in
census tract neighborhoods following park redevelopment compared to neighborhoods without
redeveloped parks. We hypothesize that, compared to neighborhoods without redeveloped parks,
the neighborhoods with redeveloped parks will have decreases in blight fines decreases in both
reported violent and reported non-violent crimes (Figure III.1). This work will add to the
literature by demonstrating the uses for objective measures to evaluate crime and blight by way
of spatial and statistical methods. Specifically, there is a dearth in the literature of work using
natural experiments of large-scale park improvements in a major urban city.
Page 68
53
Methods
Geography. Detroit, Michigan (USA) is the largest city in the state of Michigan by both
size and population. The total land area of Detroit is 138.75 square miles (359.36 square
kilometers) (United States Census Bureau, 2017a), which would encompass Boston, Manhattan,
and San Francisco combined. The City is estimated to have 690,000 residents (80% non-
Hispanic Black (NHB)) and 39.8% of households living below the FPL (United States Census
Bureau, 2016). Detroit has 382,560 parcels, of which 104 have no listed ownership as of
October 3, 2018 (City of Detroit, 2018).
Census tract boundary data from the 2010 Census for all tracts (n = 297) were obtained
from the Census Topologically Integrated Geographic Encoding and Referencing (TIGER)
Figure III.1 Conceptual model of association of park redevelopment with crime and physical
disorder
Page 69
54
products (United States Census Bureau, 2017b). There are four unpopulated tracts due to
industry. A shapefile with all roads, residential roads, state roads, freeways, service drives and
other roads in the City of Detroit was obtained from Esri Logistic Services (Esri, 2018). All
spatial data from the City of Detroit was analyzed using ArcGIS 10.4.1 for Desktop (“ArcGIS
10.4.1 for Desktop,” 2015). The spatial data was projected to the NAD 1983 Michigan meters
projection, with the North American 1983 Geographic Coordinate System.
Matching comparison neighborhoods. Multiple steps were used to obtain the
comparison group for the park redevelopment neighborhoods. There are multiple ways to define
a neighborhood in spatial terms. As noted in the literature on crime and blight, one common way
to spatially define a neighborhood is a radial buffer (McCormack & Shiell, 2011), but there is no
universal standard in research to spatially define a neighborhood (Poudyal, Hodges, Tonn, et al.,
2009). This research paper uses census tracts to spatially define neighborhood boundaries. A
census tract is a reasonable approximation of a neighborhood due to the boundaries following
“visible and identifiable features,” such as a highway or river (United States Census Bureau
(Commerce), 2018; United States Census Bureau, 2019). With this criterion set by the United
States government, setting the neighborhood definition as the census tract is an appropriate
approximation and has been used in similar research (Boggess & Maskaly, 2014; Soltero,
Hernandez, O’Connor, & Lee, 2015).
The census tract location for each park in the City of Detroit was provided by the
Division of Parks and Recreation (City of Detroit, 2016; J. Fulton, personal communication,
March 15, 2017). Using the Join Feature in ArcGIS 10.4.1 for Desktop, parks (n = 308) were
joined with median household income for the census tracts where they are located using the
2011–2015 five-year United States ACS estimates (United States Census Bureau, 2017c). The
Page 70
55
2015 point source data from the City of Detroit Data Portal (City of Detroit, 2018) was joined as
a one-to-many with each census tract using the Spatial Join Feature in ArcGIS 10.4.1 for
Desktop. This data was then exported to a Microsoft SQL Server 12.0.5207.0 for (“SQL
12.0.5207.0,” 2014) and averaged for each eligible census tract. The resulting table was
exported to MedCalc 15.2 for Windows (“MedCalc,” 2018). Census tracts with at least one
Phase 1 park were matched with census tracts with at least one park, except tracts with any Phase
2 parks, using the case-control procedure in MedCalc. The matching was restricted to variables
that were no more than one standard deviation away from the mean of the Phase 1 park census
tracts (Stuart, 2010; Stuart & Rubin, 2008). The matching hierarchy was: 1) averages of the
dependent variable from 2015, 2) available acres of parks of the tract, and 3) median household
income (Cohen et al., 2009).
Sample. This study analyzes the average monthly blight fines per ticket in 31 census
tracts having at least one redeveloped park (parks, n = 36) and 56 census tracts having no
redeveloped park (parks, n = 89) (See Appendix E). This study also analyzes monthly number of
crimes in 31 census tracts having at least one redeveloped park (parks, n = 36) and 51 census
tracts having no redeveloped park (parks, n = 87) (See Appendix F). Some census tracts had
multiple parks that were either redeveloped or not redeveloped, in which case the features and
acres available to the public were summed.
Measures and data sources. The following table (Table III.1) details the dependent
variables, independent variable, and covariates that will be used in this research question.
Page 71
56
Table III.1. Study variables
Variable Type Variable Name/Coded Description Data Source(s)
Dependent
variable
Non-violent and
violent crimes per
1,000-Population
(continuous)
A 1,000-population rate of monthly violent and non-violent crimes
within the study areas (census tract) for each redeveloped (n = 31) and
matched (n = 51) neighborhoods during the 12-months before, the
intervention period, and the 12-months following redevelopment will
be the outcome variable of interest.
City of Detroit Open Data Portal (City of Detroit, 2018)
Dependent
variable
Violent crimes per
1,000-Population
(continuous)
A 1,000-population rate of monthly violent crimes (crimes per day)
within the study areas (census tract) for each redeveloped (n = 31) and
matched (n = 51) neighborhoods during the 12-months before, the
intervention period, and the 12-months following redevelopment will
be the outcome variable of interest.
City of Detroit Open Data Portal (City of Detroit, 2018)
Dependent
variable
Blight fines per parcel
($) (continuous)
Total monthly fine dollar amounts (USD) will be averaged by the
number of parcels within the study areas (census tract) for each
redeveloped (n = 31) and matched (n = 56) neighborhoods during the
12-months before, the intervention period, and the 12-months
following redevelopment will be the outcome variable of interest.
City of Detroit Open Data Portal (City of Detroit, 2018),
Independent
variable
Park redevelopment
neighborhood
(dichotomous)
The City of Detroit provided a database indicating park
redevelopment based on the phase. To create the neighborhood, the
census tract where the park(s) is/are located will serve as a
neighborhood.
City of Detroit (City of Detroit, 2016; J. Fulton, personal
communication, March 15, 2017)
Independent
variable
Time (discrete) Time incident occurred based on the park redevelopment timeline. City of Detroit Open Data Portal (City of Detroit, 2018)
Covariate Total park acres
(continuous)
Total size of the park acres available in the census tract. City of Detroit (City of Detroit, 2016; J. Fulton, personal
communication, March 15, 2017)
Covariate Total park features
(continuous)
Count of the park features (e.g., play area, comfort station) available
in the census tract.
City of Detroit (City of Detroit, 2016; J. Fulton, personal
communication, March 15, 2017)
Covariate Proportion less than 18
years of age
(continuous)
Proportion of children per census tract (B01001). 2011-2015 American Community Survey (ACS) estimates
(United States Census Bureau, 2016)
Covariate Proportion of female
(continuous)
Proportion of self-reported sex of residents per census tract (B01001). 2011-2015 American Community Survey (ACS) estimates
(United States Census Bureau, 2016)
Covariate Proportion in poverty
(continuous)
The proportion of residents falling below the FPL in the past 12
months based on the ratio of income to poverty level per census tract
(C17002).
2011-2015 American Community Survey (ACS) estimates
(United States Census Bureau, 2016)
Covariate Proportion of renter-
occupied households
(continuous)
The proportion of renter-occupied housing tenure per census tract
(B25003).
2011-2015 American Community Survey (ACS) estimates
(United States Census Bureau, 2016)
Covariate Proportion of single-
parent household
(continuous)
The proportion of single-headed households based on labor force
participation per census tract (B23008).
2011-2015 American Community Survey (ACS) estimates
(United States Census Bureau, 2016)
Covariate Proportion of NHB
residents (continuous)
Proportion of self-reported NHB residents per census tract (B02001). 2011-2015 American Community Survey (ACS) estimates
(United States Census Bureau, 2016)
Page 72
57
Covariate Proportion of vacant
properties
(continuous)
Proportion of vacant property per census tract (B25002). 2011-2015 American Community Survey (ACS) estimates
(United States Census Bureau, 2016)
Page 73
58
Blight Fines. Outward-facing physical disorder (blight) violations in Detroit from June
29, 2010–October 2, 2018 were downloaded from the City of Detroit Data Portal (City of
Detroit, 2018) (n = 122,500). The dataset included the latitude/longitude for ticketed violations,
the day of the offense ticket, parcel number, violation description (See Appendix G), code
(exterior and interior violations), and fine amount (showing severity of the violation and offense
reoccurrence). For some codes, the Excel system transformed them into dates; for example, code
9-1-18 was transformed into September 1, 2018. This is automatic formatting in Microsoft
Excel, and these cases were not excluded. Blight identification and ticketing is done by City of
Detroit employees using a manual and extensive training. Of those, 305 were excluded – 1 with
no address, parcel, or latitude and longitude, 5 with negative addresses, and the remaining with
no street listed on the address. Once geocoded to the census tracts in the study and restricted to
the study period, the number of total violations dropped (n = 21,820). Ticketed blight fines have
different amounts, including $1.00 for excessive weeds/grass, $100.00 for excessive rodent
infestation, $500.00 for failing to evacuate a dangerous building, and $1,000 and more for
dumping. The dollar amount for repeat offenders increases from the initial fine. To standardize
the measure for neighborhoods, the total blight violation was averaged by the number of parcels
in the census tracts. A map of the 86 census tracts included in the study is available in Appendix
E.
Reported Crime. Violent and non-violent crime data in Detroit from June 29, 2010–
October 2, 2018 (n = 476,331) were downloaded from the City of Detroit Data Portal (City of
Detroit, 2018). Of these 726 crimes were excluded due to lack of location information. The
datasets included the latitude/longitude and day and time of the crime. In some specific
examples, it appears that 262 were assigned the same latitude and longitude coordinates outside
Page 74
59
of Detroit (32.02636, -127.91418) in error, and thus were excluded. There are multiple ways to
assess crimes, based on limited repeated measures research this study uses a per 1,000-
population rate (Bogar & Beyer, 2015; Han, Cohen, Derose, Li, & Williamson, 2018). Once
geographically assigned in the neighborhoods for the designated time period, crimes dropped (n
= 40,423).
Prior to December 6, 2016, the City of Detroit classified some crimes using the Federal
Bureau of Investigation (FBI) Uniform Crime Reporting categories (Federal Bureau of
Investigation, n.d.) (see Appendix H). Following December 6, 2016, all crimes were classified
using the FBI Uniform Crime Reporting categories. This earlier crime set was included despite
it containing additional crimes such as escape of fugitives, immigration issues such as “illegal
entry,” and civil issues (e.g. walking away from mental health institutions) prior to December 6,
2016. For the full list, see Appendix H. During October 2015–September 2016, the City did not
classify any crimes as “violent” based on the FBI Uniform Crime Reporting classifications. This
difference was seen citywide, thus affecting all intervention and match park neighborhoods. A
map of the 82 census tracts in this study is available in Appendix F.
Covariates. Based on literature reviews of the associations of crime and physical disorder
with park redevelopment, the following variables were included as covariates: census tract
proportions of NHB, proportion of tracts below 100% of the FPL, proportion of renter
occupancy, proportion of children under 18 years of age, and proportion of vacant units (Bogar
& Beyer, 2015; Branas et al., 2016, 2013; Price, 2016; Raleigh & Galster, 2015). Noted in the
crime literature, but not in the physical disorder literature, are the covariates of proportion of
females and the proportion of single-parent households (Branas et al., 2013; Raleigh & Galster,
Page 75
60
2015), which were included here. Additional covariates included total park acres and total park
features.
Data Analysis.
Extreme observations. The dependent variables, monthly average blight fine per parcel
($) and the monthly crime per 1,000-population, were not normally distributed. SAS reported
extreme observations for the following variables, which were all evident in skewed histograms:
1) five instances of the monthly average of blight per parcel; 2) 25 park features and size
measures; 3) eight monthly averages of crime per 1,000-population, and 4) 21 instances of the
proportion of single parents. These extreme observations were removed to produce normally
distributed data and maintain the original units of the measure.
Bivariate Analysis. The bivariate analysis detailed the relationships between all major
study variables as a correlation. For the continuous variables, a Pearson correlation was
completed. A polychoric correlation was used for the categorical variables. The correlation of
the outcome variables for the five years (60 months) prior to the pre-redevelopment period was
measured to account for changes in the crime and physical disorder that were external to the
analysis, such as a new police chief or change in blight enforcement.
Repeated Measures Linear Mixed Model Regression. Interactions of the proportion of
poverty, population density, proportion of vacancy, and proportion of children were tested.
Using a between-group design with repeated measures of pre- and post-redevelopment
data, this study assesses the changes before and after park redevelopment with a repeated
measures linear mixed regression model using the proc mixed procedure in SAS 9.4 64-bit for
Windows (“SAS,” 2011). Separate analyses were completed for 1) the monthly average of the
Page 76
61
blight fine dollar amount per parcel, 2) monthly violent and non-violent crime per 1,000-
population, and 3) monthly violent crime per 1,000-population.
The subscript i was used to indicate time and c to indicate census tract. Given the spatial
nature of the data, a Moran’s I in ArcGIS 10.4.1 for Windows will test the residuals for spatial
autocorrelation. The formulas were:
𝐵𝑙𝑖𝑔ℎ𝑡 𝐹𝑖𝑛𝑒 𝐷𝑜𝑙𝑙𝑎𝑟 𝐴𝑚𝑜𝑢𝑛𝑡 𝑝𝑒𝑟 𝑃𝑎𝑟𝑐𝑒𝑙𝑐𝑗
= 𝛽0 + 𝛽1 𝑃𝑎𝑟𝑘 𝑟𝑒𝑑𝑒𝑣𝑙𝑒𝑜𝑝𝑚𝑒𝑛𝑡 𝑐𝑜𝑚𝑚𝑢𝑛𝑖𝑡𝑦𝑖 + 𝛽2 𝑇𝑖𝑚𝑒𝑖
+ 𝛽3 𝑃𝑎𝑟𝑘 𝑟𝑒𝑑𝑒𝑣𝑙𝑜𝑝𝑚𝑒𝑛𝑡 𝑐𝑜𝑚𝑚𝑢𝑛𝑖𝑡𝑦𝑖 ∗ 𝑇𝑖𝑚𝑒𝑖 + 𝛽4 𝑁𝐻𝐵 𝑝𝑟𝑜𝑝𝑜𝑟𝑡𝑖𝑜𝑛𝑐
+ 𝛽5 𝑉𝑎𝑐𝑎𝑛𝑐𝑦 𝑝𝑟𝑜𝑝𝑜𝑟𝑡𝑖𝑜𝑛𝑐 + 𝛽6 𝑅𝑒𝑛𝑡𝑒𝑟 𝑜𝑐𝑐𝑢𝑝𝑖𝑒𝑑 ℎ𝑜𝑢𝑠𝑒ℎ𝑜𝑙𝑑𝑠 𝑝𝑟𝑜𝑝𝑜𝑟𝑡𝑖𝑜𝑛𝑐
+ 𝛽7 𝐶ℎ𝑖𝑙𝑑𝑟𝑒𝑛 𝑝𝑟𝑜𝑝𝑜𝑟𝑡𝑖𝑜𝑛𝑐 + 𝛽8 𝑃𝑎𝑟𝑘 𝑓𝑒𝑎𝑡𝑢𝑟𝑒𝑠𝑐 + 𝛽9 𝑃𝑎𝑟𝑘 𝑎𝑐𝑟𝑒𝑠𝑐
+ 𝛽10 𝑃𝑜𝑣𝑒𝑟𝑡𝑦 𝑝𝑟𝑜𝑝𝑜𝑟𝑡𝑖𝑜𝑛𝑐 + 𝜖𝑐𝑖
𝐶𝑟𝑖𝑚𝑒 𝑅𝑎𝑡𝑒 𝑝𝑒𝑟 1,000 𝑃𝑜𝑝𝑢𝑙𝑎𝑡𝑖𝑜𝑛𝑐𝑗
= 𝛽0 + 𝛽1 𝑃𝑎𝑟𝑘 𝑟𝑒𝑑𝑒𝑣𝑙𝑒𝑜𝑝𝑚𝑒𝑛𝑡 𝑐𝑜𝑚𝑚𝑢𝑛𝑖𝑡𝑦𝑖 + 𝛽2 𝑇𝑖𝑚𝑒𝑖
+ 𝛽3 𝑃𝑎𝑟𝑘 𝑟𝑒𝑑𝑒𝑣𝑙𝑜𝑝𝑚𝑒𝑛𝑡 𝑐𝑜𝑚𝑚𝑢𝑛𝑖𝑡𝑦𝑖 ∗ 𝑇𝑖𝑚𝑒𝑖 + 𝛽4 𝑁𝐻𝐵 𝑝𝑟𝑜𝑝𝑜𝑟𝑡𝑖𝑜𝑛𝑐
+ 𝛽5 𝐹𝑒𝑚𝑎𝑙𝑒 𝑝𝑟𝑜𝑝𝑜𝑟𝑡𝑖𝑜𝑛𝑐 + 𝛽6 𝑉𝑎𝑐𝑎𝑛𝑐𝑦 𝑝𝑟𝑜𝑝𝑜𝑟𝑡𝑖𝑜𝑛𝑐
+ 𝛽7 𝑅𝑒𝑛𝑡𝑒𝑟 𝑜𝑐𝑐𝑢𝑝𝑖𝑒𝑑 ℎ𝑜𝑢𝑠𝑒ℎ𝑜𝑙𝑑𝑠 𝑝𝑟𝑜𝑝𝑜𝑟𝑡𝑖𝑜𝑛𝑐 + 𝛽8 𝐶ℎ𝑖𝑙𝑑𝑟𝑒𝑛 𝑝𝑟𝑜𝑝𝑜𝑟𝑡𝑖𝑜𝑛𝑐
+ 𝛽9 𝑆𝑖𝑛𝑔𝑙𝑒 𝑝𝑎𝑟𝑒𝑛𝑡 ℎ𝑜𝑢𝑠𝑒ℎ𝑜𝑙𝑑 𝑝𝑟𝑜𝑝𝑜𝑟𝑡𝑖𝑜𝑛𝑐 + 𝛽10 𝑃𝑎𝑟𝑘 𝑓𝑒𝑎𝑡𝑢𝑟𝑒𝑠𝑐
+ 𝛽11 𝑃𝑎𝑟𝑘 𝑎𝑐𝑟𝑒𝑠𝑐 + 𝛽12 𝑃𝑜𝑣𝑒𝑟𝑡𝑦 𝑝𝑟𝑜𝑝𝑜𝑟𝑡𝑖𝑜𝑛𝑐 + 𝜖𝑐𝑖
Results
Table III.2 includes descriptive statistics for study variables for the blight research
question.
Table III.2. Summary Statistics (Blight)
N Percent Mean Standard
Deviation
Median Minimum Maximum
Page 77
62
Monthly average fine dollar amount per
parcel - removed outliers
1951
$1.57 $1.97 $0.98 $0.01 $30.94
Park redevelopment neighborhood by
Tract
86 34.88%
Proportion of census tract below 100% of
the FPL
1952
0.42 0.11 0.41 0.09 0.67
Non-Hispanic Black proportion in census
tract
1952
0.83 0.24 0.93 0.01 1.00
Proportion of renter-occupied housing
units in census tract
1952
0.49 0.14 0.47 0.16 0.92
Proportion of vacant units in census tract 1952
0.32 0.12 0.31 0.08 0.62
Total features in census tract 1930
3.71 3.41 3.00 0.00 17.00
Total acres of parks in census tract 1928
6.90 11.58 3.82 0.23 66.71
Table III.3 includes descriptive statistics for study variables for the crime research
question.
Table III.3. Summary Statistics (Crime)
Variable N Percent Mean Standard Deviation Median Minimum Maximum
Monthly crime per 1,000-
population in census tract -
removed outliers
1645
11.30 8.48 10.16 0.17 63.71
Monthly violent crime per
1,000-population in census tract
- removed outliers
1311
2.13 1.61 1.74 0.22 13.30
Park redevelopment
neighborhood by census tract
82 37.80%
Proportion of census tract below
100% of the FPL
1646
0.44 0.11 0.45 0.09 0.70
Female proportion in census
tract
1646
0.53 0.05 0.54 0.41 0.65
Proportion of children in census
tract
1646
0.25 0.06 0.24 0.14 0.41
Proportion of single parent
households in census tract
1646
0.79 0.16 0.81 0.15 1.00
Non-Hispanic Black proportion
in census tract
1646
0.84 0.24 0.94 0.02 1.00
Proportion of renter-occupied
housing units in census tract
1646
0.52 0.14 0.51 0.24 0.89
Proportion of vacant units in
census tract
1646
0.32 0.12 0.32 0.06 0.68
Total features in census tract 1646
3.94 4.28 3.00 0.00 27.00
Total acres of parks in census
tract - removed outliers
1624
6.94 11.11 4.00 0.12 66.71
Bivariate Analysis. On the basis of previous research (Price, 2016), we conducted a
bivariate analysis to examine the relationship between blight violations and crime. The bivariate
analysis found that blight and crime were weakly (0.17) but statistically significantly correlated
(p < 0.001), indicating that it suitable to test the outcomes separately.
Page 78
63
Blight Fines. A bivariate analysis found that the average fine per parcel was not
correlated from the five-year pre- to the one-year pre-intervention. Total acres in the census
tract, the proportion of renters, the proportion of vacant property units, and the proportion of
NHB were all statistically significant.
Table III.4. Bivariate Analysis of Park Redevelopment and Average Blight Fine per Parcel
1 2 3 4 5 6 7 8
1. Monthly average fine dollar
amount per parcel - removed
outliers
1.00
2. Park redevelopment
neighborhood by tract
0.01 1.00
3. Proportion of census tract
below 100% of the FPL
0.00 -0.02 1.00
4. Non-Hispanic Black
proportion in census tract
-0.05* 0.12*** 0.02 1.00
5. Proportion of renter-
occupied housing units in
census tract
0.16*** -0.01 0.62*** -
0.13***
1.00
6. Proportion of vacant units
in census tract
-0.10*** -0.21*** 0.44*** 0.19*** 0.04* 1.00
7. Total features in census
tract
-0.0003 0.03 -0.21*** -0.03 -0.04 0.06* 1.00
8. Total acres of parks in
census tract
-0.08** 0.16*** 0.01 0.06* -0.02 0.01 0.61*** 1.00
***p < 0.001, **p < 0.01, *p < 0.05
Reported Crime. A bivariate analysis found that violent crime was not correlated from
the five-year pre- to the one-year pre-intervention; however, all crime was correlated. Park
redevelopment was not significantly correlated with the total crime, but significantly correlated
with violent crime (0.10, p < 0.01) (Table III.5). The proportion of females, the proportion of
single parents, the proportion of NHB, as well as total park features in the tract, and total park
size were all significantly associated with both total crime per 1,000-population and violent
crime per 1,000-population.
Page 79
64
Table III.5. Bivariate Analysis of Park Redevelopment and Reported Crime per 1,000-Population
1 2 3 4 5 6 7 8 9 10 11 12
1. Monthly crime per
1,000-population in
census tract - removed
outliers
--
2. Monthly violent crime
per 1,000-population in
census tract - removed
outliers
0.70*** --
3. Park redevelopment
neighborhood by census
tract
-0.03 0.10** --
4. Proportion of census
tract below 100% of the
FPL
-0.04 -0.03 -0.11*** --
5. Female proportion in
census tract
0.11*** 0.06* 0.07** -0.04 --
6. Proportion of children
in census tract
-0.08** -0.02 -0.08** 0.26*** 0.16*** --
7. Proportion of single
parent households in
census tract
0.26*** -0.15*** -0.06* 0.17*** 0.21*** -0.29*** --
8. Non-Hispanic Black
proportion in census tract
0.17*** 0.11*** 0.12*** -0.11*** 0.27*** -0.40*** 0.56*** --
9. Proportion of renter-
occupied housing units in
census tract
-0.02 -0.08** -0.20*** 0.57*** 0.21*** 0.13*** 0.08** -0.14*** --
10. Proportion of vacant
units in census tract
0.04 0.14*** -0.18*** 0.36*** -0.24*** -0.23*** 0.31*** 0.18*** 0.04 --
11. Total features in
census tract
-0.15*** -0.10** 0.09*** -0.24*** -0.31*** -0.13*** -0.38*** -0.18*** -0.18*** 0.01 --
12. Total acres of parks
in census tract
-0.14*** -0.15*** 0.15*** -0.14*** -0.20*** -0.02 -0.30*** -0.09** -0.13*** -0.11*** 0.78*** --
***p < 0.001, **p < 0.01, *p < 0.05
Page 80
65
Repeated Measures.
Blight Fines. Model 1 (Table III.6) presents the main independent variable model of the
average fine dollar per parcel. The interaction of park redevelopment and time shows there was
a statistically significant (p < 0.01) and positive association with the blight fine per parcel (β =
1.03, CI = 0.41, 1.65). This relationship remained statistically significant (p < 0.01) in Model 2
after the inclusion of the proportion of residents falling below the FPL (β = 1.00, CI = 0.30,
1.71). In Model 3, with the inclusion of neighborhood characteristics of the proportion of NHB
residents, the proportion of the tract vacant, and proportion of renters, the interaction variable
was no longer significant. In Model 4 the remaining covariates included were the proportion of
children, the total features in the census tract, and the total park size in acres in the census tract.
After the inclusion of all the variables the interaction of park redevelopment and time remained
insignificant. It is important to note that the study was underpowered with a power achieved of
0.10.
The graphical representation (Figure III.2) shows that blight fines in intervention
neighborhoods is increasing, while the neighborhoods without redevelopment is relatively
stagnant. The dataset was split to assess the effect of the intervention. Average blight fines per
parcel showed that the 12-month period before of the intervention with the inclusion of the first
month of the intervention was significant (p < 0.001) and the first month of the intervention to
the end of the post- time was significant (p = 0.001).
The Moran’s I completed in ArcGIS 10.4.1 for Windows indicated that there was no
spatial autocorrelation. Therefore, the mixed model repeated measures were sufficient to report.
Page 81
66
Table III.6. Repeated Measures Mixed Model of Average of Assessed Blight Fines per Parcel and Park Redevelopment
Model 1: Main Independent
Variable, n= 31
Model 2: Main Independent
Variable with SEP Covariate,
n= 31
Model 3: Neighborhood with
SEP Covariate, n= 31
Model 4: Full Model, n= 31
n obs = 1951 n obs = 1951 n obs = 1951 n obs = 1905
n tracts = 86 n tracts = 86 n tracts = 86 n tracts = 85
β (SE) 95% CI β (SE) 95% CI β (SE) 95% CI β (SE) 95% CI
Intercept - monthly average fine
dollar amount per parcel -
removed outlier
1.41 (0.37)** 0.68, 2.14 1.38 (0.41)** 0.59, 2.18 0.99 (0.44)* 0.13, 1.85 0.80 (0.45) -0.08, 1.68
Park redevelopment
neighborhood by tract
0.10 (0.47) -0.83, 1.02 0.10 (0.47) -0.83, 1.02 0.05 (0.46) -0.85, 0.96 0.16 (0.47) -0.76, 1.07
Time -0.20 (0.55) -1.28, 0.88 -0.20 (0.55) -1.28, 0.88 -0.15 (0.54) -1.21, 0.90 -0.19 (0.54) -1.25, 0.88
Interaction of park
redevelopment neighborhood
and time
1.03 (0.32)** 0.41, 1.65 1.00 (0.36)** 0.30, 1.71 0.57 (0.39) -0.20, 1.34 0.47 (0.41) -0.33, 1.27
Covariates
Non-Hispanic Black Proportion
in census tract
-0.16 (0.19) -0.53, 0.21 0.12 (0.20) -0.27, 0.51
Proportion of vacant units in
census tract
0.19 (0.11) -0.02, 0.40 -1.16 (0.48) -2.19, -0.32
Proportion of renter-occupied
housing units in census tract
3.76
(0.43)***
2.92, 4.61 3.08 (0.43)** 2.23, 3.93
Total features in census tract -
removed outliers
0.04 (0.02) 0.01, 0.08
Total park size (acres) in census
tract - removed outliers
-0.03 (0.01)*** -0.04, -0.01
Socioeconomic Position Covariate
Proportion of census tract
with residents below 100%
of the FPL
0.07 (0.40) -0.71, 0.84 -3.21
(0.59)***
-4.37, -2.05 -1.47 (0.65)* -2.75, -0.19
Power Achieved: 0.10
***p < 0.001, **p < 0.01, *p < 0.05
Page 82
67
Figure III.2 Monthly Repeated Measures Average of Assessed Blight Fines per Parcel and Park Redevelopment
Pre-1 – Post-12: p = 0.14
Pre-1 – Interv.-1: p < 0.001
Interv.-1 – Post-12: p = 0.001
Page 83
68
All Reported Crime. Model 1 (Table III.7) presents the main independent variable model.
The interaction of park redevelopment and time shows there was a statistically significant (p <
0.001) and positive association with crime per 1,000-population (β = 6.75, CI = 4.19, 9.31). This
relationship remained statistically significant (p < 0.001) in Model 2 after including the
proportion of the tract in poverty (β = 8.91, CI = 5.92, 11.90). In Model 3 with the inclusion of
neighborhood characteristics of NHB, proportion of females, proportion of the tract vacant, and
proportion of renters, the interaction variable was no longer significant and became a negative
association. Model 4 included the remaining covariates: the proportion of children, the
proportion of single parents, the total features in the census tract, and the total park size in acres
in the census tract. After the inclusion of all the variables, the interaction of park redevelopment
and time was statistically significant with (p < 0.01) indicating that there is an association of park
redevelopment and violent/non-violent crimes (β = -9.29, CI = -14.93, -3.64).
Figure III.3 shows that all crime per 1,000-population in both the intervention and match
neighborhoods increased during the study period. In addition, there was a sharp increase in
crime reporting in both the intervention and match neighborhoods during the month prior to the
park redevelopment period. The dataset was split based on the intervention time. All crime per
1,000-population showed that the 12-month period before of the intervention with the inclusion
of the first month of the intervention was insignificant and the first month of the intervention to
the end of the post- time was also insignificant.
The residuals were tested for spatial autocorrelation, which was found to be insignificant,
indicating the mixed model was sufficient to report. It is worth noting that this study was
underpowered with a power of 0.10.
Page 84
69
Table III.7. Repeated Measures Mixed Model of All Reported Crime and Park Redevelopment
Model 1: Main Independent
Variable, n= 31
Model 2: Main Independent
Variable with SEP Covariate,
n= 31
Model 3: Neighborhood with SEP
Covariate, n= 31
Model 4: Full Model, n= 31
n obs = 1641 n obs = 1641 n obs = 1641 n obs = 1623
n tracts = 82 n tracts = 82 n tracts = 82 n tracts = 81
β (SE) 95% CI β (SE) 95% CI β (SE) 95% CI β (SE) 95% CI
Intercept – Monthly crime per 1,000-
population in census tract - removed outliers
0.48 (2.44) -4.31, 5.27 2.38 (2.53) -2.59, 7.34 -11.48 (3.22)** -17.79, -5.16 -15.44 (3.42)*** -22.16, -8.73
Park redevelopment neighborhood by
census tract
0.33 (3.04) -5.64, 6.30 0.95 (7.17) -5.52, 6.40 0.76 (2.98) -5.09, 6.60 0.75 (2.84) -4.82, 6.31
Time 5.92 (2.94) 0.14, 11.69 6.05 (2.94) 0.29, 11.82 5.81 (2.88)* 1.87, 27.57 6.69 (2.74)* 1.31, 12.06
Interaction of park redevelopment
neighborhood and time
6.75
(1.30)***
4.19, 9.31 8.91
(1.52)***
5.92, 11.90 -4.92 (2.54) -9.91, 0.07 -9.29 (2.88)** -14.93, -3.64
Covariates
Non-Hispanic Black proportion in census
tract
4.24 (0.88)*** 2.51, 5.96 0.75 (1.04) -1.29, 2.78
Female proportion in census tract
18.12 (4.06)*** 10.16, 26.09 1.96 (1.90) 2.89, 19.35
Proportion of vacant units in census tract
2.94 (1.83) -0.64, 6.53 1.97 (1.90) -1.77, 5.70
Proportion of renter-occupied housing units
in census tract
-2.00 (1.81) -5.56, 1.56 -1.07 (1.79) -4.57, 2.43
Proportion of children in census tract
9.58 (4.10)* 1.54, 17.63
Proportion of single parent households in
census tract
15.11 (1.60)*** 11.97, 18.24
Total features in census tract
-0.13 (0.08) -0.28, 0.02
Total acres of parks in census tract
-0.01 (0.03) -0.07, 0.04
Socioeconomic Position Covariate
Proportion of census tract below 100% of
the FPL
-4.71
(1.72)**
-8.09, -1.33 -3.27 (2.28) -7.75, 1.20 -12.23 (2.54)*** -17.21, -7.25
Power Achieved: 0.10
***p < 0.001, **p < 0.01, *p < 0.05
Page 85
70
Figure III.3 Monthly Repeated Measures Mixed Model of Crime per 1,000-population and Park Redevelopment
Pre-1 – Post-12: p < 0.01
Pre-1 – Interv.-1: p = 0.14
Interv.-1 – Post-12: p = 0.10
Page 86
71
Reported Violent Crime. Violent crime was separated and tested from total crime for
associations with park redevelopment. Due to data limitations discussed above, crime could only
have a pre-intervention period of 7 months instead of the 12 months selected for the other
outcomes. Model 1 (Table III.8) shows that the interaction of the park redevelopment with time
had a statistically significant (p < 0.001) and positive association with crime (β = 1.46, CI = 0.81,
2.10). This relationship continued to be statistically significant (p < 0.001) in Model 2 with the
inclusion of the proportion of residents in the census tract falling below the FPL (β = 1.81, CI =
1.01, 2.60). In Model 3, with the addition of NHB proportion, proportion of females, proportion
of the tract vacant, and proportion of renters, the interaction term was no longer significant (β = -
0.43, CI = -1.60, 0.73). Model 4 included the remaining covariates of the proportion of children,
the proportion of single parents, the total features in the census tract, and the total park size in
acres in the census tract. The interaction of park redevelopment and time was moderately
insignificant (p = 0.519). It is important to note that this study was underpowered, achieving a
power of 0.10.
Figure III.4 illustrates that violent crime in both the intervention and match
neighborhoods started at approximately the same point, and then started to increase. Similar to
the violent and non-violent crime finding, there was a sudden increase in both the intervention
and matched neighborhood the month before the intervention. The slope of these findings shows
that the intervention neighborhoods had more reported violent crimes compared to the matched
neighborhoods. The dataset was split based on the intervention time. Violent crime per 1,000-
population showed that that the 12-month period before of the intervention with the inclusion of
the first month of the intervention was insignificant and the first month of the intervention to the
end of the post- time was also insignificant.
Page 87
72
The residuals were tested for spatial autocorrelation, which was found to be insignificant,
indicating the mixed model was sufficient to report.
Page 88
73
Table III.8. Repeated Measures Mixed Model of Reported Violent Crime and Park Redevelopment
Model 1: Main Independent
Variable, n= 26
Model 2: Main Independent
Variable with SEP Covariate,
n= 26
Model 3: Neighborhood with
SEP Covariate, n= 26
Model 4: Full Model, n= 26
n obs = 1312 n obs = 1312 n obs = 1312 n obs = 1290
n tracts = 82 n tracts = 82 n tracts = 82 n tracts = 81
β (SE) 95% CI β (SE) 95% CI β (SE) 95% CI β (SE) 95% CI
Intercept - Monthly violent crime
per 1,000-population in census tract
- removed outliers
1.73 (0.29)*** 1.56, 2.30 2.03 (0.36)*** 1.33, 2.74 -0.18 (0.56) -1.28, 0.91 -0.91 (0.65) -2.18, 0.36
Park redevelopment neighborhood
by census tract
0.82 (0.37) 0.08, 1.55 0.83 (0.40)* 0.50, 1.61 0.81 (0.37) 0.09, 1.52 0.69 (0.36) -0.01, 1.40
Time -0.37 (0.51) -1.37, 0.63 -0.35 (0.54) -1.42, 0.71 -0.48 (0.50) -1.46, 0.50 -0.55 (0.49) -1.50, 0.40
Interaction of park redevelopment
neighborhood and time
1.46 (0.33)*** 0.81, 2.10 1.81 (0.41)*** 1.01, 2.60 -0.43 (0.59) -1.60, 0.73 -1.33 (0.69)a -2.68, 0.01
Covariates
Non-Hispanic Black proportion in
census tract
0.53 (0.22)* 0.10, 0.96 0.66 (0.26)* 0.16, 1.16
Female proportion in census tract
3.17 (0.91)** 1.38, 4.96 2.03 (0.96)* 0.15, 3.91
Proportion of vacant units in census
tract
1.87 (0.41) 1.05, 2.69 2.09 (0.44)*** 1.23, 2.95
Proportion of renter-occupied
housing units in census tract
-1.25 (0.41)*** -2.06, -0.43 -0.89 (0.41)* -1.70, -0.08
Proportion of children in census
tract
3.37 (0.95)** 1.51, 5.23
Proportion of single parent
households in census tract
1.25 (0.38)** 0.50, 2.00
Total features in census tract
-0.01 (0.02) -0.04, 0.03
Total acres of parks in census tract
-0.01 (0.01) -0.02, 0.001
Socioeconomic Position Covariate
Proportion of census tract with
residents below 100% of the FPL
-0.73 (0.42)* -1.56, 0.11 -0.38 (0.53) -1.42, 0.67 -1.95 (0.60)** -3.12, -0.78
Power Achieved: 0.10
***p < 0.001, **p < 0.01, *p < 0.05
a: p = 0.051
Page 89
74
Figure III.4 Monthly Repeated Measures Mixed Model of Violent Crime per 1,000-population and Park Redevelopment
Pre-1 – Post-12: p = 0.051
Pre-1 – Interv.-1: p = 0.28
Interv.-1 – Post-12: p = 0.46
Page 90
75
Discussion
The findings in this study suggest that park redevelopment is associated with more blight
enforcement per parcel in neighborhoods with redeveloped parks, when we examined the time
period following the start of the intervention. This association was insignificant when examining
the entire time period starting with 12-months before the intervention and ending 12-months
after the intervention.
The same study found that total reported crimes and reported violent crimes are not
associated with park redevelopment, when we examined from the initiation of the park
redevelopment to the conclusion of the post-period. However, the association was nearly
significant for the total time period of neighborhoods with redeveloped parks, with fewer
reported violent crimes per 1,000-population.
The inconsistent finding in the full models of these three outcomes compared to the split
time graphical representations indicate that more research is needed.
Blight Fines. The bivariate analysis indicates that there no association between blight
fines per parcel in the previous five-years and the start of the 12-month period before the
intervention. It is unclear why this is insignificant; however, the department that primarily issues
blight tickets expanded from the Buildings and Safety Engineering Department to the Buildings,
Safety Engineering, and Environmental Department in recent years. This department change
could also indicate changes in violation enforcement. Further, the bivariate analysis indicates
that there is no association of park redevelopment and blight fines per parcel; however, this null
association does not hold in the split time model due to the significant differences across time
before and after the intervention.
Page 91
76
The hypothesis that blight fines would decrease in intervention neighborhoods was not
supported in the full model. Conversely, the findings show that the start of the intervention may
trigger significant increases in average blight fines per parcel in neighborhoods with park
redevelopment. This finding adds to mixed literature in urban neighborhoods. Community
leaders in Detroit indicated that once-dilapidated places are no longer sources of blight or
dumping grounds once redevelopment starts (BBC Research & Consulting, 2014). Further, work
in Massachusetts found the redevelopment of pocket parks and community gardens worked to
eliminate blight in the community. The author indicated that these reclaimed and redeveloped
areas were a “positive neighborhood resource,” bringing neighbors together for activities (Art,
2014). Given this, it is possible that the increases in fines deter blight in the neighborhoods and
the increased enforcement in neighborhoods with redevelopment is part of a larger strategy to
reclaim the neighborhood. This conjecture is supported in a recent news article indicating that
the priority for blight enforcement in Detroit is in part based on neighborhood assets, including
nearby parks (Ikonomova, 2018).
The potential strategy of deterring blight through assessed blight fines in the
neighborhood has multiple benefits for residents. A systematic review which found that
addressing the visual cues of blight can encourage residents to spend time in their neighborhood
by reducing suspicion and distrust (Sreetheran & van den Bosch, 2014). Further, the visual cues
of blight can impact cardiovascular health. In Philadelphia, the Philadelphia Horticulture Society
remediated previous vacant lots into greened park-like lots. Following this process, the
researchers found that those who walked in view of the greened lots had better cardiovascular
heart rates compared to those walking in view of vacant lots (South, Kondo, Cheney, & Branas,
2015). Therefore, cities such as Detroit could consider using blight violations as part of renewal
Page 92
77
efforts in the neighborhood, including the redevelopment of parks (Cell et al., 2017) and in turn
can have health benefits to residents.
Reported Crime. The bivariate analysis found that violent crime was not associated in
the previous five-years and the start of the 12-month period before the intervention. Further,
while the violent crime bivariate analysis was positively and statistically significant with park
redevelopment, no such association was found in the full model when split before and after the
intervention. These findings are most likely due to crimes being classified differently due to the
citywide failure to categorize any crimes as violent for a period of five months for this study.
The research in this dissertation examined all (violent/non-violent) crime and violent
crime; however, crime may be more complex than bisected comparisons of all crime and violent
crime to park redevelopment. Specifically, violent crime was nearly significant with findings
indicating that neighborhoods without redevelopment have more violent crime following park
redevelopment; therefore, park redevelopment may be protective. However, this must not be
over-interpreted given the null findings. Thus, the findings of this work adds to the inconsistent
literature of changes in crime following redevelopment (Bogar & Beyer, 2015) and more
research is needed. In New Orleans researchers found that following the remediation of land into
park-like areas that violent, property, and domestic crimes did not change; while drug crimes
significantly decreased two years after the renovation (M. C. Kondo et al., 2018). Work out of
Ohio using similar spatial and statistical methods found that after vacant land was greened into
park-like areas, burglaries decreased in the neighborhood, but motor vehicle thefts increased (M.
Kondo et al., 2016). Specifically, increases in motor vehicle thefts could be due to increases in
visitor to the parks and therefore more targets. Both studies had longer post-intervention times
Page 93
78
for their study and studied specific types of violent and non-violent crimes, thus could influence
their findings when compared to this study.
Further research in Philadelphia found that creating park-like environments was
associated with decreases reported gun assaults, robberies, burglaries, and nuisances analyzed
over three years (Branas et al., 2018). The same study found that more visitors were observed
using the redeveloped park-like environments. Connected to the Branas study, in urban Los
Angeles found researchers that gun-related violent crimes had long-term negative associations of
self-reported park use when measured during a two-year period (Han et al., 2018).
The work in this dissertation when considering previous literature indicates that crime is
more complex and researching specific types of crime pertinent for the community along with
the time for changes to occur could yield different findings. Therefore, the City of Detroit and
other cities may want to add specificity of the timing and what types of crimes are related with
park redevelopment before advertising the benefit of lower “crime.”
Limitations. This work is not without its limitations. First, there are many ways to
define a neighborhood in spatial terms, and one of those ways is the census tract. Though the
census tract has visible boundaries (e.g., freeways), they may not represent residents’ lived
perceptions of neighborhood boundaries. Even with a mixed-methods study to define the
neighborhood, there are doubts as to whether any representation is a true representation of the
neighborhood. Therefore, using the census tract still provides findings as realistic and
interpretable as any other spatial neighborhood definition.
Measures for the blight fines and crimes were sourced from the City of Detroit Data
Portal. The Data Portal opened for public access in April 2018 based on a commitment from the
Detroit City Charter (City of Detroit, 2012, 2018). Given the date of the opening, it is expected
Page 94
79
that some data entry errors still exist, affecting its reliability. Moreover, the differences in crime
categories, the absence of violent crimes during October 2015–September 2016 and suspected
duplication present additional concerns in the reliability of the data. Though possible, it is
unlikely that no violent crimes occurred in Detroit for one year. This likely data misclassification
indicates that the results for violent crime presented here might have validity issues.
Further, there was a sharp spike in crime during the month prior to park redevelopment.
Chief James Craig was quoted in the Detroit Free Press as saying that there was a period of time
where duplicate data entry occurred (Baldas, 2017). This time period matches the sharp increase
noted graphically. This problem raises the issue of using objective measures of crime. However,
objective measures are those that are commonly reported by the news and national sources.
Therefore, this work highlights the need for better reliability of data portal datasets, such as the
City of Detroit Data Portal. Future research can couple these spatial methods with qualitative
methods to tell a more detailed story, such as the types of crimes to be studied. These changes
would mimic previous work on changes in crime following the redevelopment of neighborhood
spaces (Branas et al., 2018).
The City of Detroit is one of a small but growing number of neighborhoods with open
data portals. Previously cited research conducted in Philadelphia and Youngstown used data
sourced directly from police departments, demonstrating the successful use of resources similar
to the Detroit Data Portal.
The work on the blight study also had its limitations. It is possible that the research
method of a between-group design with repeated measures pre- and post-intervention is the
incorrect assessment for changes in blight. Based on the findings, the start of the intervention
Page 95
80
appears to be the best time for the assessment of changes following park redevelopment, since
the full model did not show any significant relationship.
The findings of this research study indicate that reported crime rates in the short-term are
not altered. Further, it indicates that the City of Detroit may issue higher fines in neighborhoods
with redeveloped parks as part of a renewal strategy. Therefore, the City of Detroit and other
urban cities may need to express to residents’ a different narrative that does not advertise
reduced blight and crime in park redevelopment neighborhoods or provide more transparency on
the timing needed for the changes.
Finally, both studies were underpowered, which is probable with a finite dataset, as is
often the case with natural experiments. Future research will expand the time period to increase
the power of the analysis, leading to more definitive findings. Though this study has its
limitations, it is possibly the first study of its kind using a natural experiment of a large-scale
citywide recreational improvement coupled with locally sourced data to assess changes in social
environments.
Page 96
81
Chapter IV
Paper III
Changes in Valid Arm’s Length Residential Property Sales Price Following Park
Redevelopment
Background and Hypothesis
Research documents that open green space increases property values (Anderson & West,
2006; Brander & Koetse, 2011; Poudyal, Hodges, Tonn, et al., 2009) and makes the
neighborhood more desirable for other investment activities (Chrysochoou et al., 2012). At the
same time, some neighborhoods find the maintenance costs of parks financially burdensome
(Eisinger, 2014) and find ways to reduce this financial burden. In neighborhoods where low
home values are coupled with low tax revenue, the money spent on recreation is lower compared
to neighborhoods with higher home values (Joassart-Marcelli, 2010; Wolch et al., 2014). In
contrast, wealthier neighborhoods view financially supporting parks and recreation as a way to
increase property values and promote development (Joassart-Marcelli, 2010). Thus, lower
investment based on lower property values may introduce a “chicken and the egg dilemma,” in
which lower park investment may coexist with lower property values.
There may be health benefits corresponding to living in neighborhoods with higher
property values. Specifically, PA may be increased in neighborhoods with more park
redevelopment and higher property values. In a cross-sectional study conducted in 32
neighborhoods in Baltimore, Maryland-Washington, DC and King County-Seattle, Washington,
Page 97
82
researchers found that residents in the higher-income neighborhoods who indicated more
favorable perceptions of safety from crime, aesthetics, and road hazards (e.g. traffic volume and
speed) also lived in neighborhoods that encouraged PA (Sallis et al., 2011). In a series of
brownfield redevelopment projects in Milwaukee, Wisconsin and Minneapolis, Minnesota,
residents perceived that remediating the brownfields into residential and park projects would
have the greatest impact on property values. The creation of parks in Milwaukee increased the
property values of nearby homes by 11.7%, and in Minneapolis nearby home property values
increased by 4.4% (De Sousa et al., 2009). It is probable that LTPA was encouraged, since parks
are a common location for LTPA engagement in addition to social gatherings (Cohen et al.,
2007; Evenson, Wen, Hillier, & Cohen, 2013).
This research study takes place in Detroit, Michigan, which has many neighborhoods
with low home prices, less funding, and thus less park redevelopment. Lower property values
are inevitable for some neighborhoods, such as Detroit. Starting in the early 1960s and
continuing for decades, property values fell by 77%. In 2007 at the start of the housing crisis,
foreclosures were rampant in Detroit in large part due to the disproportionate percentage of
subprime loans (Deng et al., 2018; Sugrue, 2014). By some estimates, by 2014 there were on
average over 90 foreclosed properties per square mile in Detroit, which is more than 1/6 of all
parcels in the City (Cell et al., 2017; Sugrue, 2014). There is evidence indicating that
foreclosures from 90–400 meters of a property for sale decrease the sales price between 1 and
3% for up to five years after a foreclosure (Biswas, 2012; Harding et al., 2009). Thus, in
neighborhoods with higher foreclosures, there may be more challenges to overcome beyond the
presence of parks and park redevelopment to increase property values. Studies rarely include the
proportion of foreclosures as a covariate in their research, which is particularly impactful in
Page 98
83
Detroit and other cities devastated by the collapse of industrialization and the housing market
bubble.
This paper investigates changes in the housing prices based on living in census tracts with
redeveloped parks. Examining data from Detroit, Michigan, we hypothesize that neighborhoods
near recently redeveloped parks will see an increase in average valid arm’s length (VAL)7
residential property sales price compared to similar neighborhoods without redeveloped parks
(Figure IV.1).
7 Sales where buyer and seller are both acting in their best interest to get the best deal possible (e.g., a buyer wanting
to spend the least amount, while the seller desires to gain the most amount of money).
Figure IV.1 Conceptual model of association of park redevelopment and property values
Page 99
84
Methods
Geography. Detroit, Michigan (USA) is the largest city in the state of Michigan by both
size and population. The total land area of Detroit is 138.75 square miles (359.36 square
kilometers) (United States Census Bureau, 2017a), which would encompass Boston, Manhattan,
and San Francisco combined. The City is estimated to have 690,000 residents, 80% of whom are
non-Hispanic Black (NHB), and 39.8% of households living below the Federal Poverty Line
(FPL) (United States Census Bureau, 2016). Detroit has 382,560 parcels, of which 104 have no
listed ownership as of October 3, 2018 (City of Detroit, 2018).
Census tract boundary data from the 2010 Census for all tracts (n = 297) were obtained
from the Census Topologically Integrated Geographic Encoding and Referencing (TIGER)
products (United States Census Bureau, 2017b). There are four unpopulated tracts due to
industry. A shapefile with all roads, residential roads, state roads, freeways, service drives and
other roads in the City of Detroit was obtained from Esri Logistic Services (Esri, 2018). All
spatial data from the City of Detroit was analyzed using ArcGIS 10.4.1 for Desktop (“ArcGIS
10.4.1 for Desktop,” 2015). The spatial data was projected to the NAD 1983 Michigan meters
projection, with the North American 1983 Geographic Coordinate System.
Matching comparison neighborhoods. Multiple steps were used to obtain the
comparison group for the park redevelopment neighborhoods. There are multiple ways to define
a neighborhood in spatial terms, with no universal standard (Poudyal, Hodges, Tonn, et al.,
2009). In related VAL literature, researchers noted that both the block group and census tract
provide similar estimates (Iceland & Steinmetz, 2003; Poudyal, Hodges, Tonn, et al., 2009;
Shultz & King, 2001). This study uses census tracts as the neighborhood boundary, based on
previous housing research in the City of Detroit (Deng et al., 2018). A census tract is a
Page 100
85
reasonable approximation of a neighborhood due to the boundaries following “visible and
identifiable features,” such as a highway or river (United States Census Bureau (Commerce),
2018; United States Census Bureau, 2019). With this criterion set by the United States
government, setting the neighborhood definition as the census tract is an appropriate
approximation and is used in similar research (Boggess & Maskaly, 2014; Soltero et al., 2015).
The census tract where each park in the City of Detroit is located was provided by the
Division of Parks and Recreation (City of Detroit, 2016; J. Fulton, personal communication,
March 15, 2017). Using the Join Feature in ArcGIS 10.4.1 for Desktop parks (n = 308) were
joined with the median household income for the census tracts in which they are located using
the 2011–2015 five-year United States ACS estimates (United States Census Bureau, 2017c).
The 2015 point-source data from the City of Detroit Data Portal (City of Detroit, 2018) was
joined as a one-to-many with each census tract using the Spatial Join Feature in ArcGIS 10.4.1
for Desktop. This data was then exported to a Microsoft SQL Server 12.0.5207.0 (“SQL
12.0.5207.0,” 2014) and averaged for each eligible census tract. The resulting table was
exported to MedCalc 15.2 for Windows (“MedCalc,” 2018). Census tracts with at least one
Phase 1 park were matched with census tracts with at least one park, except tracts with any Phase
2 parks, using the case-control procedure in MedCalc. The matching was restricted to variables
that were no more than one standard deviation away from the mean of the phase 1 park census
tracts (Stuart, 2010; Stuart & Rubin, 2008). The matching hierarchy was: 1) averages of the
dependent variable from 2015, 2) available acres of parks of the tract, and 3) median household
income (Cohen et al., 2009).
Sample. This study analyzes VAL residential property sales price in 89 census tracts
across the City of Detroit with 31 census tracts having at least one redeveloped park (parks, n =
Page 101
86
36) and 58 census tracts having no redeveloped park (parks, n = 93) (See Appendix I). Some
census tracts had multiple parks that were either redeveloped or not redeveloped, in which case
all of the features and acres available to the public were summed.
Measures and data sources. Table IV.1 below details the dependent variable,
independent variable, and covariates that will be used for this research question.
Page 102
87
Table IV.1. Study variables
Variable Type Variable Name/Coded Description Data Source(s)
Dependent
variable
Post-redevelopment Valid
Arm’s Length (VAL) sales
price (continuous)
The average VAL sales price per square foot (USD) for each study
area of the redeveloped (n = 31) and matched (n = 58) neighborhoods
during the 12-month post-redevelopment time period (T2).
City of Detroit Open Data Portal (City of
Detroit, 2018)
Independent
variable
Park redevelopment
neighborhood (dichotomous)
The City of Detroit provided a database indicating park
redevelopment based on the phase. To create the neighborhood, the
census tract where the park(s) is/are located will also serve as a
neighborhood.
City of Detroit (City of Detroit, 2016; J. Fulton,
personal communication, March 15, 2017)
Covariate Pre- redevelopment Valid
Arm’s Length (VAL) sales
price (continuous)
The average VAL sales price per square foot (USD) for each study
area of the redeveloped (n = 31) and matched (n = 58) neighborhoods
during the 12-month pre-redevelopment time period (T1).
City of Detroit Open Data Portal (City of
Detroit, 2018)
Covariate Total park acres (continuous) Total size of the park acres available in the census tract. City of Detroit (City of Detroit, 2016; J. Fulton,
personal communication, March 15, 2017)
Covariate Total park features (continuous) Count of the park features (e.g., play area, comfort station) available
in the census tract.
City of Detroit (City of Detroit, 2016; J. Fulton,
personal communication, March 15, 2017)
Covariate Violent and non-violent crimes
per 1,000-population
(continuous)
A 1,000-population rate of violent and non-violent crimes for each
census tract during the 12 months prior to redevelopment (T1).
City of Detroit Open Data Portal (City of
Detroit, 2018)
Covariate Average blight fines per parcel
(continuous)
Total blight fine dollar amount (USD) is averaged per parcel for each
census tract during the 12 months prior to redevelopment (T1).
City of Detroit Open Data Portal (City of
Detroit, 2018)
Covariate Proportion less than 18 years of
age (continuous)
Proportion of children per census tract (B01001). 2011-2015 American Community Survey
(ACS) estimates (United States Census Bureau,
2016)
Covariate Proportion in poverty
(continuous)
Proportion residents falling below the FPL in the past 12 months
based on a ratio of income to poverty level per census tract (C17002).
2011-2015 American Community Survey
(ACS) estimates (United States Census Bureau,
2016)
Covariate Proportion of renter-occupied
households (continuous)
Proportion of renter-occupied housing tenure per census tract
(B25003).
2011-2015 American Community Survey
(ACS) estimates (United States Census Bureau,
2016)
Covariate Detroit Public Schools
Community District (DPSCD)
primary school (dichotomous)
Presence of a public Pre-K–12 grade school per census tract. Detroit Public Schools Community District
(Detroit Public Schools Community District,
2018)
Covariate Suburban Mobility Authority
for Regional Transportation
(SMART) public bus stop
(dichotomous)
Presence of a SMART bus stop per census tract. SMART; City of Detroit Open Data Portal
(City of Detroit, 2018; Suburban Mobility
Authority for Regional Transportation, 2018)
Covariate Non-motorized infrastructure
(dichotomous)
Presence of greenways (linear green trail) in the census tract. City of Detroit Open Data Portal (City of
Detroit, 2018)
Covariate Proportion of NHB residents
(continuous)
Proportion of self-reported NHB residents per census tract (B02001). 2011-2015 American Community Survey
(ACS) estimates (United States Census Bureau,
2016)
Page 103
88
Covariate Proportion of foreclosed
properties (continuous)
Proportion of tax foreclosures to parcels during a five-year period
(2011-2015) prior to redevelopment per parcel in the census tract.
(City of Detroit, 2018; Data Driven Detroit,
n.d.; Loveland Technologies, n.d.)
Covariate Proportion of vacant properties
(continuous)
Proportion of vacancy per census tract (B25002). 2011-2015 American Community Survey
(ACS) estimates (United States Census Bureau,
2016)
Covariate Population density (continuous) Total population divided by the tract size in square miles per census
tract (B01003).
2011-2015 American Community Survey
(ACS) estimates and Census TIGER products
(United States Census Bureau, 2016, 2017b)
Page 104
89
Valid Arm’s Length Residential Property Sale Price. All VAL from June 29, 2010 to
October 2, 2018 (n = 41,688) sales in Detroit were downloaded. Two datasets were obtained
through the Open Data portal, one describing the property sales history by parcel and another
detailing the size (square foot) of each parcel (City of Detroit, 2018). These datasets were
merged in SQL (“SQL 12.0.5207.0,” 2014) and the price per square foot was calculated. Once
geographically assigned to neighborhoods for the designated time period, the total number of
data points in the 89 census tracts decreased (n = 2,718).
Covariates. Based on the literature for property values, the following variables were
included as covariates: public school presence, public bus stop presence, census tract proportions
of NHB, proportion of tract below 100% of the FPL proportion of renter occupancy, age as the
ratio of adults to children, proportion of vacant units, population density, non-motorized
infrastructure (greenways), crime rate per 1,000-population, and blight fines per parcel (Cho,
Poudyal, & Roberts, 2008; Poudyal, Hodges, & Merrett, 2009). Though not indicated in the
previously mentioned literature, the proportion of tax foreclosures to parcels (2011-2015) were
also included as a covariate given the importance to the City of Detroit. Finally, the total park
acres and total park features for each census tract were included as covariates.
Data Analysis.
Extreme observations. The dependent variable, post-park redevelopment price per square
foot, was not found to be highly skewed. However, SAS reported extreme observations for the
following variables, which were all evident in highly skewed histograms: 1) sum park features in
one census tract; and 2) park size in acres in one census tract. These extreme observations were
removed to produce normally distributed data that can be interpreted based on the measure.
Page 105
90
Bivariate Analysis. The bivariate analysis detailed the relationships between all major
study variables as correlations. For the continuous variables, a Pearson correlation was
completed, and for the categorical variables, a polychoric correlation was used. This bivariate
analysis was used to determine the SEP variable by identifying what was most highly correlated
with the outcome while also being more highly correlated with the other possible SEP variables.
To account for changes in the VAL, the correlation of the outcome variables for five years (60
months) prior to the pre-redevelopment period was measured to examine whether factors
external to the analysis existed (e.g. a housing program encouraging buying).
Linear Regression. Interactions of the proportion of poverty, population density,
proportion of vacancy, nearby greenway, total available acres, and total available features were
tested.
The pre-test post-test non-equivalent group design to measure changes in Valid Arm’s
Length following redevelopment used a regression model with the proc reg procedure in SAS
9.4 64-bit for Windows (“SAS,” 2011). The subscript c indicated census tract. Given the spatial
nature of the data, a Moran’s I in ArcGIS 10.4.1 for Windows will test the regression residuals
for spatial autocorrelation. The formula was:
Page 106
91
𝑃𝑜𝑠𝑡 𝑉𝐴𝐿 𝑆𝑎𝑙𝑒𝑠 𝑃𝑟𝑖𝑐𝑒𝑐𝑗
= 𝛽0 + 𝛽1 𝑃𝑎𝑟𝑘 𝑟𝑒𝑑𝑒𝑣𝑒𝑙𝑜𝑝𝑚𝑒𝑛𝑡 𝑐𝑜𝑚𝑚𝑢𝑛𝑖𝑡𝑦𝑗 + 𝛽2 𝑃𝑟𝑒 𝑉𝐴𝐿 𝑠𝑎𝑙𝑒𝑠 𝑝𝑟𝑖𝑐𝑒𝑐
+ 𝛽3 𝑁𝐻𝐵 𝑝𝑟𝑜𝑝𝑜𝑟𝑡𝑖𝑜𝑛𝑐 + 𝛽4 𝑃𝑜𝑝𝑢𝑙𝑎𝑡𝑖𝑜𝑛 𝐷𝑒𝑛𝑠𝑖𝑡𝑦𝑐
+ 𝛽5 𝑉𝑎𝑐𝑎𝑛𝑐𝑦 𝑝𝑟𝑜𝑝𝑜𝑟𝑡𝑖𝑜𝑛𝑐 + 𝛽6 𝑅𝑒𝑛𝑡𝑒𝑟 𝑜𝑐𝑐𝑢𝑝𝑖𝑒𝑑 ℎ𝑜𝑢𝑠𝑒ℎ𝑜𝑙𝑑𝑠 𝑝𝑟𝑜𝑝𝑜𝑟𝑡𝑖𝑜𝑛𝑐
+ 𝛽7 𝐹𝑜𝑟𝑒𝑐𝑙𝑜𝑠𝑢𝑟𝑒 𝑝𝑟𝑜𝑝𝑜𝑟𝑡𝑖𝑜𝑛𝑐 + 𝛽8 𝑃𝑟𝑒 𝐵𝑙𝑖𝑔ℎ𝑡 𝐹𝑖𝑛𝑒𝑠𝑐 + 𝛽9 𝑃𝑟𝑒 𝐶𝑟𝑖𝑚𝑒𝑠𝑐
+ 𝛽10 𝐶ℎ𝑖𝑙𝑑𝑟𝑒𝑛 𝑝𝑟𝑜𝑝𝑜𝑟𝑡𝑖𝑜𝑛𝑐 + 𝛽11 𝑃𝑢𝑏𝑙𝑖𝑐 𝑠𝑐ℎ𝑜𝑜𝑙 𝑝𝑟𝑒𝑠𝑒𝑛𝑐𝑒𝑐
+ 𝛽12 𝑆𝑀𝐴𝑅𝑇 𝑏𝑢𝑠 𝑠𝑡𝑜𝑝𝑐 + 𝛽13 𝑁𝑜𝑛 𝑚𝑜𝑡𝑜𝑟𝑖𝑧𝑒𝑑 𝑖𝑛𝑓𝑟𝑎𝑠𝑡𝑟𝑢𝑐𝑡𝑢𝑟𝑒𝑐
+ 𝛽14 𝑃𝑎𝑟𝑘 𝑓𝑒𝑎𝑡𝑢𝑟𝑒𝑠𝑐 + 𝛽15 𝑃𝑎𝑟𝑘 𝑎𝑐𝑟𝑒𝑠𝑐 + 𝛽16 𝑃𝑜𝑣𝑒𝑟𝑡𝑦 𝑝𝑟𝑜𝑝𝑜𝑟𝑡𝑖𝑜𝑛𝑐 + 𝜖𝑐
Results
Table IV.2 includes descriptive statistics for all study variables.
Table IV.2. Summary Statistics
Variable N Percent Mean Standard
Deviation
Median Minimum Maximum
Post-park redevelopment price per
square foot
89
$6.67 $3.60 $6.00 $1.41 $22.05
Park redevelopment neighborhood by
tract
89 34.83%
Pre-park redevelopment price per
square foot
89
$6.88 $6.95 $5.58 $0.55 $58.50
Pre-park redevelopment crime per
1,000-population in census tract
84
44.38 36.73 51.01 0.00 160.63
Pre-average fine dollar amount per
parcel
89
$0.20 $0.14 $0.18 $0.00 $1.12
Proportion of census tract below 100%
of the FPL
89
0.42 0.11 0.42 0.09 0.70
Proportion of children in census tract 89
0.25 0.06 0.24 0.08 0.41
Non-Hispanic Black proportion in
census tract
89
0.82 0.26 0.94 0.01 1.00
Population density (per sq. mile) 89
5341.00 2557.00 5023.00 527.12 17395.00
Proportion of renter-occupied housing
units in census tract
89
0.49 0.14 0.47 0.16 0.99
Proportion of vacant units in census
tract
89
0.32 0.13 0.31 0.06 0.68
Foreclosure proportion of parcels in
census tract
89
0.15 0.07 0.15 0.01 0.41
Suburban Mobility Authority for
Regional Transportation (SMART)
public bus stop
89 25.71%
Detroit Public Schools Community
District (DPSCD) primary school
89 27.62%
Non-motorized infrastructure
(greenway)
89 33.33%
Page 107
92
Total features in census tract - removed
outlier
88
5.50 6.94 3.00 0.00 34.50
Total park size (acres) in census tract -
removed outlier
88
7.18 8.16 3.86 0.12 52.54
Bivariate Analysis. A bivariate analysis found that the VAL sales price was correlated
from the five-year pre- to the one-year pre-intervention. The bivariate analysis (Table IV.3) of
the study variables to the post price per square foot outcome found that park redevelopment was
not correlated with post price per square foot, indicating there is no difference between
neighborhoods with or without redeveloped parks. The correlation of the pre price per square
foot to the post price per square foot was highly (p < 0.001) correlated at 0.79. As the proportion
of NHB population increased, the post price per square foot decreased with highly significant
correlation (p < 0.01) at -0.29. Additionally, neighborhoods with more vacancy had lower (p <
0.01) post price per square foot (-0.35). Higher foreclosure rates were correlated with lower
price per square foot (-0.41, p < 0.001). Finally, the bivariate model found that having a Detroit
Public Schools Community District (DPSCD) primary school in the census tract was
significantly and positively (p < 0.05) correlated with the post price per square foot.
Page 108
93
Table IV.3. Bivariate Analysis of Park Redevelopment and VAL Residential Property Sales Price
1 2 3 4 5 6 7 8 9 10 11 12 13 14 15 16 17
1. Post-price per
square foot
--
2. Park
redevelopment
neighborhood by
tract
.16 --
3. Pre-price per
square foot
.79*** .04 --
4. Pre-park
redevelopment
crime per 1,000-
population in
census tract
.06 .03 .15 --
5. Pre-average fine
dollar amount per
parcel
-.02 .07 -.02 .28** --
6. Proportion of
census tract below
100% of the FPL
-.08 -.09 -.05 .06 .08 --
7. Proportion of
children in census
tract
.05 -.11 .02 -.22* .06 .24* --
8. Non-Hispanic
Black proportion
in census tract
-.29** .10 -.13 .22* .14 -.68*** -.51*** --
9. Population
density of census
tract (per sq. mile)
.02 .22* -.07 -.31** .04 -.01 .26* -.16 --
10. Proportion of
renter-occupied
housing units in
census tract
.18 -.02 .29** -.02 .29** .12 .30** -.18 -.06 --
11. Proportion of
vacant units in
census tract
-.35** -.23* -.24* .21 -.09 .24* -.28** .15 -.42*** -.01 --
12. Proportion of
foreclosed units in
census tract
-.41*** .11 -.34** -.02 -.06 -.30** -.15 .41*** .20* -.17 .10 --
Page 109
94
13. Suburban
Mobility Authority
for Regional
Transportation
(SMART) public
bus stop
.11 -.26* .11 .08 .06 .09 .09 -.03 -.18 .00 .09 -.15 --
14. Detroit Public
Schools
Community
District (DPSCD)
primary school
.23* .10 .15 -.07 .09 .01 .08 -.07 .22* .26* -.06 -.05 .03 --
15. Nearby non-
motorized
infrastructure
.16 .08 .06 .04 .07 .09 -.03 -.24* .07 .03 -.13 -.30** .14 .15 --
16. Total features
in census tract -
removed outlier
.08 -.10 .14 .15 -.08 -.01 .00 -.02 .06 -.06 -.16 -.06 .24* .12 .01 --
17. Total park size
(acres) in census
tract - removed
outlier
.21* -.02 .35** .17 -.08 -.03 .05 .10 -.08 .16 -.25* -.08 .19 .14 -.08 .58*** --
***p < 0.001, **p < 0.01, *p < 0.05
Page 110
95
Valid Arm’s Length Sales Models. Changes in VAL following redevelopment were
assessed in five distinct models building on related variables from previous models (Table IV.4).
The Moran’s I was not significant, indicating there was no autocorrelation of the residuals and
therefore the linear regression models were sufficient for reporting.
Model 1 presents the null model with the intercept of post-park redevelopment VAL
price per square foot. The model shows a significant intercept of an average of $6.67 price per
square foot in the study census tracts. As indicated in the bivariate model in the main
independent variable model, park redevelopment was not significant, showing no change in the
average post price per square foot. Park redevelopment remained insignificant with the inclusion
of the SEP variable of the proportion of residents below the FPL. Model 4 (R2 = 0.70) included
neighborhood covariates, notably the housing market disadvantage of foreclosure proportion. In
this model, similarly to previous models, park redevelopment remained insignificant. Model 5
(R2 = 0.76) included all study covariates and park redevelopment remained insignificant in its
relationship to post-park redevelopment price per square foot. It is important to note that the
study was underpowered with a power achieved of 0.58.
Finally, the interaction models indicated significant differences in park size (acres) in the
census tract and greenways. The effect of park redevelopment on VAL differed based on acres,
where once approximately five acres were available in the census tract, the VAL sales price
increased in tracts without park redevelopment and decreased in census tracts with park
redevelopment. The effect of park redevelopment on VAL also differed for a nearby greenway,
where neighborhoods with both park redevelopment and a nearby greenway had a higher VAL
sales price compared with neighborhoods that did not have park redevelopment but had a nearby
greenway.
Page 111
96
Table IV.4. Regression Models of Valid Arm's Length Residential Property Sales Price and Park Redeveloped, 2012-2015
Model 1: Null, n=89 Model 2: Main
Independent
Variable, n=89
Model 3: Main
Independent
Variable with SEP
Covariate, n=89
Model 4: Housing
Market Disadvantage
Covariates with SEP
Covariate, n=89
Model 5: Full Model,
n=75
β (SE) 95% CI β (SE) 95% CI β (SE) 95% CI β (SE) 95% CI β (SE) 95% CI
Intercept - Post-park redevelopment price per
square foot
6.67
(0.35)***
5.97,
7.37
6.45
(0.43)***
5.60,
7.31
5.05
(1.49)**
2.10,
8.00
3.47
(4.30)
-5.07,
12.02
5.05
(4.93)
-4.83,
14.94
Park redevelopment neighborhood
0.65
(0.75)
-0.84,
2.13
0.70
(0.75)
-0.79,
2.18
0.14
(0.45)
-0.76,
20.5
0.40
(0.57)
-0.75,
1.55
Covariates
Pre-park redevelopment price per square foot
8.95
(0.80)***
7.27,
10.54
8.39
(0.98)***
6.42,
10.36
Non-Hispanic Black proportion
0.13
(0.91)
-1.68,
1.93
-3.12
(1.30)*
-5.82, -
0.61
Log-transformed population density (per sq. mile)
-0.57
(1.03)
-2.62,
1.48
0.01
(1.24)
-2.47,
2.48
Proportion of vacant units in census tract
7.06
(1.93)**
-10.89, -
3.22
-7.17
(2.48)**
-12.13, -
2.22
Proportion of renter-occupied housing units in
census tract
2.98
(1.81)
-0.60,
6.57
2.81
(2.27)
-1.75,
7.36
Foreclosure proportion in census tract
-10.30
(2.63)**
-16.92, -
3.67
-7.43
(4.07)*
-15.58,
0.72
Pre-park redevelopment average fine dollar
amount per parcel
2.94
(2.17)
-1.40,
7.28
Pre-park redevelopment log-transformed crime
per 1,000-population in census tract
-0.04
(0.15)
-0.34,
0.26
Proportion of children in census tract
-7.91
(5.18)
-18.28,
2.47
Detroit Public Schools Community District
primary school
0.57
(0.57)
-0.58,
1.71
Suburban Mobility Authority for Regional
Transportation (SMART) public bus stop
0.62
(0.56)
-0.49,
1.73
Non-motorized infrastructure (greenway)
-0.12
(0.57)
-1.26,
1.01
Total features in census tract - removed outlier
-0.03
(0.08)
-0.02,
0.13
Total park size (acres) in census tract - removed
outlier
0.01
(0.03)
-0.06,
0.08
Page 112
97
Socioeconomic Position Covariate
Proportion of census tract below 100% of the FPL
3.30
(3.34)
-3.33,
9.93
2.07
(2.63)
-3.14,
7.29
2.56
(3.13)
-3.71,
8.83
R2
0.01 0.02 0.70 0.76
Adjusted R2
<0.001 <0.001 0.67 0.70
Power Achieved: 0.58
***p < 0.001, **p < 0.01, *p < 0.05
Page 113
98
Discussion
This study found no evidence of changes in VAL sales price of residential properties in
neighborhoods following park redevelopment. Further, findings indicated that park acreage and
greenway availability in the census tract were positively associated with VAL in neighborhoods
with and without park redevelopment. However, due to the extreme effects of post-
industrialism, subprime mortgages, and the housing crash on Detroit, the overall findings
indicate that more research is needed.
Valid Arm’s Length Sales Price. The bivariate analysis indicates that property sales
prices from the previous five-years and the T1 measure before the intervention did not change
significantly. Further, the lack of association of park redevelopment and VAL property sales
prices and its agreement with the linear regression model reinforces the finding that park
redevelopment and VAL are not associated.
Contrary to the study hypothesis, VAL sales prices did not increase following park
redevelopment in the neighborhood. This finding contrasts with previous studies. For example,
in both Milwaukee and Minneapolis, there were increases in housing prices following
redevelopment of land to parks (De Sousa et al., 2009). The same higher housing prices were
seen in Roanoke, Virginia, with buyers paying more in neighborhoods with neighborhood parks
(Poudyal, Hodges, & Merrett, 2009). However, the sites of these studies are not fully
comparable due to the more dramatic economic downturn of Detroit leading wherein too many
other factors are driving VAL which parks may be unable to counter. Further, it appears that
none of these studies specifically included foreclosures as a variable, though Poudyal and
colleagues (2009) used vacancy. this could indicate that foreclosures were not an important
contributor in their housing markets. The City of Detroit was hit particularly hard by the housing
Page 114
99
bubble’s burst in the late 2000s; coupled with vast population losses, vacancy, and the closure of
multiple automotive plants, the City of Detroit is an extreme example of urban devastation in the
United States (Sharkey, 2013; Sugrue, 2014). Therefore, the comparison to other neighborhoods
may be premature. Though Detroit and other post-industrial neighborhoods may continue to
engage in park redevelopment in expectation of predicted benefits such as increased property
values, this study produced null findings. In time, as Detroit recovers economically, this study
should be repeated to examine if the association of park redevelopment and VAL sales price
mirror other cities. In the meantime, cities such as Detroit should take caution before making
claims that parks are a catalyst for economic development when these effects may not yet exist.
Literature partially supports the observed interaction effect that increased park acres is
associated with decreased VAL sales prices. Anderson and West found that park size was a
disamenity, potentially due to the increased noise and traffic flow (Anderson & West, 2006).
However, their work did not compare neighborhoods experiencing park redevelopment with
other park neighborhoods, but the only the presence of any park. The finding here may indicate
that, in neighborhoods without park redevelopment, increasing park acres may create a more
desirable neighborhood reflected in VAL sales price. Extending the Anderson and West (2006)
conjecture, newer, larger parks may attract more noise and traffic and become a disamenity
reflected in VAL sales price. Somewhat contrary to previous inference, the interaction of
greenways with park redevelopment may indicate that neighborhoods with park redevelopment
that also offer other recreational options (i.e. greenways) see increased property values. In
neighborhoods without park redevelopment, the price remains stagnant even with other
recreational opportunities. This could encourage future development of greenways alongside
park redevelopment in neighborhoods, which has the potential to increase property values and in
Page 115
100
turn tax revenue. These interactions demonstrate the need for further research specifically on the
interactions between housing prices and park redevelopment.
Moreover, more research is needed in Detroit and similar cities that experienced
widespread economic devastation and are now recovering. While VAL sales prices did not
change following park redevelopment, a repeat analysis may show different results a few years
after additional park redevelopment and more economic recovery has occurred.
Limitations
There are multiple limitations in this study. Specifically, the City of Detroit did not have
many property sales, which a recent review included studies with samples over 15,000 (Brander
& Koetse, 2011) and could have contributed to the null findings. In addition to the low sampling
of property sales, this study may have been improved with greater than a 2:1 match which could
increase the sample size. However, as a natural study in a post-industrial city recovering from
the housing market collapse, this work provides a realistic view of the current condition. In
addition, defining the neighborhood using census tracts may not represent residents’ lived
experience of neighborhood boundaries. However, using other methods to define the
neighborhood in spatial terms (e.g., radial boundaries, census block group) creates similar
limitations. Therefore, using the census tracts provides findings as interpretable and realistic as
any other method.
A further limitation is the use of the ordinary least squares (OLS) model to asses property
values instead of the more common hedonic pricing regression method. Hedonic pricing is not
without its criticisms. Since hedonic regression is used to estimate buyer demand for goods
(e.g., properties), multiple variables are needed. Some of these variables can include whether the
property has an enclosed porch, hipped roof, fireplace, and outdoor impervious or soil surfaces
Page 116
101
(Cho et al., 2008; Ibes, 2015; Poudyal, Hodges, & Merrett, 2009). While the final estimate still
indicates the difference in property values based on a main independent variable (e.g., parks,
open space, brownfield remediation), the multiple additional variables needed to estimate buyer
demand creates a model that is not parsimonious and can create a challenging interpretation. In
contrast, the OLS model provides an easier, more parsimonious interpretation, which can be
replicated by municipal leaders. The matching procedure captures some neighborhood factors
and purchase preferences of buyers for parks.
Though this study has limitations, it adds to the literature by demonstrating that VAL
sales price in cities experiencing a recovery following large-scale economic devastation,
including bankruptcy, housing crisis, and post-industrialization may not mimic findings in
current literature.
Page 117
102
Chapter V
Discussion
The primary aim of this dissertation was to examine whether park redevelopment in a
Midwest urban city were associated with increased levels of LTPA, decreases changes in crime
and physical disorder, and increases in property values.
Summary of Findings
Chapter II examined the levels of LTPA in neighborhoods (census tract) with and without
park redevelopment. This study took advantage of a recent dataset, 500 Cities, produced by the
CDC Foundation and RWJF (Centers for Disease Control and Prevention, Robert Wood Johnson
Foundation, & CDC Foundation, 2016). Park redevelopment was positively associated with
LTPA in a bivariate analysis. However, in subsequent models with the neighborhood covariates
of population density and the proportion of vacant property units, the association between
redevelopment and LTPA was no longer significant. This same study found that park
redevelopment was not done in neighborhoods with a high percentage of poverty.
Chapter III examined the association between park redevelopment and crime rates per
1,000-population. We found that neighborhoods with at least one redeveloped park had no
significant differences in crime rates. The same insignificant association is the case in reported
violent crime rate at one-year post-redevelopment. This study also examined whether blight
fines per parcel was changed following park redevelopment; and we hypothesized that following
park redevelopment blight fine per parcel would decrease in neighborhoods with redeveloped
Page 118
103
parks. However, we found that blight fines per parcel increased in neighborhoods with
redeveloped parks. These findings suggest that park redevelopment is not associated with
changes in the crime rate but is in changes in blight fines per parcel.
Chapter IV examined valid arm’s length (VAL) property sales price, which, similarly to
Chapter III, was examined before and after park redevelopment. Though we hypothesized that
property sales price would increase following park redevelopment, no such association was
found. However, two interaction effects were significant. When neighborhoods had more than
five acres of parks available, neighborhoods (census tracts) with at least one redeveloped park
had a lower sales price compared to neighborhoods with no redeveloped parks. In addition, in
neighborhoods with nearby greenways, the presence of at least one redeveloped park was
associated with lower sales prices than neighborhoods without redeveloped parks.
These studies, when taken together, indicate that park redevelopment might increase
assessed blight fines per parcel, and under some instances positively impact housing prices.
Therefore, the central portion of the conceptual model based on the literature indicating that park
redevelopment is associated with built and social environments (i.e. crime, physical disorder, and
property values) and then associated with engagement in LTPA does not hold according to the
three papers.
Limitations
This dissertation work is not without limitations. First, PA engagement is achieved
through various means, not only in leisure time. Therefore, the data used in the literature
reviews in some cases include occupational physical activity8, transport physical activity9, and
8 Physical activity done in the primary location of the workplace or home. 9 Physical activity done with the primary purpose to travel between destinations (e.g., home to work).
Page 119
104
LTPA10 and do not disentangle the different kinds of PA. However, recent studies find that
LTPA engagement has increased beneficial effects compared to other forms of PA engagement
(Hallman, Birk Jørgensen, & Holtermann, 2017; Holtermann et al., 2013; Richard, Martin,
Wanner, Eichholzer, & Rohrmann, 2015). Therefore, focusing on LTPA and parks (which offer
the potential for LTPA) is a particularly important area of inquiry in public health.
More importantly, the LTPA dependent variable in Chapter II is a model-based measure
using demographics of the BRFSS survey. The use of a model-based measure introduces error
since the measure was not directly collected from respondents but is based on the modeling
assumptions of researchers. The researchers assumed that age, sex, race, education, and poverty
were the correlates to predict LTPA. Though the SAE methods were validated, other
sociodemographics and direct measures from the public could yield different findings.
Second, this dissertation utilized one definition of “neighborhood” though the definition
varies in literature. There is no universal standard in research to define a neighborhood in spatial
terms (Poudyal, Hodges, Tonn, et al., 2009). McCormack and Shiell (2011) found that studies
use various methods of defining neighborhoods including local areas, transportation zones,
census districts (e.g., tract, block group), and radial/network buffers. This dissertation uses
census tracts as the neighborhood boundary although the use of administrative boundaries –
while important for demographic data collection – may not represent the lived experience of
residents (Branas et al., 2011). However, since a census tract follows reasonable “visible and
identifiable features,” such as highways or rivers (United States Census Bureau (Commerce),
2018; United States Census Bureau, 2019), it is an approximate representation of a neighborhood
for research.
10Physical activity done in leisure-time away from school and work.
Page 120
105
Third, due to the timing of the data collection and the focus on the census tract, not the
park, as the unit of analysis, an assessment of pre- post- park quality could not be collected. The
reality is that not all parks are created equal (Rigolon, 2016; Wolch et al., 2014). In part, the
quality of a park is in the eye of the beholder. But in broader terms, natural features such as trees,
native plant species, and streams can create parks that are more welcoming and are rated of
higher quality (Joseph & Maddock, 2016a). In addition, the presence of equipment and features
that are in good (usable) condition typically increase park quality compared to others (Kaczynski
& Wilhelm Stanis, 2013). Further, there are characteristics that were beyond the scope of this
research, such as congestion, that impact use and quality (Wolch et al., 2014).
Fourth, while a strength of this work is to include objectively collected data which is
useful for municipal governments, the data is not without its limitations. Crime is underreported
in urban neighborhoods due to the “stop snitchin’” culture which encourages urban residents,
particularly African American residents, to not speak with the police, including not calling the
police if an issue arises (Smiley, 2015). Furthermore, Detroit is home to a large undocumented
immigrant population (American Immigration Council, 2017), and evidence shows that this
population rarely contacts local police for fear of deportation from Immigration and Customs
Enforcement (ICE) (Hacker et al., 2011). Lastly, this study used two categories of crime: 1) all
crime (violent/non-violent) and 2) violent crime. Multiple studies specified types of violent
crimes, property crimes, and nuisances instead of differentiating crime into two categories
(Bogar & Beyer, 2015).
Further, this work assumes that parks are a selling point for Detroit real estate buyers
without any qualitative interviewing to verify this assumption. While the proximity of parks is
important to the market in general (Poudyal, Hodges, & Merrett, 2009), this work assumes that
Page 121
106
Detroit buyers include parks in their decisions. Additionally, this work assumes that the City of
Detroit Parks and Recreation Redevelopment Plan was widely disseminated to residents and
potential residents to influence property values.
The use of objectively collected data has limitations. For instance, the City of Detroit
Data Portal was recently released (City of Detroit, 2018) and data prior to the opening of the
portal depended on a backlog of entry. An error in double-counting was acknowledged for crime
causing a spike, but no such double-counting errors were acknowledged for blight or VAL –
which does not mean that errors did not exist. Further, the geocoding of the latitude and
longitude data indicated that the locations of some crimes, blight fines, and VAL sales were
incorrect (e.g. geocodes for the Pacific Ocean and Antarctica).
The recreational spaces included in the dissertation are limited to spaces owned and
maintained by the City of Detroit, which means that school playgrounds and privately owned
spaces are not included. Not including these spaces may limit the spaces that have a relationship
with the outcomes. Future research could include other publicly owned spaces, such as schools,
greenways, and recreational centers. Further, public-private partnerships were intentionally
excluded from this analysis. As a first step to this research to assess the viability of the methods,
it was sufficient to analyze parks that are fully funded by the City of Detroit government and part
of their master plan.
Additionally, all three studies were underpowered. This was a possibility, since each
study is a natural experiment that takes advantage of a finite number of neighborhoods with park
redevelopment and data points. All findings must be interpreted with caution.
Finally, the study city for this dissertation (Detroit, Michigan, United States of America),
has a land area of 138.75 square miles (359.36 square kilometers) and publicly maintains over
Page 122
107
300 parks along with other recreational spaces. Given this, the work proposed here may not be
fully generalizable to neighborhoods that are smaller in area or more populous than the City of
Detroit. Even so, other post-industrial cities may learn lessons from the renaissance of built and
social environments in Detroit, with parks and recreation as a possible catalyst should they
consider redeveloping their recreation systems.
Directions for Future Research
Following the methods and findings of this dissertation, multiple opportunities for future
research were identified. The future impact of this dissertation work would be best evaluated
using longitudinal data to investigate whether park redevelopment influences LTPA engagement
in the longer term. Further, this research supports the need for a direct measure for LTPA. The
500 Cities Project is the only dataset, to my knowledge that provides census tract level data for
health behaviors. However, with its limited interpretability, it demonstrates the improvement of
a direct measure of citywide data could make over this model-based measure.
One such data set unavailable was a citywide measure of stormwater management issues
and remediation. The City of Detroit did not have timely data on stormwater management.
Ideally, cities experiencing stormwater management issues should have datasets of major flood
events that impact homes and neighborhoods, for instance flooding basements and streets that
prevent outdoor LTPA and potentially affect the quality of parks (e.g., increasing mud). As
storms get more severe, issues of stormwater management become more important for residents
(C. Tetteh, personal communication, February 28, 2019). As urban cities, Detroit in particular,
engage in expansive plans to redevelop parks, the redevelopment theme of stormwater
management infrastructure is widely emphasized (City of Detroit, 2016; City of Houston, 2015;
City of Seattle, 2017). Expanding the purposes of urban greenspaces and parks can be used as
Page 123
108
part of a redevelopment strategy to beautify neighborhoods, mitigate excess stormwater, and
address multiple ecosystem issues, including urban heat islands and air pollution (Larsen, 2015;
Meerow & Newell, 2017; Rigolon & Németh, 2018). Adequate stormwater management is
instrumental in creating healthy, sustainable neighborhoods.
In addition, data on stray dogs was unavailable. The Positive Action for Today’s Health
(PATH) trial in South Carolina hosted a series of focus groups of predominantly low-income,
African American attendees. The attendees were asked about barriers to participating in PA in
their community. In addition to crime, the respondents also stated that stray dogs, lighting, and
traffic were concerns and suggested interventions to alleviate these issues (D. K. Wilson et al.,
2013). It was estimated at one point that there were over 50,000 stray dogs roaming Detroit,
some of which have killed pets, bitten mail carriers, and mauled and killed children (Brand-
Williams & Fournier, 2015; Langton, 2017; Memmott, 2013; Spruill, 2018). One resident in a
Detroit neighborhood even stated, “I'm afraid for the kids and elderly (people) walking around
here…these vicious stray pit bulls are around attacking people (Langton, 2017).” While this is a
considerable problem in Detroit, no database is readily available to the general public of stray
dog collections or violent incidents due to various independent collectors (i.e., Health
Department, United States Post Office, Detroit Police Department), the possibility for vast errors
in data, and the potential for unwanted negative attention (Anonymous, personal communication,
February 8, 2019).
Further, future research using qualitative data could also create a more holistic picture
and potentially remove the current null findings. Limited previous research of blight, crime, and
property values has used both qualitative and quantitative data to tell a story from the aspect of
the City and the residents living there (De Sousa et al., 2009; Garvin, Cannuscio, et al., 2013).
Page 124
109
There are differences in subjective and objective data (Brownson, Hoehner, Day, Forsyth, &
Sallis, 2009; Ma, Dill, & Mohr, 2014) with municipal governments leaning more towards
objective data. In some cases there can be a disagreement between the two (Garvin, Cannuscio,
et al., 2013). Ideally, future work can couple qualitative and quantitative data to determine a
better dependent variables and additional covariates. For instance, there may be types of crime
(e.g., murders, robberies, thefts), times of day of incidences, and measurements besides rates
(e.g., continuous counts) that are most important to residents. Further, the same may be the case
for blight fines, with the multitude of types of blight fines, residents in qualitative studies may
indicate what types of violations impact their neighborhood more (e.g., illegal dumping,
overgrown grass, trash cans left out too long).
The next stage of this research plans to deepen the understanding of what kinds of
neighborhoods (e.g. those with more poverty) may benefit the most from park redevelopment;
along with using qualitative data to narrow research questions and dependent variables. Such
work requires larger data samples.
Implications
The research in this dissertation has important implications for future work in public
health, urban planning, and public policy nationwide. Answers to the research questions on
crime, blight, and VAL sales price inform the overarching goal of creating neighborhoods that
encourage LTPA. Previous research indicates that LTPA engagement can prevent or reduce
symptoms of obesity (Ferdinand et al., 2012; Sallis et al., 2012), CVD (Sallis et al., 2012),
diabetes (Loprinzi, 2015), mental health disorders (Orstad, McDonough, Klenosky, Mattson, &
Troped, 2017), and cancer (Haskell, Blair, & Hill, 2009), to name a few. This dissertation found
that park redevelopment in the short term is not associated with crime, blight, and VAL sales
Page 125
110
price, which all in the long-term has the potential to impact obesity, asthma, and mental health
(Corburn, 2004).
Historically, some of the earliest programs (e.g. zoning laws) in public health and urban
planning were successful because they focused cost-effective strategies to impact a specific
place, health of residents, and then be scaled up for more of society to benefit (Branas &
MacDonald, 2014). As time went on, public health professionals and urban planning
professionals began to part ways when public health began to focus more on individual health
outcomes and urban planning on economic development (Corburn, 2004). This separation of
professions may manifest itself in plans published by urban planning professionals that advertise
health-related outcomes, but not involving public health professionals (M. Elliott, personal
communication, January 30, 2017).
Given the emphasis on place the professions of public health and urban planning are
firmly intertwined. As urban planners publish master plans on park redevelopment, the
advertisement of health-related outcomes indicate that the professions of public health and urban
planning should share the responsibility of determining and evaluating the health-related
outcomes following redevelopment. Even though this dissertation overwhelmingly produced
null findings, if redevelopment plans advertise health-related outcomes, public health, public
policy, urban planning, other professionals, and the general public should work collaboratively in
identifying health-related outcomes towards eliminating health disparities (Corburn, 2004).
Further, this research demonstrates the benefits of using both statistical and spatial
methods to respond to research questions related to LTPA about the built and social
environments in the neighborhood. The use of spatial mapping is an increasingly effective and
easy-to-understand tool used to communicate neighborhood health issues and needs visually to
Page 126
111
lay audiences (Cromley et al., 2011; Glass, 2008; Mills & Curtis, 2008). In addition, as more
cities release data that is open and accessible to the public, innovative studies of this kind can be
easily replicated. The findings of this research encourage neighborhoods to not only use
perceived measures of crime and blight, which are limited to study specific neighborhoods, but
to use citywide data when available to tell a story that benefits a wider population. Therefore,
decision-makers and community leaders nationwide can mimic the spatial methods, adapt the
statistical methods as necessary, and use conclusions for future advocacy efforts.
Finally, for cities that are in the process of redevelopment, particularly post-industrial
cities, this research found that short-term changes in crime and VAL sales prices are not
associated with park redevelopment. Therefore, cities should take caution in advertising a
wealth of positive effects to residents’ that follow park redevelopment, such as economic
development and changes to crime since these are inconsistently supported in the literature and
produced null findings in this dissertation. As decision-makers continue the redevelopment of
parks, multidisciplinary teams with the inclusion of residents, should co-lead the planning efforts
to determine the best health-related outcomes, not exaggerate the benefits, and be transparent on
the length of time needed for the benefits to take shape.
Page 127
112
Literature Cited
Ainsworth, B. E., Haskell, W. L., Whitt, M. C., Irwin, M. L., Swartz, A. M., Strath, S. J., …
Leon, A. S. (2000). Compendium of physical activities: an update of activity codes and
MET intensities. Medicine and Science in Sports and Exercise, 32(9 Suppl), S498-504.
https://doi.org/10.1097/00005768-200009001-00009
American Immigration Council. (2017). Immigrants in Michigan. Washington DC.
Anderson, S. T., & West, S. E. (2006). Open space, residential property values, and spatial
context. Regional Science and Urban Economics, 36(6), 773–789.
https://doi.org/10.1016/j.regsciurbeco.2006.03.007
Anguelovski, I. (2016). From Toxic Sites to Parks as (Green) LULUs? New Challenges of
Inequity, Privilege, Gentrification, and Exclusion for Urban Environmental Justice. Journal
of Planning Literature, 31(1), 23–36. https://doi.org/10.1177/0885412215610491
ArcGIS 10.4.1 for Desktop. (2015). Redlands: Esri Inc.
Art, M. (2014). Community gardens to fight urban youth crime and stabilize neighborhoods.
International Journal of Child Health and Human Development, 7(3), 223–236.
https://doi.org/10.1093/aje/kwr273
Asmundson, G. J. G., Fetzner, M. G., Deboer, L. B., Powers, M. B., Otto, M. W., & Smits, J. A.
J. (2013). Let’s get physical: A contemporary review of the anxiolytic effects of exercise for
anxiety and its disorders. Depression and Anxiety, 30(4), 362–373.
https://doi.org/10.1002/da.22043
Bailey, Z. D., Krieger, N., Agénor, M., Graves, J., Linos, N., & Bassett, M. T. (2017). America:
Page 128
113
Equity and Equality in Health 3: Structural racism and health inequities in the USA:
evidence and interventions. The Lancet, 389(10077), 1453–1463.
https://doi.org/10.1016/S0140-6736(17)30569-X
Baldas, T. (2017, September 25). Detroit is once again the most violent city in America, FBI
says. Chief Craig disagrees. Detroit Free Press. Retrieved from
https://amp.freep.com/amp/700443001#referrer=https%3A%2F%2Fwww.google.com&am
p_tf=From %251%24s
BBC Research & Consulting. (2014). Southwest Detroit and Conner Creek Greenway Case
Study— Community and Economic Benefits of Bicycling. Denver.
Bentley, G. C., Mccutcheon, P., Cromley, R. G., Dean, M., Bentley, G. C., Mccutcheon, P., …
Dean, M. (2016). Race, class, unemployment, and housing vacancies in Detroit: an
empirical analysis. Urban Geography, 37(5), 785–800.
https://doi.org/10.1080/02723638.2015.1112642
Biles, R., Mohl, R. A., & Rose, M. H. (2014). Revisiting the urban interstates: Politics, policy,
and culture since world war II. Journal of Urban History, 40(5), 827–830.
https://doi.org/10.1177/0096144214533293
Biswas, A. (2012). Housing submarkets and the impacts of foreclosures on property prices.
Journal of Housing Economics, 21(3), 235–245. https://doi.org/10.1016/j.jhe.2012.05.002
Bogar, S., & Beyer, K. M. (2015). Green Space, Violence, and Crime: A Systematic Review.
Trauma, Violence, and Abuse, 17(2), 160–171. https://doi.org/10.1177/1524838015576412
Boggess, L. N., & Maskaly, J. (2014). The spatial context of the disorder – crime relationship in
a study of Reno neighborhoods. Social Science Research, 43, 168–183.
https://doi.org/10.1016/j.ssresearch.2013.10.002
Page 129
114
Boone, C. G., Buckley, G. L., Grove, J. M., & Sister, C. (2009). Parks and people: An
environmental justice inquiry in Baltimore, Maryland. Annals of the Association of
American Geographers, 99(4), 767–787. https://doi.org/10.1080/00045600903102949
Borney, N., & Gallagher, J. (2013, September 15). How Detroit went broke: The answers may
surprise you - and don’t blame Coleman Young. Detroit Free Press. Retrieved from
http://archive.freep.com/interactive/article/20130915/NEWS01/130801004/Detroit-
Bankruptcy-history-1950-debt-pension-revenue
Bracy, N. L., Millstein, R. A., Carlson, J. A., Conway, T. L., Sallis, J. F., Saelens, B. E., … King,
A. C. (2014). Is the relationship between the built environment and physical activity
moderated by perceptions of crime and safety? The International Journal of Behavioral
Nutrition and Physical Activity, 11(1), 24. https://doi.org/10.1186/1479-5868-11-24
Branas, C. C., Cheney, R. A., MacDonald, J. M., Tam, V. W., Jackson, T. D., & Ten Have, T. R.
(2011). A difference-in-differences analysis of health, safety, and greening vacant urban
space. American Journal of Epidemiology, 174(11), 1296–1306.
https://doi.org/10.1093/aje/kwr273
Branas, C. C., Kondo, M. C., Murphy, S. M., South, E. C., Polsky, D., & MacDonald, J. M.
(2016). Urban blight remediation as a cost-beneficial solution to firearm violence. American
Journal of Public Health, 106(12), 2158–2164. https://doi.org/10.2105/AJPH.2016.303434
Branas, C. C., & MacDonald, J. M. (2014). A Simple Strategy to Transform Health, All Over the
Place. Journal of Public Health Management and Practice, 20(2), 157–159.
https://doi.org/10.1097/PHH.0000000000000051.A
Branas, C. C., Rubin, D., & Guo, W. (2013). Vacant Properties and Violence in Neighborhoods.
ISRN Public Health, 2012, 246142. https://doi.org/10.5402/2012/246142
Page 130
115
Branas, C. C., South, E. C., Kondo, M. C., Hohl, B. C., Bourgois, P., Wiebe, D. J., &
MacDonald, J. M. (2018). Citywide cluster randomized trial to restore blighted vacant land
and its effects on violence, crime, and fear. Proceedings of the National Academy of
Sciences, 115(12), 2946–2951. https://doi.org/10.1073/pnas.1718503115
Brand-Williams, O., & Fournier, H. (2015, December 3). ‘They just ate him ,’ mom says about
dog attack on son. The Detroit News. Retrieved from
https://www.detroitnews.com/story/news/local/detroit-city/2015/12/03/owner-pit-bulls-
deadly-attack-still-custody/76714712/
Brander, L. M., & Koetse, M. J. (2011). The value of urban open space: Meta-analyses of
contingent valuation and hedonic pricing results. Journal of Environmental Management,
92(10), 2763–2773. https://doi.org/10.1016/j.jenvman.2011.06.019
Brawner, C. A., Churilla, J. R., & Keteyian, S. J. (2016). Prevalence of physical activity is lower
among individuals with chronic disease. Medicine and Science in Sports and Exercise,
48(6), 1062–1067. https://doi.org/10.1249/MSS.0000000000000861
Bronfenbrenner, U. (1979). The Ecology of Human Development: Experiments by Nature and
Design. Cambridge: Harvard University Press.
Brown, J. R., Morris, E. A., & Taylor, B. D. (2009). Planning for Cars in Cities: Planners,
Engineers, and Freeways in the 20th Century. Journal of the American Planning
Association, 75(2), 161–177. https://doi.org/10.1080/01944360802640016
Browning, M. H. E. M., & Rigolon, A. (2018). Do income, race and ethnicity, and sprawl
influence the greenspace-human health link in city-level analyses? Findings from 496 cities
in the United States. International Journal of Environmental Research and Public Health,
15(7). https://doi.org/10.3390/ijerph15071541
Page 131
116
Brownson, R. C., Hoehner, C. M., Day, K., Forsyth, A., & Sallis, J. F. (2009). Measuring the
built environment for physical activity: state of the science. American Journal of Preventive
Medicine, 36(4 Suppl), S99-123.e12. https://doi.org/10.1016/j.amepre.2009.01.005
Burns, G. (2013, April 24). 50 Detroit parks will not close with help of $14 million public-
private partnership. MLive. Retrieved from
http://www.mlive.com/news/detroit/index.ssf/2013/04/bing_50_detroit_parks_will_not.html
Carlson, S. A., Fulton, J. E., Pratt, M., Yang, Z., & Adams, E. K. (2015). Inadequate Physical
Activity and Health Care Expenditures in the United States. Progress in Cardiovascular
Diseases, 57(4), 315–323. https://doi.org/10.1016/j.pcad.2014.08.002
Cell, A., Rauh, A., Tan, X., Webb, J., Bochu, J., Stroud, J., & Tan, C. (2017). Understanding
Blight Ticket Compliance in Detroit.
Centers for Disease Control and Prevention. (2017a). 500 Cities: Local Data for Better Health.
Atlanta. Retrieved from https://www.cdc.gov/500cities/
Centers for Disease Control and Prevention. (2017b). 500 Cities: Local Data for Better Health.
Atlanta. Retrieved from https://www.cdc.gov/500cities/
Centers for Disease Control and Prevention. (2018). Behavioral Risk Factor Surveillance
System. Retrieved December 8, 2018, from https://www.cdc.gov/brfss/index.html
Centers for Disease Control and Prevention, Robert Wood Johnson Foundation, & CDC
Foundation. (2016). 500 Cities Project: Local Data for Better Health (Detroit, Michigan).
Cho, S. H., Poudyal, N. C., & Roberts, R. K. (2008). Spatial analysis of the amenity value of
green open space. Ecological Economics, 66(2–3), 403–416.
https://doi.org/10.1016/j.ecolecon.2007.10.012
Chrysochoou, M., Brown, K., Dahal, G., Granda-Carvajal, C., Segerson, K., Garrick, N., &
Page 132
117
Bagtzoglou, A. (2012). A GIS and indexing scheme to screen brownfields for area-wide
redevelopment planning. Landscape and Urban Planning, 105(3), 187–198.
https://doi.org/10.1016/j.landurbplan.2011.12.010
City of Detroit. Charter of the City of Detroit (2012). United States of America. Retrieved from
https://www.detroitmi.gov/Portals/0/docs/Publications/COD
Charter/2_29_2012_CharterDocument_2_1_WITHOUT_COMMENTARY_1.pdf
City of Detroit. (2016). 2016 PARKS AND RECREATION IMPROVEMENT PLAN:
EXPANDING RECREATION OPPORTUNITIES IN DETROIT NEIGHBORHOODS.
Detroit. Retrieved from http://www.detroitmi.gov/40neighborhoodparks
City of Detroit. (2018). City of Detroit - Open Data Portal. Retrieved April 25, 2018, from
https://data.detroitmi.gov/
City of Houston. (2015). HPARD Master Plan - Phase II: Park Sector Profiles. Houston.
City of Seattle. (2017). 2017 Parks and Open Space Plan. Retrieved from
http://www.seattle.gov/Documents/Departments/ParksAndRecreation/PoliciesPlanning/201
7Plan/2017ParksandOpenSpacePlanFinal.pdf
Cohen, D. A., Golinelli, D., Williamson, S., Sehgal, A., Marsh, T., & McKenzie, T. L. (2009).
Effects of Park Improvements on Park Use and Physical Activity. Policy and Programming
Implications. American Journal of Preventive Medicine, 37(6), 475–480.
https://doi.org/10.1016/j.amepre.2009.07.017
Cohen, D. A., Han, B., Isacoff, J., Shulaker, B., Williamson, S., Marsh, T., … Bhatia, R. (2015).
Impact of Park Renovations on Park Use and Park-Based Physical Activity. Journal of
Physical Activity and Health, 12(2), 289–295. https://doi.org/10.1123/jpah.2013-0165
Cohen, D. A., Marsh, T., Williamson, S., Derose, K. P., Martinez, H., Setodji, C., & McKenzie,
Page 133
118
T. L. (2010). Parks and physical activity: why are some parks used more than others?
Preventive Medicine, 50 Suppl 1, S9-12. https://doi.org/10.1016/j.ypmed.2009.08.020
Cohen, D. A., Marsh, T., Williamson, S., Golinelli, D., & McKenzie, T. L. (2012). Impact and
cost-effectiveness of family Fitness Zones: A natural experiment in urban public parks.
Health and Place, 18(1), 39–45. https://doi.org/10.1016/j.healthplace.2011.09.008
Cohen, D. A., McKenzie, T. L., Sehgal, A., Williamson, S., Golinelli, D., & Lurie, N. (2007).
Contribution of public parks to physical activity. American Journal of Public Health, 97(3),
509–514. https://doi.org/10.2105/AJPH.2005.072447
Corburn, J. (2004). Confronting the Challenges in Reconnecting Urban Planning and Public
Health. American Journal of Public Health, 94(4), 541–546.
Cromley, E., Kleinman, L. C., Ramos, M. A., Arniella, G., Viswanathan, N., Garel, M., &
Horowitz, C. R. (2011). A community-engaged approach to select geographic areas for
interventions to reduce health disparities. Progress in Community Health Partnerships,
5(3), 299–305. https://doi.org/10.1353/cpr.2011.0033.A
Cutts, B. B., Darby, K. J., Boone, C. G., & Brewis, A. (2009). City structure, obesity, and
environmental justice: an integrated analysis of physical and social barriers to walkable
streets and park access. Social Science & Medicine, 69(9), 1314–1322.
https://doi.org/10.1016/j.socscimed.2009.08.020
Data Driven Detroit. (n.d.). Detroit Foreclosures. Retrieved February 2, 2019, from
http://portal.datadrivendetroit.org/datasets?q=foreclosure&per_page=&page=&bbox=%7Bg
eo:box?%7D
De Sousa, C. A., Wu, C., & Westphal, L. M. (2009). Assessing the effect of publicly assisted
brownfield redevelopment on surrounding property values. Economic Development
Page 134
119
Quarterly, 23(2), 95–110. https://doi.org/10.1177/0891242408328379
Deng, L., Seymour, E., Dewar, M., & Manning Thomas, J. (2018). Saving Strong
Neighborhoods From the Destruction of Mortgage Foreclosures: The Impact of
Community-Based Efforts in Detroit, Michigan. Housing Policy Debate, 28(2), 153–179.
https://doi.org/10.1080/10511482.2017.1331366
Detroit Public Schools Community District. (2018). School Directory. Retrieved November 29,
2018, from https://www.detroitk12.org/site/Default.aspx?PageID=293
Dewar, M., & Manning Thomas, J. (2013). The City after Abandonment. Philadelphia:
University of Pennsylvania Press.
Ding, D., & Gebel, K. (2012). Built environment, physical activity, and obesity: what have we
learned from reviewing the literature? Health & Place, 18(1), 100–105.
https://doi.org/10.1016/j.healthplace.2011.08.021
Eisinger, P. (2014). Is Detroit dead? Journal of Urban Affairs, 36(1), 1–12.
https://doi.org/10.1111/juaf.12071
Environmental Protection Agency. (2016). Using a Total Environment Framework (Built,
Natural, Social Environments) to Assess Life-long Health Effects of Chemical Exposures.
Retrieved from https://www.epa.gov/research-grants/using-total-environment-framework-
built-natural-social-environments-assess-life-long
Esri. (2018). ArcGIS Online Logistics Services. Retrieved November 10, 2018, from
https://logistics.arcgis.com/arcgis/
Evenson, K. R., Wen, F., Hillier, A., & Cohen, D. A. (2013). Assessing the contribution of parks
to physical activity using global positioning system and accelerometry. Medicine and
Science in Sports and Exercise, 45(10), 1981–1987.
Page 135
120
https://doi.org/10.1249/MSS.0b013e318293330e
Federal Bureau of Investigation. (n.d.). Uniform Crime Reporting. Clarksburg. Retrieved from
https://ucr.fbi.gov/
Ferdinand, A. O., Sen, B., Rahurkar, S., Engler, S., & Menachemi, N. (2012). The relationship
between built environments and physical activity: a systematic review. American Journal of
Public Health, 102(10), e7–e13. https://doi.org/10.2105/AJPH.2012.300740
Fetzner, M. G., & Asmundson, G. J. G. (2015). Aerobic Exercise Reduces Symptoms of
Posttraumatic Stress Disorder: A Randomized Controlled Trial. Cognitive Behaviour
Therapy, 44(4), 301–313. https://doi.org/10.1080/16506073.2014.916745
Finley, N. (2014, December 27). Finley: More on the Two Detroits. The Detroit News. Retrieved
from http://www.detroitnews.com/story/opinion/columnists/nolan-finley/2014/12/24/nolan-
finley-two-detroits/20867721/
Fitzpatrick, K. M., Shi, X., Willis, D., & Niemeier, J. (2018). Obesity and place: Chronic disease
in the 500 largest U.S. cities. Obesity Research and Clinical Practice, 12(5), 421–425.
https://doi.org/10.1016/j.orcp.2018.02.005
Floyd, M. F., Taylor, W. C., & Whitt-Glover, M. C. (2009). Measurement of park and recreation
environments that support physical activity in low-income communities of color: highlights
of challenges and recommendations. American Journal of Preventive Medicine, 36(4
Suppl), S156-60. https://doi.org/10.1016/j.amepre.2009.01.009
Ford, E. S., Merritt, R. K., Heath, G. W., Powell, K. E., Washbum, R. A., Kriska, A., & Haile, G.
(1991). Physical Activity Behaviors in Lower and Higher Socioeconomic Status
Populations. American Journal of Epidemiology, 133(12), 1246–1256.
Gallagher, J. (2013). Revolution Detroit: Strategies for Urban Reinvention [E-reader version].
Page 136
121
Detroit: Painted Turtle.
Galster, G. (2001). On the Nature of Neighbourhood. Urban Studies, 38(12), 2111–2124.
https://doi.org/10.1080/00420980120087072
Garvin, E. C., Branas, C. C., Keddem, S., Sellman, J., & Cannuscio, C. C. (2013). More than just
an eyesore: local insights and solutions on vacant land and urban health. Journal of Urban
Health, 90(3), 412–426. https://doi.org/10.1007/s11524-012-9782-7
Garvin, E. C., Cannuscio, C. C., & Branas, C. C. (2013). Greening vacant lots to reduce violent
crime: a randomised controlled trial. Injury Prevention, 19(3), 198–203.
https://doi.org/10.1136/injuryprev-2012-040439
Gilderbloom, J. I., Riggs, W. W., & Meares, W. L. (2015). Does walkability matter? An
examination of walkability’s impact on housing values, foreclosures and crime. Cities, 42,
13–24. https://doi.org/10.1016/j.cities.2014.08.001
Gioielli, R. (2011). “We Must Destroy You to Save You”: Highway Construction and the City as
a Modern Commons. Radical History Review, 2011(109), 62–82.
https://doi.org/10.1215/01636545-2010-015
Glass, G. (2008). Geographic Information Systems for the People. Progress in Community
Health Partnerships: Research, Education, and Action, 2(1), 3–4.
https://doi.org/10.1353/cpr.2008.0003
Google. (n.d.). Google Maps. Retrieved from https://maps.google.com/
Gustat, J., Rice, J., Parker, K. M., Becker, A. B., & Farley, T. A. (2012). Effect of changes to the
neighborhood built environment on physical activity in a low-income African American
neighborhood. Preventing Chronic Disease, 9(1), E57. https://doi.org/E57 [pii]
Hacker, K., Chu, J., Leung, C., Marra, R., Pirie, A., Brahimi, M., … Marlin, R. P. (2011). The
Page 137
122
impact of Immigration and Customs Enforcement on immigrant health: Perceptions of
immigrants in Everett, Massachusetts, USA. Social Science & Medicine, 73(4), 586–594.
https://doi.org/10.1016/j.socscimed.2011.06.007
Hallman, D. M., Birk Jørgensen, M., & Holtermann, A. (2017). On the health paradox of
occupational and leisure-time physical activity using objective measurements: Effects on
autonomic imbalance. Plos One, 12(5), e0177042.
https://doi.org/10.1371/journal.pone.0177042
Han, B., Cohen, D. A., Derose, K. P., Li, J., & Williamson, S. (2018). Violent Crime and Park
Use in Low-Income Urban Neighborhoods. American Journal of Preventive Medicine,
54(3), 352–358. https://doi.org/10.1016/j.amepre.2017.10.025
Harding, J. P., Rosenblatt, E., & Yao, V. W. (2009). The contagion effect of foreclosed
properties. Journal of Urban Economics, 66(3), 164–178.
https://doi.org/10.1016/j.jue.2009.07.003
Haskell, W. L., Blair, S. N., & Hill, J. O. (2009). Physical activity: Health outcomes and
importance for public health policy. Preventive Medicine, 49(4), 280–282.
https://doi.org/10.1016/j.ypmed.2009.05.002
Hoehner, C. M., Brennan Ramirez, L. K., Elliott, M. B., Handy, S. L., & Brownson, R. C.
(2005). Perceived and objective environmental measures and physical activity among urban
adults. American Journal of Preventive Medicine, 28(2), 105–116.
https://doi.org/10.1016/j.amepre.2004.10.023
Holtermann, A., Marott, J. L., Gyntelberg, F., Søgaard, K., Suadicani, P., Mortensen, O. S., …
Schnohr, P. (2013). Does the Benefit on Survival from Leisure Time Physical Activity
Depend on Physical Activity at Work? A Prospective Cohort Study. PLoS ONE, 8(1).
Page 138
123
https://doi.org/10.1371/journal.pone.0054548
Humpel, N., Owen, N., & Leslie, E. (2002). Environmental Factors Associated with Adults ’
Participation in Physical Activity A Review. American Journal of Preventive Medicine,
22(3), 188–199. https://doi.org/10.1016/S0749-3797(01)00426-3
Ibes, D. C. (2015). A multi-dimensional classification and equity analysis of an urban park
system: A novel methodology and case study application. Landscape and Urban Planning,
137, 122–137. https://doi.org/10.1016/j.landurbplan.2014.12.014
Iceland, J., & Steinmetz, E. (2003). The Effects of Using Census Block Groups Instead of Census
Tracts When Examining Residential Housing Patterns. Retrieved from
www.census.gov/hhes/www/housing/resseg/pdf/unit_of_analysis.pdf
Ikonomova, V. (2018, November 14). Despite demolition efforts, blight spreads undetected
throughout Detroit’s neighborhoods: Left to rot. Detroit Metro Times.
Joassart-Marcelli, P. (2010). Leveling the playing field? Urban disparities in funding for local
parks and recreation in the Los Angeles region. Environment and Planning A, 42(5), 1174–
1192. https://doi.org/10.1068/a42198
Joseph, R. P., & Maddock, J. E. (2016a). Comparative Analysis of Five Observational Audit
Tools to Assess the Physical Environment of Parks for Physical Activity, 2016. Preventing
Chronic Disease, 13, 160176. https://doi.org/10.5888/pcd13.160176
Joseph, R. P., & Maddock, J. E. (2016b). Observational Park-based physical activity studies: A
systematic review of the literature. Preventive Medicine, 89, 257–277.
https://doi.org/10.1016/j.ypmed.2016.06.016
Kaczynski, A. T., & Wilhelm Stanis, S. A. (2013). COMMUNITY PARK AUDIT TOOL (
CPAT ) Last updated June 2012, (June).
Page 139
124
Karas, D. (2015). Highway to Inequity: The Disparate Impact of the Interstate Highway System
on Poor and Minority Communities in American Cities. New Visions for Public Affairs,
7(April), 9–21.
Kelly, C. M., Schootman, M., Baker, E. A., Barnidge, E. K., & Lemes, A. (2007). The
association of sidewalk walkability and physical disorder with area-level race and poverty.
Journal of Epidemiology and Community Health, 61(11), 978–983.
https://doi.org/10.1136/jech.2006.054775
Kondo, M. C., Morrison, C., Jacoby, S. F., Elliott, L., Poche, A., Theall, K. P., & Branas, C. C.
(2018). Blight abatement of vacant land and crime in New Orleans. Public Health Reports,
133(6), 650–657. https://doi.org/10.1177/0033354918798811
Kondo, M., Hohl, B., Han, S. H., & Branas, C. (2016). Effects of greening and community reuse
of vacant lots on crime. Urban Studies, 53(15), 3279–3295.
https://doi.org/10.1177/0042098015608058
Kozlowski, K. (2015, February 8). Crusader revives Detroit park, and a GM leader’s legacy. The
Detroit News, pp. 4–6. Retrieved from
https://www.detroitnews.com/story/news/local/wayne-county/2015/02/08/neighbor-revives-
detroit-park-gm-president-knudsen/23047283/
Langton, C. (2017, October 18). 5-year-old attacked by dog in Detroit neighborhood full of
aggressive strays, parents say. Fox 2 News (Detroit). Retrieved from
http://www.fox2detroit.com/news/local-news/5-year-old-attacked-by-dog-in-detroit-
neighborhood- full-of-aggressive-strays
Lapham, S. C., Cohen, D. A., Han, B., Williamson, S., Evenson, K. R., McKenzie, T. L., …
Ward, P. (2016). How important is perception of safety to park use? A four-city survey.
Page 140
125
Urban Studies, 53(12), 2624–2636. https://doi.org/10.1177/0042098015592822
Larsen, L. (2015). Urban climate and adaptation strategies. Frontiers in Ecology and the
Environment, 13(9), 486–492. https://doi.org/10.1890/150103
Lawman, H. G., Wilson, D. K., Van Horn, M. L., Resnicow, K., & Kitzman-Ulrich, H. (2011).
The Relationship between Psychosocial Correlates and Physical Activity in Underserved
Adolescent Boys and Girls in the ACT Trial. Journal of Physical Activity and Health, 8(2),
253–261. https://doi.org/10.1123/jpah.8.2.253
Liu, S. H., Liu, B., & Li, Y. (2018). Risk factors associated with multiple correlated health
outcomes in the 500 Cities Project. Preventive Medicine, 112(February), 126–129.
https://doi.org/10.1016/j.ypmed.2018.04.014
Livy, M., & Klaiber, H. A. (2013). Maintaining Public Goods: Household Valuation of New and
Renovated Local Parks. In Agricultural & Applied Economics Association’s 2013 AAEA &
CAES Joint Annual Meeting. Washington DC.
Loprinzi, P. D. (2015). Concurrent healthy behavior adoption and diabetic retinopathy in the
United States. Preventive Medicine Reports, 2, 591–594.
https://doi.org/10.1016/j.pmedr.2015.07.002
Loveland Technologies. (n.d.). Detroit Parcel Foreclosures. Retrieved February 2, 2019, from
https://detroit.makeloveland.com/us/mi/wayne/detroit#b=neighborhoods&t=overview
Ma, L., Dill, J., & Mohr, C. (2014). The objective versus the perceived environment: what
matters for bicycling? Transportation, 41(6), 1135–1152. https://doi.org/10.1007/s11116-
014-9520-y
McCormack, G. R., Rock, M., Toohey, A. M., & Hignell, D. (2010). Characteristics of urban
parks associated with park use and physical activity: A review of qualitative research.
Page 141
126
Health & Place, 16(4), 712–726. https://doi.org/10.1016/j.healthplace.2010.03.003
McCormack, G. R., & Shiell, A. (2011). In search of causality: a systematic review of the
relationship between the built environment and physical activity among adults. Int J Behav
Nutr Phys Act, 8, 125. https://doi.org/10.1186/1479-5868-8-125
McKenzie, T. L., & Cohen, D. A. (2006). Description and Procedures Manual. System for
Observing Play and Recreation in Communities, 13. Retrieved from
http://activelivingresearch.org/files/SOPARC_Protocols.pdf
MedCalc. (2018). Ostend.
Meerow, S., & Newell, J. P. (2017). Spatial planning for multifunctional green infrastructure:
Growing resilience in Detroit. Landscape and Urban Planning, 159, 62–75.
https://doi.org/10.1016/j.landurbplan.2016.10.005
Memmott, M. (2013, August 21). Detroit’s Stray Dog Epidemic: 50,000 Or More Roam The
City. NPR. Retrieved from https://www.npr.org/sections/thetwo-
way/2013/08/21/214151836/detroits-stray-dog-epidemic-50-000-or-more-roam-the-city
Michigan Department of Health and Human Services. (2015). 2014-2016 Michigan Behavioral
Risk Factor Survey.
Michigan Department of Health and Human Services. (2016). 2013-2015 Michigan Behavioral
Risk Factor Survey. Lansing.
Mills, J. W., & Curtis, A. (2008). Geospatial approaches for disease risk communication in
marginalized communities. Progress in Community Health Partnerships : Research,
Education, and Action, 2(1), 61–72. https://doi.org/10.1353/cpr.2008.0007
Nassauer, J. I., & Raskin, J. (2014). Urban vacancy and land use legacies: A frontier for urban
ecological research, design, and planning. Landscape and Urban Planning, 125, 245–253.
Page 142
127
https://doi.org/10.1016/j.landurbplan.2013.10.008
National Commission on Urban Problems. (1969). Building the American city: report of the
National Commission on Urban Problems to the Congress and to the President of the
United States. Washington, D.C.
Nehme, E. K., Oluyomi, A. O., Calise, T. V., & Kohl, H. W. (2016). Environmental Correlates
of Recreational Walking in the Neighborhood. American Journal of Health Promotion,
30(3), 139–148. https://doi.org/10.4278/ajhp.130531-QUAN-281
Office of Disease Prevention and Health Promotion. (2014). Social determinants of health.
Retrieved January 29, 2019, from https://www.healthypeople.gov/2020/topics-
objectives/topic/social-determinants-of-health
Orstad, S. L., McDonough, M. H., Klenosky, D. B., Mattson, M., & Troped, P. J. (2017). The
observed and perceived neighborhood environment and physical activity among urban-
dwelling adults: The moderating role of depressive symptoms. Social Science & Medicine,
190, 57–66. https://doi.org/10.1016/j.socscimed.2017.07.026
Orstad, S. L., McDonough, M. H., Stapleton, S., Altincekic, C., & Troped, P. J. (2017). A
Systematic Review of Agreement Between Perceived and Objective Neighborhood
Environment Measures and Associations With Physical Activity Outcomes. Environment
and Behavior, 49(8), 904–932. https://doi.org/10.1177/0013916516670982
Owen, N., Sugiyama, T., Eakin, E. E., Gardiner, P. A., Tremblay, M. S., & Sallis, J. F. (2011).
Adults’ Sedentary Behavior: Determinants and Interventions. American Journal of
Preventive Medicine, 41(2), 189–196. https://doi.org/10.1016/j.amepre.2011.05.013
Phelan, J. C., & Link, B. G. (2015). Is Racism a Fundamental Cause of Inequalities in Health?
Annual Review of Sociology, 41(1), 311–330. https://doi.org/10.1146/annurev-soc-073014-
Page 143
128
112305
Pickens, C. M., Pierannunzi, C., Garvin, W., & Town, M. (2018). Surveillance for Certain
Health Behaviors and Conditions Among States and Selected Local Areas — Behavioral
Risk Factor Surveillance System, United States, 2015 (Vol. 67). Atlanta.
Poudyal, N. C., Hodges, D. G., & Merrett, C. D. (2009). A hedonic analysis of the demand for
and benefits of urban recreation parks. Land Use Policy, 26(4), 975–983.
https://doi.org/10.1016/j.landusepol.2008.11.008
Poudyal, N. C., Hodges, D. G., Tonn, B., & Cho, S. H. (2009). Valuing diversity and spatial
pattern of open space plots in urban neighborhoods. Forest Policy and Economics, 11(3),
194–201. https://doi.org/10.1016/j.forpol.2009.02.007
Price, G. N. (2016). Broken windows and crime in development challenged urban areas:
Evidence from Jackson, Mississippi USA. The Journal of Developing Areas, 50(3), 209–
220. https://doi.org/10.1353/jda.2016.0116
Raleigh, E., & Galster, G. (2015). Neighborhood Disinvestment, Abandonment, And Crime
Dynamics. Journal of Urban Affairs, 37(4), 367–396. https://doi.org/10.1111/juaf.12102
Rao, M., Prasad, S., Adshead, F., & Tissera, H. (2007). The built environment and health.
Lancet, 370(9593), 1111–1113. https://doi.org/10.1016/S0140-6736(07)61260-4
Richard, A., Martin, B., Wanner, M., Eichholzer, M., & Rohrmann, S. (2015). Effects of
Leisure-Time and Occupational Physical Activity on Total Mortality Risk in NHANES III
According to Sex, Ethnicity, Central Obesity, and Age. Journal of Physical Activity &
Health, 12(2), 184–192. https://doi.org/10.1123/jpah.2013-0198
Ries, A. V., Gittelsohn, J., Voorhees, C. C., Roche, K. M., Clifton, K. J., & Astone, N. M.
(2008). The environment and urban adolescents’ use of recreational facilities for physical
Page 144
129
activity: A qualitative study. American Journal of Health Promotion, 23(1), 43–50.
https://doi.org/10.4278/ajhp.07043042
Rigolon, A. (2016). A complex landscape of inequity in access to urban parks: A literature
review. Landscape and Urban Planning, 153, 160–169.
https://doi.org/10.1016/j.landurbplan.2016.05.017
Rigolon, A., & Németh, J. (2018). What Shapes Uneven Access to Urban Amenities? Thick
Injustice and the Legacy of Racial Discrimination in Denver’s Parks. Journal of Planning
Education and Research. https://doi.org/10.1177/0739456X18789251
Ross, C. L., Orenstein, M., & Botchwey, N. D. (2014). Health Impact Assessment in the United
States. (C. L. Ross, M. Orenstein, & N. D. Botchwey, Eds.) (1st ed.). New York City:
Springer. https://doi.org/10.1017/CBO9781107415324.004
Rothstein, R. (2017). The Color of Law: A Forgotten History of How our Government
Segregated America [E-reader version]. New York City: Liveright.
Safransky, S. (2014). Greening the urban frontier: Race, property, and resettlement in Detroit.
Geoforum, 56, 237–248. https://doi.org/10.1016/j.geoforum.2014.06.003
Sallis, J. F., Cervero, R. B., Ascher, W., Henderson, K. A., Kraft, M. K., & Kerr, J. (2006). An
Ecological Approach To Creating Active Living Communities, 297–322.
https://doi.org/10.1146/annurev.publhealth.27.021405.102100
Sallis, J. F., Floyd, M. F., Rodríguez, D. A., & Saelens, B. E. (2012). Role of built environments
in physical activity, obesity, and cardiovascular disease. Circulation, 125(5), 729–737.
https://doi.org/10.1161/CIRCULATIONAHA.110.969022
Sallis, J. F., Slymen, D. J., Conway, T. L., Frank, L. D., Saelens, B. E., Cain, K., & Chapman, J.
E. (2011). Income disparities in perceived neighborhood built and social environment
Page 145
130
attributes. Health & Place, 17(6), 1274–1283.
https://doi.org/10.1016/j.healthplace.2011.02.006
Sampson, R. J., Morenoff, J. D., & Gannon-Rowley, T. (2002). Assessing “Neighborhood
Effects”: Social Processes and New Directions in Research. Annual Review of Sociology,
28(1), 443–478. https://doi.org/10.1146/annurev.soc.28.110601.141114
SAS. (2011). Cary: SAS Institute Inc.
Schuetz, J., Spader, J., & Cortes, A. (2016). Have distressed neighborhoods recovered? Evidence
from the neighborhood stabilization program. Journal of Housing Economics, 34, 30–48.
https://doi.org/10.1016/j.jhe.2016.07.003
Schulz, A. J., Israel, B. A., Mentz, G. B., Bernal, C. C., Caver, D., DeMajo, R., … Woods, S.
(2014). Effectiveness of a Walking Group Intervention to Promote Physical Activity and
Cardiovascular Health in Predominantly Non-Hispanic Black and Hispanic Urban
Neighborhoods: Findings From the Walk Your Heart to Health Intervention. Health
Education & Behavior, 42(2), 1–13. https://doi.org/10.1177/1090198114560015
Sharkey, P. (2013). Stuck in Place: Urban Neighborhoods and the End of Progress Toward
Racial Equality [E-reader version]. Chicago: University of Chicago Press.
Shultz, S. D., & King, D. A. (2001). The Use of Census Data for Hedonic Price Estimates of
Open-Space Amenities and Land Use. Journal of Real Estate Finance and Economics,
22(2–3), 239–252. https://doi.org/10.1023/A:1007895631071
Smart Growth America. (2017). Dangerous by Design 2016. Washington DC.
Smiley, C. J. (2015). From Silence to Propagation: Understanding the Relationship between
“Stop Snitchin” and “YOLO.” Deviant Behavior, 36(1), 1–16.
https://doi.org/10.1080/01639625.2014.883888
Page 146
131
Soltero, E. G., Hernandez, D. C., O’Connor, D. P., & Lee, R. E. (2015). Does social support
mediate the relationship among neighborhood disadvantage, incivilities, crime and physical
activity? Preventive Medicine, 72, 44–49. https://doi.org/10.1016/j.ypmed.2014.12.030
South, E. C., Kondo, M. C., Cheney, R. A., & Branas, C. C. (2015). Neighborhood blight, stress,
and health: a walking trial of urban greening and ambulatory heart rate. American Journal
of Public Health, 105(5), 909–913. https://doi.org/10.2105/AJPH.2014.302526
Southeast Michigan Council of Governments (SEMCOG). (2018a). Traffic Crash Data.
Retrieved December 7, 2018, from https://semcog.org/traffic-crash-data
Southeast Michigan Council of Governments (SEMCOG). (2018b). Traffic Crash Data.
Spruill, L. (2018, March 18). Detroit family searching for answers after stray pit bull enters yard
, attacks family dog. Click on Detroit (WDIV). Retrieved from
https://www.clickondetroit.com/news/detroit-family-searching-for-answers-after-stray-pit-
bull-enters-yard-attacks-family-dog-1
SQL 12.0.5207.0. (2014). Redmond: Microsoft Corporation.
Sreetheran, M., & van den Bosch, C. C. K. (2014). A socio-ecological exploration of fear of
crime in urban green spaces - A systematic review. Urban Forestry and Urban Greening,
13(1), 1–18. https://doi.org/10.1016/j.ufug.2013.11.006
Stalsberg, R., & Pedersen, A. V. (2018). Are differences in physical activity across
socioeconomic groups associated with choice of physical activity variables to report?
International Journal of Environmental Research and Public Health, 15(5).
https://doi.org/10.3390/ijerph15050922
Stuart, E. A. (2010). Matching Methods for Causal Inference: A Review and a Look Forward.
Statistical Science, 25(1), 1–21. https://doi.org/10.1214/09-STS313
Page 147
132
Stuart, E. A., & Rubin, D. B. (2008). Best practices in quasi-experimental designs: Matching
methods for causal inference. Best Practices in Quantitative Methods, 155–176.
https://doi.org/10.4135/9781412995627
Suburban Mobility Authority for Regional Transportation. (2018). Suburban Mobility Authority
for Regional Transportation (SMART) Schedules. Retrieved November 29, 2018, from
http://www.smartbus.org/
Sugrue, T. J. (1992). The Structures of Urban Poverty: The Reorganization of Space and Work in
Three Periods of American History. In M. B. Katz (Ed.), The “Underclass” Debate: Views
from History. Princeton: Princeton University Press.
Sugrue, T. J. (2014). The Origins of the Urban Crisis: Race and Inequality in Postwar Detroit
[E-reader version] (2nd ed.). Princeton: Princeton University Press.
Supreme Court of the United States. Buchanan v. Warley (1917).
Taylor, B. T., Fernando, P., Bauman, A. E., Williamson, A., Craig, J. C., & Redman, S. (2011).
Measuring the quality of public open space using google earth. American Journal of
Preventive Medicine, 40(2), 105–112. https://doi.org/10.1016/j.amepre.2010.10.024
Taylor, W. C., Franzini, L., Olvera, N., Carlos Poston, W. S., & Lin, G. (2012). Environmental
Audits of Friendliness toward Physical Activity in Three Income Levels. Journal of Urban
Health, 89(2), 296–307. https://doi.org/10.1007/s11524-011-9663-5
The National Criminal Justice Reference Service. (1968). Report of the National Advisory
Commission on Civil Disorders. Washington, D.C.
The Trust for Public Land. (2015). ParkScore 2015: Detroit, MI. Washington DC.
The Trust for Public Land. (2017a). ParkScore 2017: Detroit, MI. Washington DC. Retrieved
from http://parkscore.tpl.org/city.php?city=Detroit#sm.001s4ncqd1auvd5xssv135tfllslo
Page 148
133
The Trust for Public Land. (2017b). ParkScore Methodology. Retrieved December 15, 2017,
from http://parkscore.tpl.org/methodology.php#sm.0001kcbeq1aytebow2h1pwbpnf4fn
The Trust for Public Land. (2017c). The Trust for Public Land. Retrieved December 15, 2017,
from https://www.tpl.org
United States Census Bureau. (n.d.). American Fact Finder. Retrieved from
https://factfinder.census.gov/faces/nav/jsf/pages/index.xhtml
United States Census Bureau. (2000). Profile of General Population and Housing Characteristics:
2000 Demographic Profile Data. Retrieved March 31, 2019, from
http://factfinder.census.gov/faces/ tableservices/jsf/pages/productview.Xhtml?Src=cf
United States Census Bureau. (2010). Profile of General Population and Housing Characteristics:
2010 Demographic Profile Data. Retrieved March 31, 2019, from
http://factfinder.census.gov/faces/ tableservices/jsf/pages/productview.Xhtml?Src=cf
United States Census Bureau. (2016). U.S. Census Bureau, 2011-2015 American Community
Survey 5-Year Estimates. Washington DC. Retrieved from
https://factfinder.census.gov/faces/nav/jsf/pages/index.xhtml
United States Census Bureau. (2017a). QuickFacts Detroit city, Michigan. Washington DC.
Retrieved from
https://www.census.gov/quickfacts/table/PST045213/2622000/embed/accessible
United States Census Bureau. (2017b). Topologically Integrated Geographic Encoding and
Referencing (TIGER) Products. Retrieved March 31, 2017, from
https://www.census.gov/geo/maps-data/data/tiger.html
United States Census Bureau. (2017c). U.S. Census Bureau, 2012-2016 American Community
Survey 5-Year Estimates. Washington DC. Retrieved from
Page 149
134
http://factfinder.census.gov/faces/nav/jsf/pages/searchresults.xhtml?refresh=t
United States Census Bureau. (2019). Glossary. Retrieved July 31, 2019, from
https://www.census.gov/programs-
surveys/geography/about/glossary.html#par_textimage_13
United States Census Bureau (Commerce). (2018). Census Tracts for the 2020 Census - Final
Criteria. In Federal Register (83rd ed.). Washington DC.
United States of America. Fair Housing Act of 1968, Pub. L. No. 82 Statute 73 (1968). United
States of America. Retrieved from https://legcounsel.house.gov/Comps/civil68.pdf
United States of America. Fair Housing Act of 1968 (as amended), Pub. L. No. 82 Statute 73
(1988). United States of America. Retrieved from
http://www.fairhousingfirst.org/documents/fairhousingact.pdf
Wang, Y., Holt, J. B., Xu, F., & Zhang, X. (2018). Using 3 Health Surveys to Compare
Multilevel Models for Small Area Estimation for Chronic Diseases and Health Behaviors.
Preventing Chronic Disease, 1–9. https://doi.org/10.5888/pcd15.180313
Wang, Y., Holt, J. B., Zhang, X., Lu, H., Shah, S. N., Dooley, D. P., … Croft, J. B. (2017a).
Comparison of Methods for Estimating Prevalence of Chronic Diseases and Health
Behaviors for Small Geographic Areas: Boston Validation Study, 2013. Preventing Chronic
Disease, 14, 170281. https://doi.org/10.5888/pcd14.170281
Wang, Y., Holt, J. B., Zhang, X., Lu, H., Shah, S. N., Dooley, D. P., … Croft, J. B. (2017b).
Comparison of Methods for Estimating Prevalence of Chronic Diseases and Health
Behaviors for Small Geographic Areas: Boston Validation Study, 2013. Preventing Chronic
Disease, 14, 1–10. https://doi.org/10.5888/pcd14.170281
Wen, M., & Kowaleski-Jones, L. (2012). The Built Environment and Risk of Obesity in the
Page 150
135
United States: Racial-Ethnic Disparities. Health Place, 29(6), 997–1003.
https://doi.org/10.1016/j.biotechadv.2011.08.021.Secreted
Whitaker, S., & Fitzpatrick IV, T. J. (2013). Deconstructing distressed-property spillovers: The
effects of vacant, tax-delinquent, and foreclosed properties in housing submarkets. Journal
of Housing Economics, 22(2), 79–91. https://doi.org/10.1016/j.jhe.2013.04.001
Williams, D. R., Mohammed, S. A., Leavell, J., & Collins, C. (2010). Race, socioeconomic
status, and health: Complexities, ongoing challenges, and research opportunities. Annals of
the New York Academy of Sciences, 1186(1), 69–101. https://doi.org/10.1111/j.1749-
6632.2009.05339.x
Wilson, D. K., St George, S. M., Trumpeter, N. N., Coulon, S. M., Griffin, S. F., Wandersman,
A., … Brown, P. V. (2013). Qualitative developmental research among low income African
American adults to inform a social marketing campaign for walking. The International
Journal of Behavioral Nutrition and Physical Activity, 10(1), 33.
https://doi.org/10.1186/1479-5868-10-33
Wilson, J. S., & Kelly, C. M. (2011). Measuring the quality of public open space using google
earth: A Commentary. American Journal of Preventive Medicine, 40(2), 105–112.
https://doi.org/10.1016/j.amepre.2010.10.024
Wineman, J. D., Marans, R. W., Schulz, A. J., van der Westhuizen, D. L., Mentz, G. B., & Max,
P. (2014). Designing Healthy Neighborhoods: Contributions of the Built Environment to
Physical Activity in Detroit. Journal of Planning Education and Research, 34, 180–189.
https://doi.org/10.1177/0739456X14531829
Wolch, J. R., Byrne, J., & Newell, J. P. (2014). Urban green space, public health, and
environmental justice: The challenge of making cities ‘just green enough.’ Landscape and
Page 151
136
Urban Planning, 125, 234–244. https://doi.org/10.1016/j.landurbplan.2014.01.017
Wolch, J. R., Wilson, J., & Fehrenbach, J. (2005). Parks and Park Funding in Los Angeles: An
Equity-Mapping Analysis. Urban Geography, 26(February 2015), 4–35.
https://doi.org/10.2747/0272-3638.26.1.4
WXYZ-TV Detroit. (2014, June 6). Newly renovated Mt. Elliott Park and Pavilion opened today.
Retrieved from https://www.youtube.com/watch?v=aFzR9Z8dziE
Yang, Y., Diez-Roux, A. V., Auchincloss, A. H., Rodríguez, D. A., & Brown, D. G. (2012).
Exploring walking differences by socioeconomic status using a spatial agent-based model.
Health & Place, 18(1), 96–99. https://doi.org/10.1016/j.healthplace.2011.08.010
Zhang, X., Holt, J. B., Lu, H., Wheaton, A. G., Ford, E. S., Greenlund, K. J., & Croft, J. B.
(2014). Multilevel regression and poststratification for small-area estimation of population
health outcomes: A case study of chronic obstructive pulmonary disease prevalence using
the behavioral risk factor surveillance system. American Journal of Epidemiology, 179(8),
1025–1033. https://doi.org/10.1093/aje/kwu018
Zhang, X., Holt, J. B., Yun, S., Lu, H., Greenlund, K. J., & Croft, J. B. (2015). Validation of
Multilevel Regression and Poststratification Methodology for Small Area Estimation of
Health Indicators from the Behavioral Risk Factor Surveillance System. American Journal
of Epidemiology, 182(2), 127–137. https://doi.org/10.1093/aje/kwv002
Page 153
138
Appendix A
Table A.1. Phase I Parks
Park Address City
Council
District
Ground
Breaking
Completion
Date
Type Acres Improved
2006-2016
Capital Improvement
Budget
30th-Herbert 5000 30th 6 4/3/2017 6/1/2017 Playground 1.04 0 $250,000
Boyer 6203 W. Vernor 6 7/1/2016 11/1/2016 Playground 1.77 0 $450,000
Calimera 19493 Joann 3 7/1/2016 11/1/2016 Playground 4.42 0 $300,000
Cook 16001 Fenkell 1 5/9/2017 7/1/2017 Playground 2.77 0 $300,000
Cross 8134 Manor 7 7/1/2016 11/1/2016 Playground 1.65 1 $150,000
Diack 13889 Curtis 2 6/5/2017 8/1/2017 Playground 3.49 1 $450,000
Doan 9946 Prest 7 4/17/2017 6/1/2017 Playground 2.90 0 $350,000
Dueweke 4975 Sheridan 5 6/19/2017 9/1/2017 Playground 3.73 0 $450,000
Fields 16601 Florence 1 7/1/2016 11/1/2016 Playground 4.00 0 $250,000
Gordon 1935 Atkinson 5 3/20/2017 6/1/2017 Playground 1.08 0 $450,000
Gorham 19969 St. Mary 2 5/22/2017 10/1/2017 Playground 3.13 0 $300,000
Greene 9177 Robson 7 4/27/2017 6/1/2017 Playground 3.49 1 $250,000
Hackett 17236 Avon 1 6/5/2017 8/1/2017 Playground 3.18 0 $375,000
Hansen 542 Drexel 4 7/1/2016 11/1/2016 Playground 2.20 1 $400,000
Kemeny 2260 S. Fort 6 7/1/2016 11/1/2016 Playfield 21.92 0 $1,000,000
LaSalle 2380 S. LaSalle Blvd. 5 5/4/2017 10/1/2017 Park 3.84 0 $300,000
Latham 5082 Seneca 5 7/1/2016 11/1/2016 Playground 2.96 0 $225,000
Liuzzo 20053 Winthrop 2 7/1/2016 8/31/2016 Playground 2.49 0 $350,000
Luce-St. Louis 13490 St. Louis 3 5/24/2017 7/31/2017 Playground 2.19 0 $250,000
Mansfield-Diversey 7753 Rutherford 7 7/1/2016 11/1/2016 Playground 1.82 0 $350,000
Nagel 3100 Wabash 6 6/7/2017 8/31/2017 Playground 4.70 0 $300,000
O'Brien 11938 E. McNichols 4 7/19/2017 9/30/2017 Playground 1.45 0 $300,000
Phelps 9982 Sorrento 7 9/21/2017 8/1/2017 Playground 3.99 0 $300,000
Reid 20625 Santa Clara 1 5/22/2017 6/1/2017 Park 1.23 0 $200,000
Page 154
139
Richard Allen
(Nardin)
9516 W. Grand River 7 6/26/2017 9/1/2017 Park 5.18 0 $300,000
Sak 4322 Kinsman 6 4/10/2017 6/1/2017 Playground 1.13 0 $250,000
Scripps 3666 W. Grand River 6 5/30/2017 10/1/2017 Park 1.25 0 $450,000
Simmons 19450 Chapel 1 7/1/2016 11/1/2016 Playground 3.60 0 $500,000
Stewart (DPS-
Transfer)
12701 14th Street 5 7/6/2017 9/30/2017 Playground 5.57 0 $325,000
Tireman-Littlefield 8051 Littlefield 7 7/1/2016 11/1/2016 Playground 1.94 1 $150,000
Syracuse 19192 Syracuse 3 5/30/2017 8/1/2017 Playground 3.78 0 $300,000
Szafraniec 4513 Campbell 6 3/27/2017 5/1/2017 Playground 2.05 0 $275,000
Varier 15639 Thatcher 2 6/12/2017 8/1/2017 Playground 3.10 0 $200,000
Wells 20159 Griggs Ave. 2 7/1/2016 11/1/2016 Playground 3.89 0 $350,000
Yakisch 18160 Anglin 3 5/15/2017 7/1/2017 Playground 1.55 0 $250,000
Yates 2499 Blaine 5 6/5/2017 8/1/2017 Playground 2.36 0 $325,000
Page 155
140
Appendix B
Figure B.1 City of Detroit Parks
Page 156
141
Appendix C
Figure C.1 Paper I Tracts, 2006-2015
Page 157
142
Appendix D
Figure D.1 Paper I Tracts, 2012-2015
Page 158
143
Appendix E
Figure E.1 Paper II Tracts for Blight Outcome
Page 159
144
Appendix F
Figure F.1 Paper II Tracts for Crime Outcome
Page 160
145
Appendix G
Table G.1. Blight Violation Type
Violation Code Violation Description
22-2-16 Improperly stored or separated Solid Waste
22-2-17 Improper storage and separation of solid waste for collection day
22-2-18 Unapproved burning of waste
22-2-19 Unapproved burning of waste in open fire
22-2-20 Failure to remove dead animals
22-2-21 Failure to remove animal waste on public or private property
22-2-22 Bulk solid waste deposited more than 24 hours before designated time
22-2-23 Cuttings of brush, shrubbery, and tree branches
22-2-24 Infectious solid waste and other medical waste
22-2-25 Construction solid waste
22-2-38 Depositing domestic or commercial solid waste in containers owned, assigned to, or contracted for, by
other persons or premises
22-2-41 Improper placement of Courville containers at residential structures containing one, two, three or four
household units
22-2-42 Early placement of Courville Containers at residential structures with five or more household units
22-2-43 Improper placement of Courville container between collections
22-2-44 Improper placement of Courville containers for collection-commercial or residential
22-2-45 Violation of time limit for approved containers to remain at curbside - early or late
22-2-48 Portable containers: commercial establishments and industrial sites
22-2-49 Large movable or stationary containers; residential structures and commercial
22-2-53 Improper storage of containers between collection days
22-2-55 Improper location of containers for collection
22-2-56 Courville container left at curb early or improperly stored
22-2-61 Failure to secure City or Private solid waste collection containers and services
22-2-83 Dumping, storing or depositing solid waste on any publicly-owned property, or private property or
water, without a permit
22-2-84 Owner or operator responsible for removal of solid waste; nuisance; placement in large movable
container on private area of owner or operator's property, only, for eviction; tenant's personal property
to be disposed of in large movable container only; removal of large movable container required within
forty-eight (48) hours; owner, operator, or other person who fails to use a large movable container for
the disposal of tenant's personal property is subject to immediate issuance of a blight violation notice
22-2-85 Hazardous and medical waste
22-2-87 Failure to remove, or cause to be removed, and properly dispose of solid waste before vacating private
property or water
22-2-88 Duty of owner of vacant or occupied premises to keep premises, its sidewalks, and adjoining public
property free from solid waste, medical waste, and hazardous waste; evidence of ownership and
responsibility
22-2-91 Dumping or depositing solid waste from a motor vehicle
22-2-92 Solid waste haulers
22-2-93 Scrap tire haulers
22-2-94 Failure to transport and deliver scrap tires to proper disposal area or licensed transfer facility, or to use
vehicle or container that does not leak or spill
22-2-96 Deposit of solid waste or hazardous waste in receptacles along public highways or city streets
22-2-97 Dumping of solid, medical, or hazardous waste in public waters
Page 161
146
22-3-1 Unauthorized collection, distribution, and transportation of solid waste, medical waste, or hazardous
waste
22-3-2 Vehicle specifications and inspections
9-1-101 Accumulation of solid waste prohibited; owner; occupants
9-1-102 Grading and drainage
9-1-103 Driveways, parking spaces and lots, sidewalks, stairs, walkways, and similar areas of traverse; removal
of snow and ice from sidewalks
9-1-104 Weeds and plant growth
9-1-105 Rodent control and harborage; storage and handling of items, certification of buildings where food or
foodstuffs are stored or processed; alteration of buildings and rat-proofing
9-1-106 Exhaust vent(s) or other means one- or tow-family dwelling or commercial building
9-1-107 Accessory structures
9-1-108 Defective gate(s)
9-1-109 Failure to maintain swimming pool(s)
9-1-110 Inoperable motor vehicle(s)
9-1-111 Failure of owner to remove graffiti or maintain or restore property free of graffiti
9-1-112 Failure to remove recreation equipment or furniture one- or tow-family dwelling or commercial
building
9-1-113 Failure to maintain a vacant building or structure in accordance with the requirements of Section 9-1-
113 of the Detroit City Code: (1) - (12)
9-1-12 Responsibility for maintenance; violations
9-1-13 Vacant buildings, premises, and structures generally
9-1-14 Workmanship
9-1-16 Device, equipment, safeguard or system in good repair
9-1-18 Sell or transfer of one- or two-family dwelling, building, premise or structure without copy of pending
notice, order, violation notice or citation
9-1-201(a) Maintain exterior of one- or two-family dwelling, building, premises or commercial structure in good
repair, structurally sound or in a sanitary condition to prevent threat to the public health, safety or
welfare
9-1-204 Defective foundation wall(s) one- or two-family dwelling or commercial building
9-1-205 Defective exterior wall(s) one- or two-family dwelling or commercial building
9-1-206 Defective roof or drainage one- or two-family dwelling or commercial building
9-1-207 Defective decorative features
9-1-208 Failure to maintain overhang extension(s) one- or two-family dwelling or commercial building
9-1-209 Failure to maintain balcony, deck, porch, or stairway one- or two-family dwelling or commercial
building
9-1-210 Defective chimney(s) or tower(s) one- or two-family dwelling or commercial building
9-1-211 Defective handrails and guards
9-1-212 Defective door, skylight, or window frame(s) one- or two-family dwelling or commercial building
9-1-213 Defective glazing one- or two-family dwelling or commercial building
9-1-214 Defective window(s) or window hardware one- or two-family dwelling
9-1-215 Failure to provide approved insect screen(s) one- or two-family dwelling or commercial building
9-1-216 Defective door(s) one- or two-family dwelling or commercial building
9-1-217 Defective basement hatchways
9-1-218 Defective window(s) or window hardware of basement windows
9-1-221 Unlawful storage of items outside one- or two-family dwelling or commercial building
9-1-41 Failure to abate unsafe condition for Building, premises, structure(s), equipment or device(s)
Page 162
147
9-1-42 Failure to abate unlawful occupancy of Building, Premises or Structure - Emergency Order - Less than
5 stories
9-1-43(a) -
(Dwelling)
Failure to comply with an Emergency or imminent danger order concerning an unsafe or unsanitary
structure or unlawful occupancy (1 or 2 family dwelling)
9-1-43(a) -
(Dwelling)
Failure of owner of one- or two-family dwelling to comply with an emergency or imminent danger
order concerning an unsafe or unsanitary structure or unlawful occupancy
9-1-43(a) -
(Stories)
Failure of owner of a building with five (5) or more stories to comply with an emergency or imminent
danger order concerning an unsafe or unsanitary structure or unlawful occupancy
9-1-43(a) -
(Stories)
Failure to comply with an Emergency or imminent danger order concerning an unsafe or unsanitary
structure or unlawful occupancy (Buildings with five (5) or more stories)
9-1-43(a) -
(Structures)
Failure of owner of any other structure, except buildings with five (5) or more stories, to comply with
an emergency or imminent danger order concerning an unsafe or unsanitary structure or unlawful
occupancy
9-1-43(a) -
(Structures)
Fail to comply with an Emergency or imminent danger order concerning an unsafe or unsanitary
structure or unlawful occupancy (all other structures, except buildings with five (5) or more stories)
9-1-44 Not closing of unlawful and vacant buildings, premises, and structures
9-1-46 Imminent danger; emergency measures and safeguards; review of order
9-1-50 Requirement to register vacant buildings and structures; enforcement authority; establishment of annual
fee
Page 163
148
Appendix H
Table H.1. Types of Crime
Crime Type
1 *AGGRAVATED ASSAULT
2 *SEX OFFENSES
3 *HOMICIDE
4 *ROBBERY
5 ARSON
6 ASSAULT
7 BURGLARY
8 DAMAGE TO PROPERTY
9 DANGEROUS DRUGS
10 DISORDERLY CONDUCT
11 EXTORTION
12 FAMILY OFFENSE
13 FORGERY
14 FRAUD
15 GAMBLING
16 JUSTIFIABLE HOMICIDE
17 KIDNAPPING
18 LARCENY
19 LIQUOR
20 MISCELLANEOUS (“miscellaneous criminal offense”)
21 OBSTRUCTING JUDICIARY
22 OBSTRUCTING THE POLICE
23 OTHER (e.g., narcotic equipment violations, violation of controlled substance act, drunkenness, entry
without permission, embezzlement, trespassing, invasion of privacy, public nuisances, riot, possession of
drug paraphernalia)
24 OPERATING UNDER THE INFLUENCE OF INTOXICATING LIQUOR
25 RUNAWAY
26 SEX OFFENSES – OTHER (e.g., commercialized sex, nonforcible penetration)
27 SOLICITATION
28 STOLEN PROPERTY
29 STOLEN VEHICLE
30 WEAPONS OFFENSES
31 †ABORTION (Abortifacient – selling, manufacturing)
32 †CIVIL (Civil custodies – divorce and support; walk away from mental institution)
33 †ESCAPE (Fugitive, prison, youth home)
34 †IMMIGRATION (“Illegal entry”)
35 †MILITARY (AWOL)
36 †MURDER/INFORMATION (Information)
37 †Traffic (Accidents; invalid insurance)
*Violent crimes based on FBI Uniform Crime Reporting (Federal Bureau of Investigation, n.d.)
† Additional crime types prior to December 6, 2016 (City of Detroit, 2018)
Page 164
149
Appendix I
Figure I.1 Paper III Tracts