60
Sanitation Needs Assessment 2015-2019 August 2014 USDP-R-PIU.T-10083 USDP Urban Sanitation Development Program
| Date post: | 03-Feb-2018 |
| Category: |
Documents |
| Upload: | trinhkhanh |
| View: | 217 times |
| Download: | 2 times |
Sanitation Needs Assessment 2015-2019
August 2014
USDP-R-PIU.T-10083
USDP Urban Sanitation Development Program


Urban Sanitation Development Program
Sanitation Needs Assessment 2015-2019
August 2014
USDP-R-PIU.T-10083


Urban Sanitation Development Program Sanitation Needs Assessment 2015-2019
i
CONTENTS
CONTENTS ........................................................................................................................................................ I
LIST OF ANNEXES .............................................................................................................................................. I
LIST OF FIGURES ................................................................................................................................................ I
LIST OF TABLES ................................................................................................................................................ II
LIST OF ABBREVIATIONS ................................................................................................................................. III
1. INTRODUCTION ....................................................................................................................................... 1
2. GENERAL APPROACH AND METHODOLOGY ............................................................................................ 2
2.1. Wastewater collection & treatment (WWT) ..................................................................................... 2
2.2. Municipal solid waste infrastructure: ............................................................................................... 7
2.3. Drainage infrastructure: ................................................................................................................. 12
2.4. Budget divisions per activity, government and department ........................................................... 12
3. RESULTS ................................................................................................................................................ 14
3.1. Introduction .................................................................................................................................... 14
3.2. Total sanitation budget requirements ............................................................................................ 14
3.3. Development of facilities ................................................................................................................ 19
3.3.1. Development of WWT facilities ....................................................................................... 19 3.3.2. Development of MSW facilities ....................................................................................... 22
3.4. Provincial investments (2015-2019)................................................................................................ 25
4. CONCLUSIONS ....................................................................................................................................... 35
5. REFERENCES .......................................................................................................................................... 36
6. COLOPHON ............................................................................................................................................ 37
List of Annexes
Annex 1 Wastewater treatment infrastructure .............................................................................. 40
Annex 2 Municipal solid waste ....................................................................................................... 44
Annex 3 Drainage infrastructure ..................................................................................................... 50
List of Figures
Figure 1 Developments of urban and rural households with access to wastewater facilities .......................... 2
Figure 2 Developments of poor and non-poor households with access to wastewater facilities
(2006-2014)......................................................................................................................................... 3
Figure 3 Waste water system type in Java and Madura islands ....................................................................... 6
Figure 4 Applied WWT investment costs .......................................................................................................... 7
Figure 5 Urban and rural households, whose waste is managed properly (2010) ........................................... 8
Figure 6 Specific price development of first and subsequent landfill cells with size of the landfill ............... 10
Figure 7 Specific investment prices per type of area (urban/rural) and management (3R or rural). ............. 11
Figure 8 Specific running costs per type of area (urban/rural) and management (3R or rural). .................... 11

Urban Sanitation Development Program Sanitation Needs Assessment 2015-2019
ii
List of Tables
Table 1 Relative number of households with access to wastewater facilities in 2006-2010 .......................... 3
Table 2 Selection criteria for wastewater facilities per type of area features ................................................ 4
Table 3 Planned interventions for MSW .......................................................................................................... 9
Table 4 Applied drainage prices .................................................................................................................... 12
Table 5 Budget requirements per activity and origin of sources and explanation on type of activity
(an extended version is presented in the annex).............................................................................. 13
Table 6 Summary figures: Scenario 1 ............................................................................................................ 15
Table 7 Scenario 1: 100% access by the end of 2019 .................................................................................... 16
Table 8 Scenario 2: 75% access by the end of 2019 ...................................................................................... 17
Table 9 Scenario 3: 75% of budget compared to a 100% access scenario by the end of 2019 ..................... 18
Table 10 Scenario 1: Development of WWT systems cumulative ................................................................... 19
Table 11 Scenario 1: Development of WWT systems per 5 years ................................................................... 19
Table 12 Scenario 1: Development of WWT systems per 5 years per type of Kab/kot ................................... 19
Table 13 All scenarios: applied number of households served per type of Kab/Kot ...................................... 20
Table 14 Scenario 2: Development of WWT systems cumulative ................................................................... 20
Table 15 Scenario 2: Development of WWT systems per 5 years ................................................................... 20
Table 16 Scenario 2: Development of WWT systems per 5 years per type of Kab/kot ................................... 20
Table 17 Scenario 3: Development of WWT systems per 5 years per type of Kab/kot ................................... 21
Table 18 Scenario 3: Development of WWT systems per 5 years ................................................................... 21
Table 19 Scenario 3: Development of WWT systems per 5 years per type of Kab/kot ................................... 21
Table 20 Scenario 1: Development of MSW systems cumulative ................................................................... 22
Table 21 Scenario 1: Development of MSW systems per 5 years ................................................................... 22
Table 22 Scenario 1: Development of MSW systems per 5 years per type of Kab/kot ................................... 22
Table 23 Scenario 2: Development of MSW systems cumulative ................................................................... 23
Table 24 Scenario 2: Development of MSW systems per 5 years ................................................................... 23
Table 25 Scenario 2: Development of MSW systems per 5 years per type of Kab/kot ................................... 23
Table 26 Scenario 3: Development of MSW systems cumulative ................................................................... 24
Table 27 Scenario 3: Development of MSW systems per 5 years ................................................................... 24
Table 28 Scenario 3: Development of MSW systems per 5 years per type of Kab/kot ................................... 24
Table 29 Scenario 1: Development of systems 2015-2019 per province (all values in billion Rp) .................. 26
Table 30 Scenario 1. Budget WWT development for poor households (2015-2019) ...................................... 27
Table 31 Scenario 1: Budget required for MSW 3R station (2015-2019) ........................................................ 28
Table 32 Scenario 2: Development of systems 2015-2019 per province (all values in billion Rp) .................. 29
Table 33 Scenario 2: Budget WWT development for poor households (2015-2019) ...................................... 30
Table 34 Scenario 2: Budget required for MSW 3R station (2015-2019) ........................................................ 31
Table 35 Scenario 3: Development of systems 2015-2019 per province (all values in billion Rp) .................. 32
Table 36 Scenario 3: Budget WWT development for poor households (2015-2019) ...................................... 33
Table 37 Scenario 3: Budget required for MSW 3R station (2015-2019) ........................................................ 34
Urban Sanitation Development Program Sanitation Needs Assessment 2015-2019
iii
List of Abbreviations
ADEKSI : Asosiasi DPRD Kota Seluruh Indonesia (Association of Indonesian Municipal Councils)
AHL : Advocacy and Horizontal Learning
AKKOPSI : Aliansi Kabupaten/Kota Peduli Sanitasi
AKSANSI : Asosiasi KSM Sanimas Indonesia Seluruh Indonesia
APEKSI : Asosiasi Pemerintah Kota Seluruh Indonesia (Association Indonesian Municipalities)
APKASI : Asosiasi Pemerintah Kabupaten Seluruh Indonesia (Association of Regency Local
Government in Indonesia)
APPSI : Asosiasi Pemerintah Provinsi Seluruh Indonesia
AMPL : Air Minum dan Penyehatan Lingkungan (Water Supply and Sanitation)
BPS : Buku Putih Sanitasi (Sanitation White Book)
CF : City Facilitator
CSR : Corporate Social Responsibility
CSS : City Sanitation Strategy
EHRA : Environment and Health Risk Assessment
EKN : Embassy the Kingdom of the Netherlands
GOI : Government of Indonesia
KAK : Kerangka Acuan Kerja (Term of Reference/ToR)
KSAN : Konferensi Sanitasi dan Air Minum Nasional (National Sanitation and Water Conference)
MGDs : Millenium Development Goals
MonEv : Monitoring and Evaluation
MPS : Memorandum Program Sanitasi (Memorandum Program Sanitation)
MPW : Ministry of Public Works
NAWASIS : National Water and Sanitation Information System
NSCR : National Sanitation City Rating
PF : Provincial Facilitator
PIU : Programme Implementation Unit
PIU-AE : Programme Implementation Unit Advocacy and Empowerent
PIU-IF-CBT : Programme Implementation Unit Institutional and Funding Capacity Building and Training
PIU-T : Programme Implementation Unit Technical
PMU : Programme Management Unit
PPLP : Pengembangan Penyehatan Lingkungan Permukiman
PU : Pekerjaan Umum (Public Works)
POKJA : Kelompok Kerja (Working group)
PTT : POKJA Training Team
PPSP : Percepatan Pembangunan Sanitasi Permukiman (Accelerated Sanitation Development for
Human Settlements)
Prosda : Provincial Sanitation Development Adviser
UC-AE : USDP Cell at Programme Implementation Unit Advocacy and Empowerent
UC-IF-CBT : USDP Cell at Programme Implementation Unit Institutional and Funding Capacity Building
and Training
UC-PMU : USDP Cell at Programme Management Unit
UC-T : USDP Cell at Programme Implementation Unit Technical
QA : Quality Assessment
Rakernas : Rapat Kerja Nasional
Rp : Rupiah
SanDG : Sanitation Donor Group
sAIIG : Australia Indonesia Infrastructure Grants For Sanitation
Satker : Satuan Kerja

Urban Sanitation Development Program Sanitation Needs Assessment 2015-2019
iv
SE : Surat Edaran (Circular Letter)
SK : Surat Keputusan (Decision Letter)
SPM : Standar Pelayanan Minimum (Minimum Services Standard)
SPSS : Statistic Package for Social Science
SSK : Strategi Sanitasi Kota (City Sanitation Strategy)
STBM : Sanitasi Total Berbasis Masyarakat (Community Led Total Sanitation/CLTS)
SWOT : Strength Weakness Opportunity Threat
ToR : Term of Reference
ToT : Training of Trainer
Tupoksi : Tugas Pokok dan Fungsi
USDP : Urban Sanitation Development Program
WATSAN : Water and Sanitation

Urban Sanitation Development Program Sanitation Needs Assessment 2015-2019
1
1. Introduction
In this report an assessment is presented on the sanitation funding and facilities required in the
period of 2015-2019. This report is prepared in the light of the RPJMN 2015-2019 and could serve as
an input for the PPSP-2.
The Government of Indonesia (GoI) aims to provide all people with basic infrastructure (housing,
electricity, water supply and sanitation) by the end of 2019. In view of the current access to
sanitation, funding availability and institutional status, these goals are certainly ambitious. Therefore
USDP is requested to provide two alternative assessments, in addition to the scenario with 100%
access by 2019.
1. A first alternative entails a minimum scenario in which a 75% access target for wastewater and
MSW collection and treatment is reached by 2019.
2. A second alternative assumes that 75% of the budget of the 100% scenario is available for the
period until 2019.
Thus, three scenarios are compared in this report.

Urban Sanitation Development Program Sanitation Needs Assessment 2015-2019
2
2. General approach and methodology
The general approach for wastewater and solid waste is to provide access for those people that do
not have access to these facilities at the start year of the RPJMN 2015, taking into consideration
population growth, urbanization, poverty as well as improvement of urban features (for wastewater
services). Population development and growth follows the recently published Proyeksi Penduduk
Indonesia 2010-2035 (BPS, 2013). For the three sub-sectors (wastewater, solid waste and drainage)
the assessment is based on the approach as presented in this chapter. For each of these sub sectors
additional information is provided in the three Annexes.
2.1. Wastewater collection & treatment (WWT)
Access end of 2014:
Access to improved wastewater facilities in 2010 were reported as 56% (SUSENAS 2010). With
ongoing improvements, intermediate values (presented by PU) show a steady increase of these
values. By the middle of 2013 access had increased beyond 58%. In this assessment it is assumed
that overall access will have increased to 60% by the end of 2014 (predominantly septic tanks).
Based on urban and rural data (available at Kab/Kota level) the urban access in the beginning of
2015 is expected to be 76% and the rural access 42%. In addition, the poverty level of households is
taking into consideration. The figure below shows the reported 2006, 2010 (obtained from BPS) and
assessed1 end of 2014 access data urban and rural areas and poor and non-poor households. The
major part of these people is served by on-site systems. In addition it is assessed that towards the
end of 2014 approximately 5,000 community based systems will be constructed, serving around 1%
of the total population. It is further estimated that less than 0.5% of the total population is served by
centralized systems. In 2013 there were 138 IPLT installations of which only 88 were in operation2.
Figure 1 Developments of urban and rural households with access to wastewater facilities
1 In this assessment we have assumed that the level of poverty in the end of 2014 is the same as in 2010 for the urban and
rural areas 2 Data obtained from PPLP, PU in 2013
-
10,000,000
20,000,000
30,000,000
40,000,000
50,000,000
60,000,000
70,000,000
2006-total
2010-total
2014-total
2006-Urban
2010-Urban
2014-Urban
2006-Rural
2010-Rural
2014-Rural
Developments of absolute number of households (urban and rural) with indicated type of wastewater facility
RURAL Improved
URBAN-improved
RURAL unimproved
URBAN-unimproved
RURAL-OD
URBAN-OD

Urban Sanitation Development Program Sanitation Needs Assessment 2015-2019
3
Figure 2 Developments of poor and non-poor households with access to wastewater facilities (2006-2014)
Table 1 Relative number of households with access to wastewater facilities in 2006-2010
Relative number of household with access
poor total non-poor total urban total Rural total
2006 2010 2014 2006 2010 2014 2006 2010 2014 2006 2010 2014
Open defecation
40% 35% 32% 21% 17% 15% 10% 9% 8% 36% 31% 29%
Unimproved 43% 29% 26% 40% 23% 21% 35% 18% 16% 44% 30% 28%
Improved 18% 36% 42% 39% 61% 64% 54% 73% 76% 21% 39% 42%
Relative number of household with access
urban rural urban rural
poor poor poor poor poor poor non-poor
non-poor
non-poor
non-poor
non-poor
non-poor
2006 2010 2014 2006 2010 2014 2006 2010 2014 2006 2010 2014
Open defecation
25% 23% 20% 44% 42% 39% 9% 7% 6% 32% 27% 26%
Unimproved 40% 22% 20% 44% 32% 29% 35% 17% 16% 44% 30% 28%
Improved 35% 55% 60% 13% 26% 32% 56% 75% 78% 23% 43% 46%
Targets:
For the three scenario’s targets are defined:
1. Scenario 1_100% access: both urban and rural access will be 100% in 2019
2. Scenario 2_75% access: Urban access will be 82% and rural access 67%; resulting in an overall
access of 75%;
3. Scenario 3_75% budget: Urban access will be 91% and rural access 85%; resulting in an overall
access of 89%.
For all scenarios open defecation (BABS) has to be eradicated by 2019 in both urban and rural areas.
-
10,000,000
20,000,000
30,000,000
40,000,000
50,000,000
60,000,000
70,000,000
2006-total
2010-total
2014-total
2006-poor
2010-poor
2014-poor
2006-nonpoor
2010-nonpoor
2014-nonpoor
Developments of absolute number of households (poor and non-poor) with indicated type of wastewater facility
NON-POOR Improved
POOR-improved
NON-POOR unimproved
POOR-unimproved
NON-POOR-OD
POOR-OD

Urban Sanitation Development Program Sanitation Needs Assessment 2015-2019
4
Facilities required:
The selection of type of WWT facilities is based on the approach explained in the Buku Referensi
(TTPS, 2009). This approach aims to reduce the risk to health and environment at the lowest costs.
Thus, in urban areas with high population densities and high exposure levels, on-site systems (septic
tanks) are no longer preferred and off-site systems with improved performance (removal
efficiencies) are selected, which is a general applied approach (UNEP, 2004). Selection criteria are
formulated based on the expected status in 2025 (mid-term3), see Table 1 below.
Table 2 Selection criteria for wastewater facilities per type of area features
BPS
criteria
Residential
pop.density (pp/ha)
General description Type of WWT system Examples of system
Rural < 100 Rural areas On-site systems Septic tank
Rural >100 Peri urban Community based IPAL communal/ MCK
Urban < 25 Very Low density
urban areas
On-site systems Septic tank
Urban 25-100 Low density urban
areas
Existing houses on-site;
New developments off-site
Existing: septic tanks;
New developments:
IPAL Kawasan
Urban 100-250 High density urban
areas
off-site systems IPAL Kawasan
Urban >250 off-site systems IPAL Terpusat
Specific considerations:
BPS 2010 data show that in urban areas nearly a quarter (23%) of poor households practice open
defecation (in the non-poor areas this was 7%). Many of the areas where urban poor live would
qualify for an off-site system. However, this is not considered the most feasible options. This is
because
o off-site systems require a certain amount of water available to transport the solids, which
is not likely to be the case, as often proper water provision is lacking as well;
o areas are often temporary or concern non legal houses, and;
o both willingness and availability to pay for operation for this group of households is very limited4.
For these households temporary facilities (either MCK or IPAL communal) are a more
appropriate solution. During a general renovation/rehabilitation of such areas, a more structural
solution (e.g. off-site system) can be considered. When putting the 2015-2019 period in
perspective of the 20 year investment these households are assumed to be connected to off-site
systems.
In this assessment an off-site (IPAL Terpusat) system is only proposed if:
o The indicated urban and population density values apply;
o The number of households connected in one Kab/Kota to this system exceed 10,000
(equivalent to 50,000 people);
3 Wastewater infrastructure will be used for a prolonged period of time and beyond the year 2019. In our assessment we
have used a 20 years horizon (2015-2035) in which the anticipated features of the Kab/Kota for 2025 are used as a
reference. 4 It is, however, a political decision to apply a ‘polluter pays’ principle.

Urban Sanitation Development Program Sanitation Needs Assessment 2015-2019
5
o the GDP per indicated Kab/Kota reaches a value of 3,000 US$ (based on 2010 BPS value
and expectedly 3,500 US$ by 2015), following Bappenas’ findings on sustainability of large
off-site systems in other developing countries;
o In case the two latter conditions are not met, one or more IPAL Kawasans are proposed
instead of an IPAL Terpusat. Possibly these systems are further connected in the long-term
future, but this is outside the scope of the current assessment.
Existing urban conditions:
o Many of the urban on-site systems do not comply with the definition of a septic tank and
are more like pit latrines or leach pits (Cubluks) (Kearton et al., 2013). The result is that
there is still a lot of leakage of polluted water to the groundwater;
o In addition, often the septic tank overflow is connected (together with the greywater) to
the drainage system that eventually discharges to the surface water (WSP, 2013);
o In both of these situation human health as well as the quality of surface and groundwater
in urban areas are jeopardized.
The approach to convert from existing systems to future “improved” systems in urban cases is as
follows: In order to improve the urban health and environmental conditions, the described
existing conditions should eventually be minimized. This entails (1) the removal of poorly
performing septic tanks that pollute the ground- and surface water and connect to a sewerage
collection system, and (2) interception and treatment of the effluent septic tank water and
greywater before it reaches the surface water.
o The former activity is to be best performed when renovations in the households are taking
place and requires active campaigning and socialization of the individual households in line
with the development of the sewer system/interceptor system.
o The second activity, which aims to intercept and treat the water before being discharged to
surface water is best started from a location just before discharge point and then gradually
moving upstream to locations closer to the house.
o Thus, eventually, part of these households will be connected to off-site systems (even
though they are already counted as “improved”). In this assessment it is estimated that in a
20 year time period half (50%) of the existing urban population currently recorded as
having a septic tank/cubluk will be connected to an off-site system. For the first 5 years
(2015-2019) this value is only 5%.
Septic tanks and community based systems require regular desludging. In our assessment,
households in rural areas with low densities (<25 pp/ha) do not require this and IPLT’s will only serve
the households served by a septic tank and community based systems in urban areas and higher
density rural areas. The minimum size of an IPLT is 50,000 people, whereas the maximum sizes is
200,000 people. If there are more people that require an IPLT a second one will be constructed.
Figure 3 shows the selected types of system for the island of Java.

Urban Sanitation Development Program Sanitation Needs Assessment 2015-2019
6
Figure 3 Waste water system type in Java and Madura islands
Urban Sanitation Development Program Sanitation Needs Assessment 2015-2019
7
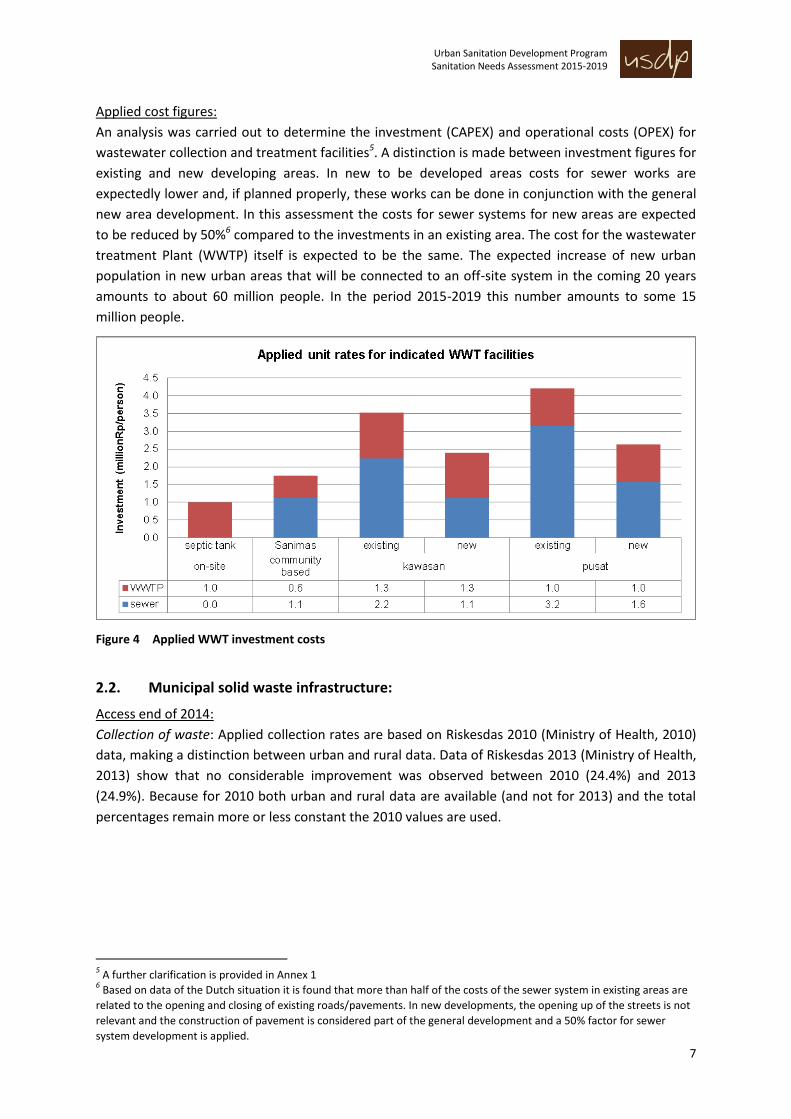
Applied cost figures:
An analysis was carried out to determine the investment (CAPEX) and operational costs (OPEX) for
wastewater collection and treatment facilities5. A distinction is made between investment figures for
existing and new developing areas. In new to be developed areas costs for sewer works are
expectedly lower and, if planned properly, these works can be done in conjunction with the general
new area development. In this assessment the costs for sewer systems for new areas are expected
to be reduced by 50%6 compared to the investments in an existing area. The cost for the wastewater
treatment Plant (WWTP) itself is expected to be the same. The expected increase of new urban
population in new urban areas that will be connected to an off-site system in the coming 20 years
amounts to about 60 million people. In the period 2015-2019 this number amounts to some 15
million people.
Figure 4 Applied WWT investment costs
2.2. Municipal solid waste infrastructure:
Access end of 2014:
Collection of waste: Applied collection rates are based on Riskesdas 2010 (Ministry of Health, 2010)
data, making a distinction between urban and rural data. Data of Riskesdas 2013 (Ministry of Health,
2013) show that no considerable improvement was observed between 2010 (24.4%) and 2013
(24.9%). Because for 2010 both urban and rural data are available (and not for 2013) and the total
percentages remain more or less constant the 2010 values are used.
5 A further clarification is provided in Annex 1
6 Based on data of the Dutch situation it is found that more than half of the costs of the sewer system in existing areas are
related to the opening and closing of existing roads/pavements. In new developments, the opening up of the streets is not
relevant and the construction of pavement is considered part of the general development and a 50% factor for sewer
system development is applied.

Urban Sanitation Development Program Sanitation Needs Assessment 2015-2019
8
Figure 5 Urban and rural households, whose waste is managed properly (2010)
In line with the view of Bappenas in this assessment the priority lies on improvement of the urban
situation for the period 2015-2019. No additional infrastructure is proposed for rural areas.
However, in the period 2020-2035 the higher dense rural population will be served by MSW
infrastructure as well. In this assessment a rural area is classified as high density when the residential
population is more than 25 pp/ha (based on the expected 2025 situation). Thus, for all rural areas
with lower densities no collection or landfills will be developed in the short and long term. However,
in this assessment promotion of 3R and home composting for these areas is included after 2020
(see table 3).
Treatment and disposal of waste: Not all waste that is collected from the households is disposed of
in a sanitary way. Discussions with PU learns that most Kab/Kota now have several dumpsites (often
scattered over the area). For the already existing TPA (access) the following assumptions are made:
Only people that are served with a landfill that was developed after 2012 do not require an
additional or extension of the landfill in the period 2015-2019. This is based on a design landfill
lifetime of typically 7 years (PU, 2013).
The number of people provided with a landfill is based on the projects executed and planned
(period 2010-2014) by PU7. This data shows that during the period 2010-2014 a total of 193
landfills have been developed. Taking into consideration that one landfill may serve multiple
Kab/Kota (regional landfill) the total number of Kab/Kota that currently is already served by a
landfill is 207. The number of landfill, however, that still has sufficient capacity until 2019 is
assessed as 132. In the period after 2020 all these Kab/Kota require an extension of the TPA.
Based on 2014 data8 the population with access in each Kab/Kota is determined. More
information on this approach is provided in Annex 2.
In case a lower target is set for 2020 (scenario 2 and 3) not all Kab/Kota can be served with a
landfill. In that case priority is given to the Kab/Kota with the highest urban population
(nationwide).
7 Data is obtained from PEMBANGUNAN TPA SEJAK TA 2010-2013.
8 PEMBANGUNAN TPA SEJAK TA 2006‐2014 DIT. PENGEMBANGAN PLP
0%
10%
20%
30%
40%
50%
60%
70%
80%
90%A
ce
h
Su
mU
t
Su
mB
ar
Ria
u
Ja
mbi
Su
msel
Be
ng
ku
lu
Lam
pu
ng
Ba
Bel
Ke
pR
i
DK
I
Ja
Ba
r
Ja
Te
ng
Yo
gya
Ja
Tim
Ba
nte
n
Ba
li
NT
B
NT
T
Ka
lba
r
Ka
lte
ng
Ka
lsel
Ka
ltim
Su
lut
Su
lte
ng
Su
lsel
Su
ltra
Go
ronta
lo
Su
lba
r
Ma
luku
Ma
luku
Uta
ra
Pa
pu
a B
ara
t
Pa
pu
a
RISKESDATA 2010 solid waste collected
urban rural

Urban Sanitation Development Program Sanitation Needs Assessment 2015-2019
9
Targets:
For the three scenario’s targets are defined:
1. Scenario 1: Urban collection is 100%, whereas the nationwide collection rate amounts to 59%.
All Kab/Kota with urban areas (472) will have a landfill which means that all Kab/Kota that
currently do not have a landfill that can sustain until 2019 will have a new one by 20199. This
corresponds with the construction of 341 landfills. For the rural cases no additional collection,
treatment or landfill capacity is required.
2. Scenario 2: Urban collection and treatment is 75% and 281 of the Kab/Kota have a landfill to
serve the urban population; this includes the 131 Kab/Kota that already have a landfill in 2015.
For the rural cases no additional collection, treatment or landfill capacity is required. Thus, the
nationwide population that is served by a solid waste collection and treatment system is 45%.
3. Scenario 3: Urban collection and treatment are both 71% and 242 of the Kab/Kota have a landfill
to serve the urban population, including the 131 Kab/Kota that already have a landfill in 2015.
For the rural cases no additional collection, treatment or landfill capacity is required. Thus, the
nationwide population that is served by a solid waste collection and treatment system is both
42%.
Facilities required:
For MSW two activities have been distinguished. The first one deals with collection, transfer and
transport systems of solid waste and the second one deals with the final treatment or disposal of
solid waste. The table below shows the proposed developments based on (1) urban and rural
features, (2) time of developments and (3) densities for these activities.
Table 3 Planned interventions for MSW
Type Rural Urban
Implementation Only after 2020 2015-2019 2020-2034
Density
pp/ha
Activity
<25 >25 <100 >100 <100 >100
Collection no yes yes yes
Disposal no yes Kab/Kota without TPA Build new TPA in Kab/Kota with
already existing TPA
3R
(50% of people
targeted)
Home
compost
At TPS
(decentral)
level
At TPS
(decentral)
level
Central level
in Kab/Kota
without TPA
At TPS/
community
level
Central level in
Kab/Kota
without TPA
In order to identify the investment costs, it is expected that collection is done by motor sampah and
transfer takes place in a TPS-III with containers from where it is transported by Armroll truck. Waste
is finally disposed of in a sanitary landfill. Landfill development follows a stepwise approach. This
means that in the first phase the land for the complete period until 2035 is purchased.Further, a first
cell with a lifetime of 5 years and the facilities are constructed (office, weighing bridge, vehicles,
leachate treatment plant). After the five years an extension is developed, again with a lifetime of 5
9
Data provided by PU shows that the current landfills serve the whole population for a period of 5-7 years. Therefore in
this assessment now new landfills are required in the period 2015-2019 in those Kab/Kota that already have an operational
landfill. In the period after 2019, these Kab/Kota, however, need to extent their existing landfill capacity.

Urban Sanitation Development Program Sanitation Needs Assessment 2015-2019
10
years. However, offices, leachate treatment plants only require some minor upgrading. Thus the
second phase of the landfill development has lower specific costs than the first development. Both
specific prices depend on the area, following the figure 6 below.
Figure 6 Specific price development of first and subsequent landfill cells with size of the landfill
Specific considerations for 3R:
In PPSP (2010-2014) 3R (Reduce, Reuse, Recycle) is promoted. 3R includes the recovery and
processing of organic waste into compost and recovery of plastics, paper and other reusable
products like glass, timber, metals etc. Data provided by PU shows that by the end of 2013 310 3R
community based stations were constructed10. Table 3 shows that for rural areas with residential
population densities below 25 pp/ha after 2020 composting at a household level is promoted. For
higher densely rural populated areas, communal composters at the level of a TPS station are
proposed. In all cases there is direct potential for reuse. Also for lower dense (<100 pp/ha)
populated urban areas communal composters at the TPS level and direct reuse are proposed. Based
on the current experience with communal 3R stations, which show a rather low (about 30%
mentioned only) success rate only, the management of these systems should be with the a dinas,
rather than a community. For the high dense urban areas a centralized 3R facility is proposed.
Recently larger scale 3R systems are being introduced and tested, like in Banda Aceh, Bima and
Cijantung. These systems consist of a recoverable waste separation step (plastics and papers), a
digestion step and a composting step. The refuse is finally disposed of in a landfill. In this
assessment, a differentiation is made between centralized 3R stations that (1) apply composting
10
Data is obtained from RINCIAN per SATKER 2013 provided by the Ministry of Public Works
3,000
4,000
5,000
6,000
7,000
8,000
9,000
0 5 10 15 20 25 30
millio
n R
p/h
a
ha of landfill
Applied landfill price per ha per development
First development subsequent cells
Urban Sanitation Development Program Sanitation Needs Assessment 2015-2019
11
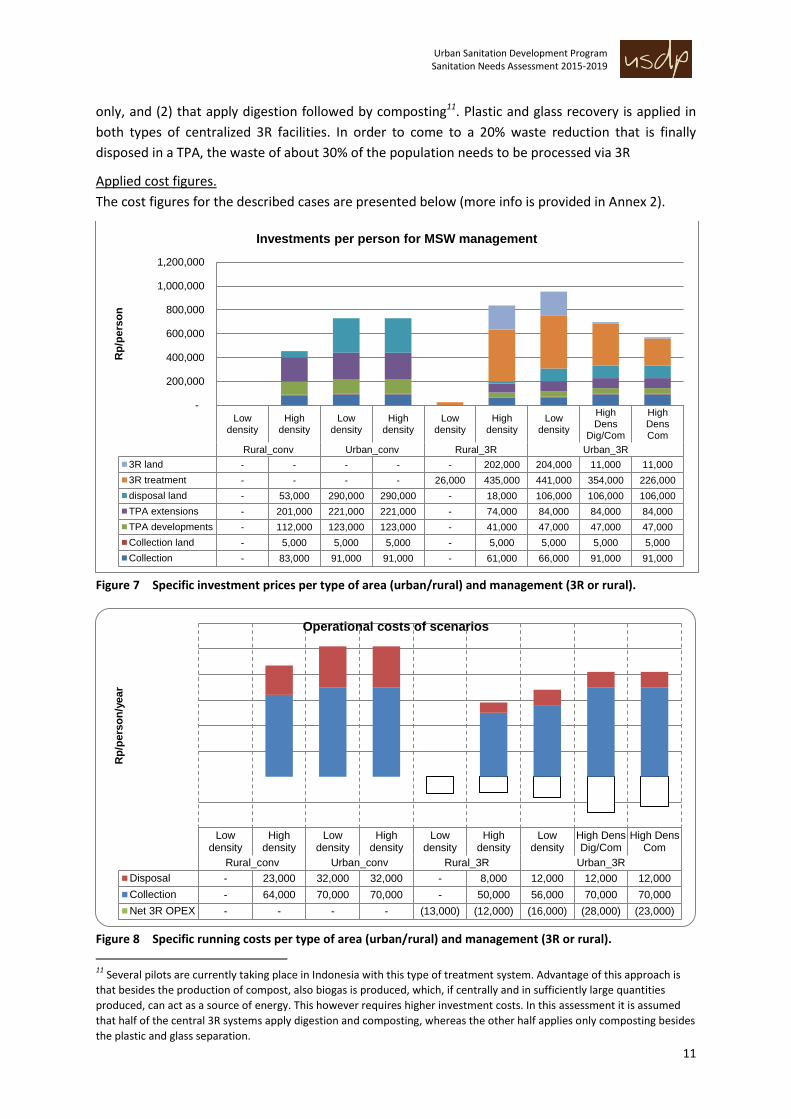
only, and (2) that apply digestion followed by composting11. Plastic and glass recovery is applied in
both types of centralized 3R facilities. In order to come to a 20% waste reduction that is finally
disposed in a TPA, the waste of about 30% of the population needs to be processed via 3R
Applied cost figures.
The cost figures for the described cases are presented below (more info is provided in Annex 2).
Figure 7 Specific investment prices per type of area (urban/rural) and management (3R or rural).
Figure 8 Specific running costs per type of area (urban/rural) and management (3R or rural).
11
Several pilots are currently taking place in Indonesia with this type of treatment system. Advantage of this approach is
that besides the production of compost, also biogas is produced, which, if centrally and in sufficiently large quantities
produced, can act as a source of energy. This however requires higher investment costs. In this assessment it is assumed
that half of the central 3R systems apply digestion and composting, whereas the other half applies only composting besides
the plastic and glass separation.
Lowdensity
Highdensity
Lowdensity
Highdensity
Lowdensity
Highdensity
Lowdensity
HighDens
Dig/Com
HighDensCom
Rural_conv Urban_conv Rural_3R Urban_3R
3R land - - - - - 202,000 204,000 11,000 11,000
3R treatment - - - - 26,000 435,000 441,000 354,000 226,000
disposal land - 53,000 290,000 290,000 - 18,000 106,000 106,000 106,000
TPA extensions - 201,000 221,000 221,000 - 74,000 84,000 84,000 84,000
TPA developments - 112,000 123,000 123,000 - 41,000 47,000 47,000 47,000
Collection land - 5,000 5,000 5,000 - 5,000 5,000 5,000 5,000
Collection - 83,000 91,000 91,000 - 61,000 66,000 91,000 91,000
-
200,000
400,000
600,000
800,000
1,000,000
1,200,000
Rp
/pe
rso
n
Investments per person for MSW management
Lowdensity
Highdensity
Lowdensity
Highdensity
Lowdensity
Highdensity
Lowdensity
High DensDig/Com
High DensCom
Rural_conv Urban_conv Rural_3R Urban_3R
Disposal - 23,000 32,000 32,000 - 8,000 12,000 12,000 12,000
Collection - 64,000 70,000 70,000 - 50,000 56,000 70,000 70,000
Net 3R OPEX - - - - (13,000) (12,000) (16,000) (28,000) (23,000)
Rp
/pe
rso
n/y
ear
Operational costs of scenarios

Urban Sanitation Development Program Sanitation Needs Assessment 2015-2019
12
2.3. Drainage infrastructure:
Current status:
In 2009 50,000 ha in 100 Kab/Kota were identified facing drainage problems. Due to budgetary
reason a target of 22,500 ha was adopted in PPSP12 of which the improvement costs for 4,600 ha in
50 Kab/Kota would be covered by the Central Government (APBN). Data provided by the ministry of
Public Works (2012) shows that a total of 4,064 ha (1,949 ha in 2010 and 2,115 ha in 2011) of this
4,600 ha has been implemented. No data is available on progress made for the remaining 17,900 ha.
Targets:
Discussion with the sub directorate of drainage of Cipta Karya learns that for 2015-2019 and the
following three five-year periods a similar area (22,500 ha each) is expected to be improved.
The applied investment and operational costs are based on a study performed by PU. The applied
prices per ha are based on the approach explained in Annex 3 and are as follows.
Table 4 Applied drainage prices
Components total price Unit
Average price Primary infrastructure 244 million/ha
Average price Secondary infrastructure 342 million/ha
Total infrastructure 586 million/ha
For the 75% access and budget scenarios, respectively scenario 2 and 3, 75% of the area is expected to be
developed with drainage infrastructure.
2.4. Budget divisions per activity, government and department
In the assessment the total cost of sanitation are calculated. However, not all investments are
required for construction, but also for additional studies and designs. Furthermore, investments will
come from different sources (national government, local (Kab/Kota and provincial) government as
well as users, communities themselves or private parties (e.g. MSW collection). Finally, although a
large part of the investments come from public works (PU), also additional investments from other
departments (like Health for advocacy and empowerment and Bangda for institutional
developments) are expected. The table below shows the applied division of investment per type of
department used in this assessment13.
12
Typically, the central government (through the APBN) is responsible for the funding of the primary drainage and polders,
whereas, secondary and tertiary drainage as well as O&M (Operation and Maintenance) budgets are to be provided by
provincial or Kab/Kota levels. Available national budget for primary drainage adopted in the Renstra 2010-2014 (Rencana
Strategie (Strategic plan), which describes the Ministry of Public Works’ planning and required funding for a five year
period 2010-2014) at the time was 2,9 trillion Rp. This was approximately only half of the required budget of Rp 4,5 trillion.
Hence, the PPSP target was halved as well and set as 22.500 ha. The remaining 17.900 ha is to be solved by secondary and
tertiary drainage facilities by provincial and Kab/kot government budget. 13
Applied numbers are based on discussion with Public works and Bappenas and PU

Urban Sanitation Development Program Sanitation Needs Assessment 2015-2019
13
Table 5 Budget requirements per activity and origin of sources and explanation on type of activity (an extended version is presented in the annex)
Sub-sector Wastewater Municipal Solid Waste Drainage
On-site CBS IPAL Kawasan IPAL Terpusat Collection-transfer-transport
Treatment
Activity div% source* div% source* div% source* div% source* div% source* div% source* primary secondary
div.% source div.% source
Studies
- Master plan 0.25 N_PU_S 0.25 N_PU_S 3 N_PU_S 1.5 N_PU_S 3 N_PU_S 3 Lo_PU_S
- LARAP AMDAL, FS 0.25 Lo_PU_S 0.25 Lo_PU_S 1 Lo_PU_S 1 Lo_PU_S
Design
- guidelines 1 N_PU_S 1 N_PU_S 1 N_PU_S 2 N_PU_S 2 N_PU_S
- detailing 4 U_S 3 N_PU_S 1 N_PU_S 2 Lo_PU_S 3 Lo_PU_S
Campaign Advocacy, Socialization
2 N_CA_S 2 Lo_CA_S
- General 15 N_CA_S 2 N_PU_S 1.5 Na_CA_S 3 Na_CA_S 2 N_CA_S 1.5 N_CA_S
- Kab/Kota 5 Lo_CA_S 4 Lo_CA_S 2 Lo_CA_S 1.5 Lo_CA_S 4 Lo_CA_S 2 Lo_CA_S
Land acquisition 11 U_La 3 Lo_La 3 Lo_La 9 Lo_La 19 Lo_La 95 N_PU_H 95 Lo_PU_H
Construction activities
52 Lo_PU_H 54 N_PU_H
(civil)
- House connection 9 U_H 24 U_H 13 Lo_PU_H 11 Lo_PU_H 25 U_H (collection vehicles)
- Sewer; IPLT for onsite
1.0 N_PU_H 22 N_PU_H 43 N_PU_H 57 N_PU_H
- Treatment 70 U_H 32 N_PU_H 33 N_PU_H 22 N_PU_H 16 Lo_PU_H (Elec& mech)
All 100 100 100 100 100 100 100 100
Explanation on used source codes:
N=national, Lo=local (Provincial and/or Kab/Kota), U=user.
Department (only for National and Local sources): PU=Public works (or construction), CA=Campaign and Advocacy
S=Software; H=Hardware, La=Land

Urban Sanitation Development Program Sanitation Needs Assessment 2015-2019
14
3. Results
3.1. Introduction
The overall budgets for sanitation requirement for the coming 20 years, with specific attention to
the first 5 years’ requirement for all three sub-sectors are presented. Thereafter the expected
required wastewater treatment facilities and solid waste facilities for the three scenarios are
presented (paragraph 3.3). Finally the assessed provincial investments are presented
(paragraph 3.4).
3.2. Total sanitation budget requirements
The table below shows the developments, required budgets and proposed division per type of
government for the first 5 years for the three defined scenarios. In the subsequent three overviews,
the total sanitation budgets and developments are presented.

Urban Sanitation Development Program Sanitation Needs Assessment 2015-2019
15
Table 6 Summary figures: Scenario 1
Scenario 1: 100% access Scenario 2: 75% access Scenario 3: 75% budget
period Origin of funds WWT MSW Drain. Total WWT MSW Drain. Total WWT MSW Drain. Total
2015-
2019
National 106.5 30.4 5.7 142.6 55.4 26.6 4.3 86.2 80.9 24.1 4.3 109.3
Local gov't (Kabkot+Prov) 24.3 25.0 8.0 57.3 12.7 20.3 6.0 39.0 18.5 18.3 6.0 42.8
users/community 71.6 2.2 0.0 73.8 27.9 1.3 0.0 29.2 52.0 1.1 0.0 53.1
total 202.4 57.7 13.7 273.7 95.9 48.2 10.2 154.4 151.4 43.6 10.2 205.3
period Division national WWT MSW Drain. Total WWT MSW Drain. Total WWT MSW Drain. Total
2015-
2019
Infra (Public works) 87.0 27.4 5.4 119.8 46.8 24.1 4.1 74.9 66.5 21.9 4.1 92.4
Design and studies (PU) 4.4 2.2 0.2 6.7 2.4 1.8 0.1 4.3 3.4 1.6 0.1 5.1
CA /instit. (Health + Bangda) 15.1 0.9 0.1 16.1 6.2 0.7 0.1 7.1 11.1 0.7 0.1 11.8
total 106.5 30.4 5.7 142.6 55.4 26.6 4.3 86.2 80.9 24.1 4.3 109.3
period Division Local WWT MSW Drain. Total WWT MSW Drain. Total WWT MSW Drain. Total
2015-
2019
Infra (Public works) 17.4 7.3 7.6 32.3 9.6 4.9 5.7 20.2 13.4 4.4 5.7 23.4
Design and studies (PU) 0.3 16.4 0.2 16.9 0.1 14.3 0.2 14.7 0.2 13.0 0.2 13.4
CA /instit. (Health + Bangda) 6.7 1.3 0.2 8.2 2.9 1.1 0.1 4.1 4.9 1.0 0.1 6.0
total 24.3 25.0 8.0 57.3 12.7 20.3 6.0 39.0 18.5 18.3 6.0 42.8
Urban Sanitation Development Program Sanitation Needs Assessment 2015-2019
16
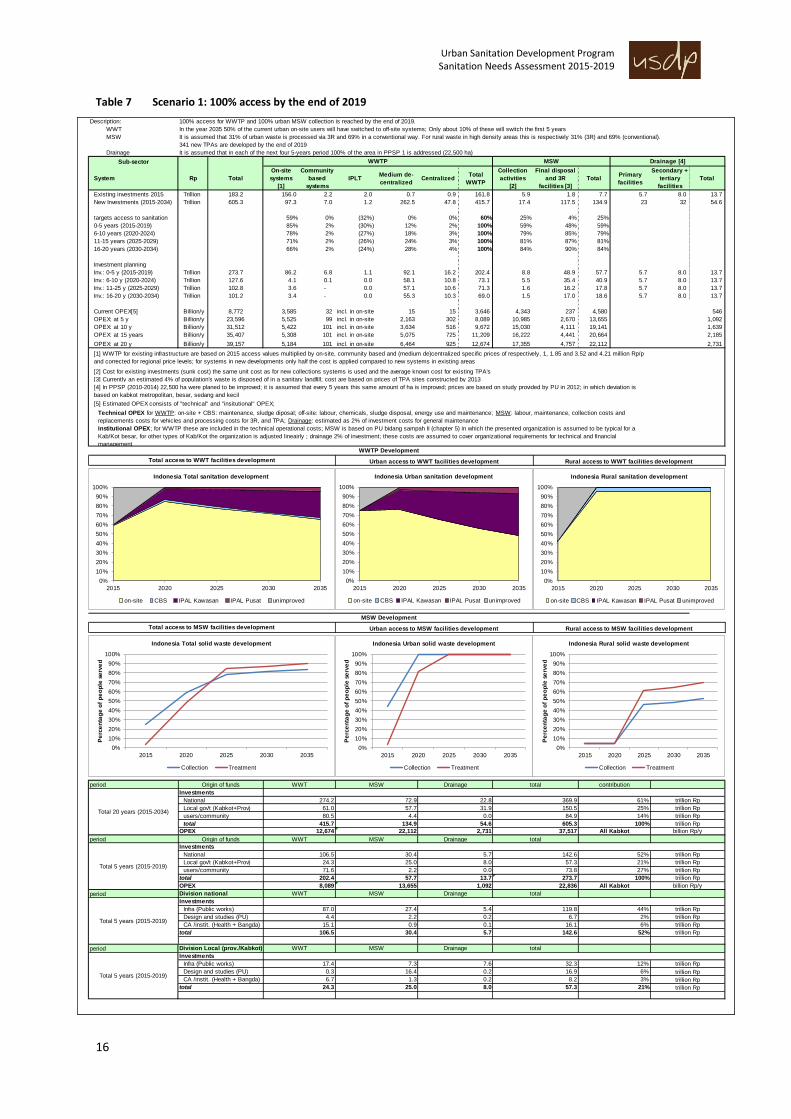
Table 7 Scenario 1: 100% access by the end of 2019
Description: 100% access for WWTP and 100% urban MSW collection is reached by the end of 2019.
WWT In the year 2035 50% of the current urban on-site users will have switched to off-site systems; Only about 10% of these will switch the first 5 years
MSW It is assumed that 31% of urban waste is processed via 3R and 69% in a conventional way. For rural waste in high density areas this is respectively 31% (3R) and 69% (conventional).
341 new TPAs are developed by the end of 2019
Drainage It is assumed that in each of the next four 5-years period 100% of the area in PPSP 1 is addressed (22,500 ha)
Sub-sector
System Rp Total
On-site
systems
[1]
Community
based
systems
IPLTMedium de-
centralizedCentralized
Total
WWTP
Collection
activities
[2]
Final disposal
and 3R
facilities [3]
TotalPrimary
facilities
Secondary +
tertiary
facilities
Total
Existing investments 2015 Trillion 183.2 156.0 2.2 2.0 0.7 0.9 161.8 5.9 1.8 7.7 5.7 8.0 13.7
New Investments (2015-2034) Trillion 605.3 97.3 7.0 1.2 262.5 47.8 415.7 17.4 117.5 134.9 23 32 54.6
targets access to sanitation 59% 0% (32%) 0% 0% 60% 25% 4% 25%
0-5 years (2015-2019) 85% 2% (30%) 12% 2% 100% 59% 48% 59%
6-10 years (2020-2024) 78% 2% (27%) 18% 3% 100% 79% 85% 79%
11-15 years (2025-2029) 71% 2% (26%) 24% 3% 100% 81% 87% 81%
16-20 years (2030-2034) 66% 2% (24%) 28% 4% 100% 84% 90% 84%
Investment planning
Inv.: 0-5 y (2015-2019) Trillion 273.7 86.2 6.8 1.1 92.1 16.2 202.4 8.8 48.9 57.7 5.7 8.0 13.7
Inv.: 6-10 y (2020-2024) Trillion 127.6 4.1 0.1 0.0 58.1 10.8 73.1 5.5 35.4 40.9 5.7 8.0 13.7
Inv.: 11-25 y (2025-2029) Trillion 102.8 3.6 - 0.0 57.1 10.6 71.3 1.6 16.2 17.8 5.7 8.0 13.7
Inv.: 16-20 y (2030-2034) Trillion 101.2 3.4 - 0.0 55.3 10.3 69.0 1.5 17.0 18.6 5.7 8.0 13.7
Current OPEX[5] Billion/y 8,772 3,585 32 incl. in on-site 15 15 3,646 4,343 237 4,580
OPEX: at 5 y Billion/y 23,596 5,525 99 incl. in on-site 2,163 302 8,089 10,985 2,670 13,655
OPEX: at 10 y Billion/y 31,512 5,422 101 incl. in on-site 3,634 516 9,672 15,030 4,111 19,141
OPEX: at 15 years Billion/y 35,407 5,308 101 incl. in on-site 5,075 725 11,209 16,222 4,441 20,664
OPEX: at 20 y Billion/y 39,157 5,184 101 incl. in on-site 6,464 925 12,674 17,355 4,757 22,112
[2] Cost for existing investments (sunk cost) the same unit cost as for new collections systems is used and the average known cost for existing TPA's
period
period
period
period
22,836 All Kabkot
27%
[3] Currently an estimated 4% of population's waste is disposed of in a sanitary landfill; cost are based on prices of TPA sites constructed by 2013
[4] In PPSP (2010-2014) 22,500 ha were planed to be improved; it is assumed that every 5 years this same amount of ha is improved; prices are based on study provided by PU in 2012; in which deviation is
based on kabkot metropolitan, besar, sedang and kecil
[5] Estimated OPEX consists of "technical" and "insitutional" OPEX;
Technical OPEX for WWTP: on-site + CBS: maintenance, sludge diposal; off-site: labour, chemicals, sludge disposal, energy use and maintenance; MSW: labour, maintenance, collection costs and
replacements costs for vehicles and processing costs for 3R, and TPA; Drainage: estimated as 2% of investment costs for general maintenance
546
1,092
1,639
2,185
2,731
[1] WWTP for existing infrastructure are based on 2015 access values multiplied by on-site, community based and (medium de)centralized specific prices of respectively, 1, 1.85 and 3.52 and 4.21 million Rp/p
and corrected for regional price levels; for systems in new developments only half the cost is applied compared to new systems in existing areas
Investments
57.7
OPEX
84.9
Origin of funds WWT MSW Drainage total
OPEX
134.9 54.6 605.3 100%
Total 5 years (2015-2019)
Investments
National 106.5 30.4 5.7
Local gov't (Kabkot+Prov) 24.3 25.0 8.0
users/community 71.6
8,089
total 202.4 13.7
MSWWWTP Drainage [4]
users/community 80.5
13,655 1,092
150.5 25%
37,517
61.0 57.7 31.9
National
21%
Institutional OPEX; for WWTP these are included in the technical operational costs; MSW is based on PU bidang sampah II (chapter 5) in which the presented organization is assumed to be typical for a
Kab/Kot besar, for other types of Kab/Kot the organization is adjusted lineairly ; drainage 2% of investment; these costs are assumed to cover organizational requirements for technical and financial
managementWWTP Development
MSW Development
Origin of funds WWT MSW Drainage
trillion Rp
Total 5 years (2015-2019)0.1 16.1 6%
total 106.5 30.4 5.7 142.6 52%
CA /instit. (Health + Bangda) 15.1 0.9
Design and studies (PU) 4.4 2.2 0.2 6.7
Total 5 years (2015-2019)
Investments
Infra (Public works) 17.4 7.3 7.6 32.3 12%
Design and studies (PU) 0.3 16.4 0.2 16.9 6%
CA /instit. (Health + Bangda) 6.7 1.3
total
Division Local (prov./Kabkot) WWT MSW Drainage total
trillion Rp
Investments
27.4 5.4 119.8
Division national WWT MSW Drainage total
2%
Infra (Public works) 87.0
trillion Rp
trillion Rp
billion Rp/y
trillion Rp
Total access to WWT facilities development Rural access to WWT facilities developmentUrban access to WWT facilities development
Total access to MSW facilities development Urban access to MSW facilities development Rural access to MSW facilities development
total contribution
All Kabkot
274.2 72.9 22.8 369.9 61%
Local gov't (Kabkot+Prov)
14%
total 415.7
12,674 22,112 2,731
Total 20 years (2015-2034)4.4 0.0
trillion Rp
trillion Rp
trillion Rp
billion Rp/y
trillion Rp
2.2 0.0 73.8
44%
273.7 100%
142.6 52%
57.3
trillion Rp
trillion Rp
trillion Rp
trillion Rp
trillion Rp
trillion Rp
trillion Rp
0.2 8.2 3%
24.3 25.0 8.0 57.3 21%
0%
10%
20%
30%
40%
50%
60%
70%
80%
90%
100%
2015 2020 2025 2030 2035
Indonesia Total sanitation development
on-site CBS IPAL Kawasan IPAL Pusat unimproved
0%
10%
20%
30%
40%
50%
60%
70%
80%
90%
100%
2015 2020 2025 2030 2035
Indonesia Urban sanitation development
on-site CBS IPAL Kawasan IPAL Pusat unimproved
0%
10%
20%
30%
40%
50%
60%
70%
80%
90%
100%
2015 2020 2025 2030 2035
Indonesia Rural sanitation development
on-site CBS IPAL Kawasan IPAL Pusat unimproved
0%
10%
20%
30%
40%
50%
60%
70%
80%
90%
100%
2015 2020 2025 2030 2035
Pe
rce
nta
ge
of
pe
op
le s
erv
ed
Indonesia Total solid waste development
Collection Treatment
0%
10%
20%
30%
40%
50%
60%
70%
80%
90%
100%
2015 2020 2025 2030 2035
Pe
rce
nta
ge
of
pe
op
le s
erv
ed
Indonesia Urban solid waste development
Collection Treatment
0%
10%
20%
30%
40%
50%
60%
70%
80%
90%
100%
2015 2020 2025 2030 2035
Pe
rce
nta
ge
of
pe
op
le s
erv
ed
Indonesia Rural solid waste development
Collection Treatment
Urban Sanitation Development Program Sanitation Needs Assessment 2015-2019
17
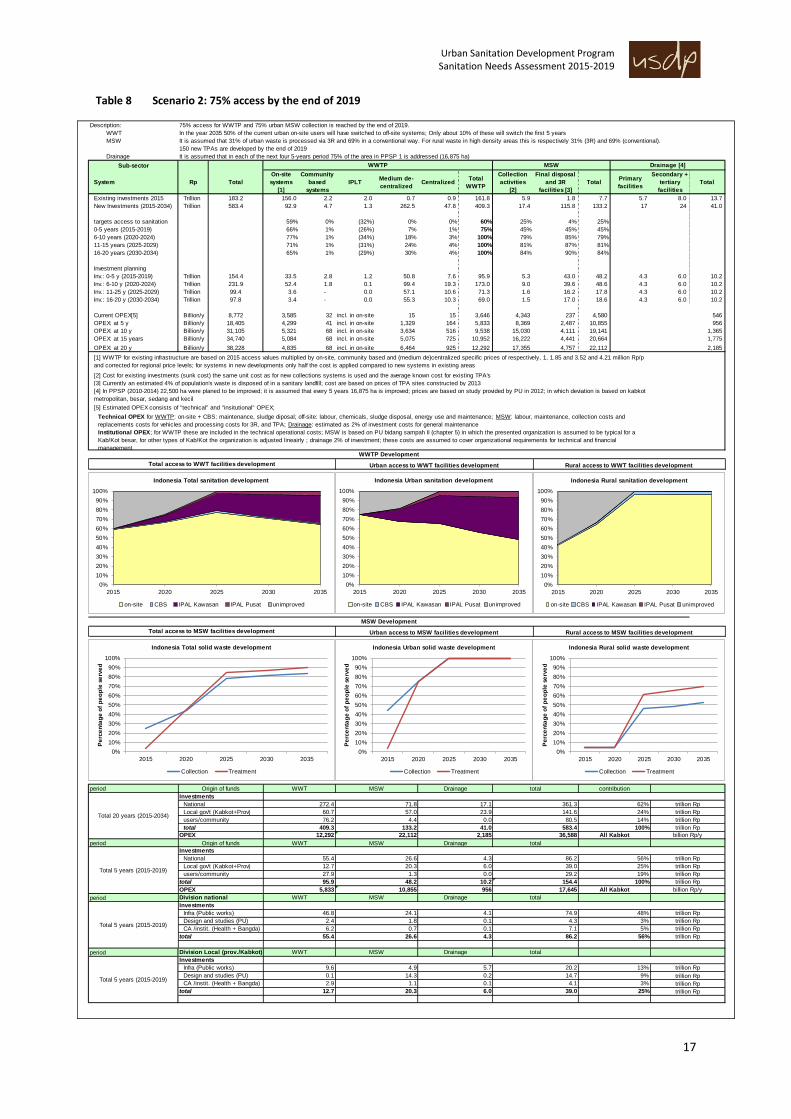
Table 8 Scenario 2: 75% access by the end of 2019
Description: 75% access for WWTP and 75% urban MSW collection is reached by the end of 2019.
WWT In the year 2035 50% of the current urban on-site users will have switched to off-site systems; Only about 10% of these will switch the first 5 years
MSW It is assumed that 31% of urban waste is processed via 3R and 69% in a conventional way. For rural waste in high density areas this is respectively 31% (3R) and 69% (conventional).
150 new TPAs are developed by the end of 2019
Drainage It is assumed that in each of the next four 5-years period 75% of the area in PPSP 1 is addressed (16,875 ha)
Sub-sector
System Rp Total
On-site
systems
[1]
Community
based
systems
IPLTMedium de-
centralizedCentralized
Total
WWTP
Collection
activities
[2]
Final disposal
and 3R
facilities [3]
TotalPrimary
facilities
Secondary +
tertiary
facilities
Total
Existing investments 2015 Trillion 183.2 156.0 2.2 2.0 0.7 0.9 161.8 5.9 1.8 7.7 5.7 8.0 13.7
New Investments (2015-2034) Trillion 583.4 92.9 4.7 1.3 262.5 47.8 409.3 17.4 115.8 133.2 17 24 41.0
targets access to sanitation 59% 0% (32%) 0% 0% 60% 25% 4% 25%
0-5 years (2015-2019) 66% 1% (26%) 7% 1% 75% 45% 45% 45%
6-10 years (2020-2024) 77% 1% (34%) 18% 3% 100% 79% 85% 79%
11-15 years (2025-2029) 71% 1% (31%) 24% 4% 100% 81% 87% 81%
16-20 years (2030-2034) 65% 1% (29%) 30% 4% 100% 84% 90% 84%
Investment planning
Inv.: 0-5 y (2015-2019) Trillion 154.4 33.5 2.8 1.2 50.8 7.6 95.9 5.3 43.0 48.2 4.3 6.0 10.2
Inv.: 6-10 y (2020-2024) Trillion 231.9 52.4 1.8 0.1 99.4 19.3 173.0 9.0 39.6 48.6 4.3 6.0 10.2
Inv.: 11-25 y (2025-2029) Trillion 99.4 3.6 - 0.0 57.1 10.6 71.3 1.6 16.2 17.8 4.3 6.0 10.2
Inv.: 16-20 y (2030-2034) Trillion 97.8 3.4 - 0.0 55.3 10.3 69.0 1.5 17.0 18.6 4.3 6.0 10.2
Current OPEX[5] Billion/y 8,772 3,585 32 incl. in on-site 15 15 3,646 4,343 237 4,580
OPEX: at 5 y Billion/y 18,405 4,299 41 incl. in on-site 1,329 164 5,833 8,369 2,487 10,855
OPEX: at 10 y Billion/y 31,105 5,321 68 incl. in on-site 3,634 516 9,538 15,030 4,111 19,141
OPEX: at 15 years Billion/y 34,740 5,084 68 incl. in on-site 5,075 725 10,952 16,222 4,441 20,664
OPEX: at 20 y Billion/y 38,228 4,835 68 incl. in on-site 6,464 925 12,292 17,355 4,757 22,112
[2] Cost for existing investments (sunk cost) the same unit cost as for new collections systems is used and the average known cost for existing TPA's
period
period
period
period
17,645 All Kabkot
19%
[3] Currently an estimated 4% of population's waste is disposed of in a sanitary landfill; cost are based on prices of TPA sites constructed by 2013
[4] In PPSP (2010-2014) 22,500 ha were planed to be improved; it is assumed that every 5 years 16,875 ha is improved; prices are based on study provided by PU in 2012; in which deviation is based on kabkot
metropolitan, besar, sedang and kecil
[5] Estimated OPEX consists of "technical" and "insitutional" OPEX;
Technical OPEX for WWTP: on-site + CBS: maintenance, sludge diposal; off-site: labour, chemicals, sludge disposal, energy use and maintenance; MSW: labour, maintenance, collection costs and
replacements costs for vehicles and processing costs for 3R, and TPA; Drainage: estimated as 2% of investment costs for general maintenance
546
956
1,365
1,775
2,185
[1] WWTP for existing infrastructure are based on 2015 access values multiplied by on-site, community based and (medium de)centralized specific prices of respectively, 1, 1.85 and 3.52 and 4.21 million Rp/p
and corrected for regional price levels; for systems in new developments only half the cost is applied compared to new systems in existing areas
Investments
48.2
OPEX
80.5
Origin of funds WWT MSW Drainage total
OPEX
133.2 41.0 583.4 100%
Total 5 years (2015-2019)
Investments
National 55.4 26.6 4.3
Local gov't (Kabkot+Prov) 12.7 20.3 6.0
users/community 27.9
5,833
total 95.9 10.2
MSWWWTP Drainage [4]
users/community 76.2
10,855 956
141.6 24%
36,588
60.7 57.0 23.9
National
25%
Institutional OPEX; for WWTP these are included in the technical operational costs; MSW is based on PU bidang sampah II (chapter 5) in which the presented organization is assumed to be typical for a
Kab/Kot besar, for other types of Kab/Kot the organization is adjusted lineairly ; drainage 2% of investment; these costs are assumed to cover organizational requirements for technical and financial
managementWWTP Development
MSW Development
Origin of funds WWT MSW Drainage
trillion Rp
Total 5 years (2015-2019)0.1 7.1 5%
total 55.4 26.6 4.3 86.2 56%
CA /instit. (Health + Bangda) 6.2 0.7
Design and studies (PU) 2.4 1.8 0.1 4.3
Total 5 years (2015-2019)
Investments
Infra (Public works) 9.6 4.9 5.7 20.2 13%
Design and studies (PU) 0.1 14.3 0.2 14.7 9%
CA /instit. (Health + Bangda) 2.9 1.1
total
Division Local (prov./Kabkot) WWT MSW Drainage total
trillion Rp
Investments
24.1 4.1 74.9
Division national WWT MSW Drainage total
3%
Infra (Public works) 46.8
trillion Rp
trillion Rp
billion Rp/y
trillion Rp
Total access to WWT facilities development Rural access to WWT facilities developmentUrban access to WWT facilities development
Total access to MSW facilities development Urban access to MSW facilities development Rural access to MSW facilities development
total contribution
All Kabkot
272.4 71.8 17.1 361.3 62%
Local gov't (Kabkot+Prov)
14%
total 409.3
12,292 22,112 2,185
Total 20 years (2015-2034)4.4 0.0
trillion Rp
trillion Rp
trillion Rp
billion Rp/y
trillion Rp
1.3 0.0 29.2
48%
154.4 100%
86.2 56%
39.0
trillion Rp
trillion Rp
trillion Rp
trillion Rp
trillion Rp
trillion Rp
trillion Rp
0.1 4.1 3%
12.7 20.3 6.0 39.0 25%
0%
10%
20%
30%
40%
50%
60%
70%
80%
90%
100%
2015 2020 2025 2030 2035
Indonesia Total sanitation development
on-site CBS IPAL Kawasan IPAL Pusat unimproved
0%
10%
20%
30%
40%
50%
60%
70%
80%
90%
100%
2015 2020 2025 2030 2035
Indonesia Urban sanitation development
on-site CBS IPAL Kawasan IPAL Pusat unimproved
0%
10%
20%
30%
40%
50%
60%
70%
80%
90%
100%
2015 2020 2025 2030 2035
Indonesia Rural sanitation development
on-site CBS IPAL Kawasan IPAL Pusat unimproved
0%
10%
20%
30%
40%
50%
60%
70%
80%
90%
100%
2015 2020 2025 2030 2035
Pe
rce
nta
ge
of
pe
op
le s
erv
ed
Indonesia Total solid waste development
Collection Treatment
0%
10%
20%
30%
40%
50%
60%
70%
80%
90%
100%
2015 2020 2025 2030 2035
Pe
rce
nta
ge
of
pe
op
le s
erv
ed
Indonesia Urban solid waste development
Collection Treatment
0%
10%
20%
30%
40%
50%
60%
70%
80%
90%
100%
2015 2020 2025 2030 2035
Pe
rce
nta
ge
of
pe
op
le s
erv
ed
Indonesia Rural solid waste development
Collection Treatment

Urban Sanitation Development Program Sanitation Needs Assessment 2015-2019
18
Table 9 Scenario 3: 75% of budget compared to a 100% access scenario by the end of 2019
Description: 89% access for WWTP and 71% urban MSW collection is reached by the end of 2019.
WWT In the year 2035 50% of the current urban on-site users will have switched to off-site systems; Only about 10% of these will switch the first 5 years
MSW It is assumed that 31% of urban waste is processed via 3R and 69% in a conventional way. For rural waste in high density areas this is respectively 31% (3R) and 69% (conventional).
111 new TPAs are developed by the end of 2019
Drainage It is assumed that in each of the next four 5-years period 75% of the area in PPSP 1 is addressed (16,875 ha)
Sub-sector
System Rp Total
On-site
systems
[1]
Community
based
systems
IPLTMedium de-
centralizedCentralized
Total
WWTP
Collection
activities
[2]
Final disposal
and 3R
facilities [3]
TotalPrimary
facilities
Secondary +
tertiary
facilities
Total
Existing investments 2015 Trillion 183.2 156.0 2.2 2.0 0.7 0.9 161.8 5.9 1.8 7.7 5.7 8.0 13.7
New Investments (2015-2034) Trillion 582.6 93.0 5.5 1.2 262.5 47.8 410.0 17.4 114.2 131.6 17 24 41.0
targets access to sanitation 59% 0% (32%) 0% 0% 60% 25% 4% 25%
0-5 years (2015-2019) 77% 1% (28%) 9% 1% 89% 42% 42% 42%
6-10 years (2020-2024) 78% 1% (30%) 18% 3% 100% 79% 85% 79%
11-15 years (2025-2029) 71% 1% (27%) 24% 4% 100% 81% 87% 81%
16-20 years (2030-2034) 65% 1% (25%) 29% 4% 100% 84% 90% 84%
Investment planning
Inv.: 0-5 y (2015-2019) Trillion 205.3 62.5 5.0 1.1 71.6 11.1 151.4 4.6 39.0 43.6 4.3 6.0 10.2
Inv.: 6-10 y (2020-2024) Trillion 180.2 23.5 0.4 0.0 78.6 15.8 118.3 9.7 41.9 51.6 4.3 6.0 10.2
Inv.: 11-25 y (2025-2029) Trillion 99.4 3.6 - 0.0 57.1 10.6 71.3 1.6 16.2 17.8 4.3 6.0 10.2
Inv.: 16-20 y (2030-2034) Trillion 97.8 3.4 - 0.0 55.3 10.3 69.0 1.5 17.0 18.6 4.3 6.0 10.2
Current OPEX[5] Billion/y 8,772 3,585 32 incl. in on-site 15 15 3,646 4,343 237 4,580
OPEX: at 5 y Billion/y 18,959 4,974 73 incl. in on-site 1,749 221 7,017 7,877 2,349 10,227
OPEX: at 10 y Billion/y 31,118 5,323 79 incl. in on-site 3,634 516 9,551 15,030 4,111 19,141
OPEX: at 15 years Billion/y 34,782 5,114 79 incl. in on-site 5,075 725 10,993 16,222 4,441 20,664
OPEX: at 20 y Billion/y 38,347 4,942 79 incl. in on-site 6,464 925 12,410 17,355 4,757 22,112
[2] Cost for existing investments (sunk cost) the same unit cost as for new collections systems is used and the average known cost for existing TPA's
period
period
period
period
18,199 All Kabkot
26%
[3] Currently an estimated 4% of population's waste is disposed of in a sanitary landfill; cost are based on prices of TPA sites constructed by 2013
[4] In PPSP (2010-2014) 22,500 ha were planed to be improved; it is assumed that every 5 years 16,875 ha is improved; prices are based on study provided by PU in 2012; in which deviation is based on kabkot
metropolitan, besar, sedang and kecil
[5] Estimated OPEX consists of "technical" and "insitutional" OPEX;
Technical OPEX for WWTP: on-site + CBS: maintenance, sludge diposal; off-site: labour, chemicals, sludge disposal, energy use and maintenance; MSW: labour, maintenance, collection costs and
replacements costs for vehicles and processing costs for 3R, and TPA; Drainage: estimated as 2% of investment costs for general maintenance
546
956
1,365
1,775
2,185
[1] WWTP for existing infrastructure are based on 2015 access values multiplied by on-site, community based and (medium de)centralized specific prices of respectively, 1, 1.85 and 3.52 and 4.21 million Rp/p
and corrected for regional price levels; for systems in new developments only half the cost is applied compared to new systems in existing areas
Investments
43.6
OPEX
80.9
Origin of funds WWT MSW Drainage total
OPEX
131.6 41.0 582.6 100%
Total 5 years (2015-2019)
Investments
National 80.9 24.1 4.3
Local gov't (Kabkot+Prov) 18.5 18.3 6.0
users/community 52.0
7,017
total 151.4 10.2
MSWWWTP Drainage [4]
users/community 76.5
10,227 956
141.0 24%
36,707
60.7 56.4 23.9
National
21%
Institutional OPEX; for WWTP these are included in the technical operational costs; MSW is based on PU bidang sampah II (chapter 5) in which the presented organization is assumed to be typical for a
Kab/Kot besar, for other types of Kab/Kot the organization is adjusted lineairly ; drainage 2% of investment; these costs are assumed to cover organizational requirements for technical and financial
managementWWTP Development
MSW Development
Origin of funds WWT MSW Drainage
trillion Rp
Total 5 years (2015-2019)0.1 11.8 6%
total 80.9 24.1 4.3 109.3 53%
CA /instit. (Health + Bangda) 11.1 0.7
Design and studies (PU) 3.4 1.6 0.1 5.1
Total 5 years (2015-2019)
Investments
Infra (Public works) 13.4 4.4 5.7 23.4 11%
Design and studies (PU) 0.2 13.0 0.2 13.4 7%
CA /instit. (Health + Bangda) 4.9 1.0
total
Division Local (prov./Kabkot) WWT MSW Drainage total
trillion Rp
Investments
21.9 4.1 92.4
Division national WWT MSW Drainage total
2%
Infra (Public works) 66.5
trillion Rp
trillion Rp
billion Rp/y
trillion Rp
Total access to WWT facilities development Rural access to WWT facilities developmentUrban access to WWT facilities development
Total access to MSW facilities development Urban access to MSW facilities development Rural access to MSW facilities development
total contribution
All Kabkot
272.8 70.9 17.1 360.7 62%
Local gov't (Kabkot+Prov)
14%
total 410.0
12,410 22,112 2,185
Total 20 years (2015-2034)4.4 0.0
trillion Rp
trillion Rp
trillion Rp
billion Rp/y
trillion Rp
1.1 0.0 53.1
45%
205.3 100%
109.3 53%
42.8
trillion Rp
trillion Rp
trillion Rp
trillion Rp
trillion Rp
trillion Rp
trillion Rp
0.1 6.0 3%
18.5 18.3 6.0 42.8 21%
0%
10%
20%
30%
40%
50%
60%
70%
80%
90%
100%
2015 2020 2025 2030 2035
Indonesia Total sanitation development
on-site CBS IPAL Kawasan IPAL Pusat unimproved
0%
10%
20%
30%
40%
50%
60%
70%
80%
90%
100%
2015 2020 2025 2030 2035
Indonesia Urban sanitation development
on-site CBS IPAL Kawasan IPAL Pusat unimproved
0%
10%
20%
30%
40%
50%
60%
70%
80%
90%
100%
2015 2020 2025 2030 2035
Indonesia Rural sanitation development
on-site CBS IPAL Kawasan IPAL Pusat unimproved
0%
10%
20%
30%
40%
50%
60%
70%
80%
90%
100%
2015 2020 2025 2030 2035
Pe
rce
nta
ge
of
pe
op
le s
erv
ed
Indonesia Total solid waste development
Collection Treatment
0%
10%
20%
30%
40%
50%
60%
70%
80%
90%
100%
2015 2020 2025 2030 2035
Pe
rce
nta
ge
of
pe
op
le s
erv
ed
Indonesia Urban solid waste development
Collection Treatment
0%
10%
20%
30%
40%
50%
60%
70%
80%
90%
100%
2015 2020 2025 2030 2035
Pe
rce
nta
ge
of
pe
op
le s
erv
ed
Indonesia Rural solid waste development
Collection Treatment

Urban Sanitation Development Program Sanitation Needs Assessment 2015-2019
19
3.3. Development of facilities
For the three described scenarios the typical cumulative number of systems per 5-year interval is
described. The numbers are the sum of systems required at Kab/Kota level. In paragraph 3.3.1 all
WWT facilities are presented. In paragraph 3.3.2 all MSW facilities and developments are presented
3.3.1. Development of WWT facilities
Table 10 Scenario 1: Development of WWT systems cumulative
Approximate development of WWT infrastructure cumulative
2015-2019 2015-2024 2015-2029 2015-2034 Unit
On-site 46,954,695 47,656,126 48,983,013 50,861,490 systems
Community based 13,339 13,517 13,517 13,517 systems
IPLT 753 763 773 779 units
IPAL kawasan 2,364 3,838 5,295 6,722 systems
IPAL pusat 53 63 76 91 systems
Table 11 Scenario 1: Development of WWT systems per 5 years
Approximate new development of WWT infrastructure per 5 years
2015-2019 2020-2024 2025-2029 2030-2034 Unit
On-site 16,272,607 701,431 1,326,888 1,878,477 systems
Community based 9,362 178 0 0 systems
IPLT 665 10 10 6 units
IPAL kawasan 2,343 1,474 1,457 1,427 systems
IPAL pusat 47 10 13 15 systems
Table 12 Scenario 1: Development of WWT systems per 5 years per type of Kab/kot
Approximate new development of WWT infrastructure per 5 years
2015-2019 2020-2024 2025-2029 2030-2034 Unit
On-site 378,202 75 0 54 systems
Community based 6,382,729 1,121 201 896 systems
IPLT 3,951,973 3,472 157 415 units
IPAL kawasan 5,559,703 4,694 307 978 systems
IPAL pusat 16,272,607 9,362 665 2,343 systems

Urban Sanitation Development Program Sanitation Needs Assessment 2015-2019
20
Table 13 All scenarios: applied number of households served per type of Kab/Kot
Applied systems per type of kabkot
type of kabkota Max size on-site HH CBS HH kawasan HH pusat HH
kecil 100,000 1 80 500 10,000
sedang 500,000 1 80 1,000 10,000
besar 1,000,000 1 80 2,000 25,000
metropolitan >1,000,000 1 80 5,000 50,000
Table 14 Scenario 2: Development of WWT systems cumulative
Approximate development of WWT infrastructure cumulative
2015-2019 2015-2024 2015-2029 2015-2034 Unit
On-site 36,813,187 46,754,242 56,249,751 65,233,832 systems
Community based 7,911 10,400 10,400 10,400 systems
IPLT 632 725 728 731 units
IPAL kawasan 1,591 3,838 5,295 6,722 systems
IPAL pusat 48 63 76 91 systems
Table 15 Scenario 2: Development of WWT systems per 5 years
Approximate new development of WWT infrastructure per 5 years
2015-2019 2020-2024 2025-2029 2030-2034 Unit
On-site 6,131,099 9,941,056 9,495,509 8,984,081 systems
Community based 3,934 2,489 0 0 systems
IPLT 544 93 3 3 units
IPAL kawasan 1,570 2,247 1,457 1,427 systems
IPAL pusat 42 15 13 15 systems
Table 16 Scenario 2: Development of WWT systems per 5 years per type of Kab/kot
Approximate new development of WWT infrastructure per type of Kab/Kot untill 2019
on-site CBS IPLT kawasan pusat Unit
kecil 202,763 33 0 38 0 systems
sedang 2,809,081 493 161 643 7 systems
besar 1,523,862 1,566 127 288 9 systems
metropolitan 1,595,393 1,842 256 601 26 systems
total 6,131,099 3,934 544 1,570 42 systems

Urban Sanitation Development Program Sanitation Needs Assessment 2015-2019
21
Table 17 Scenario 3: Development of WWT systems per 5 years per type of Kab/kot
Approximate development of WWT infrastructure cumulative
2015-2019 2015-2024 2015-2029 2015-2034 Unit
On-site 42,388,853 46,774,073 50,981,077 55,313,712 systems
Community based 10,935 11,437 11,437 11,437 systems
IPLT 700 753 755 760 units
IPAL kawasan 1,987 3,838 5,295 6,722 systems
IPAL pusat 49 63 76 91 systems
Table 18 Scenario 3: Development of WWT systems per 5 years
Approximate new development of WWT infrastructure per 5 years
2015-2019 2020-2024 2025-2029 2030-2034 Unit
On-site 11,706,765 4,385,220 4,207,004 4,332,635 systems
Community based 6,958 502 0 0 systems
IPLT 612 53 2 5 units
IPAL kawasan 1,966 1,851 1,457 1,427 systems
IPAL pusat 43 14 13 15 systems
Table 19 Scenario 3: Development of WWT systems per 5 years per type of Kab/kot
Approximate new development of WWT infrastructure per type of Kab/Kot untill 2019
on-site CBS IPLT kawasan pusat Unit
kecil 300,232 55 0 47 0 systems
sedang 4,780,553 843 184 772 7 systems
besar 2,871,061 2,632 147 350 9 systems
metropolitan 3,754,919 3,428 281 797 27 systems
total 11,706,765 6,958 612 1,966 43 systems

Urban Sanitation Development Program Sanitation Needs Assessment 2015-2019
22
3.3.2. Development of MSW facilities
Table 20 Scenario 1: Development of MSW systems cumulative
Approximate development of Solid waste infrastructure cumulative
2015-
2019
2015-
2024
2015-
2029
2015-
2034 Unit
Motor sampah 58,245 95,679 106,104 115,919 systems
TPS stations 16,100 26,458 29,339 32,052 systems
Armroll trucks 9,902 15,773 17,541 19,202 systems
3R stations communal level 2,763 6,769 7,236 7,688 systems
central 3R stations (digestion + composting) 309 336 485 634 systems
TPA 472 490 490 490 systems
Table 21 Scenario 1: Development of MSW systems per 5 years
Approximate new development of Solid waste infrastructure per 5 years
2015-
2019
2020-
2024
2025-
2029
2030-
2034 Unit
Motor sampah 58,245 37,434 10,424 9,815 systems
TPS stations 16,100 10,357 2,882 2,713 systems
Armroll trucks 9,902 5,871 1,768 1,661 systems
3R stations communal level 2,763 3,871 440 423 systems
central 3R stations (digestion + composting) 309 161 346 346 systems
TPA 341 149 0 0 systems
Table 22 Scenario 1: Development of MSW systems per 5 years per type of Kab/kot
Approximate new development of Solid waste infrastructure per type of Kab/Kot untill 2019
Motor
sampah
TPS
stations
Armroll
trucks
3R stations
communal
level
central 3R
stations (dig.
+compst.) TPA Unit
kecil 208 57 34 22 0 26 systems
sedang 9,807 2,711 1,603 632 37 190 systems
besar 8,890 2,457 1,473 519 28 56 systems
metropolitan 39,340 10,874 6,793 1,724 110 69 systems
total 58,245 16,100 9,902 2,898 175 341 systems

Urban Sanitation Development Program Sanitation Needs Assessment 2015-2019
23
Table 23 Scenario 2: Development of MSW systems cumulative
Approximate development of Solid waste infrastructure cumulative
2015-
2019
2015-
2024
2015-
2029
2015-
2034 Unit
Motor sampah 34,854 95,679 106,104 115,919 systems
TPS stations 9,634 26,458 29,339 32,052 systems
Armroll trucks 5,908 15,773 17,541 19,202 systems
3R stations communal level 2,666 6,769 7,236 7,688 systems
central 3R stations (digestion + composting) 170 333 482 631 systems
TPA 281 490 490 490 systems
Table 24 Scenario 2: Development of MSW systems per 5 years
Approximate new development of Solid waste infrastructure per 5 years
2015-
2019
2020-
2024
2025-
2029
2030-
2034 Unit
Motor sampah 34,854 60,825 10,424 9,815 systems
TPS stations 9,634 16,823 2,882 2,713 systems
Armroll trucks 5,908 9,865 1,768 1,661 systems
3R stations communal level 2,666 4,103 467 451 systems
central 3R stations (digestion + composting) 170 163 149 149 systems
TPA 150 340 0 0 systems
Table 25 Scenario 2: Development of MSW systems per 5 years per type of Kab/kot
Approximate new development of Solid waste infrastructure per type of Kab/Kot untill 2019
Motor
sampah
TPS
stations
Armroll
trucks
3R stations
communal
level
central 3R
stations (dig.
+compst.) TPA Unit
kecil 128 35 21 21 0 0 systems
sedang 6,086 1,682 995 582 37 36 systems
besar 5,517 1,525 914 478 27 46 systems
metropolitan 23,124 6,392 3,980 1,586 106 68 systems
total 34,854 9,634 5,908 2,666 170 150 systems

Urban Sanitation Development Program Sanitation Needs Assessment 2015-2019
24
Table 26 Scenario 3: Development of MSW systems cumulative
Approximate development of Solid waste infrastructure cumulative
2015-
2019
2015-
2024
2015-
2029
2015-
2034 Unit
Motor sampah 30,454 95,679 106,104 115,919 systems
TPS stations 8,418 26,458 29,339 32,052 systems
Armroll trucks 5,162 15,773 17,541 19,202 systems
3R stations communal level 2,492 6,769 7,236 7,688 systems
central 3R stations (digestion + composting) 166 331 480 629 systems
TPA 242 490 490 490 systems
Table 27 Scenario 3: Development of MSW systems per 5 years
Approximate new development of Solid waste infrastructure per 5 years
2015-
2019
2020-
2024
2025-
2029
2030-
2034 Unit
Motor sampah 30,454 65,225 10,424 9,815 systems
TPS stations 8,418 18,039 2,882 2,713 systems
Armroll trucks 5,162 10,612 1,768 1,661 systems
3R stations communal level 2,492 4,277 467 451 systems
central 3R stations (digestion + composting) 166 165 149 149 systems
TPA 111 379 0 0 systems
Table 28 Scenario 3: Development of MSW systems per 5 years per type of Kab/kot
Approximate new development of Solid waste infrastructure per type of Kab/Kot untill 2019
Motor
sampah
TPS
stations
Armroll
trucks
3R stations
communal
level
central 3R
stations (dig.
+compst.) TPA Unit
kecil 113 31 18 19 0 0 systems
sedang 5,341 1,476 873 544 37 14 systems
besar 4,842 1,338 802 447 27 32 systems
metropolitan 20,158 5,572 3,468 1,483 102 65 systems
total 30,454 8,418 5,162 2,492 166 111 systems

Urban Sanitation Development Program Sanitation Needs Assessment 2015-2019
25
3.4. Provincial investments (2015-2019)
For the three scenarios the required investment per province are assessed and presented below14.
14
The assessment is based on the 2010 administrative situation, which includes 497 kabkots in 33 provinces.

Urban Sanitation Development Program Sanitation Needs Assessment 2015-2019
26
Table 29 Scenario 1: Development of systems 2015-2019 per province (all values in billion Rp)
WWT 2015-2019 MSW 2015-2019 Drainage 2015-2019 Grand Total
prov
code Abbrev on-site CBS
IPAL
Kawasan
IPAL
Pusat Total Collection Treatment Total2 Primary Secondary Total3 Rounded
11 Aceh 1,436 93 901 - 2,430 75 105 180 655 918 1,573 7,500
12 SumUt 1,939 70 2,452 995 5,455 408 3,360 3,768 133 186 319 17,000
13 SumBar 1,228 2 751 136 2,118 135 269 403 59 82 141 5,200
14 Riau 1,436 23 655 108 2,221 102 777 878 27 38 66 5,400
15 Jambi 776 24 364 - 1,165 44 317 361 61 86 147 3,400
16 Sumsel 2,381 76 624 286 3,367 136 752 888 158 222 380 8,900
17 Bengkulu 456 17 265 - 737 13 134 146 15 21 36 1,800
18 Lampung 1,480 77 807 186 2,550 118 780 899 41 58 99 6,900
19 BaBel 155 - 202 31 388 46 186 232 14 20 35 1,100
21 KepRi 235 13 417 52 718 47 590 637 36 50 86 2,100
31 DKI - - 2,068 743 2,812 - 3,461 3,461 712 996 1,708 13,000
32 JaBar 2,108 262 18,487 2,489 23,345 1,240 11,343 12,583 102 143 245 62,800
33 JaTeng 1,978 544 4,205 - 6,726 606 4,910 5,516 791 1,107 1,898 25,100
34 Yogya 7 - 679 - 686 69 553 622 13 18 31 1,800
35 JaTim 3,920 820 6,060 533 11,334 799 8,183 8,982 423 593 1,016 38,200
36 Banten 1,312 438 3,743 193 5,686 346 3,393 3,739 39 54 93 15,300
51 Bali 96 - 929 138 1,163 100 534 635 203 284 486 3,200
52 NTB 534 174 1,237 163 2,108 133 890 1,023 222 311 533 6,600
53 NTT 1,981 38 720 96 2,835 71 232 303 28 40 68 6,000
61 Kalbar 1,494 - 627 114 2,235 121 127 248 38 53 92 4,600
62 Kalteng 1,148 3 259 - 1,409 50 96 146 22 30 52 3,000
63 Kalsel 1,049 12 428 46 1,535 93 691 784 25 34 59 4,300
64 Kaltim 490 6 786 483 1,765 78 404 481 42 58 100 4,200
71 Sulut 173 1 368 118 660 53 93 147 25 34 59 2,100
72 Sulteng 558 10 300 36 904 49 - 49 24 34 59 2,300
73 Sulsel 513 21 984 618 2,136 128 202 330 90 125 215 6,200
74 Sultra 468 18 425 - 911 26 - 26 39 55 94 2,100
75 Gorontalo 230 3 231 - 464 36 137 173 6 8 14 1,300
76 Sulbar 316 38 70 - 424 10 - 10 27 38 65 1,100
81 Maluku 449 4 122 74 648 23 - 23 27 38 66 1,500
82 Maluku Utara 278 16 152 - 446 16 - 16 25 35 60 1,100
91 Papua Barat 318 33 210 - 561 31 155 186 108 151 258 1,800
94 Papua 2,556 7 251 - 2,814 58 283 341 37 51 88 5,800
33,496 2,842 50,779 7,637 94,755 5,256 42,956 48,212 4,266 5,974 10,241 272,700

Urban Sanitation Development Program Sanitation Needs Assessment 2015-2019
27
In the table below, it is further indicated which part of the wastewater treatment investments is
required to serve the poor communities. More than half of the budget is required for development
of septic tanks for these poor households. Typically construction of developments is (see also
table 5) expected to be funded by the users themselves. In order to stimulate the development, it
could be considered that this budget (around 17 trillion Rp) is subsidised by the national
government. In the presented investment figures (table 6-9), this is not yet included.
Table 30 Scenario 1. Budget WWT development for poor households (2015-2019)
WWT 2015-2019 related to poor people
prov code Abbrev on-site CBS IPAL Kawasan IPAL Pusat Total
11 Aceh 800 59 63 - 922
12 SumUt 795 29 338 186 1,347
13 SumBar 376 1 116 39 532
14 Riau 393 6 47 14 460
15 Jambi 276 14 77 - 367
16 Sumsel 851 29 188 149 1,217
17 Bengkulu 230 8 47 - 284
18 Lampung 929 51 179 92 1,251
19 BaBel 59 - 27 8 93
21 KepRi 61 4 78 15 158
31 DKI 6 - 845 313 1,164
32 JaBar 1,050 104 4,431 601 6,186
33 JaTeng 2,024 430 981 - 3,434
34 Yogya 101 2 218 - 321
35 JaTim 3,519 658 1,924 222 6,323
36 Banten 472 186 556 53 1,266
51 Bali 83 0 130 15 228
52 NTB 488 135 499 112 1,234
53 NTT 656 12 63 22 753
61 Kalbar 406 - 85 24 515
62 Kalteng 171 0 7 - 179
63 Kalsel 347 4 42 1 394
64 Kaltim 158 4 74 46 282
71 Sulut 80 1 48 26 155
72 Sulteng 292 6 13 4 315
73 Sulsel 433 18 103 106 660
74 Sultra 236 10 29 - 274
75 Gorontalo 106 1 48 - 155
76 Sulbar 122 18 6 - 146
81 Maluku 142 2 12 21 176
82 Maluku Utara 46 3 4 - 54
91 Papua Barat 193 20 3 - 216
94 Papua 1,336 3 20 - 1,359
17,234 1,816 11,304 2,067 32,421

Urban Sanitation Development Program Sanitation Needs Assessment 2015-2019
28
In the table below a further split up is provided for the costs related to the development of MSW 3R
facilities per province in the period 2015-2019
Table 31 Scenario 1: Budget required for MSW 3R station (2015-2019)
MSW 3R treatment costs
prov code Abbrev urban low; communal urban high; central total
11 Aceh 110 18 127
12 SumUt 591 463 1,055
13 SumBar 185 12 197
14 Riau 226 53 280
15 Jambi 150 34 184
16 Sumsel 133 141 274
17 Bengkulu 52 18 70
18 Lampung 113 107 220
19 BaBel 46 16 62
21 KepRi 133 50 183
31 DKI 33 936 968
32 JaBar 926 2,038 2,964
33 JaTeng 1,230 316 1,546
34 Yogya 145 38 183
35 JaTim 1,649 839 2,488
36 Banten 385 446 831
51 Bali 142 56 197
52 NTB 139 117 256
53 NTT 80 52 133
61 Kalbar 92 - 92
62 Kalteng 105 - 105
63 Kalsel 197 28 225
64 Kaltim 135 25 160
71 Sulut 78 - 78
72 Sulteng 59 - 59
73 Sulsel 135 44 179
74 Sultra 27 5 32
75 Gorontalo 43 21 63
76 Sulbar 15 - 15
81 Maluku 34 - 34
82 Maluku Utara 14 - 14
91 Papua Barat 54 - 54
94 Papua 187 - 187
7,643 5,871 13,514

Urban Sanitation Development Program Sanitation Needs Assessment 2015-2019
29
Table 32 Scenario 2: Development of systems 2015-2019 per province (all values in billion Rp)
WWT 2015-2019 MSW 2015-2019 Drainage 2015-2019 Grand Total
prov code
Abbrev on-site CBS IPAL
Kawasan IPAL
Pusat Total Collection Treatment Total2 Primary Secondary Total3 Rounded
11 Aceh 1,346 85 952 - 2,383 75 105 180 655 918 1,573 4,200
12 SumUt 1,813 61 2,579 995 5,448 408 3,360 3,768 133 186 319 9,500
13 SumBar 1,181 2 755 136 2,074 135 269 403 59 82 141 2,700
14 Riau 1,335 20 672 108 2,134 102 777 878 27 38 66 3,200
15 Jambi 717 22 373 - 1,111 44 317 361 61 86 147 1,700
16 Sumsel 2,224 70 649 286 3,229 136 752 888 158 222 380 4,600
17 Bengkulu 422 15 290 - 727 13 134 146 15 21 36 900
18 Lampung 1,336 66 840 186 2,429 118 780 899 41 58 99 3,500
19 BaBel 152 - 209 31 392 46 186 232 14 20 35 700
21 KepRi 229 12 418 52 712 47 590 637 36 50 86 1,400
31 DKI - - 2,073 743 2,816 - 3,461 3,461 712 996 1,708 8,000
32 JaBar 2,190 239 20,801 2,899 26,129 1,240 11,343 12,583 102 143 245 36,200
33 JaTeng 1,947 469 4,491 - 6,908 606 4,910 5,516 791 1,107 1,898 14,100
34 Yogya 7 - 679 - 686 69 553 622 13 18 31 1,300
35 JaTim 3,758 734 6,398 533 11,423 799 8,183 8,982 423 593 1,016 21,300
36 Banten 1,232 399 3,781 193 5,605 346 3,393 3,739 39 54 93 9,500
51 Bali 77 - 929 138 1,144 100 534 635 203 284 486 2,300
52 NTB 511 152 1,368 174 2,204 133 890 1,023 222 311 533 3,700
53 NTT 1,878 35 803 116 2,833 71 232 303 28 40 68 3,200
61 Kalbar 1,378 - 637 114 2,129 121 127 248 38 53 92 2,600
62 Kalteng 1,113 2 265 - 1,380 50 96 146 22 30 52 1,600
63 Kalsel 982 11 442 46 1,481 93 691 784 25 34 59 2,400
64 Kaltim 473 5 788 483 1,749 78 404 481 42 58 100 2,300
71 Sulut 170 1 408 166 745 53 93 147 25 34 59 900
72 Sulteng 505 9 303 36 853 49 - 49 24 34 59 1,000
73 Sulsel 421 16 1,000 618 2,054 128 202 330 90 125 215 2,700
74 Sultra 416 16 427 - 860 26 - 26 39 55 94 1,000
75 Gorontalo 214 2 240 - 456 36 137 173 6 8 14 700
76 Sulbar 289 34 76 - 399 10 - 10 27 38 65 500
81 Maluku 422 4 129 74 627 23 - 23 27 38 66 700
82 Maluku Utara 252 14 156 - 422 16 - 16 25 35 60 500
91 Papua Barat 318 30 229 - 576 31 155 186 108 151 258 1,000
94 Papua 2,463 6 258 - 2,728 58 283 341 37 51 88 3,200
31,772 2,531 54,417 8,128 96,848 5,256 42,956 48,212 4,266 5,974 10,241 153,100

Urban Sanitation Development Program Sanitation Needs Assessment 2015-2019
30
In the table below, it is further indicated which part of the wastewater treatment investments is
required to serve the poor communities.
Table 33 Scenario 2: Budget WWT development for poor households (2015-2019)
WWT 2015-2019 related to poor people
prov code Abbrev on-site CBS IPAL Kawasan IPAL Pusat Total
11 Aceh 354 25 37 - 417
12 SumUt 306 11 181 80 578
13 SumBar 171 0 77 17 265
14 Riau 184 2 41 12 240
15 Jambi 116 6 55 - 177
16 Sumsel 427 14 80 46 567
17 Bengkulu 109 4 26 - 139
18 Lampung 399 20 94 37 550
19 BaBel 18 - 23 8 49
21 KepRi 25 2 55 7 89
31 DKI - - 259 87 346
32 JaBar 335 47 2,137 298 2,817
33 JaTeng 463 162 570 - 1,195
34 Yogya 1 - 188 - 189
35 JaTim 1,285 282 918 88 2,574
36 Banten 216 91 306 30 645
51 Bali 17 - 111 14 142
52 NTB 163 51 261 45 520
53 NTT 371 7 29 9 416
61 Kalbar 195 - 76 21 293
62 Kalteng 93 0 7 - 100
63 Kalsel 149 2 26 1 178
64 Kaltim 54 1 54 28 137
71 Sulut 22 0 28 8 57
72 Sulteng 120 2 9 2 134
73 Sulsel 93 4 64 58 220
74 Sultra 96 4 21 - 121
75 Gorontalo 44 1 25 - 69
76 Sulbar 58 8 3 - 69
81 Maluku 70 1 8 10 89
82 Maluku Utara 20 1 3 - 24
91 Papua Barat 70 7 2 - 80
94 Papua 805 2 11 - 818
6,849 759 5,788 907 14,303

Urban Sanitation Development Program Sanitation Needs Assessment 2015-2019
31
In the table below a further split up is provided for the costs related to the development of MSW 3R
facilities per province in the period 2015-2019.
Table 34 Scenario 2: Budget required for MSW 3R station (2015-2019)
MSW 3R treatment costs
prov code Abbrev urban low; communal urban high; central total
11 Aceh 101 16 117
12 SumUt 544 426 970
13 SumBar 170 11 181
14 Riau 208 49 257
15 Jambi 138 31 169
16 Sumsel 122 130 252
17 Bengkulu 48 17 64
18 Lampung 104 99 203
19 BaBel 42 15 57
21 KepRi 123 46 169
31 DKI 30 861 891
32 JaBar 852 1,875 2,727
33 JaTeng 1,131 291 1,422
34 Yogya 133 35 168
35 JaTim 1,517 772 2,289
36 Banten 354 410 765
51 Bali 130 51 181
52 NTB 128 107 235
53 NTT 74 48 122
61 Kalbar 85 - 85
62 Kalteng 96 - 96
63 Kalsel 181 25 207
64 Kaltim 125 23 148
71 Sulut 72 - 72
72 Sulteng 54 - 54
73 Sulsel 124 40 165
74 Sultra 25 4 30
75 Gorontalo 39 19 58
76 Sulbar 14 - 14
81 Maluku 31 - 31
82 Maluku Utara 13 - 13
91 Papua Barat 50 - 50
94 Papua 172 - 172
7,032 5,401 12,433

Urban Sanitation Development Program Sanitation Needs Assessment 2015-2019
32
Table 35 Scenario 3: Development of systems 2015-2019 per province (all values in billion Rp)
WWT 2015-2019 MSW 2015-2019 Drainage 2015-2019 Grand Total
prov code
Abbrev on-site CBS IPAL
Kawasan IPAL
Pusat Total Collection Treatment Total2 Primary Secondary Total3 Rounded
11 Aceh 2,411 156 1,175 - 3,742 65 - 65 655 918 1,573 5,400
12 SumUt 3,784 145 3,293 1,323 8,544 361 2,867 3,229 133 186 319 12,100
13 SumBar 2,082 6 860 177 3,125 121 - 121 59 82 141 3,400
14 Riau 2,415 43 757 108 3,323 88 605 693 27 38 66 4,100
15 Jambi 1,392 46 405 - 1,843 37 313 350 61 86 147 2,300
16 Sumsel 3,846 121 906 493 5,366 118 741 859 158 222 380 6,600
17 Bengkulu 736 28 389 - 1,152 10 132 142 15 21 36 1,300
18 Lampung 2,648 146 1,130 276 4,200 107 454 560 41 58 99 4,900
19 BaBel 324 - 231 31 586 42 100 142 14 20 35 800
21 KepRi 362 21 439 52 875 38 506 544 36 50 86 1,500
31 DKI 9 - 2,831 1,115 3,956 - 3,409 3,409 712 996 1,708 9,100
32 JaBar 4,663 426 29,461 4,234 38,785 1,074 11,142 12,216 102 143 245 51,200
33 JaTeng 5,545 1,067 5,427 - 12,039 538 4,517 5,055 791 1,107 1,898 19,000
34 Yogya 63 1 679 - 743 58 545 603 13 18 31 1,400
35 JaTim 8,633 1,442 8,597 671 19,343 697 7,460 8,156 423 593 1,016 28,500
36 Banten 2,357 701 4,672 193 7,922 298 3,217 3,515 39 54 93 11,500
51 Bali 293 - 968 138 1,399 86 372 458 203 284 486 2,300
52 NTB 1,160 328 1,887 273 3,648 121 880 1,001 222 311 533 5,200
53 NTT 2,895 55 1,102 178 4,230 65 229 294 28 40 68 4,600
61 Kalbar 2,367 - 681 114 3,163 110 126 236 38 53 92 3,500
62 Kalteng 1,698 4 282 - 1,984 44 - 44 22 30 52 2,100
63 Kalsel 1,830 20 610 56 2,516 81 562 642 25 34 59 3,200
64 Kaltim 973 13 844 564 2,393 59 292 351 42 58 100 2,800
71 Sulut 363 4 548 311 1,225 46 - 46 25 34 59 1,300
72 Sulteng 996 18 347 38 1,399 45 - 45 24 34 59 1,500
73 Sulsel 1,397 57 1,182 720 3,357 110 136 246 90 125 215 3,800
74 Sultra 830 33 449 - 1,312 22 - 22 39 55 94 1,400
75 Gorontalo 431 5 339 - 775 33 135 168 6 8 14 1,000
76 Sulbar 537 63 123 - 722 9 - 9 27 38 65 800
81 Maluku 735 7 153 74 969 19 - 19 27 38 66 1,100
82 Maluku Utara 478 27 169 - 674 14 - 14 25 35 60 700
91 Papua Barat 608 59 287 - 954 28 - 28 108 151 258 1,200
94 Papua 3,622 10 386 - 4,018 49 280 329 37 51 88 4,400
62,482 5,050 71,610 11,140 150,281 4,591 39,019 43,610 4,266 5,974 10,241 204,000
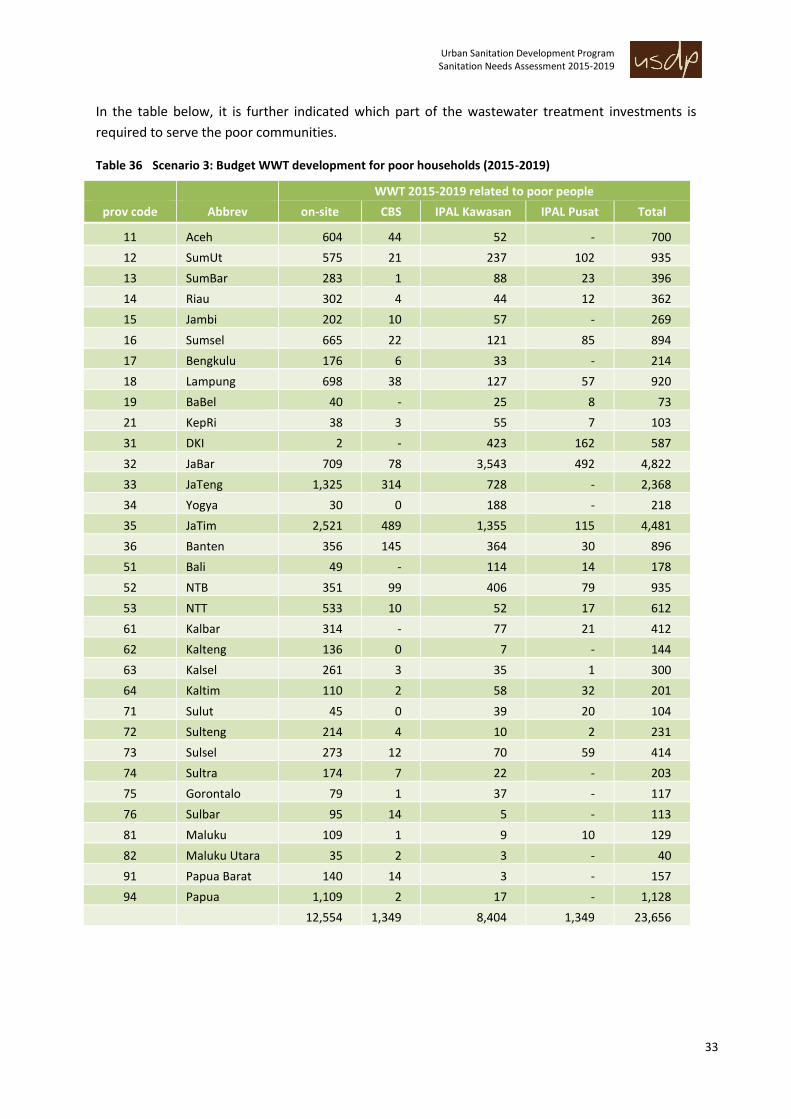
Urban Sanitation Development Program Sanitation Needs Assessment 2015-2019
33
In the table below, it is further indicated which part of the wastewater treatment investments is
required to serve the poor communities.
Table 36 Scenario 3: Budget WWT development for poor households (2015-2019)
WWT 2015-2019 related to poor people
prov code Abbrev on-site CBS IPAL Kawasan IPAL Pusat Total
11 Aceh 604 44 52 - 700
12 SumUt 575 21 237 102 935
13 SumBar 283 1 88 23 396
14 Riau 302 4 44 12 362
15 Jambi 202 10 57 - 269
16 Sumsel 665 22 121 85 894
17 Bengkulu 176 6 33 - 214
18 Lampung 698 38 127 57 920
19 BaBel 40 - 25 8 73
21 KepRi 38 3 55 7 103
31 DKI 2 - 423 162 587
32 JaBar 709 78 3,543 492 4,822
33 JaTeng 1,325 314 728 - 2,368
34 Yogya 30 0 188 - 218
35 JaTim 2,521 489 1,355 115 4,481
36 Banten 356 145 364 30 896
51 Bali 49 - 114 14 178
52 NTB 351 99 406 79 935
53 NTT 533 10 52 17 612
61 Kalbar 314 - 77 21 412
62 Kalteng 136 0 7 - 144
63 Kalsel 261 3 35 1 300
64 Kaltim 110 2 58 32 201
71 Sulut 45 0 39 20 104
72 Sulteng 214 4 10 2 231
73 Sulsel 273 12 70 59 414
74 Sultra 174 7 22 - 203
75 Gorontalo 79 1 37 - 117
76 Sulbar 95 14 5 - 113
81 Maluku 109 1 9 10 129
82 Maluku Utara 35 2 3 - 40
91 Papua Barat 140 14 3 - 157
94 Papua 1,109 2 17 - 1,128
12,554 1,349 8,404 1,349 23,656

Urban Sanitation Development Program Sanitation Needs Assessment 2015-2019
34
In the table below a further split up is provided for the costs related to the development of MSW 3R
facilities per province in the period 2015-2019.
Table 37 Scenario 3: Budget required for MSW 3R station (2015-2019)
MSW 3R treatment costs
prov code Abbrev urban low; communal urban high; central total
11 Aceh 94 15 109
12 SumUt 509 398 907
13 SumBar 159 10 169
14 Riau 195 46 240
15 Jambi 129 29 158
16 Sumsel 114 121 236
17 Bengkulu 44 16 60
18 Lampung 97 92 189
19 BaBel 39 14 53
21 KepRi 115 43 158
31 DKI 28 805 833
32 JaBar 796 1,753 2,549
33 JaTeng 1,058 272 1,329
34 Yogya 125 33 157
35 JaTim 1,418 721 2,140
36 Banten 331 383 715
51 Bali 122 48 169
52 NTB 119 100 220
53 NTT 69 45 114
61 Kalbar 79 - 79
62 Kalteng 90 - 90
63 Kalsel 170 24 193
64 Kaltim 116 22 138
71 Sulut 67 - 67
72 Sulteng 50 - 50
73 Sulsel 116 38 154
74 Sultra 24 4 28
75 Gorontalo 37 18 54
76 Sulbar 13 - 13
81 Maluku 29 - 29
82 Maluku Utara 12 - 12
91 Papua Barat 47 - 47
94 Papua 161 - 161
6,573 5,049 11,622

Urban Sanitation Development Program Sanitation Needs Assessment 2015-2019
35
4. Conclusions
Presented results show the typical investment and operational requirement for the three
sub-sectors applying different targets. In all cases the majority of investments are required for
development of the wastewater treatment sector, followed by solid waste and finally drainage.
Described development paths should be seen in relation with the findings of the impact PPSP-1
document, as presented in December 2013 by USDP.

Urban Sanitation Development Program Sanitation Needs Assessment 2015-2019
36
5. References
Aprilia, A., Tezuka, T., & Spaargaren, G. (2012). Household Solid Waste Management in Jakarta ,
Indonesia : A Socio-Economic Evaluation. In L. F. M. Rebellon (Ed.), Waste management - An
integrated vision (first., p. 30). Croatia: InTech.
BPS. (2013). Proyeksi Penduduk Indonesia Indonesia Population Projection (p. 458). Jakarta,
Indonesia.
DKI. Wastewater management in Province DKI (originally in Indonesian: PENGELOLAAN AIR LIMBAH
DOMESTIK DI PROVINSI DAERAH KHUSUS IBUKOTA JAKARTA DENGAN) (2005). DKI, Jakarta,
Indonesia.
Kearton, R., Alvarez, V.V.Setiono, I. M., Soraya, G., Fook, C. E., Pollard, R., Ignacio, D. M., … Blackett,
I. (2013). East Asia Pacific Region Urban Sanitation Review; Indonesia Country Study (p. 52).
Jakarta, Indonesia.
KNLH. (2008). Statistik Persampahan Indonesia, tahun 2008 (Waste management statistics
Indonesia, year 2008) (p. 29). Jakarta, Indonesia.
Ministry of Health. (2010). RISET KESEHATAN DASAR (Basic health research) (p. 431). Jakarta,
Indonesia.
Ministry of Health. (2013). RISET KESEHATAN DASAR (Basic health research) (p. 265). Jakarta,
Indonesia.
MoE. Law No. 112, 2003; Domestic wastewater discharge standard. Ministry of Environment,
Indonesia (2003). Jakarta, Indonesia: Ministty of Environment.
PU. (2013). Material: Sector solid waste: dissemination and socialization of technologies sector PLP;
(original Indonesian title: Materia Bidang sampah I&II: Disseminasi dan socialisasi keteknikan
bidang PLP (first., p. 882). Jakarta, Indonesia: Ministry of Public Works of Indonesia.
SKM. (2011a). Wastewater Investment Master plan Package II: Palembang, Final Feasibility Study
(activity W004) (Vol. 4, p. 98 (annexes 209)). Jakarta, Indonesia.
SKM. (2011b). Wastewater Investment Master plan Package II: Pekanbaru, Final Feasibility Study
(activity W005) (p. 226). Jakarta, Indonesia.
TTPS. (2009). Reference book: Sanitation system and technolog options (originally in Indonesian Opsi
Sistem dan Teknologi Sanitasi) (first., p. 172). Jakarta, Indonesia: Government of Indonesia,
with Bappenas as lead agency of the Technical Team for Sanitation Development (“TTPS”),
together with the World Bank’s Water and Sanitation Program - East Asia and the Pacific (WSP-
EAP).
UNEP. (2004). Guidelines on Municipal Wastewater Management (p. 92). The Hague: UNEP/GPA
Coordination office, The Hague.
Van Buuren, J. C. L. (2010). Sanitation Choice Involving Stakeholders, a participatory multi-criteria
method for drainage and sanitation system selection in developing cities applied in Ho Chi Minh
City, Vietnam. Wageningen University and Research Centre.
WSP. (2013). Assessment of Sludge Accumulation and Pit Filling Rates in Indonesia (p. 45). Jakarta,
Indonesia.

Urban Sanitation Development Program Sanitation Needs Assessment 2015-2019
37
6. Colophon
This document was produced by the Urban Sanitation Development Program (USDP). USDP provides
Technical Assistance to the “Accelerated Sanitation Development for Human Settlements” Program
(PPSP), a Government of Indonesia Program implemented by the TTPS, a sanitation-oriented
collaborative program between eight Ministries, with Bappenas as lead agency. PPSP is implemented
through a PMU at Bappenas and three PIUs at the Ministries of Health, Home Affairs and Public
Works.
USDP’s services focus on facilitation and capacity building and training targeting the principle
stakeholders and actors in the PPSP Program. USDP is funded by the Embassy of the Kingdom of the
Netherlands.
DHV BV in association with PT Mitra Lingkungan Dutaconsult, Royal Haskoning Indonesia, Witteveen
+ Bos Indonesia, MottMacDonald Indonesia, IRC International Water and Sanitation Centre and PEM
have been contracted to provided a range of technical services in support of the implementation of
PPSP.
Your letters, e-mails, enquiries can be forwarded to:
Urban Sanitation Development Program (USDP)
Jl. Lembang No. 11 A
Kecamatan Menteng
Jakarta 10310, Indonesia
Phone: (62-21) 319 248 92, 237 287 48
Fax: (62-21) 319 248 95
Email:[email protected]
For information, please also check our website: www.sanitasi.or.id
Client : Embassy of Kingdom of the Netherlands, POKJA AMPL - Bappenas
Project : Urban Sanitation Development Program
Report Title : Sanitation Needs Assessment 2015-2019
Length of Report : 60 Pages Including Annexes
Author : Sjoerd Kerstens
Contributions : Koen Broersma
Project Manager : Bram van der Boon
Project Director : Dadang Fadilah
Date : August 2014
Status : Final

Urban Sanitation Development Program Sanitation Needs Assessment 2015-2019
38


Urban Sanitation Development Program Sanitation Needs Assessment 2015-2019
40
Annex 1 Wastewater treatment infrastructure
The following starting points were used.
Costs for sewer connections were determined using the method of Loetscher as described by
Van Buuren (Van Buuren, 2010) and compared with reported costs in Indonesia (SKM, 2011a)
and (SKM, 2011b) and the costs of the sewerage systems constructed in Banjarmasin (personal
communication with PDPAL Banjarmasin). Results are shown below. The consideration here is
that the collection system for the IPAL Kawasan is assumed to be simpler than for the IPAL
Terpusat. Since the IPAL Kawasan serves a smaller area, costly measures such as working in busy
roads, crossing rivers/streams and other infrastructure, pumping stations etc. can be avoided;
also smaller diameter pipes are used at less steep gradients.
It is assumed that an IPAL Kawasan serves typically between 500 and 5,000 households,
depending on the type of Kab/Kota as shown in the table below:
Type of kab/kota Max size of
Kab/Kota on-site HH CBS HH Kawasan HH Pusat HH
kecil 100,000 1 80 500 10,000
sedang 500,000 1 80 1,000 10,000
besar 1,000,000 1 80 2,000 25,000
metropolitan >1,000,000 1 80 5,000 50,000
For typical prices it is assumed that an IPAL Kawasan has to comply with at least the national
Gov’t regulation (MoE, 2003) and preferably the DKI standard (No 122; 2005) (DKI, 2005). This
requires a maximum BOD of 50 mg/l and an ammonium concentration of maximum 10 mg/l.
This means that nitrification has to take place and oxidation (using aeration) is required; the
assessment assumes that 3 typical systems can be applied. An anaerobic filter is assumed to be
the most popular type for (40% of the cases), whereas 30% of the time an activated sludge
system or an activated sludge with additional N, P removal (also 30%) is applied).
An IPAL Terpusat serves from 5,000 – 50,000 households. For IPAL Terpusat pricing it is assumed
that apart of the aforementioned standards (MoE, 2003) and (DKI, 2005) part of the systems
simplified_min
simplified_max
pumpedsanitarypumpedsanitary
0
2
4
6
8
10
12
14
16
18
20
0 5,000 10,000 15,000 20,000 25,000 30,000
Mil
lio
n R
p/H
ou
seh
old
co
nn
ecte
d
Number of households connected
designed IndII Calculated constructed greenfield
2.2millionRp/p
3.2millionRp/p
1.1million Rp/p
1.6millionRp/p

Urban Sanitation Development Program Sanitation Needs Assessment 2015-2019
41
apply the more stringent requirement are assumed with a maximum total N-concentration of
10 mg/l and a total P-concentration of 5 mg/l. In view of the large flow and the impact on the
receiving water body it is assumed that an anaerobic filter is applied only in 10% of the cases,
whereas a conventional activated sludge (CAS), a CAS system with N, P removal or an aerobic
granular Sludge system are applied each 30% of the cases.
Community based systems typically serve 40-100 households. Here it is assumed that they serve
an average of 80 households. Community based systems have to comply with standard No 12,
2003 (BOD = 100 mg/l); A typical IPAL communal (Settler, anaerobic baffled reactor and
anaerobic filter) is assumed and is used as the basis for investment and operational costs.
In this assessment an on-site systems serves one household only. Typical costs of 1 million
Rp/person (including IPLT construction costs) is assumed.
Thus the total costs used in this assessment are as follows:
The corresponding OPEX costs for these systems are based on maintenance (2% of investment),
energy (1000 Rp/kWh), sludge disposal (150,000 Rp/ton), and labour costs. For the labour costs
it is assumed that:
o On-site: 0.5 day per year an FTE is required at UMP (Upah Minimum perorgangan) of 2.2
million Rp/month;
o Community based systems assume a of 0.2 FTE, corresponding with the PU guideline (PU,
2013), which states typical 400,000 Rp/month;
o For IPAL kawasan/terpusat the organizational structure of PDPAL Banjarmasin is used as an
example, which consist of 7 management level personnel and 46 support staff for 5 WWTP.
The support staff get the UMP standards, whereas the management level receives 10
million Rp/month, which is based on the guidelines of PU (PU, 2013) multiplied with a
factor 2 to come to a take home salary, based on a additional allowances (transport,
allocation, food etc). For terpusat systems it is assumed that on average 3 FTE at UMP is
added.
Thus the applied OPEX for the WWT systems are:
o On-site: 23,000 Rp/person served/year
o CBS: 27,000 Rp/person served/year
o IPAl kawasan: 71,000 Rp/person served/year
o Ipal terpusat: 68,000 Rp/person served/year
septic tank Sanimas existing new existing new
on-site community based kawasan pusat
WWTP 1.0 0.6 1.3 1.3 1.0 1.0
sewer 0.0 1.1 2.2 1.1 3.2 1.6
Inv
estm
en
t (m
illi
on
Rp
/pe
rso
n) Applied unit rates for indicated WWT facilities

Urban Sanitation Development Program Sanitation Needs Assessment 2015-2019
42


Urban Sanitation Development Program Sanitation Needs Assessment 2015-2019
44
Annex 2 Municipal solid waste
A. Waste generation data
Following the SNI standards 19-2983-1995 specific waste production of 2.5 l/p/d for rural cases and
2.75 l/p/d for urban cases were applied. A density of 0.25 ton/m3 of solid waste was applied, based
on data provided by PU. The density at the TPS level was set as 0.34 ton/m3 based on statistics of the
Ministry of Environment (KNLH, 2008).
Table Annex 2.1 Applied waste generation data
The organic fraction in urban solid waste was estimated as 59% based on figures provided by that
KNLH (KNLH, 2008) and corroborating with several reports (Aprilia, Tezuka, & Spaargaren, 2012). For
rural cases the absolute amount of organic waste is kept the same, and the described reduction of
waste is assumed to only affect the other waste flows, thus resulting in an organic fraction of 65%.
Table Annex 2.2 Applied waste composition data
Constituents Urban Rural
15
% kg/p/d % kg/p/d
Organics
Kitchen Biodegradables
52.1% 59% 0.406 65% 0.406
Garden & park 6.9%
Disposable diapers 4.0% 0.028 3.4% 0.021
Paper/cardboard 11.8% 0.081 10.1% 0.063
Textiles 1.0% 0.007 0.9% 0.005
Wood 1.4% 0.010 1.2% 0.007
Rubber & leather 0.6% 0.004 0.5% 0.003
Total 77.8% 0.535 81.0% 0.506
Inorganics
Plastic 13.9% 0.096 11.9% 0.074
Metal 4.0% 0.028 3.4% 0.021
Glass (pottery/ceramics) 2.3% 0.016 2.0% 0.012
Other (ash, dirt, dust, soil, e-waste) 1.9% 0.013 1.6% 0.010
Total 22.1% 0.152 18.9% 0.118
Total 100% 0.687 100% 0.624
15
The same generation of biodegradables in both urban and rural settings is used, the generation of
all other constituents in the rural situation was calculated assuming the same proportion from the total
generation as in the urban situation
Waste generation Unit Urban Rural
Waste by volume l/p/d 2.75 2.5
Density kg/l 0.25
Waste by weight kg/p/d 0.69 0.63
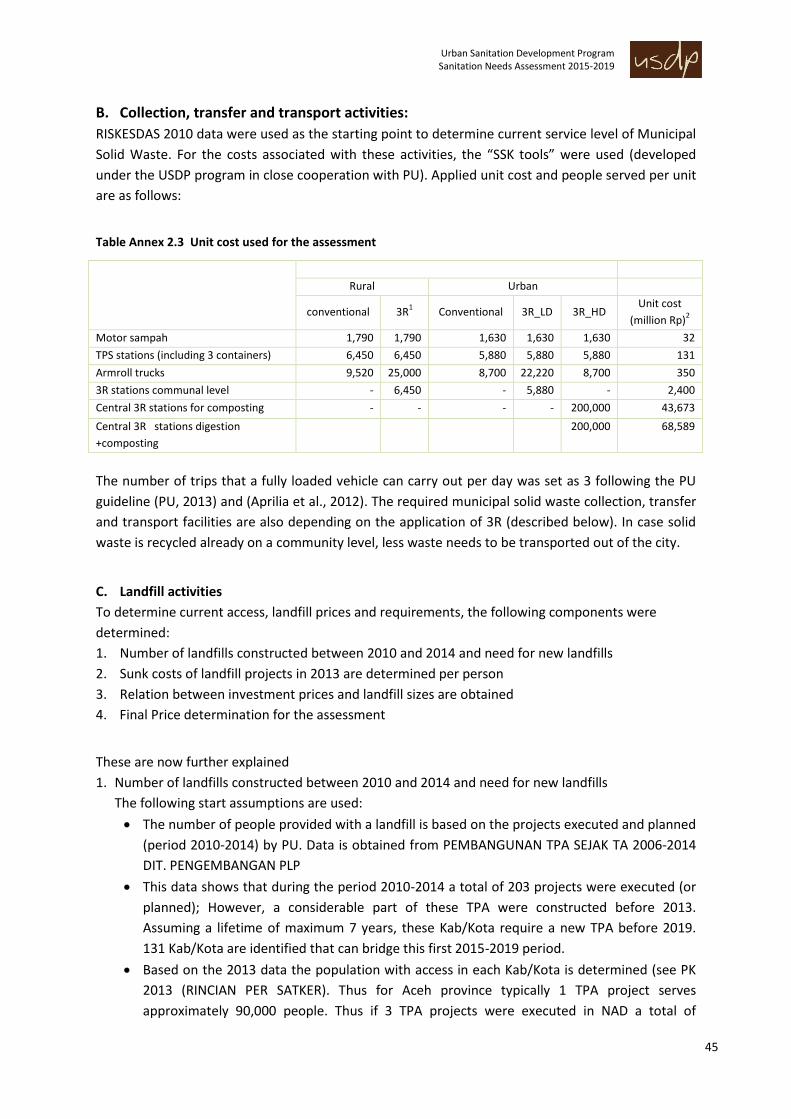
Urban Sanitation Development Program Sanitation Needs Assessment 2015-2019
45
B. Collection, transfer and transport activities:
RISKESDAS 2010 data were used as the starting point to determine current service level of Municipal
Solid Waste. For the costs associated with these activities, the “SSK tools” were used (developed
under the USDP program in close cooperation with PU). Applied unit cost and people served per unit
are as follows:
Table Annex 2.3 Unit cost used for the assessment
Category
Facility
Number of people in service area per unit
Rural Urban
conventional 3R1 Conventional 3R_LD 3R_HD
Unit cost
(million Rp)2
Motor sampah 1,790 1,790 1,630 1,630 1,630 32
TPS stations (including 3 containers) 6,450 6,450 5,880 5,880 5,880 131
Armroll trucks 9,520 25,000 8,700 22,220 8,700 350
3R stations communal level - 6,450 - 5,880 - 2,400
Central 3R stations for composting - - - - 200,000 43,673
Central 3R stations digestion
+composting
200,000 68,589
The number of trips that a fully loaded vehicle can carry out per day was set as 3 following the PU
guideline (PU, 2013) and (Aprilia et al., 2012). The required municipal solid waste collection, transfer
and transport facilities are also depending on the application of 3R (described below). In case solid
waste is recycled already on a community level, less waste needs to be transported out of the city.
C. Landfill activities
To determine current access, landfill prices and requirements, the following components were
determined:
1. Number of landfills constructed between 2010 and 2014 and need for new landfills
2. Sunk costs of landfill projects in 2013 are determined per person
3. Relation between investment prices and landfill sizes are obtained
4. Final Price determination for the assessment
These are now further explained
1. Number of landfills constructed between 2010 and 2014 and need for new landfills
The following start assumptions are used:
The number of people provided with a landfill is based on the projects executed and planned
(period 2010-2014) by PU. Data is obtained from PEMBANGUNAN TPA SEJAK TA 2006‐2014
DIT. PENGEMBANGAN PLP
This data shows that during the period 2010-2014 a total of 203 projects were executed (or
planned); However, a considerable part of these TPA were constructed before 2013.
Assuming a lifetime of maximum 7 years, these Kab/Kota require a new TPA before 2019.
131 Kab/Kota are identified that can bridge this first 2015-2019 period.
Based on the 2013 data the population with access in each Kab/Kota is determined (see PK
2013 (RINCIAN PER SATKER). Thus for Aceh province typically 1 TPA project serves
approximately 90,000 people. Thus if 3 TPA projects were executed in NAD a total of

Urban Sanitation Development Program Sanitation Needs Assessment 2015-2019
46
270,000 people are assumed to be served. This number is then divided by the total number
of citizens in Aceh, showing the population already served. Thus Indonesian wide values of
population served with final disposal is only 6%. The remaining population requires final
disposal of solid waste into a TPA. In the current assessment, extension or construction of
new landfills in those Kab/Kota that already have a landfill that can sustain until 2019
(constructed in 2013 or later) will only begin after 2020;
In the 100% access scenario (scenario 1) all Kab/Kota with an urban population will receive a
landfill. If a lower target is set (scenario 2 and 3) priority is given to the Kab/Kota with the
highest urban population in the nation. Alternatively this priority can be provided on a
provincial level.
2. Sunk costs for landfill prices and price per person;
Per province the number of planned TPA projects and the served population are determined.
Prices are converted to DKI prices using the Buku Referensi (2010)16.
As ABPN typically only provides 80% of the investments, values are corrected for this to
come to a total construction value;
Typical land acquisition costs are considered as 10% of the total investment costs.
Average value of presented data shows 180,000 Rp/person provided of which 80% origins
from ABPN. Note that this number is in line with the values calculated (see also figure 6, in
which the first development a quarter of the land costs amount to this similar value).
Indicated figure shows already an economy of scale effect; a TPA’s serving less people will
have a higher unit price.
3. Relation between landfill sizes and specific prices
Presented projects typically serve around 50,000-100,000 people. In order to determine
landfill prices serving bigger cities an extrapolation is required.
In this assessment, following discussion with PU, the development of TPA’s follow a stepwise
approach. This means that in the first phase the land for the complete period until 2035 is
purchased, a first cell with a lifetime of 5 years and the facilities are constructed (office,
16
50% of the provided additional or reduced costs compared to DKI are applied. For example, if the
Buku Referensi shows a factor 1.5 compared to DKI, a factor of 1.25 is used (reduce regional impacts)
y = 8E+06x-0.343
R² = 0.1624
-
50,000
100,000
150,000
200,000
250,000
300,000
350,000
400,000
0 25,000 50,000 75,000 100,000 125,000 150,000
Inve
stm
en
t (A
BP
N a
nd
lo
cal)
pe
r p
ers
on
people served
Typical investment costs per person for TPA development, corrected for local funding (20%) and
land costs (10%)

Urban Sanitation Development Program Sanitation Needs Assessment 2015-2019
47
weighing bridge, vehicles, leachate treatment plant). After the five years an extension is
developed, again with a lifetime of 5 years. However, offices, leachate treatment plants only
require some minor upgrading. Thus the second phase of the landfill development has lower
specific costs than the first development (see figure 7).
TPA prices of the first development are based on data received from PU (Buku Panduan
Konstruksi TPA, 2011). These were than adjusted for inflation, and additional heavy vehicles
(Buku Referensi (TTPS, 2009)).
To correct for the economy of scale effect, the trend as presented in the Buku Referensi
(2009) is followed. The typical price for a first development and subsequent cells are
presented in the figure 4 in the report (see figure 7).
For the different scenarios a standard price was formulated (assuming a landfill lifetime of
each cell of 5 years, to a maximum of 20 years (end of 2034), following the guideline in
(PU, 2013)). Note that in the assessment the value of land is calculated separately, as this
may vary per region (assumed current price for landfill is now set as 0.1 million Rp/m2.
Calculated prices for the different population served are shown in table annex 2.3. This table
shows that, besides the economy of scale effect (previous point), a landfill in a rural area
(comparing conventional situation) has lower costs than a landfill in an urban area, which is
the result of a lower solid waste production. In addition, it shows that the specific price drop
in case 3R is applied, as this results in less waste brought to a landfill and, thus per person
served a smaller landfill is required.
Table Annex 2.4 Assessed landfill prices per
RURAL URBAN
Variable in specific price
landfill first development
value people
used Value conv (HD)
Value 3R
(HD)
Value
Urban conv
Value
Urban 3R for landfill
<100,000 people 50,000 105,000 37,000 116,000 42,000 Rp/cap
100,000-250,000 people 200,000 105,000 37,000 116,000 42,000 Rp/cap
250,000-750,000 people 500,000 97,000 37,000 105,000 42,000 Rp/cap
>750,000 people 1,000,000 86,000 36,000 93,000 40,000 Rp/cap
Additional activities 6% 6% 6% 6%
based on
SSK tool
RURAL URBAN
Variable in specific price
landfill subsequent
value people
used Value conv (HD)
Value 3R
(HD)
Value
Urban conv
Value
Urban 3R for landfill
<100,000 people 50,000 63,000 22,000 69,000 25,000 Rp/cap
100,000-250,000 people 200,000 63,000 22,000 69,000 25,000 Rp/cap
250,000-750,000 people 500,000 61,000 22,000 67,000 25,000 Rp/cap
>750,000 people 1,000,000 59,000 22,000 65,000 25,000 Rp/cap
Additional activities 6% 6% 6% 6%
based on
SSK tool
4. Final Price determination for the assessment
In the assessment costs for collection, transfer and transport as well as operational costs are
assumed to be fixed (see Unity cost table and the landfill price table annex 2.1 and 2.2).

Urban Sanitation Development Program Sanitation Needs Assessment 2015-2019
48
When applying 3R, benefits can be obtained, which are not yet known or may vary. In our
assessment compost, glass and plastics and electricity recovery and production were
considered. Used prices are shown in the table annex 2.5 below.
Table annex 2.5 variable cost figures applied in the assessment
1. Variables price
Value
Rural
Value
Urban Unit 1B. NPV values* value unit
Compost 400 400 Rp/kg
Inflation/appreciation
5 % per year
Paper + Plastics 500 500 Rp/kg
Discount/interest
6 % per year
Energy 1,000 1,000 Rp/kWh
Start year 2015
Area need
Period
20 year
Area inside_collection 1.00 1.00 million Rp/m2
Area inside_3R treatment 1.00 1.00
Area outside_disposal 0.10 0.50 million Rp/m2
Area outside_3R treatment 0.10 0.50 million Rp/m3
Based on these prices the final prices as presented in chapter 2 (and repeated below in
table annex 2.5); including indicative NPV prices are found.
Figure Annex 2.1 NPB for formulated scenarios
Lowdensity
Highdensity
Lowdensity
Highdensity
Lowdensity
Highdensity
Lowdensity
HighDens
Dig/Com
HighDensCom
Rural_conv Urban_conv Rural Urban
Operational expenditure - 1,595,65 1,866,71 1,866,71 -230,313 847,182 937,546 994,869 1,072,815
Subsequent Capital expenditures - 183,183 200,830 200,830 0 67,389 76,869 76,869 76,869
Capital expenditure in first year - 252,824 508,714 508,714 25,750 761,564 868,847 613,998 485,276
RP
/PE
RS
ON
NET PRESENT VALUES

Urban Sanitation Development Program Sanitation Needs Assessment 2015-2019

Urban Sanitation Development Program Sanitation Needs Assessment 2015-2019
50
Annex 3 Drainage infrastructure
Prices for drainage infrastructure:
In 2012 a consultant prepared a study for PU on drainage prices per type of Kab/Kota These
prices were used as the starting points;
Average prices were used based on the number of Kab/Kota in Indonesia based on the assessed
2025 population.
The following average prices were used:
kecil sedang besar metro Average
add studies
+ design
total
price Unit
Average price
primary
185 209 238 249 232 5% 244 million/ha
Average price
Secondary
258 292 334 348 326 5% 342 million/ha
total 443 501 572 598 558 586 million/ha
Activities per province:
There is no estimation available on the budget required per province. Therefore an assessment
is made based on three components:
o PK 2013 (RINCIAN PER SATKER).xlsx the activities as provided by PU in 2013
o Priority areas as defined in the preparation of PPSP in 2009
o Areas that are addressed by ABPN during the PPSP 1 phase
The distribution of funding an intervention is assumed to follow the average distribution over these
three categories.

Urban Sanitation Development Program Sanitation Needs Assessment 2015-2019
51
Area addressed by
PUSAT in 2013 2013 area/province % area/province % Average 90000
NAD 11 9.7 1% 5274 10% 1250 27% 13% 11477
SumUt 12 5.2 0% 2491 5% 126 3% 3% 2403
SumBar 13 18.5 1% 785 2% 48 1% 1% 1168
Riau 14 5.9 0% 470 1% 26 1% 1% 574
Jambi 15 35.8 3% 369 1% 18 0% 1% 1090
Sumsel 16 18.9 1% 3236 6% 79 2% 3% 2827
Bengkulu 17 4.2 0% 257 1% 15 0% 0% 339
Lampung 18 11.5 1% 1000 2% 20 0% 1% 964
BaBel 19 11.2 1% 35 0% 8 0% 0% 309
KepRi 21 17.6 1% 426 1% 20 0% 1% 753
DKI 31 435.5 31% 4204 8% 594 13% 17% 15546
JaBar 32 8.8 1% 2756 5% 103 2% 3% 2484
JaTeng 33 254.4 18% 8997 18% 1534 33% 23% 20690
Yogya 34 11.0 1% 72 0% 10 0% 0% 340
JaTim 35 187.9 13% 5980 12% 240 5% 10% 9064
Banten 36 16.9 1% 377 1% 27 1% 1% 756
Bali 51 172.0 12% 483 1% 64 1% 5% 4330
NTB 52 7.6 1% 7395 15% 33 1% 5% 4746
NTT 53 16.9 1% 254 1% 15 0% 1% 604
Kalbar 61 20.7 1% 182 0% 18 0% 1% 663
Kalteng 62 10.8 1% 90 0% 15 0% 0% 378
Kalsel 63 8.0 1% 238 0% 18 0% 0% 426
Kaltim 64 7.5 1% 509 1% 39 1% 1% 713
Sulut 71 10.7 1% 240 0% 17 0% 1% 479
Sulteng 72 12.0 1% 261 1% 20 0% 1% 537
Sulsel 73 22.6 2% 1626 3% 90 2% 2% 2027
Sultra 74 8.1 1% 239 0% 80 2% 1% 837
Gorontalo 75 3.1 0% 18 0% 6 0% 0% 116
Sulbar 76 10.3 1% 452 1% 20 0% 1% 615
Maluku 81 11.1 1% 302 1% 20 0% 1% 543
Maluku Utara 82 16.1 1% 79 0% 10 0% 1% 452
Papua Barat 91 22.8 2% 1343 3% 5 0% 1% 1308
Papua 94 9.4 1% 285 1% 12 0% 0% 446
1422.7 50725 4600 100%
Applied distribution (used
average of these 3 data)
PK 2013 (RINCIAN PER
SATKER).xlsx PPSP (2009) identified areas
PPSP1 national addressed
(Source PU, 2012)

Urban Sanitation Development Program Sanitation Needs Assessment 2015-2019
52


