41
FEDERAL DEMOCRATIC REPUBLIC OF ETHIOPIA MINISTRY OF WATER AND ENERGY PART IV URBAN SANITATION UNIVERSAL ACCESS PLAN (USANUAP) December 2011 Addis Ababa

FEDERAL DEMOCRATIC REPUBLIC OF ETHIOPIA
MINISTRY OF WATER AND ENERGY
PART IV
URBAN SANITATION UNIVERSAL ACCESS PLAN
(USANUAP)
December 2011 Addis Ababa
Urban Sanitation UAP
MoWE Page i
Table of Contents Executive Summary ....................................................................................................................................... 1
1. Introduction ........................................................................................................................................... 3
2. Scope ..................................................................................................................................................... 3
3. Background ........................................................................................................................................... 3
3.1. Sanitation Service Levels .................................................................................................................... 3
3.2. Trends in Household Sanitation ......................................................................................................... 5
3.3. Quality of Latrines .............................................................................................................................. 5
3.4. Public Sanitation Services .................................................................................................................. 5
3.5 Sewerage ....................................................................................................................................... 5
4. Urban Sanitation Implementation Strategy ........................................................................................... 6
4.1. Implementation Strategy ................................................................................................................... 6
4.2. Implementation Organization Structure ............................................................................................ 7
5. Proposed urban sanitation Physical plan (2011-2015) .......................................................................... 7
5.1. Household Latrine and Hand washing Facilities Access plan ............................................................. 7
5.2. Institutional Toilet and Hand Washing Facilities ................................................................................ 8
5.3. Communal/Public Toilet and Hand Washing Facilities ...................................................................... 8
5.4. Desludging facilities Requirement ..................................................................................................... 9
5.5. Siting of Sludge drying Beds ............................................................................................................. 10
5.5.1. Cost of Desludging ................................................................................................................. 10
5.6. Solid waste Disposal facilities ..................................................................................................... 11
5.7. Siting of Sanitary land fill sites ......................................................................................................... 13
5.7.1. Cost of Solid Waste Disposal .................................................................................................. 13
5.8. Human Resource Requirement ........................................................................................................ 14
6. Proposed Indicative Financial plan (2011-2015) ................................................................................ 15
7. Conclusion and the way forward ........................................................................................................ 17
8. References .......................................................................................................................................... 18

Urban Sanitation UAP
MoWE Page ii
List of Tables
Table 3-1: Households with Access to Sanitation, CSA ............................................................................... 4 Table 5-1: Physical Plan for Achieving 100% Access in Access to Latrines by Town Category
(2011-2015) ................................................................................................................................. 7 Table 5-2 : Requirements of Public Toilets by Town Category ................................................................... 8 Table 5-3: Requirements of Desludging Facilities (2011-2020) ................................................................... 9 Table 5-4: Requirements of Land in Ha for Sludge Drying Bed by Town Category ................................. 10 Table 5-5: Cost of Desludging .................................................................................................................... 10 Table 5-6: Requirement of Solid Waste Disposal Facilities by Region ...................................................... 12 Table 5-7: Requirements of Land in Ha for Land fill Site by Town Category ........................................... 13 Table 5-8: Cost of Solid waste Disposal ..................................................................................................... 13 Table 6-1: Summary of Financial Urban Sanitation Universal Access Plan (2011-2015) ......................... 15
List of Figures Figure 3-1: Access to Sanitation, Urban Population (CSA 1994) ................................................................ 4 Figure 5-1: Urban Health Extension Workers (UHEWs) Requirement (2011-2015) ................................. 15 Figure 6-1: Breakdown of Urban Sanitation Financial Requirements ........................................................ 16 Figure 6-2: Estimated Rates in USD of Items to be procured and or Locally Assembled .......................... 17
List of Annexes Annex 1:Household Latrines to be constructed During the Planning Period ............................................ 20 Annex2: Model for Estimating Sanitation Facilities Requirements............................................................ 21 Annex 3: Costing Details of Solid Waste Disposal and Sludge Emptying Facilities ................................. 24 Annex 4: Proposed Health Extension Workers Requirement by Region and Town Category ................... 27 Annex 5: Details of Indicative Financial Requirements ............................................................................. 28
Urban Sanitation UAP
MoWE Page iii
List of Abbreviations and Acronyms AWSSA Addis Ababa Water Supply and Sewerage Authority CSA Central Statistical Agency DFID Department for International development ESP Environmental support Project GTP Growth and Transformation plan Ha hectares HSDP IV Health Sector Development Program IV JTR Joint Technical Review M&E Monitoring and Evaluation MIS Management Information System MoH Ministry of Health MoWR Ministry of Water Resources MOWE Ministry of Water and Energy MSF Multi Stakeholder Forum NHSSAP National Hygiene and Sanitation Strategic Action Plan PASDEP Plan for Accelerated Sustainable Development for Eradicating Poverty PE population equivalent PT Public Toilets SNNPNRS Southern Nations and Nationalities Peoples National Regional State TWB Town Water Board TSG Town Support Group TVETCs Technical Vocational Education Training Colleges UAP Universal Access Plan UHEW Urban Health Extension Workers USD United states Dollar WaSH Water Supply, Sanitation and Hygiene WIF WaSH Implementation Framework

Urban Sanitation UAP
MoWE Page 1
Executive Summary
The sanitation situation in the country is getting priority since 2000 following the launching of the health extension program. Many people living in rural and urban areas still look for access to safe and reliable sanitation facilities. In spite of the fact that the majority of households lack sufficient understanding of hygienic practices regarding food, water and personal hygiene exemplary results are being observed in some rural kebeles that have declared open defecation free status. It is now expected that the recently launched urban health extension program will also enable to change situations in urban areas and enable the country to cope up with the health problems related to unsafe and inadequate water supply and unhygienic waste management, including that of human excreta at a national level. The plan and corresponding investment requirement shown in this document are indicative and require further studies in the form of sanitation master plan or water supply and sanitation feasibility studies. It is foreseen that sanitation studies in most towns (other than those large towns where urban waste water master plans will be made) will be carried out as integrated components of water supply feasibility studies, the costs of which are to be included in the urban water supply budgets.
The scope of this component is limited to:
• Sewerage expansion in the case of Addis Ababa only. • on-site sanitation and septage collection and disposal, as an alternative to sewerage in all
the 970 towns in the country; • Solid waste disposal • Hygiene education and awareness promotion to support the impact of improved water
supply services on public health.
A complete National Urban Sanitation and Hygiene strategic action plan that includes urban drainage and other aspects is expected to be prepared by the Ministry of Urban development and construction.
The country requires a total of 203,250,078 USD for achieving 100% access to latrines, solid waste disposal and desludging facilities by the year 2015.
Physically the activities shown below with corresponding estimated expenses will be undertaken during the planning period:
I. No. Particulars Amount in USD
1 Sanitary Landfill site preparation 16,300,2262 Sludge drying Bed preparation 3,745,8093 Construction of Communal Toilets 32,995,3744 Construction of Public Toilets 32,995,3745 Procurement of 1 m3 donkey pulled carts 2,225,1976 2.5m3 capacity Truck for SW Disposal 2,134,9157 5m3 capacity Truck for SW Disposal 4,041,7808 2.5m3 Capacity Solid Waste Bins 682,576

Urban Sanitation UAP
MoWE Page 2
I. No. Particulars Amount in USD 9 5m3 Solid Waste Bins 1,216,55910 3m3 Capacity tractor mounted Vacuum Truck 3,815,29311 5m3 Capacity Vacuum Truck 4,132,90412 Sewerage Expansion 37,623,86413 San Mark 14,436,34214 Creation of Enabling environment and
Capacity Building 15,634,621
15 Urban Health Extension Activities 31,269,243 Total 203,250,078
In physical terms the construction of 2851 communal and public latrines & about 177,000 household latrines and upgrading of more than 200,000 latrines (to be verified after the WaSH inventory) that would fill the gap and help the country achieve 100% target, procurement of 544 vacuum trucks, 1,869 solid waste disposal carts, 283solid waste disposal trucks, 567 solid waste bins, preparation of sludge drying beds and sanitary landfill sites in all towns will be undertaken during the planning period. San Mark activities will be undertaken along with creation of enabling environment and capacity under the urban health extension program. The awareness creation will be undertaken by 6806 urban health extension workers, the health sector community, the WaSH movement, the media and school clubs. Monthly payments ranging from about 2USD to 2.9 USD based on town sizes are required to be paid by households to cover operation and depreciation expenses. In the case of the urban poor and the marginalized targeted subsidy could be applied to reasonably lower the indicated rates. Income generating options like composting of the waste could help in filling the gap for covering operation and depreciation expenses.

Urban Sanitation UAP
MoWE Page 3
1. Introduction
The sanitation situation in the country is getting priority since 2000 following the launching of the health extension. Many people living in rural and urban areas still look for access to safe and reliable sanitation facilities. In spite of the fact that the majority of households lack sufficient understanding of hygienic practices regarding food, water and personal hygiene exemplary results are being observed in some rural kebeles that have declared open defecation free status. It is now expected that the recently launched urban health extension program will also enable to change situations in urban areas and enable the country to cope up with the health problems related to unsafe and inadequate water supply and unhygienic waste management, including that of human excreta. The plan and corresponding investment requirement shown in this document are indicative and require further studies in the form of sanitation master plan or water supply and sanitation feasibility studies. It is foreseen that sanitation studies in most towns (other than those large towns where urban waste water master plans will be made) will be carried out as integrated components of water supply feasibility studies, the costs of which are to be included in the urban water supply budget.
2. Scope This Part IV document (i.e. Urban Sanitation UAP is to be read and used in conjunction with part 1: UAP rural water supply, part II: National hygiene and sanitation strategic action plan, Part III: Urban water supply UAP. A complete National Urban Sanitation and Hygiene strategic action plan is expected to be prepared by the Ministry of Urban development and construction. The sections of this indicative plan includes amongst other relevant aspects: • Sewerage expansion in the case of Addis Ababa only. • on-site sanitation and septage collection and disposal, as an alternative to sewerage in all
towns; • Solid waste disposal • hygiene education and awareness promotion to support the impact of improved water supply
services on public health
3. Background 3.1. Sanitation Service Levels
Access to sanitation does experience a steady increase in Ethiopia. Table 3.1 gives census and survey results of CSA.
Urban Sanitation UAP
MoWE Page 4
Table 3-1: Households with Access to Sanitation, CSA1 Year Urban Rural Overall Remarks 1994 57% 6% 13% 1996 58.0% 5.0% 13.0% 1998 67.7% 7.5% 16.0% 2000 2011
71.6% 75%
8.9% 57%
18.0% 60%
HSDP IV
The CSA survey statistics do provide data per region, zone and a selected number of towns. The 1994 Census also provides woreda and town-wise data. And there are variations. As stated in the 2003 Water supply and sanitation Master plan volume II document, the city-states of Addis Ababa, Dire Dawa and Harar score relatively higher latrine access, with 2/3 to ¾ of the town populations using a sanitary toilet. Review of more detailed data revealed that the use of flush toilets was only reserved to 12%, 7% and 8% of the dwellers of the three respective towns. In Addis Ababa this meant 45,000 households only in 2003, of which 1/3 use them as a shared facility. Changes in towns are relatively low as compared to rural areas where dramatic change has been registered i.e. a jump from about 10% in 2000 to more than 50% in 2011
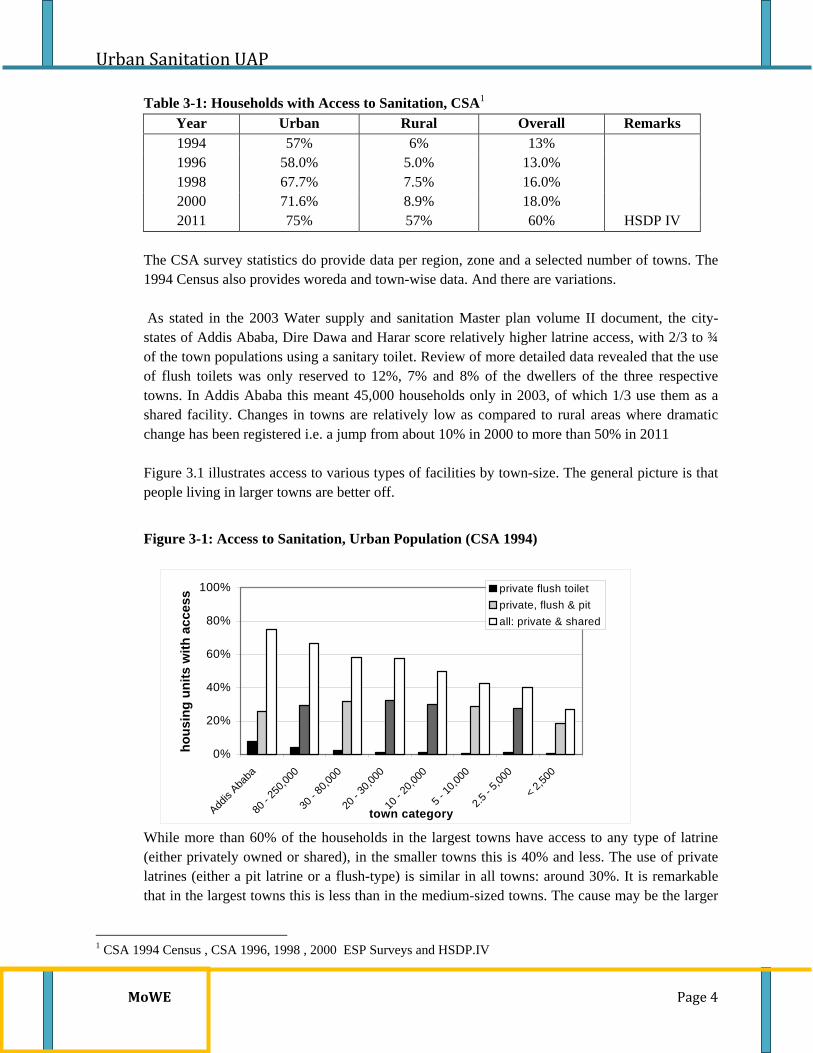
Figure 3.1 illustrates access to various types of facilities by town-size. The general picture is that people living in larger towns are better off.
Figure 3-1: Access to Sanitation, Urban Population (CSA 1994)
While more than 60% of the households in the largest towns have access to any type of latrine (either privately owned or shared), in the smaller towns this is 40% and less. The use of private latrines (either a pit latrine or a flush-type) is similar in all towns: around 30%. It is remarkable that in the largest towns this is less than in the medium-sized towns. The cause may be the larger
1 CSA 1994 Census , CSA 1996, 1998 , 2000 ESP Surveys and HSDP.IV
0%
20%
40%
60%
80%
100%
Addis
Ababa
80 - 2
50,00
0
30 - 8
0,000
20 - 3
0,000
10 - 2
0,000
5 - 1
0,000
2.5 -
5,00
0
< 2,50
0
town category
hous
ing
units
with
acc
ess private flush toilet
private, flush & pitall: private & shared

Urban Sanitation UAP
MoWE Page 5
low-cost residential areas in the first group, where sharing of toilet facilities may be more common due to lack of space. The possession of private flush latrines is more common in the largest towns: from 8% in Addis Ababa and 4.5% in towns larger than 80,000 inhabitants, to 2% and less in the smaller towns. In fact, in 1994 half of the country’s flush toilets were in Addis.
3.2. Trends in Household Sanitation The CSA censuses, surveys as well as household surveys undertaken for water supply and sanitation projects (11 towns, 12 towns, 25 towns, and Environmental Support project 10 towns) show the same trend: increasingly more households use latrines. There has been an autonomous growth of 3% annually, bringing the urban coverage (excluding Addis Ababa) from 51% in 1984 to 75% in 1998. Rural coverage shows an even stronger autonomous increase as mentioned above.
3.3. Quality of Latrines
As per survey done by the Environmental support project in 2003 the quality of latrines is generally poor. Over 50% are structurally unsafe and 50% hygienically inappropriate. It seems that households require assistance in these areas. There apparently is an interest to invest in household sanitation, but the quality of the facilities has much to desire for. The San Mark activity being launched recently is expected to improve quality in both rural and urban areas
3.4. Public Sanitation Services Addis Ababa is the only town with a small sewerage system with less than 3% of the population connected. Of these 25,000 pe (population equivalent) are from non-domestic institutions. Sludge collection services are limited to a few large towns only. Of the 30 largest towns surveyed in 2003 by Environmental Support Project (MoWE) only 11 had the service. In five of these the private sector provided the service in addition to the municipality.
3.5 Sewerage
Though sewerage was planned to be implemented in 36 towns at a cost of Birr 1,399,300,000 in 2003 in the water supply and sanitation plan document, the progress is little. In reality, it might be only Diredawa other than Addis Ababa that can start implementing small decentralized sewerage before 2015. Other towns like Mekele, Bahir Dar, Hawassa , Adama and Harar shall make an extraordinary effort to introduce decentralized sewerage before 2015 due to low per capita water consumption and high investment requirement. The city rehabilitation program going on in most

Urban Sanitation UAP
MoWE Page 6
of the large towns by constructing condominium buildings is of course creating conducive environment for decentralized sewerage as observed in Addis Ababa2.
Towns that expect to introduce sewerage should prepare Urban Wastewater Master Plans at the outset. These plans shall anticipate on sewerage development on the medium term, need to consider the introduction of small-scale neighbourhood sewerage in housing development areas, and shall include the provision of adequate septage collection and disposal services. The use of relatively cheaper subsurface flow constructed wetlands could be introduced in bigger towns with adequate space to polish wastewater effluent from septic tanks and primary wastewater treatment units as suggested by the horn of Africa environmental network sponsored study in Addis Ababa. Further Research and development in wastewater treatment by higher learning institutes is required to test the appropriateness of various cost effective technologies It would therefore be appropriate to undertake the wastewater master plan studies of at least the largest 10 towns before a realistic sewerage plan is prepared. To this end, it is only the sewerage expansion plan of Addis Ababa as indicated in the GTP that is included in this document.
4. Urban Sanitation Implementation Strategy 4.1. Implementation Strategy
These interventions target communities and institutions universally by giving attention to schools and health institutions. The urban sanitation plan will be implemented by Urban Health Extension agents and WaSH volunteers that are to be selected from among the community members, school children, teachers, health institution staffs trained for hygiene and sanitation promotion. Attention in regard to improving sanitation facilities will be given to low income communities (including disabled and people with special needs), schools and health institutions through construction of communal toilets. Public latrines (for sustainability these latrines could include bio-gas, public showers and cloth washing facilities when feasible) will be constructed at market places, bus stops and business centres. Health institutions and schools will be technically supported to construct and rehabilitate institutional/school latrines. The plan will be implemented by employing the three pillars of sanitation i.e. creation of enabling environment, capacity building and construction of facilities. The major actors to be involved in urban sanitation include the urban development, health, water and education sectors. Construction of urban sanitation facilities like sludge drying beds, sanitary landfill sites are to be undertaken by the municipalities. Desludging and solid waste disposal facilities will also be made available by the municipalities,
2 Condominium villages in Mickey Leyland, Gelan and Kaliti villages of Addis Ababa are connected to Waste stabilization ponds constructed by the Administration recently. Effluents from the ponds are currently being injected into rivers. Introduction of constructed wetland s for polishing the effluent could be foreseen in the years to come.
Urban Sanitation UAP
MoWE Page 7
water and sewerage services (in the case of desludging) and private sector (wherever feasible). It would be advisable to keep some of the solid waste disposal and desludging facilities at zonal level so that serving a number of small towns from a central place could be possible. A youth group or small scale micro enterprises could gradually be established and capacitated to undertake the disposal and desludging activities. Household latrines are expected to be executed by the communities themselves through the creation of awareness by the urban health extension workers. Model mothers trained by the health extension workers could speed up the process as is being demonstrated in Addis Ababa. Institutions are also expected to construct and rehabilitate their own schemes in the process of achieving the UAP targets by 2015. Moreover urban sanitation requires the enforcement of standards by implementing the “polluters pay principle” in the case of specially industries. The new slum upgrading program of constructing condominium building in towns is expected to provide room for affordable decentralized sewerage as demonstrated in some condominium villages in the capital city. The enhancement of acceptable quality latrine/toilet facilities construction could be achieved through San Mark activities to be run by youth group or small scale entrepreneurs for which more than 14million USD seed money is proposed in this plan.
4.2. Implementation Organization Structure
Urban Sanitation needs to be integrated with urban water supply and other infrastructure developments by the water and urban development sectors. The WaSH implementation Organizational structure presented in the WIF and Urban Water supply UAP could be utilized by including the urban development sector and municipalities till a more formal structure is put in place by the Ministry of Urban Development and Construction.
5. Proposed urban sanitation Physical plan (2011-2015) 5.1. Household Latrine and Hand washing Facilities Access plan
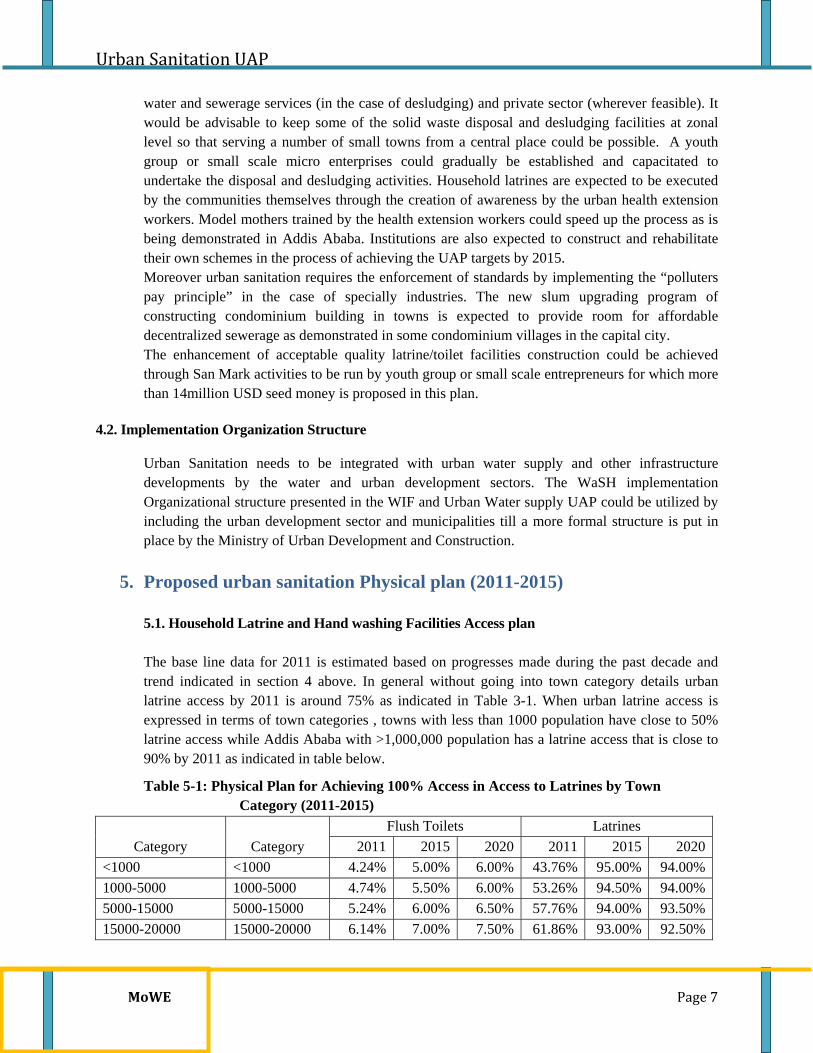
The base line data for 2011 is estimated based on progresses made during the past decade and trend indicated in section 4 above. In general without going into town category details urban latrine access by 2011 is around 75% as indicated in Table 3-1. When urban latrine access is expressed in terms of town categories , towns with less than 1000 population have close to 50% latrine access while Addis Ababa with >1,000,000 population has a latrine access that is close to 90% by 2011 as indicated in table below.
Table 5-1: Physical Plan for Achieving 100% Access in Access to Latrines by Town Category (2011-2015)
Category Category Flush Toilets Latrines
2011 2015 2020 2011 2015 2020<1000 <1000 4.24% 5.00% 6.00% 43.76% 95.00% 94.00%1000-5000 1000-5000 4.74% 5.50% 6.00% 53.26% 94.50% 94.00%5000-15000 5000-15000 5.24% 6.00% 6.50% 57.76% 94.00% 93.50%15000-20000 15000-20000 6.14% 7.00% 7.50% 61.86% 93.00% 92.50%

Urban Sanitation UAP
MoWE Page 8
Category Category Flush Toilets Latrines
2011 2015 2020 2011 2015 202020000-30000 20000-30000 7.05% 8.00% 8.50% 68.95% 92.00% 91.50%30000-50000 30000-50000 8.76% 10.00% 10.50% 71.24% 90.00% 89.50%50000-100000 50000-100000 10.48% 12.00% 12.50% 70.52% 88.00% 87.50%
100000-500000 100000-500000 13.00% 15.00% 18.00% 70.00% 85.00% 82.00%
500000-1000000 500000-1000000 14.00% 18.00% 20.00% 72.00% 82.00% 80.00%
>1000000 >1000000 17.14% 20.00% 25.00% 70.86% 80.00% 75.00% An estimated 176,732 new house hold latrines are expected to be constructed during the planning period (2011-2015) as shown in Annex 1 that gives details of new household latrines to be constructed by town category. Number of latrines to be upgraded for attaining acceptable standard could be more than 200,000 the exact figure of which could better be estimated following the finalization of the WaSH inventory. 5.2. Institutional Toilet and Hand Washing Facilities Institutional toilets and hand washing facilities will be universally constructed and or rehabilitated during the planning period by the institutions themselves through awareness creation to be enhanced by urban extension workers. Health centres and schools will be given higher attention with a view of mobilizing students and health experts as the core sanitation army. 5.3. Communal/Public Toilet and Hand Washing Facilities Communal toilets with hand washing facilities to be managed by communities and Public toilets with hand washing facilities that will be managed by the municipality, youth group or small enterprises are helpful in sanitizing towns. In the case of communal toilets and hand washing facilities needy communities will be encouraged to contribute up to 5o% of the construction cost in kind, labour and cash. Accordingly, it is proposed to construct a total of 2851 communal and public toilets for the various town categories in the countries as depicted in table below. Shower facilities and biogas production that are being demonstrated in some towns like Asosa could be included as part of the services for ensuring sustainability wherever feasible.
Table 5-2 : Requirements of Public Toilets by Town Category
Category Population Range 2020 Population
Proposed No. of Communal Toilets(PT)
Proposed No. of Public Toilets(PT) Assumption
Rate in USD of 1 public Toilet with 8 seats
Amount in USD of all Public toilets in the category (2011)
Total No of Toilets Within the category
1 <1000 1080 1 1PT/1,000People 22,728 22,728 25
2 1000 t0 5000 4277 1 1 2PT/5,000People 22,728 22,728 840
3 5000 to 15,000 11950 1 1 2PT/10,000People 22,728 22,728 764
4 15,000 to 20,000 24999 2 2 2PT/10000People 22,728 45,456 156
5 20,000 to 30,000 34640 2 2 2PT/15,000People 22,728 45,456 164
6 30,000 to 50,000 53162 4 4 2PT/15,000People 22,728 90,912 224

Urban Sanitation UAP
MoWE Page 9
Category Population Range 2020 Population
Proposed No. of Communal Toilets(PT)
Proposed No. of Public Toilets(PT) Assumption
Rate in USD of 1 public Toilet with 8 seats
Amount in USD of all Public toilets in the category (2011)
Total No of Toilets Within the category
7 50,000 t0 100,000 95938 5 5 2PT/20,000People 22,728 113,640 210
8 100,000 to 200,000 189557 9 9 2PT/20,000People 22,728 204,552 162
9 200,000 to 500,000 337513 17 17 2PT/20,000People 22,728 386,376 136
10 500,000 to 1,000,000 22,728 ‐
11 >1,000,000 4256478 85 85 2PT/50000People 22,728 1,931,880 170
Total 2851
5.4. Desludging facilities Requirement In a situation where the little progress in sewerage is limited to Addis Ababa, enhancing desludging services would be a key strategy for improving sanitation in all towns including Addis Ababa. Composting could be considered as a means for recycling and reusing the sludge. Table below gives requirements for desludging facilities by region in 2011, 2015 1nd 2020.
Table 5-3: Requirements of Desludging Facilities (2011-2020) I.No Region Desludging Facilities
3m3 Capacity tractor mounted
Vacuum Truck 5m3 Capacity Vacuum Truck 2011 2015 2020 2011 2015 2020
1 Afar 4 5 7 2 Gambella 1 1 1 1 1 13 Harari 1 2 24 Addis Ababa 31 42 535 Dire Dawa 2 3 46 Benishangul 3 4 6 7 Somali 11 15 21 1 2 28 Amhara 24 30 38 8 11 149 Oromia 56 75 102 11 15 19
10 SNNPR 28 38 53 5 7 811 Tigrai 11 15 21 4 6 8
Total 138 184 249 64 88 111 Sludge Drying Bed area for typical towns within the indicated population category in hectares is indicated in table below.

Urban Sanitation UAP
MoWE Page 10
Table 5-4: Requirements of Land in Ha for Sludge Drying Bed by Town Category
Category Population Range Sludge Drying Bed Area of a typical town
within the indicated Category(Ha) 2011 2015 2020
1 <1000 0.003 0.004 0.005 2 1000 t0 5000 0.01 0.01 0.02 3 5000 to 15,000 0.03 0.04 0.05 4 15,000 to 20,000 0.07 0.08 0.10 5 20,000 to 30,000 0.09 0.11 0.15 6 30,000 to 50,000 0.14 0.17 0.22 7 50,000 t0 100,000 0.23 0.33 0.40
8 100,000 to 200,000 0.47 0.66 0.83
9 200,000 to 500,000 0.84 1.18 1.48
10 500,000 to 1,000,000
11 >1,000,000 11.62 15.61 19.81 Model and corresponding assumptions for arriving at the above results are given in Annex 1. 5.5. Siting of Sludge drying Beds Sludge drying beds should better be sited close to roads and within 5 to 10 kms distance from towns depending on the size of the town. They should be kept away from well fields and airports.
5.5.1. Cost of Desludging Desludging of latrines and septic tanks can’t be sustainable unless a system for collecting affordable desludging fee on monthly basis along with water bills are introduced. It is usually observed that many households are not accustomed to getting their toilets/septic tanks emptied once per year. As a result, it is very common to see leaking toilets and septic tanks all around the country. It will therefore be strategic to provide adequate desludging facilities and plan to desludge latrines/septic tanks of all households universally. This requires that every family shall pay the monthly fee that will cover depreciation and operation cost as indicated in table below.
Table 5-5: Cost of Desludging
I.No. Facilities
Sludge Disposal Cost per trip by town Category (USD)
<1000
1000 t0
5000
5000 to
15,000
15,000 to 20,000
20,000 to 30,000
30,000 to 50,000
50,000 t0 100,000
100,000 to
200,000
200,000 to
500,000
500,000 to
1,000,000
>1,000,000
1 Depreciation Cost /Trip
2.21
2.21
2.21
2.21
2.21
2.21
5.05
5.05
5.05
5.05
5.05
2 Operation Cost/Trip
6.44
6.44
6.44
6.44
6.44
6.44
9.97
9.97
9.97
9.97
9.97

Urban Sanitation UAP
MoWE Page 11
I.No. Facilities
Sludge Disposal Cost per trip by town Category (USD) <1000
1000 t0
5000 to
15,000 to
20,000 to
30,000 to
50,000 t0
100,000 to
200,000 to
500,000 to
>1,000,000
Total Sludge Disposal Cost per trip by town category
8.65
8.65
8.65
8.65
8.65
8.65
15.03
15.03
15.03
15.03
15.03
Monthly Desludging Fee per family
0.72
0.72
0.72
0.72
0.72
0.72
1.25
1.25
1.25
1.25
1.25
As depicted in the table the cost of desludging varies from 0.72 USD (in towns with population <or=50,000) to USD 1.25 (in towns with population > or = 50,000). Details of the costing are shown in Annex 2. 5.6. Solid waste Disposal facilities Solid waste is becoming a nuisance in all towns with the scale of the problem increasing as the population size increases. This plan attempts to minimize the problem by determining required facilities for transporting the solid waste and proposing sanitary land fill area requirement for the various town categories in the country. The health extension workers and sanitation experts of municipalities are expected to create awareness on the benefit of solid waste sorting in order to apply the Reduce, Recycle and Reuse (RRR) Principle. Incineration of solid waste and energy generation could be considered in bigger towns in the future. Furthermore enforcing of environmental protection legislations and guidelines would be pivotal for sanitizing urban areas. The three pillar intervention (i.e. creation of enabling environment, Creation of Capacity and Facilitation of supply) should be interwoven with enforced legislations so that those who deserve reward could be congratulated and those who deserve sanction could be sanctioned. Quick demonstration of how such community led action could lead towards achieving the GTP for better health and dignity of communities could soon turn out to be a universal sanitation movement. Requirements of solid waste disposal facilities are shown in table below.

Urban Sanitation UAP
MoWE Page 12
Table 5-6: Requirement of Solid Waste Disposal Facilities by Region I. No. Region Solid waste Disposal Facilities Solid
Waste Bins 2.5 m3 capacity @2 Nos /Truck (2015
requirement)
Solid Waste
Bins 5 m3 capacity @2 Nos /Truck 2015
requirement
1m3 capacity Donkey pulled
Cart 2.5m3 capacity Truck 5m3 capacity Truck
2011 2015 2020 2011 2015 2020 2011 2015 20201 Afar 52 78 119 3 4 6 8 02 Gambella 16 23 36 1 1 1 0 23 Harari 1 2 2 0 44 Addis Ababa 51 79 122 0 1585 Dire Dawa 4 6 10 0 136 Benishangul 30 45 69 1 2 3 4 07 Somali 109 164 251 6 9 14 1 2 2 18 48 Amhara 261 391 600 17 26 41 10 14 19 53 289 Oromia 475 713 1,094 39 60 91 13 19 25 119 37
10 SNNPR 225 337 518 19 30 45 6 10 14 59 2011 Tigrai 78 118 181 9 14 21 4 6 8 28 12
Total 1,245 1,869 2,869 94 145 222 92 139 202 289 278

Urban Sanitation UAP
MoWE Page 13
Sanitary Landfill area requirements for a typical town within different population ranges varying from <1000 to >1,000,000 is indicated in table below.
Table 5-7: Requirements of Land in Ha for Land fill Site by Town Category
Category Population Range
Land Fill Site area of a typical town within the indicated Category
(Ha)
2011 2015 20201 <1000 0.003 0.012 0.0252 1000 t0 5000 0.01 0.05 0.103 5000 to 15,000 0.04 0.13 0.284 15,000 to 20,000 0.08 0.28 0.595 20,000 to 30,000 0.11 0.39 0.826 30,000 to 50,000 0.17 0.59 1.257 50,000 t0 100,000 0.30 1.07 2.268 100,000 to 200,000 0.60 2.12 4.469 200,000 to 500,000 1.07 3.78 7.94
10 500,000 to 1,000,000
11 >1,000,000 13.46 47.64 100.18 Model and corresponding assumptions for arriving at the above results are given in Annex 1. 5.7. Siting of Sanitary land fill sites Sludge drying beds should better be sited close to roads and within 5 to 10 kms distance from towns depending on the size of the town. They should be kept away from well fields and airports.
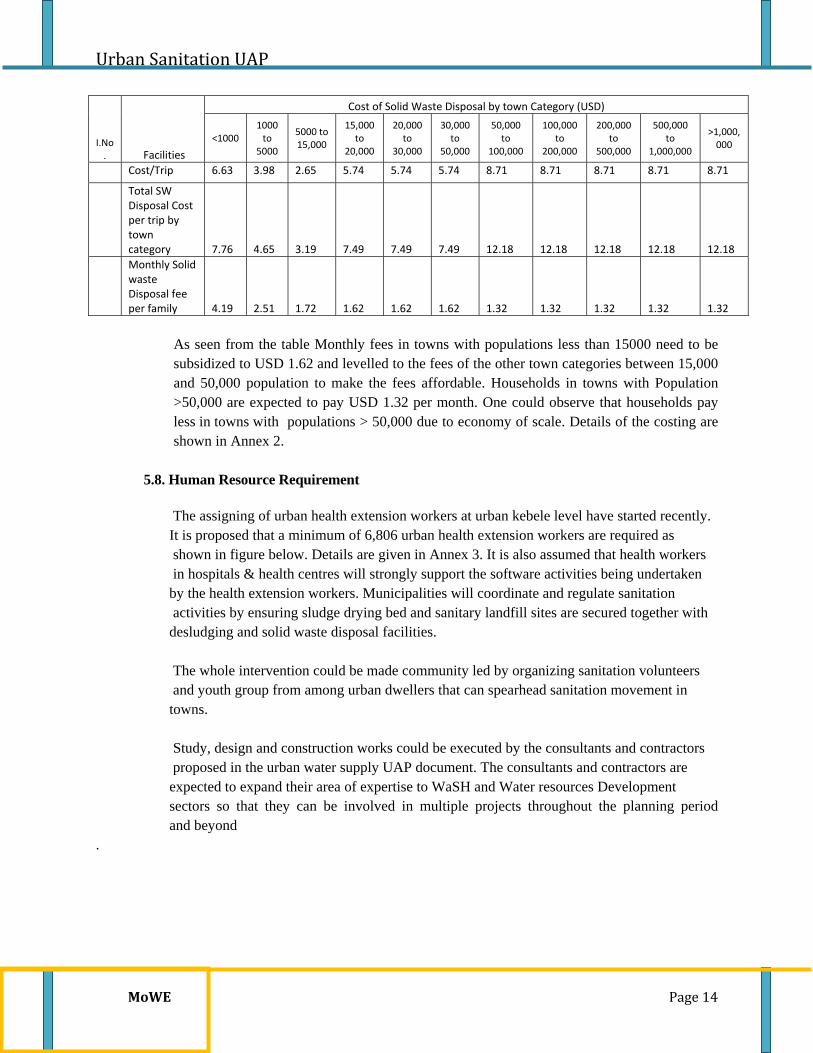
5.7.1. Cost of Solid Waste Disposal Solid waste disposal also requires a strategy that embraces all households universally. To this end a positive step in the house to house collection of solid waste is started in Addis Ababa and other towns where households pay fees together with water bills. In line with this good practice, monthly fees to be covered by households in the various town categories are given table below.
Table 5-8: Cost of Solid waste Disposal
I.No. Facilities
Cost of Solid Waste Disposal by town Category (USD)
<1000 1000 to
5000
5000 to 15,000
15,000 to
20,000
20,000 to
30,000
30,000 to
50,000
50,000 to
100,000
100,000 to
200,000
200,000 to
500,000
500,000 to
1,000,000
>1,000,000
1 Depreciation Cost /Trip
1.13
0.68
0.54
1.75
1.75
1.75
3.47
3.47
3.47
3.47
3.47
2 Operation
Urban Sanitation UAP
MoWE Page 14
I.No. Facilities
Cost of Solid Waste Disposal by town Category (USD)
<1000 1000 to
5000
5000 to 15,000
15,000 to
20,000
20,000 to
30,000
30,000 to
50,000
50,000 to
100,000
100,000 to
200,000
200,000 to
500,000
500,000 to
1,000,000
>1,000,000
Cost/Trip 6.63 3.98 2.65 5.74 5.74 5.74 8.71 8.71 8.71 8.71 8.71
Total SW Disposal Cost per trip by town category
7.76
4.65
3.19
7.49
7.49
7.49
12.18
12.18
12.18
12.18
12.18
Monthly Solid waste Disposal fee per family
4.19
2.51
1.72
1.62
1.62
1.62
1.32
1.32
1.32
1.32
1.32
As seen from the table Monthly fees in towns with populations less than 15000 need to be subsidized to USD 1.62 and levelled to the fees of the other town categories between 15,000 and 50,000 population to make the fees affordable. Households in towns with Population >50,000 are expected to pay USD 1.32 per month. One could observe that households pay less in towns with populations > 50,000 due to economy of scale. Details of the costing are shown in Annex 2. 5.8. Human Resource Requirement The assigning of urban health extension workers at urban kebele level have started recently. It is proposed that a minimum of 6,806 urban health extension workers are required as shown in figure below. Details are given in Annex 3. It is also assumed that health workers in hospitals & health centres will strongly support the software activities being undertaken by the health extension workers. Municipalities will coordinate and regulate sanitation activities by ensuring sludge drying bed and sanitary landfill sites are secured together with desludging and solid waste disposal facilities. The whole intervention could be made community led by organizing sanitation volunteers and youth group from among urban dwellers that can spearhead sanitation movement in towns. Study, design and construction works could be executed by the consultants and contractors proposed in the urban water supply UAP document. The consultants and contractors are expected to expand their area of expertise to WaSH and Water resources Development sectors so that they can be involved in multiple projects throughout the planning period and beyond .

Urban Sanitation UAP
MoWE Page 15
Figure 5-1: Urban Health Extension Workers (UHEWs) Requirement (2011-2015)
6. Proposed Indicative Financial plan (2011-2015) A total of USD 203,250,078 is required to undertake sanitation activities in the 970 towns during the planning period as shown in table below.
Table 6-1: Summary of Financial Urban Sanitation Universal Access Plan (2011-2015)
I.No Regions
Regiona
l Factor
Total
Grand Total 2011 2012 2013 2014 2015
1 Afar 1.15
236,822
950,307
1,310,862
1,315,093
959,540
4,772,624
2 Gambella 1.1
81,335
318,698
438,896
440,578
322,371
1,601,879
3 Harari 1
52,996
213,041
294,398
295,879
216,273
1,072,588
4 Addis Ababa 1
12,776,687
20,488,016
16,815,116
10,814,456
8,146,327
69,040,601
5 Diredawa 1
105,667
424,886
587,297
590,408
431,672
2,139,930
HarariGambella
Benishangul
Dire Dawa
Afar Somali Tigrai SNNPRAmhar
aAddis Ababa
Oromia
UHEWs Requirement 62 64 78 112 146 358 492 946 1,140 1,402 2,006
‐
500
1,000
1,500
2,000
2,500
No. of P
ropo
sed HEW
s

Urban Sanitation UAP
MoWE Page 16
I.No Regions
Regiona
l Factor
Total
Grand Total 2011 2012 2013 2014 2015
6 Benishangul 1.1
124,374
499,156
688,645
690,973
504,236
2,507,385
7 somali 1.15
532,993
2,139,634
2,952,635
2,963,379
2,163,078
10,751,719
8 Amhara 1
1,357,006
5,449,509
7,522,910
7,553,044
5,515,258
27,397,726
9 Oromya 1
2,461,410
9,884,234
13,644,421
13,698,556
10,002,351
49,690,971
10 SNNPR 1
1,168,352
4,691,780
6,476,708
6,502,473
4,747,998
23,587,311
11 Tigrai 1
528,911
2,124,744
2,934,163
2,946,929
2,152,598
10,687,345
Total
19,428,565
47,186,015
53,668,062
47,813,784
35,163,716
203,250,078 The breakdown of financial requirements for major sanitation activities that are included within the scope of this indicative plan is shown below.
Figure 6-1: Breakdown of Urban Sanitation Financial Requirements
Details of the financial Requirement are given in Annex 4.

Urban S
MoW
E ar
F
7. C T re in fo di of W
7 5m3 CVacc
Truck, 4
Sanitation
WE
Estimated Ratere shown in fi
Figure 6-2: Es
Conclusion
The water anesponsible fondicative docuor finalizing isseminated sf the big tow
WaSH invento
Capacity cum 45,455
n UAP
es used in detfigure below.
stimated Rat
n and the
nd health secor urban planument could the complex
soon. Additiowns etc. The nory data are pr
1 Don
termining the
tes in USD of
way forw
ctors need tonning and inserve as an inurban sanita
onal aspects cnature of any rocessed and
1m3 capacity nkey pulled Ca
, 1,136
6 5mTruc
cost of facili
f Items to be
ard
o closely wonfrastructure nput for Miniation strategiccould be urbaplan being ddispatched.
rt
m3 capacity ck, 28,409
ties to be pro
procured an
ork with urbadevelopmen
istry of Urbanc action planan drainage, ddynamic neces
2 Solid Waste2.5 m3
capacity, 2,
3 Solid Waste m3 capacity, 4
cured and or
nd or locally
an developmt in the yean developmenn expected todecentralized ssitates updat
e Bin
273
Bin 5 4,261
4 2.5mTruc
5 3mtracto
VTruc
Pa
assembled lo
assembled
ment sector thars to come. nt and constru be publishedsewerage in
ting as soon a
m3 capacity ck, 14,205
m3 Capacity or mounted Vaccum ck, 19,886
ge 17
ocally
hat is This
uction d and some
as the
Urban Sanitation UAP
MoWE Page 18
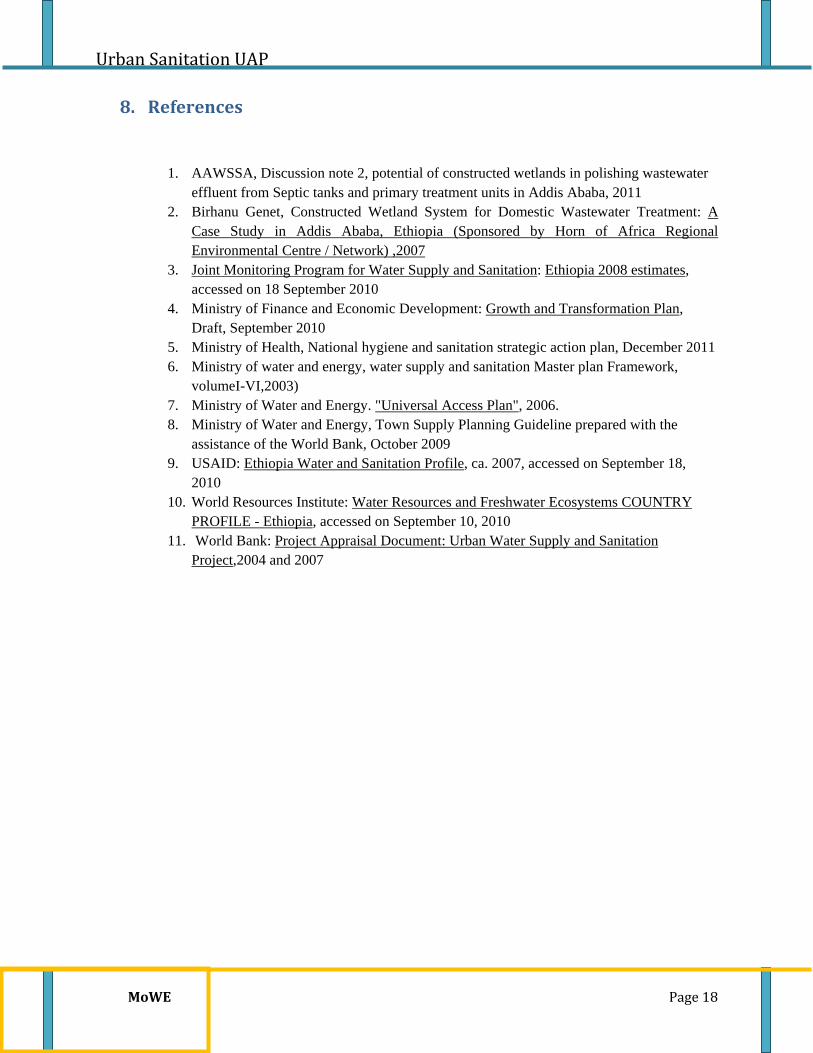
8. References
1. AAWSSA, Discussion note 2, potential of constructed wetlands in polishing wastewater effluent from Septic tanks and primary treatment units in Addis Ababa, 2011
2. Birhanu Genet, Constructed Wetland System for Domestic Wastewater Treatment: A Case Study in Addis Ababa, Ethiopia (Sponsored by Horn of Africa Regional Environmental Centre / Network) ,2007
3. Joint Monitoring Program for Water Supply and Sanitation: Ethiopia 2008 estimates, accessed on 18 September 2010
4. Ministry of Finance and Economic Development: Growth and Transformation Plan, Draft, September 2010
5. Ministry of Health, National hygiene and sanitation strategic action plan, December 2011 6. Ministry of water and energy, water supply and sanitation Master plan Framework,
volumeI-VI,2003) 7. Ministry of Water and Energy. "Universal Access Plan", 2006. 8. Ministry of Water and Energy, Town Supply Planning Guideline prepared with the
assistance of the World Bank, October 2009 9. USAID: Ethiopia Water and Sanitation Profile, ca. 2007, accessed on September 18,
2010 10. World Resources Institute: Water Resources and Freshwater Ecosystems COUNTRY
PROFILE - Ethiopia, accessed on September 10, 2010 11. World Bank: Project Appraisal Document: Urban Water Supply and Sanitation
Project,2004 and 2007
Urban Sanitation UAP
MoWE Page 19
Annexes

Urban Sanitation UAP
MoWE Page 20
Annex 1: Household Latrines to be constructed During the Planning Period
Town Category
people with No Latrines Population Additional people
2012‐2015)
No. of Household
Latrines To be constructed(@ an average of 5 persons per household)
2011 2015 2020 2011 2015 2011‐2015
<1000 52.00% 0.00% 0.00%
756 890
134.00
106 1000 to 5000 42.00% 0.00% 0.00%
2,994 3,522
528.00
357
5000 to 15,000 37.00% 0.00% 0.00%
8,364 9,841
1,477.00
914
15,000 to 20,000 32.00% 0.00% 0.00%
17,497 20,587
3,090.00
1,738
20,000 to 30,000 24.00% 0.00% 0.00%
24,244 28,526
4,282.00
2,020
30,000 to 50,000 20.00% 0.00% 0.00%
37,208 43,780
6,572.00
2,802
50,000 t0 100,000 19.00% 0.00% 0.00%
67,147 79,006
11,859.00
4,924
100,000 to 200,000 17.00% 0.00% 0.00%
132,670 156,102
23,432.00
9,197
200,000 to 500,000 14.00% 0.00% 0.00%
236,224 277,946
41,722.00
14,958
500,000 to 1,000,000
-
>1,000,000 12.00% 0.00% 0.00%
2,979,086 3,505,256
526,170.00
176,732

Urban Sanitation UAP
MoWE Page 21
Annex2: Model for Estimating Sanitation Facilities Requirements
Daily per capita loadings of various on site sewerage sludge
Variable Septage pit latrine sludge
BOD(mg/l) 5,000 53,000 Discharge(l/c/d) 1 0.15 Sludge accumulation rate(i/c/d) 0.15 0.15
Latrine/toilet coverage projection(Bulen)
2009 2010 2011 2015 2020 No latrine 0.00% 0.00% 0.00% Dry pit latrine 97.50% 91.50% 86.50% Flush toilet 2.50% 8.50% 13.50% Wastewater Production Wastewater production factors Domestic 70% 70% 80% 80% 80% Non-domestic 80% 80% 80% 80% 80%
Septage volume to be generated (m3/year) 2009 2010 2011 2015 2020
Domestic 7 28 53
Non domestic 110% of domestic septage 8 30 59 Total 14 58 112
Urban Sanitation UAP
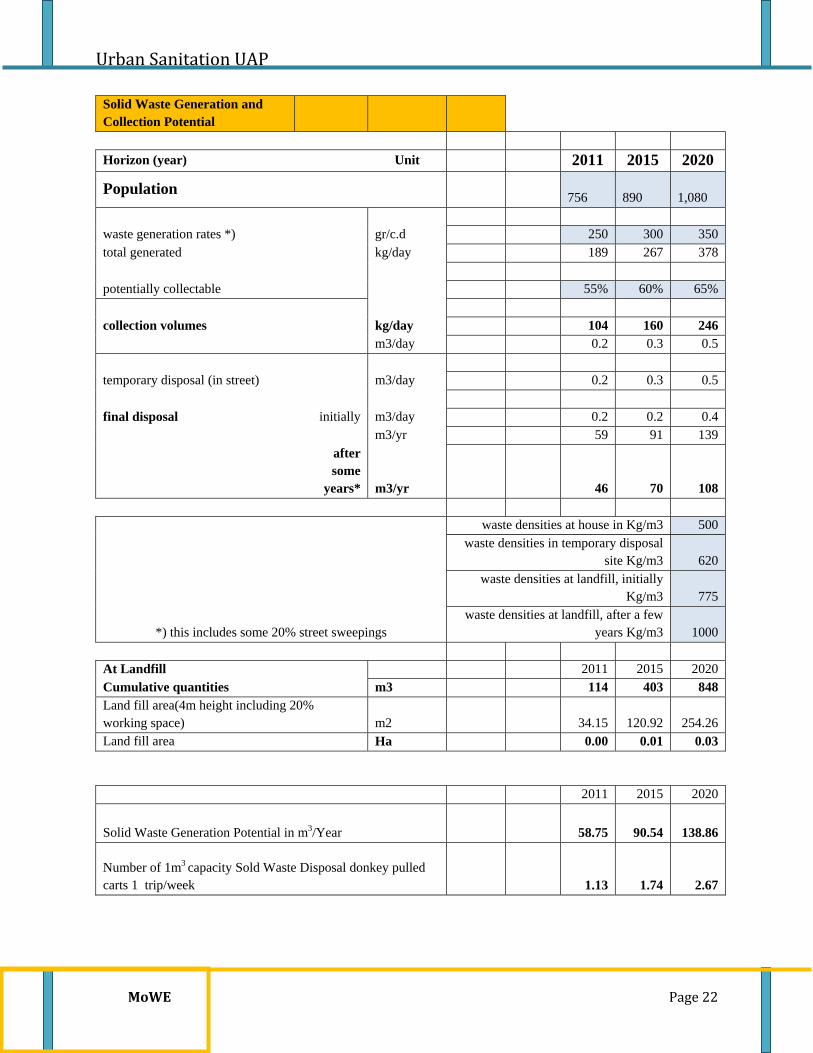
MoWE Page 22
Solid Waste Generation and Collection Potential
Horizon (year) Unit 2011 2015 2020
Population 756
890
1,080
waste generation rates *) gr/c.d 250 300 350 total generated kg/day 189 267 378
potentially collectable 55% 60% 65%
collection volumes kg/day 104 160 246 m3/day 0.2 0.3 0.5 temporary disposal (in street) m3/day 0.2 0.3 0.5 final disposal initially m3/day 0.2 0.2 0.4 m3/yr 59 91 139
after some
years* m3/yr 46 70 108
*) this includes some 20% street sweepings
waste densities at house in Kg/m3 500 waste densities in temporary disposal
site Kg/m3 620 waste densities at landfill, initially
Kg/m3 775 waste densities at landfill, after a few
years Kg/m3 1000
At Landfill 2011 2015 2020 Cumulative quantities m3 114 403 848 Land fill area(4m height including 20% working space) m2 34.15 120.92 254.26 Land fill area Ha 0.00 0.01 0.03
2011 2015 2020
Solid Waste Generation Potential in m3/Year 58.75 90.54 138.86
Number of 1m3 capacity Sold Waste Disposal donkey pulled carts 1 trip/week 1.13 1.74 2.67

Urban Sanitation UAP
MoWE Page 23
Sludge Production
Description Unit 2015 2020 2025 Population No 756 890 1,080 Sludge Volume from pit latrines M3/y 32 36 41
Sludge Volume from flush toilets M3/y 1 3 6 Non domestic sludge M3/y 1 4 7
Total sludge to be generated M3/y 34 43 54
3m3 Capacity tractor mounted Vacuum Truck @3 trips/day
No of Vacuum trucks
considering 300
working days/year 0.01 0.02 0.02
Total effective Drying bed surface area required using 0.2m thick M2 170.12 213.13 271.64
Total effective required area using six cycles per year M2 28.35 35.52 45.27
Sludge drying bed area Ha 0.003 0.004 0.005 N:B
1. Non-shaded Figures are dummy figures showing how results could be determined using the simplified model
2. Shaded Figures are inputs to the model for determining facilities requirements

Urban Sanitation UAP
MoWE Page 24
Annex 3: Costing Details of Solid Waste Disposal and Sludge Emptying Facilities a) Estimated Number of Trips for Disposal and Desludging by Various facilities
I.No. Facilities
Amount
(USD)
Estimated life Time(years)
Depreciation per
annum(USD)
Trips per week Trips per day
<1000 1000 to 5000
5000 to 15,000
15,000 to 20,000
20,000 to 30,000
30,000 to 50,000
50,000 to 100,000
100,000 to 200,000
200,000 to 500,000
500,000 to 1,000,000
>1,000,000
1 1m3 capacity Donkey pulled Cart (2011) 1,136 5
227.27 3 5 1
2 2.5m3 capacity Truck 14,205 10 1,420.45 3 3 3
3 5m3 capacity Truck 28,409 10 2,840.91 3 3 3 3 3
4 Solid Waste Bin 2.5 m3 capacity 2,273 15
151.52
5 Solid Waste Bin 5 m3 capacity 4,261 15
284.09
6
3m3 Capacity tractor mounted Vacuum Truck
19,886 10
1,988.64 3 3 3 3 3 3
7 5m3 Capacity Vacuum Truck
45,455 10
4,545.45 3 3 3 3 3

Urban Sanitation UAP
MoWE Page 25
b) Depreciation Cost per trip by Town Categories of Facilities
I.No. Facilities Amount (USD)
Estimated life Time(years)
Depreciation per
annum(USD)
Depreciation Cost per trip by town category(USD) (20110
<1000 1000 to
5000
5000 to 15,000
15,000 to
20,000
20,000 to
30,000
30,000 to 50,000
50,000 to
100,000
100,000 to
200,000
200,000 to
500,000
500,000 to 1,000,000
>1,000,000
1 1m3 capacity Donkey pulled Cart 1,136 7
162.34
1.13
0.68
0.54
2 2.5m3 capacity Truck 14,205 10
1,420.45
1.58
1.58
1.58
3 5m3 capacity Truck 28,409 10 2,840.91
3.16
3.16
3.16
3.16
3.16
4 Solid Waste Bin 2.5 m3 capacity 2,273 15
151.52
0.17
0.17
0.17
5 Solid Waste Bin 5 m3 capacity 4,261 15
284.09
0.32
0.32
0.32
0.32
0.32
6
3m3 Capacity tractor mounted Vacuum Truck
19,886 10
1,988.64
2.21
2.21
2.21
2.21
2.21
2.21
7 5m3 Capacity Vacuum Truck
45,455 10
4,545.45
5.05
5.05
5.05
5.05
5.05
Total depreciation cost per trip of disposing solid waste in USD
1.13
0.68
0.54
1.75
1.75
1.75
3.47
3.47
3.47
3.47
3.47
Total depreciation cost per trip desludging
2.21
2.21
2.21
2.21
2.21
2.21
5.05
5.05
5.05
5.05
5.05
Urban Sanitation UAP
MoWE Page 26
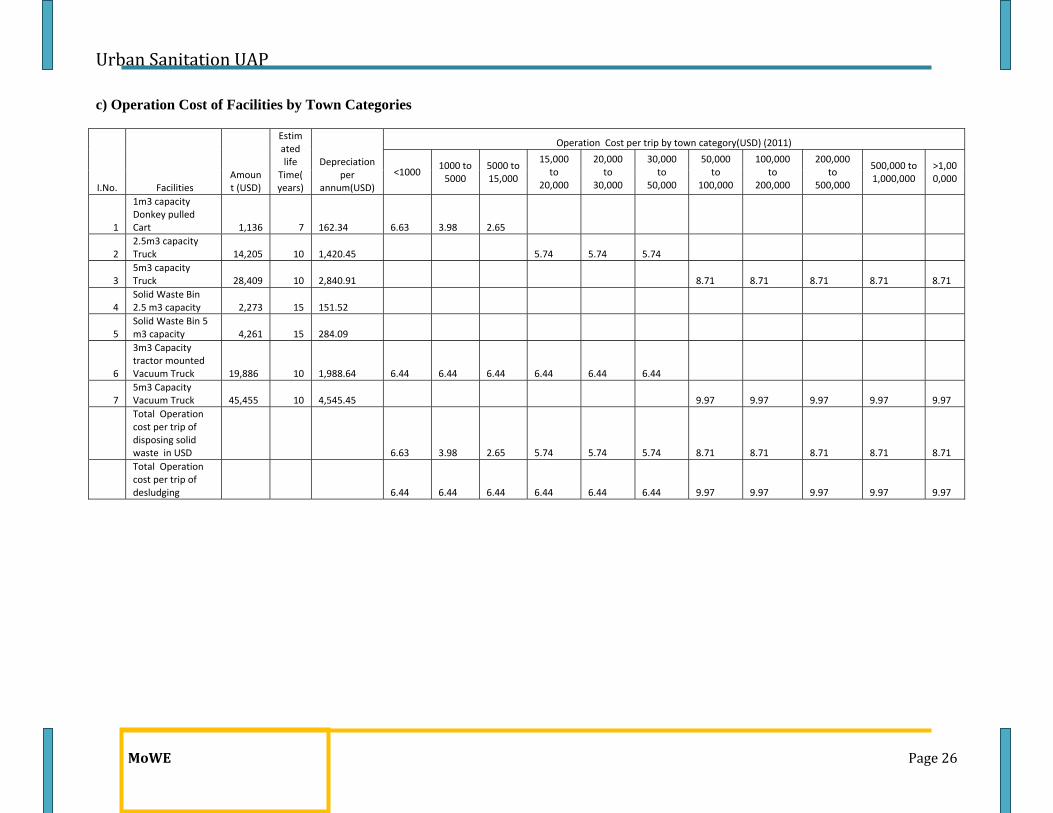
c) Operation Cost of Facilities by Town Categories
I.No. Facilities Amount (USD)
Estimated life
Time(years)
Depreciation per
annum(USD)
Operation Cost per trip by town category(USD) (2011)
<1000 1000 to 5000
5000 to 15,000
15,000 to
20,000
20,000 to
30,000
30,000 to
50,000
50,000 to
100,000
100,000 to
200,000
200,000 to
500,000
500,000 to 1,000,000
>1,000,000
1
1m3 capacity Donkey pulled Cart 1,136 7
162.34
6.63
3.98
2.65
2 2.5m3 capacity Truck 14,205 10
1,420.45
5.74
5.74
5.74
3 5m3 capacity Truck 28,409 10
2,840.91
8.71
8.71
8.71
8.71
8.71
4 Solid Waste Bin 2.5 m3 capacity 2,273 15
151.52
5 Solid Waste Bin 5 m3 capacity 4,261 15
284.09
6
3m3 Capacity tractor mounted Vacuum Truck
19,886 10
1,988.64
6.44
6.44
6.44
6.44
6.44
6.44
7 5m3 Capacity Vacuum Truck
45,455 10
4,545.45
9.97
9.97
9.97
9.97
9.97
Total Operation cost per trip of disposing solid waste in USD
6.63
3.98
2.65
5.74
5.74
5.74
8.71
8.71
8.71
8.71
8.71
Total Operation cost per trip of desludging
6.44
6.44
6.44
6.44
6.44
6.44
9.97
9.97
9.97
9.97
9.97

Urban Sanitation UAP
MoWE Page 27
Annex 4: Proposed Health Extension Workers Requirement by Region and Town Category
Category Population Range Afar Gambella Harari Addis Ababa
Dire Dawa Benishangul Somali Amhara Oromia SNNPR Tigrai Total
1<1000 14 4 ‐ ‐ ‐ 2 6 6 6 12 ‐ 50
21000 t0 5000 48 8 ‐ ‐ ‐ 26 80 182 320 150 26 840
35000 to 15,000 48 20 ‐ ‐ ‐ 32 128 316 588 276 120 1,528
415,000 to 20,000 24 ‐ ‐ ‐ ‐ ‐ 16 72 136 40 24 312
520,000 to 30,000 12 ‐ ‐ ‐ ‐ ‐ 12 168 168 84 48 492
630,000 to 50,000 ‐ ‐ ‐ ‐ ‐ 18 54 ‐ 234 144 54 504
750,000 t0 100,000 ‐ 32 ‐ ‐ ‐ ‐ ‐ 160 256 128 96 672
8100,000 to 200,000 ‐ ‐ 62 ‐ ‐ ‐ 62 124 186 ‐ 124 558
9200,000 to 500,000 ‐ ‐ ‐ ‐ 112 ‐ ‐ 112 112 112 ‐ 448
10500,000 to 1,000,000 ‐ ‐ ‐ ‐ ‐ ‐ ‐ ‐ ‐ ‐ ‐ ‐
11>1,000,000 ‐ ‐ ‐ 1,402 ‐ ‐ ‐ ‐ ‐ ‐ ‐ 1,402
Total 146 64 62 1,402 112 78 358 1,140 2,006 946 492 6,806
Note: Two health extension workers are assumed to be required for every 5000 people living in a town. For towns with less than 5000 Population 2 health extension workers are proposed

Urban Sanitation UAP
MoWE Page 28
Annex 5: Details of Indicative Financial Requirements
a) Landfill site and Sludge Drying Bed preparation Requirements
Annual Escalation 0% 1% 1% 1% 1% 0% 1% 1% 1% 1%
Allocation Percentage 5% 20% 27.5% 27.5% 20% 5% 20% 27.5% 27.5% 20%
I.No Regions
Regional
Factor
Financial Requirement for landfill site 2011-2015 with 1% escalation per annum Financial Requirement for Sludge Drying Bed 2011-2015 with 1% escalation per annum
2011 2012 2013 2014 2015 2011 2012 2013 2014 2015
1 Afar 1.15
16,758
67,703
94,023
94,963
69,755
3,731
15,074
20,934
21,143
15,530
2 Gambella 1.1
7,721
31,191
43,316
43,750
32,136
3,721
8,920
11,607
11,704
9,132
3 Harari 1
7,604
30,721
42,664
43,091
31,652
1,766
7,135
9,909
10,008
7,351
4 Addis Ababa 1
170,754
689,847
958,024
967,605
710,750
42,206
170,511
236,798
239,166
175,678
5 Diredawa 1
13,540
54,701
75,966
76,725
56,358
3,145
12,704
17,643
17,819
13,089
6 Benishangul 1.1
9,066
36,626
50,865
51,373
37,736
2,018
8,155
11,325
11,438
8,402
7 Somali 1.15
45,691
184,593
256,354
258,917
190,187
10,257
41,438
57,547
58,123
42,694
8 Amhara 1
130,089
525,558
729,868
737,167
541,483
29,199
117,963
163,821
165,460
121,538
9 Oromya 1
229,425
926,876
1,287,199
1,300,071
954,961
51,364
207,511
288,181
291,063
213,799
10 SNNPR 1
106,945
432,056
600,018
606,018
445,148
23,908
96,589
134,137
135,479
99,515
11 Tigrai 1
58,332
235,662
327,276
330,549
242,803
13,109
52,960
73,548
74,284
54,565
Total
795,924
3,215,534
4,465,572
4,510,228
3,312,968
184,424
738,960
1,025,449
1,035,684
761,293

Urban Sanitation UAP
MoWE Page 29
b) Public Toilets Construction requirements
Annual Escalation 0% 1% 1% 1% 1%
Allocation Percentage 5% 20% 27.5% 27.5% 20%
I.No Regions Regional Factor
Financial Requirement for Public Toilets 2011 2012 2013 2014 2015
1 Afar 1.15
124,152
496,607
682,834
682,834
496,607
2 Gambella 1.1
37,501
150,005
206,257
206,257
150,005
3 Harari 1
20,455
81,821
112,504
112,504
81,821
4 Addis Ababa 1
193,188
772,752
1,062,534
1,062,534
772,752
5 Diredawa 1
38,638
154,550
212,507
212,507
154,550
6 Benishangul 1.1
63,752
255,008
350,636
350,636
255,008
7 somali 1.15
262,679
1,050,715
1,444,734
1,444,734
1,050,715
8 Amhara 1
630,702
2,522,808
3,468,861
3,468,861
2,522,808
9 Oromya 1
1,151,173
4,604,693
6,331,453
6,331,453
4,604,693
10 SNNPR 1
545,472
2,181,888
3,000,096
3,000,096
2,181,888
11 Tigrai 1
231,826
927,302
1,275,041
1,275,041
927,302
Total
3,299,537
13,198,150
18,147,456
18,147,456
13,198,150
Urban Sanitation UAP
MoWE Page 30
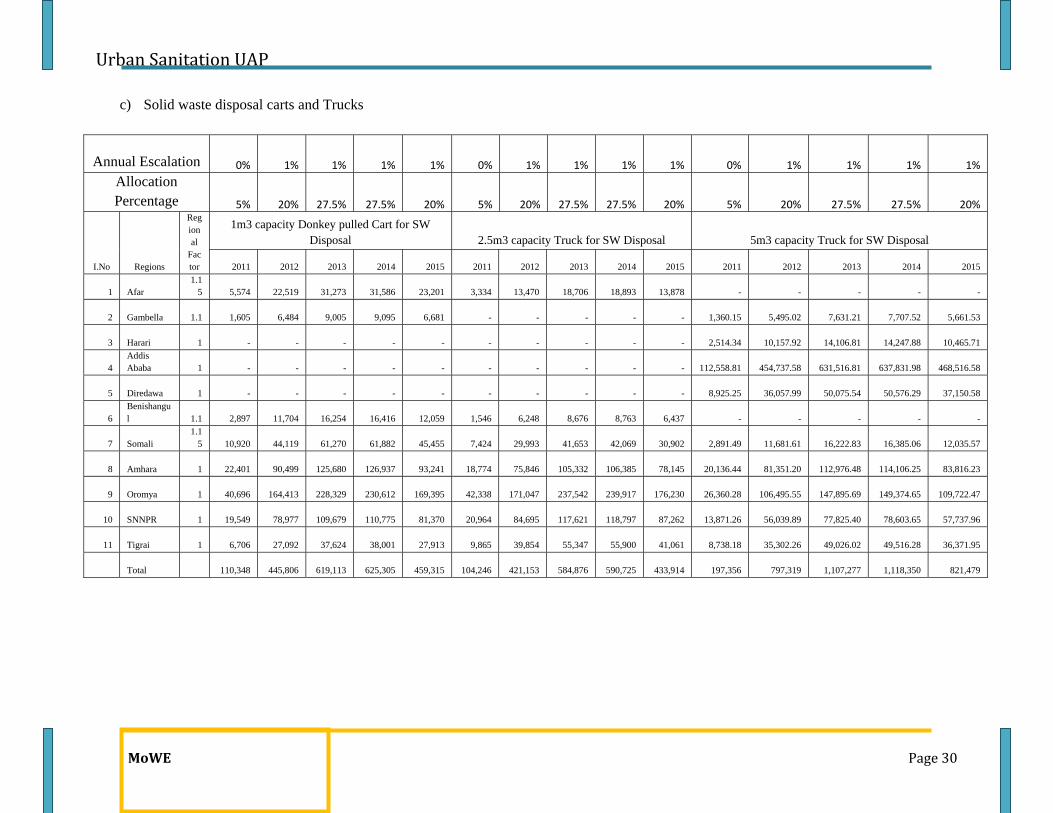
c) Solid waste disposal carts and Trucks
Annual Escalation 0% 1% 1% 1% 1% 0% 1% 1% 1% 1% 0% 1% 1% 1% 1%
Allocation Percentage 5% 20% 27.5% 27.5% 20% 5% 20% 27.5% 27.5% 20% 5% 20% 27.5% 27.5% 20%
I.No Regions
Regional
Factor
1m3 capacity Donkey pulled Cart for SW Disposal 2.5m3 capacity Truck for SW Disposal 5m3 capacity Truck for SW Disposal
2011 2012 2013 2014 2015 2011 2012 2013 2014 2015 2011 2012 2013 2014 2015
1 Afar 1.1
5
5,574
22,519
31,273
31,586
23,201
3,334
13,470
18,706
18,893
13,878
-
-
-
-
-
2 Gambella 1.1
1,605
6,484
9,005
9,095
6,681
-
-
-
-
-
1,360.15
5,495.02
7,631.21
7,707.52
5,661.53
3 Harari 1
-
-
-
-
-
-
-
-
-
-
2,514.34
10,157.92
14,106.81
14,247.88
10,465.71
4 Addis Ababa 1
-
-
-
-
-
-
-
-
-
-
112,558.81
454,737.58
631,516.81
637,831.98
468,516.58
5 Diredawa 1
-
-
-
-
-
-
-
-
-
-
8,925.25
36,057.99
50,075.54
50,576.29
37,150.58
6 Benishangul 1.1
2,897
11,704
16,254
16,416
12,059
1,546
6,248
8,676
8,763
6,437
-
-
-
-
-
7 Somali 1.1
5
10,920
44,119
61,270
61,882
45,455
7,424
29,993
41,653
42,069
30,902
2,891.49
11,681.61
16,222.83
16,385.06
12,035.57
8 Amhara 1
22,401
90,499
125,680
126,937
93,241
18,774
75,846
105,332
106,385
78,145
20,136.44
81,351.20
112,976.48
114,106.25
83,816.23
9 Oromya 1
40,696
164,413
228,329
230,612
169,395
42,338
171,047
237,542
239,917
176,230
26,360.28
106,495.55
147,895.69
149,374.65
109,722.47
10 SNNPR 1
19,549
78,977
109,679
110,775
81,370
20,964
84,695
117,621
118,797
87,262
13,871.26
56,039.89
77,825.40
78,603.65
57,737.96
11 Tigrai 1
6,706
27,092
37,624
38,001
27,913
9,865
39,854
55,347
55,900
41,061
8,738.18
35,302.26
49,026.02
49,516.28
36,371.95
Total
110,348
445,806
619,113
625,305
459,315
104,246
421,153
584,876
590,725
433,914
197,356
797,319
1,107,277
1,118,350
821,479

Urban Sanitation UAP
MoWE Page 31
d) Truck Mountable Solid Waste Collection Bins
Annual Escalation 0% 1% 1% 1% 1% 0% 1% 1% 1% 1%
Allocation Percentage 5% 20% 27.50% 27.50% 20% 5% 20% 27.50% 27.50% 20%
I.No Regions
Regional
Factor 2.5m3 Capacity Solid Waste Bins 5m3 Solid Waste Bins
2011 2012 2013 2014 2015 2011 2012 2013 2014 2015
1 Afar 1.15
1,045
4,224
5,866
5,924
4,352
-
-
-
-
-
2 Gambella 1.1
-
-
-
-
-
469
1,894
2,630
2,656
1,951
3 Harari 1
-
-
-
-
-
852
3,443
4,782
4,830
3,548
4 Addis Ababa 1
-
-
-
-
-
33,665
136,006
188,878
190,767
140,127
5 Diredawa 1
-
-
-
-
-
2,770
11,190
15,541
15,696
11,529
6 Benishangul 1.1
500
2,020
2,805
2,833
2,081
-
-
-
-
-
7 Somali 1.15
2,352
9,503
13,198
13,330
9,791
980
3,960
5,499
5,554
4,080
8 Amhara 1
6,023
24,332
33,791
34,129
25,069
5,966
24,102
33,472
33,807
24,833
9 Oromya 1
13,523
54,632
75,870
76,629
56,287
7,884
31,849
44,231
44,673
32,815
10 SNNPR 1
6,705
27,086
37,616
37,992
27,907
4,261
17,216
23,909
24,148
17,738
11 Tigrai 1
3,182
12,855
17,852
18,030
13,244
2,557
10,330
14,345
14,489
10,643
Total
33,330
134,651
186,997
188,867
138,731
59,403
239,990
333,286
336,619
247,262

Urban Sanitation UAP
MoWE Page 32
e) Vacuum Trucks
Annual Escalation 0% 1% 1% 1% 1% 0% 1% 1% 1% 1%
Allocation Percentage 5% 20% 27.50% 27.50% 20% 5% 20% 27.50% 27.50% 20%
I.No Regions
Regional
Factor
3m3 Capacity tractor mounted Vacuum Truck 5m3 Capacity Vacuum Truck
2011 2012 2013 2014 2015 2011 2012 2013 2014 2015
1 Afar 1.15
6,068
24,513
34,043
34,383
25,256
-
-
-
-
-
2 Gambella 1.1
1,263
5,101
7,084
7,154
5,255
2,176.25
8,792.04
12,209.94
12,332.04
9,058.44
3 Harari 1
-
-
-
-
-
4,022.94
16,252.67
22,570.89
22,796.60
16,745.14
4 Addis Ababa 1
-
-
-
-
-
94,599.42
382,181.67
530,754.80
536,062.35
393,762.16
5 Diredawa 1
-
-
-
-
-
7,163.01
28,938.54
40,188.40
40,590.28
29,815.41
6 Benishangul 1.1
4,598
18,576
25,798
26,056
19,139
-
-
-
-
-
7 Somali 1.15
17,503
70,714
98,204
99,186
72,856
4,626.38
18,690.57
25,956.53
26,216.09
19,256.91
8 Amhara 1
29,725
120,089
166,773
168,441
123,728
25,100.91
101,407.68
140,829.92
142,238.21
104,480.43
9 Oromya 1
74,306
300,196
416,897
421,066
309,292
35,059.07
141,638.63
196,700.65
198,667.65
145,930.42
10 SNNPR 1
37,813
152,765
212,153
214,274
157,394
15,076.63
60,909.58
84,588.18
85,434.06
62,755.20
11 Tigrai 1
15,021
60,686
84,278
85,121
62,525
13,981.09
56,483.62
78,441.62
79,226.04
58,195.13
Total
186,297
752,640
1,045,229 1,055,681
775,446
201,806
815,295
1,132,241
1,143,563
839,999

Urban Sanitation UAP
MoWE Page 33
f) Sewerage Expansion in Addis Ababa
Annual Cost Escalation in % 0% 1% 1% 1% 1%Allocation Percentage during the
planning period 5% 20% 27.50% 27.50% 20%
I.No Regions Regional
Factor Sewerage Expansion
2011 2012 2013 2014 20151 Afar 1.15 2 Gambella 1.1 3 Harari 1
4 Addis Ababa 1
9,067,614
12,694,886
8,688,636
4,040,909
3,131,818 5 Diredawa 1 6 Benishangul 1.1 7 Somali 1.15 8 Amhara 1 9 Oromya 1
10 SNNPR 1 11 Tigrai 1
Total
9,067,614
12,694,886
8,688,636
4,040,909
3,131,818

Urban Sanitation UAP
MoWE Page 34
g) Seed Finance for SAN MARK 1) Estimated Seed Finance Requirement by Town Category(2011)
Category Population Range San Mark Seed Money (USD)/town (2011)
1 <1000 56822 1000 t0 5000 85233 5000 to 15,000 113644 15,000 to 20,000 142055 20,000 to 30,000 170456 30,000 to 50,000 198867 50,000 t0 100,000 35511
8 100,000 to 200,000 71023
9 200,000 to 500,000 142045
10 500,000 to 1,000,000 284091
11 >1,000,000 2272727
Urban Sanitation UAP
MoWE Page 35
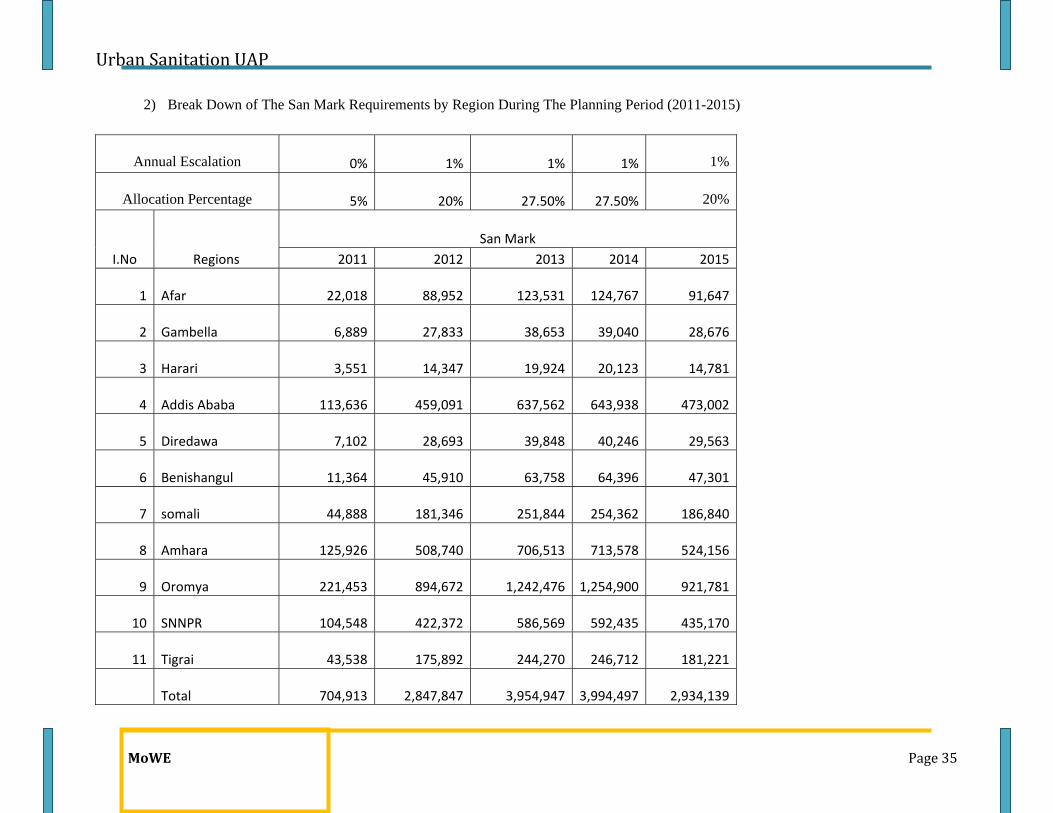
2) Break Down of The San Mark Requirements by Region During The Planning Period (2011-2015)
Annual Escalation 0% 1% 1% 1% 1%
Allocation Percentage 5% 20% 27.50% 27.50% 20%
I.No Regions San Mark
2011 2012 2013 2014 2015
1 Afar 22,018 88,952 123,531
124,767 91,647
2 Gambella 6,889 27,833 38,653
39,040 28,676
3 Harari 3,551 14,347 19,924
20,123 14,781
4 Addis Ababa 113,636 459,091 637,562
643,938 473,002
5 Diredawa 7,102 28,693 39,848
40,246 29,563
6 Benishangul 11,364 45,910 63,758
64,396 47,301
7 somali 44,888 181,346 251,844
254,362 186,840
8 Amhara 125,926 508,740 706,513
713,578 524,156
9 Oromya 221,453 894,672 1,242,476
1,254,900 921,781
10 SNNPR 104,548 422,372 586,569
592,435 435,170
11 Tigrai 43,538 175,892 244,270
246,712 181,221
Total 704,913 2,847,847 3,954,947
3,994,497 2,934,139
Urban Sanitation UAP
MoWE Page 36
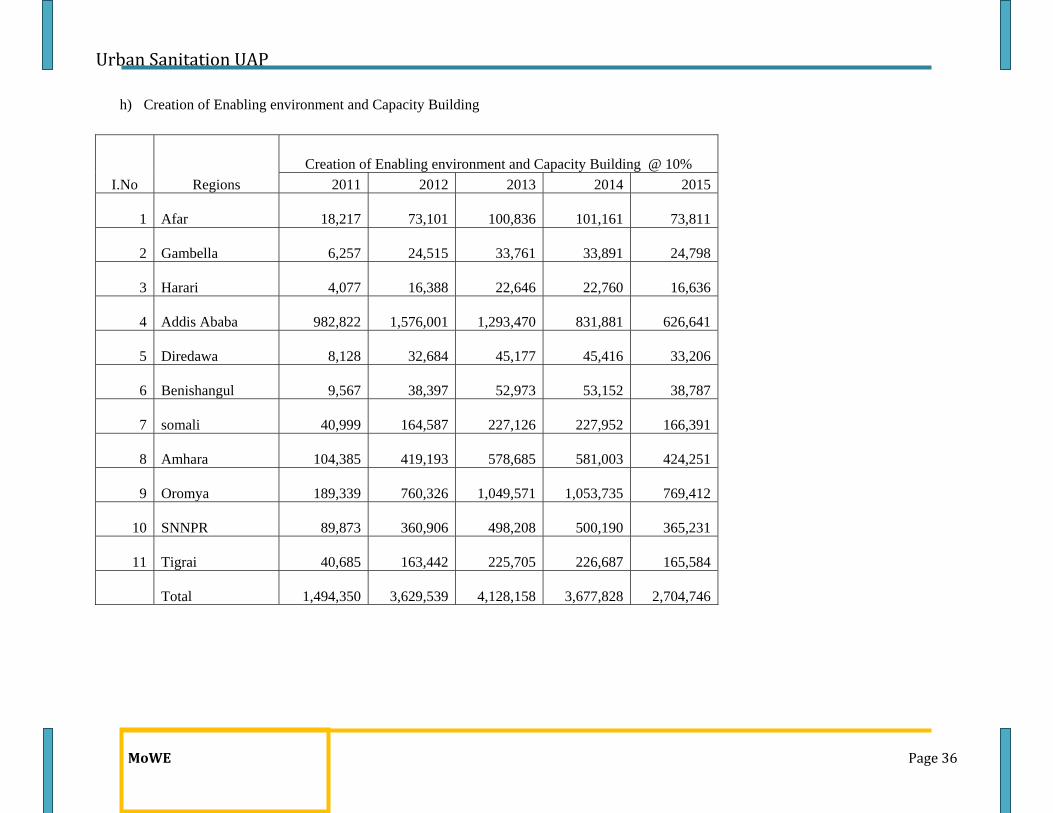
h) Creation of Enabling environment and Capacity Building
I.No Regions Creation of Enabling environment and Capacity Building @ 10%
2011 2012 2013 2014 2015
1 Afar
18,217
73,101
100,836
101,161
73,811
2 Gambella
6,257
24,515
33,761
33,891
24,798
3 Harari
4,077
16,388
22,646
22,760
16,636
4 Addis Ababa
982,822
1,576,001
1,293,470
831,881
626,641
5 Diredawa
8,128
32,684
45,177
45,416
33,206
6 Benishangul
9,567
38,397
52,973
53,152
38,787
7 somali
40,999
164,587
227,126
227,952
166,391
8 Amhara
104,385
419,193
578,685
581,003
424,251
9 Oromya
189,339
760,326
1,049,571
1,053,735
769,412
10 SNNPR
89,873
360,906
498,208
500,190
365,231
11 Tigrai
40,685
163,442
225,705
226,687
165,584
Total
1,494,350
3,629,539
4,128,158
3,677,828
2,704,746

Urban Sanitation UAP
MoWE Page 37
i) Urban Health Extension Activities
Regions
Urban Health Extension Activities @20% of Overall Financial Requirement
2011 2012 2013 2014 2015
Afar 36,434
146,201
201,671
202,322
147,622
Gambella 12,513
49,031
67,522
67,781
49,596
Harari 8,153
32,776
45,292
45,520
33,273
Addis Ababa 1,965,644
3,152,002
2,586,941
1,663,762
1,253,281
Diredawa 16,256
65,367
90,353
90,832
66,411
Benishangul 19,134
76,793
105,945
106,304
77,575
somali 81,999
329,174
454,251
455,905
332,781
Amhara 208,770
838,386
1,157,371
1,162,007
848,501
Oromya 378,678
1,520,651
2,099,142
2,107,470
1,538,823
SNNPR 179,747
721,812
996,417
1,000,381
730,461
Tigrai 81,371
326,884
451,410
453,374
331,169
Total 2,988,701
7,259,077
8,256,315
7,355,657
5,409,493


