WTP81 WORLD BANK TECHNICAL PAPER NUMBER 81 April 1988 URBAN TRANSPORT SERIES UrbanTransport in West Africa Richard Barrett IN - [^t1si JI t^lpl4 q9q-l LA-JiAI WV olw AAAII-~~~~~~ NI~ A b* ***~~~~~~~~~~~~~~~~~~~~~~~~~~~.A HE . A358 t 9 f f i f f0 > 2 t > Sf f i 6 @ A 1c. stl11,1,w 1pK t-;t''M:S>>2 j I--~~~~~~~~~~~~~W !FrILE Clgu'kr 1_1... . ... Public Disclosure Authorized Public Disclosure Authorized Public Disclosure Authorized Public Disclosure Authorized
Transcript
WTP81WORLD BANK TECHNICAL PAPER NUMBER 81 April 1988URBAN TRANSPORT SERIES
Urban Transport in West Africa
Richard Barrett
IN- [^t1si JI t^lpl4 q9q-l LA-JiAI WV
olw AAAII-~~~~~~ NI~ A b*
***~~~~~~~~~~~~~~~~~~~~~~~~~~~.A
HE
. A358 t 9 f f i f f0 > 2 t > Sf f i 6 @ A
1c. stl11,1,w 1pK t-;t''M:S>>2 j
I--~~~~~~~~~~~~~W
!FrILE Clgu'kr 1_1... . ...
Pub
lic D
iscl
osur
e A
utho
rized
Pub
lic D
iscl
osur
e A
utho
rized
Pub
lic D
iscl
osur
e A
utho
rized
Pub
lic D
iscl
osur
e A
utho
rized
RECENT WORLD BANK TECHNICAL PAPERS
No. 40. Plusquellec and Wickharn, Irrigation Design and Management: Experience in Thailandand Its General Applicability
No. 41. Bord na M6na, Fuel Peat in Developing Countries
No. 42. Campbell, Administrative and Operational Procedures for Programs for Sites and Servicesand Area Upgrading
No. 43. Simmonds, Farming Systems Research: A Review
No. 44. de Haan and Nissen, Animal Health Services in Sub-Saharan Africa: Alternative Approaches(also in French, 44F)
No. 45. Sayers, Gillespie, and Queiroz, The International Road Roughness Experiment: EstablishingCorrelation and a Calibration Standardfor Measurements
No. 46. Sayers, Gillespie, and Paterson, Guidelines for Conducting and Calibrating Road RoughnessMeasurements
No. 47. Segura, Guidelines for Evaluating the Management Information Systems of IndustrialEnterprises
No. 48. Tschannerl and Bryan, Handpumps Testing and Development: Proceedings of a Workshopin China
No. 49. Gunnerson and Stuckey, Anerobic Digestion: Principles and Practices for Biogas Systems
No. 50. Turtiainen and Von Pischke, Investment and Finance in Agricultural Service Cooperatives
No. 51. Shuval and others, Wastewater Irrigation in Developing Countries: Health Effects andTechnical Solutions
No. 53. Bamberger and Hewitt, Monitoring and Evaluating Urban Development Programs:A Handbookfor Program Managers and Researchers (also in French, 53F)
No. 54. Bamberger and Hewitt, A Manager's Guide to "Monitoring and Evaluating UrbanDevelopment Programs: A Handbook for Program Managers and Researchers" (also inFrench, 53F; Spanish, 53S; and Chinese, 53C)
No. 55. Technica, Ltd., Techniques for Assessing Industrial Hazards: A Manual
No. 56. Silverman, Kettering, and Schmidt, Action-Planning Workshops for DevelopmentManagement: Guidelines
No. 5 7. Obeng and Wright, The Co-composing of Domestic Solid and Human Wastes
No. 58. Levitsky and Prasad, Credit Guarantee Schemes for Small and Medium Enterprises
No. 59. Sheldrick, World Nitrogen Survey
No. 60. Okun and Emst, Community Piped Water Supply Systems in Developing Countries:A Planning Manual
No. 61. Gorse and Steeds, Desertification in the Sahelian and Sudanian Zones of West Africa
No. 62. Goodland and Webb, The Management of Cultural Property in World Bank-AssistedProjects: Archaeological, Historical, Religious, and Natural Unique Sites
No. 63. Mould, Financial Information for Management of a Development Finance Institution:Some Guidelines
No. 64. Hillel, The Efficient Use of Water in Irrigation: Principles and Practices for Improving Irrigationin Arid and Semiarid Regions
(List continues on the inside back cover)
Urban Transport in West Africa
- ii -
URBAN TRANSPORT SERIES
This series is sponsored by the Infrastructure and UrbanDevelopment Department (which has responsibility for areas formerlycovered by the Water Supply and Urban Development and TransportationDepartments) to provide guidance on technical issues in the urbantransport field. The series supports the sector policy paper UrbanTransport and is designed to assist city and central governmentofficials, as well as World Bank staff and consultants, concerned withurban transport in developing countries.
Volumes already published include:
o Institution Building for Traffic Managment(World Bank Technical Paper Number 8)
o Urban Transit Systems: Guidelines for Examining Options(World Bank Technical Paper Number 52)
o Bus Services: Reducing Costs, Raising Standards(World Bank Technical Paper Number 68).
A complementary paper is Toward Better Urban Transport Planning inDeveloping Countries (World Bank Staff Working Paper Number 600).
It is expected that further guidelines will be added to thisseries to cover other urban transport issues when the need arises.
All rights reservedManufactured in the United States of AmericaFirst printing April 1988
Technical Papers are not formal publications of the World Bank, and are circulatedto encourage discussion and comment and to communicate the results of the Bank'swork quickly to the development community; citation and the use of these papersshould take account of their provisional character. The findings, interpretations, andconclusions expressed in this paper are entirely those of the author(s) and should notbe attributed in any manner to the World Bank, to its affiliated organizations, or tomembers of its Board of Executive Directors or the countries they represent. Any mapsthat accompany the text have been prepared solely for the convenience of readers; thedesignations and presentation of material in them do not imply the expression of anyopinion whatsoever on the part of the World Bank, its affiliates, or its Board or membercountries concerning the legal status of any country, territory, city, or area or of theauthorities thereof or concerning the delimitation of its boundaries or its nationalaffiliation.
Because of the informality and to present the results of research with the leastpossible delay, the typescript has not been prepared in accordance with the proceduresappropriate to formal printed texts, and the World Bank accepts no responsibility forerrors.
The material in this publication is copyrighted. Requests for permission to reproduceportions of it should be sent to Director, Publications Department at the address shownin the copyright notice above. The World Bank encourages dissemination of its workand will normally give permission promptly and, when the reproduction is fornoncommercial purposes, without asking a fee. Permission to photocopy portions forclassroom use is not required, though notification of such use having been made willbe appreciated.
The most recent World Bank publications are described in the catalog NewPublications, a new edition of which is issued in the spring and fall of each year. Thecomplete backlist of publications is shown in the annual Index of Publications, whichcontains an alphabetical title list and indexes of subjects, authors, and countries andregions; it is of value principally to libraries and institutional purchasers. The latestedition of each of these is available free of charge from the Publications Sales Unit,Department F, The World Bank, 1818 H Street, N.W, Washington, D.C. 20433, U.S.A.,or from Publications, The World Bank, 66, avenue d'Iena, 75116 Paris, France.
Richard Barrett is a senior transport specialist in the Infrastructure Division, TechnicalDepartment, of the World Bank's Africa Regional Office.
Library of Congress Cataloging-in-Publication Data
Barrett, Richard, 1945-Urban transport in West Africa.
( World Bank technical paper, ISSN 0253-7494 ; no. 81)(Urban transport series)
1. Urban transportation--Africa, West. 2. Buslines--Africa, West. I. Title. II. Series.III. Series: Urban transport series.HE311.A46B36 1988 388.4'0966 88-10651ISBN 0-8213-1042-9
- v .
Abstract
Urban transport services are grossly inadequate to meet the needs ofthe existing urban population in West Africa. In many countriesinfrastructure dates back to the colonial period and has not beenadequately maintained or improved since that time. Rapid urban populationgrowth (estimated at 4 to 6 percent), particularly in the unplannedsquatter settlements, has exacerbated the deficiencies in urban transport.As a result, many cities in the region have accumulated a massive backlogof maintenance and improvement works. Their secondary road systems areinadequate and the main road network suffers from serious trafficcongestion, travel delays and high accident rates.
This publication analyzes the urban transport constraints in citiesin West Africa, including Abidjan, Accra, Bamako, Dakar, Freetown, Ibadan,Lagos and Monrovia and identifies the following policy issues which mustbe addressed to improve the urban transport sector in West Africa: (i)cost recovery and mobilization of resources; (ii) government role in theprovision of public transport services; (iii) ways to improve theefficiency of road transport; and (iv) institutional development. Thepublication derives its recommendations from World Bank project experiencein Abidjan, the results of research undertaken in preparation of thispublication and other World Bank studies.
- vi -
Acknowledgements
The author wishes to acknowledge his appreciation to Mr. Alan Armstrong-Wright, Urban Transport Adviser, and A. Pelligrini, Division Chief of AF4IN,who provided valuable direction in the preparation of this paper. The authoralso expresses his gratitiude to the staff of the Infrastructure Division ofthe Africa Region.
- vii -
Preface
The inefficiency or unavailability of urban transport servicesand infrastructure is emerging as a major impediment to economic growth inAfrica. Improvements in transport services are also a necessary complementof programs undertaken to alleviate poverty and enhance economicopportunities in rapidly growing urban areas. World Bank and IDA supportto urban development in Africa has expanded steadily over the last fifteenyears tackling a broad range of subjects: metropolitan planning, municipalfinance and management, infrastructure, provision of shelter, housingfinance and transport. Bank/IDA involvement in urban transport has beenlimited so far. The present publication is meant to draw the lessons fromthe experience gained so far and to lay out directions for futuredevelopment.
In many countries, a major backlog of maintenance andrehabilitation works has accumulated. Rapid urban growth, which has farsurpassed the growth of services, has given rise to thousands of unplannedurban settlements containing as many as 50,000 to 100,000 squatters whohave no access to infrastructure and services. The demand for travel hasgrown significantly without any increase in road capacity resulting ininadequate secondary road networks, increased maintenance and improvementneeds, serious traffic congestion, travel delays and high accident rates.
The record of the public sector in responding to public transportdeficiencies has invariably been unsuccessful in West Africa withGovernment-backed companies often incurring huge financial losses. Bycontrast, private operators are able to provide profitable and efficientservices in capital cities and in other significant urban centers. Costper unit of output for private services has been estimated at about halfthat of publicly owned services, even when private and public transportservices are operating under the same conditions.
The findings of other World Bank studies of world-wide coverageprovided a frame of comparison and an underpinning for the present paper.The paper sets out strategic directions and policy options for the futuredevelopment of the urban transport sector. Of critical importance are thefollowing four basic policy options: (i) improving the financial resourcesat the municipal level through increased cost recovery and mobilization ofresources; (ii) rationalizing the roles of government and the privatesector in the provision of public transport; (iii) enhancing road transportefficiency; and (iv) carrying out institutional development programs tostrengthen central and local government transport agencies.
The paper should be of use to planners and policy makersresponsible for urban development in Africa. We hope that it will spuradditional research and develop exchanges among professionals engaged inurban sector and transportation issues.
Hans WyssDirector
Technical DepartmentAfrica Region
- ix -
Contents
EXECUTIVE SUMMARY . .......................................... xi
Current Strengths ........... ..................... 11Current Weaknesses .......... ..................... 11
III. THE WORLD BANK'S EXPERIENCE TO DATE
Lending for Urban Transport ...................... 15The West African Experience ...... ................ 17Lessons and Priorities ........ ................... 18
IV. THE WORKS BANK'S ROLE AND STRATEGY
Increasing the Emphasis on Urban Transport .... ... 21Institutional Targets ......... ................... 22Involvement of the World Bank ...... .............. 23Project Benefits ............ ..................... 27
Despite more than a decade of attempts to arrest the migration ofrural populations to the cities of West Africa, urban growth continues ata rate of 4-6 percent. It seems likely that this trend will continue wellinto the future and that the urban population of West Africa will increasefrom the present level of 22 percent to about 40 percent of total populat-ion over the next 15 years. By the year 2000 there will be about 15 citieswith populations greater than 1 million, of which at least 10 will be inNigeria.
The record of the public sector in providing and maintaining urbanservices and infrastructure has been discouraging. In many cases infra-structure dates back to the colonial period and has not been improvedsince that time. Consequently, a major backlog of maintenance andimprovement works has accumulated. Because the authorities have not beenable to keep pace with urban growth, huge areas of land have been occupiedby squatters who have no access to infrastructure and services. Some ofthese unplanned areas contain as many as 50,000 to 100,000 inhabitants.Thus the demand for travel has grown significantly, without any increasein road capacity. As a result, most cities in the region have inadequatesecondary road networks and suffer from serious traffic congestion, traveldelays, and high accident rates.
The problems of traffic congestion on the primary road network is dueless to a lack of capacity than to inefficient use of road space, poorroad maintenance, indiscriminate parking, and street trading. Theseproblems can be resolved quickly, and at a moderate cost, without recourseto heavy capital expenditure on new roads. Unfortunately, in the pastneither the funds nor the human resources have been available to tacklethese problems. This situation is now changing as more and more profess-ional transport engineers are entering government and municipal service.Over the past two years maintenance budgets in Dakar, Douala, Lagos,Ibadan, and Abidjan have been increased, and significant traffic manage-ment improvements have been implemented or are planned. The improvementsare particularly noticeable in Abidjan and Lagos.
Government intervention in the provision of public transportservices has invariably been unsuccessful. Government-backed companieshave collapsed in Bamako and Ibadan, and serious financial losses havebeen incurred in Abidjan, Dakar, and Lagos. Less serious losses areoccuring in Freetown, Accra, and Monrovia. In contrast, private operatorsin these cities and all other significant urban centers are able toprovide profitable services. The principal reason for this difference isthat the cost per unit of output for private services is about half thatof publicly owned services, even when private and public buses areoperating under the same conditions.
Up until 1985, the Bank's intervention in urban transport in theregion has been limited to Abidjan, where major improvements in efficiencyhave been achieved through traffic management, public transport, and roadmaintenance components. Four important lessons have been learned from theprojects undertaken in Abidjan. First, the principal obstacle to improvingthe urban transport situation is a lack of knowledge of what to do and howto do it. Another obstacle is the financial constraints. In Abidjan, both
- xii -
these constraints were overcome within the framework of the World Bankproject through institutional development and the provision of adequatebudgets for traffic management and road maintenance. Thirdly, importantgains in terms of national policy impacts can be achieved by concentratingtechnical support in central government agencies. In the longer term, thedevelopment of sound municipal agencies should be the objective. Finally,significant resources need to be devoted to the training of city and othergovernment officials to achieve a permanent impact.
The experience gained in Abidjan and the results of the researchunderaken in the preparation of this report and other World Bank studiespoint to four basic policy issues that need to be addressed in the urbantransport sector in West Africa. (See also "Urban Transport: A World BankPolicy Study")
Cost Recovery and Mobilization of Resources
Improving cost recovery and mobilizing resources is the firstessential step in improving the urban transport situation. Withoutadequate funding, little can be done to improve the service and infra-structure facilities required to operate the transport system. Full costrecovery through motor vehicle and fuel taxes is an attainable objectivein the road transport sector. Implementing such a policy can be polit-ically acceptable if the benefits to transport users can be clearly seen.This does not necessarily mean investing in major, capital-intensiveinfrastructure programs. Visible benefits can be obtained by keeping roadsin good condition, improving traffic management, and directing investmentto the needs of commercial traffic and public transport rather than theneeds of motor cars. The principal opportunities for cost recovery in theroad transport sector are taxes on vehicles, spare parts, and fuel. Thesetaxes are generally collected by central governments and used, in part, tofund improvements to the national road network. Full cost recovery can beobtained by selectively raising taxes to an appropriate level. However,political constraints may make this objective difficult to achieve in somecountries.
In urban areas, responsibility for the majority of the roadnetwork belongs to local government authorities. Because their ability tolevy and collect taxes is limited, road and other infrastructure networksare often neglected. Improving resource mobilization at the localauthority level should therefore be an important policy objective of anygovernment. In addition, there are several ways that the local authoritycan collect "user charges.n The most simple are to introduce parkingtariffs and increase fines for illegal parking. These will only beeffective, however, if steps are taken to tow away offending vehicles.Significant revenue can also be generated from towing charges.
Government Role in the Provision of Public Transport Services
Although governments and city authorities in the region have not beenvery successful in running bus services themselves, they can createconditions that allow operators to provide viable bus services that areable to meet the growing demand and provide quality service. The idealsituation as far as most countries in the region are concerned would befor governments to encourage the private sector to provide public
- xiii -
transportation and for the governments themselves to concentrate onregulation of the sector and planning and improving the road network.
Improving the environment for the development of privateoperators generally means relaxing certain government regulations toensure easy access to the market and freedom to set fares. Governments canplay an important role by ensuring that: (a) safety and pollutionstandards are met; (b) roads are well maintained; (c) traffic movessmoothly; (d) bus priority measures are introduced; (e) terminals are wellorganised and managed; (f) access roads are constructed into low-incomehousing areas; and (g) exchange control and financing are facilitated.(See also "Bus Services: Reducing Costs, Raising Standards" - World BankTechnical Paper No. 68.)
The major difficulties the publicly owned public transportcorporations face are overstaffing, high rates of pay, low busproductivity, and revenue leakage. The low productivity of public buscompanies is generally due to problems of maintenance, difficulties inobtaining spare parts and, in particular, the lack of incentives. Thesetting of unrealistic fare levels and interference in bus operationsfurther handicaps the corporations' ability to run a viable operation. Allthese problems need to be tackled if public bus companies are to becomeprofitable. A formula that has been used with some success in Abidjan andDakar is to establish an agreement between government and the bus companywhereby both parties are obligated to meet certain goals and targets. Forthe company, these are related to improved viability, productivity andperformance; for the government, regular fare reviews, tax concessions,and financial support, but at decreasing levels. An agreement of this typeis fundamental to improving the viability of a public bus company becauseof the impact that government policies can have on the sector.
In some countries governments are considering investmentin mass transit systems. However, because of the fragile state of theeconomies of most West African countries, it is unlikely that aconventional subway system would be affordable. The first stage in thedecisionmaking process for a possible mass transit project shouldtherefore involve a study of options ranging from conventional busesoperating on separate rights-of-way, to heavy rail systems. A decision tomove ahead to detailed design should only be made after a full analysis ofthe alternatives has been carried out. (See also "Urban Transit Systems:Guidelines for Examining Options" World Bank Technical Papaer No. 52)
Improving Road Transport Efficiency
The principal objectives of introducing policies designed toimprove efficiency are: (a) to make the most cost-effective use possibleof the existing infrastructure and facilities; and (b) to minimizetransport costs.
The first step in improving efficiency is to ensure that roadsare well maintained. This means establishing or developing roadmaintenance units to handle national and local roads. Very often theprimary road network in a city is maintained by central government and thelocal roads are maintained by the municipality. Both organizations shouldhave adequate budgets to undertake an annual program of maintenance and
- xiv -
rehabilitation. The keys to achieving this objective lie in resourcemobilization and institutional development.
Once the road network is well maintained, very significantefficiency improvements can be obtained through the use of trafficmanagement measures. These should focus on the main transport corridorsand the key intersections in the road network. Emphasis should also begiven to: (a) improving travel conditions for public transport modes,since these are the most efficient in terms of moving passengers; and (b)bypass routes for freight traffic serving ports and industrial areas. Goodtraffic management can also have a major impact on reducing accidents.
Where traffic levels are such that the capacity of the roadnetwork, even with traffic management improvements, is inadequate tohandle demand, consideration should be given to demand management measuresthat focus on the use of private cars. These might include straightforwardsuppression of demand for private cars by increases in vehicle and fueltaxes; increased parking charges; area traffic restraint; staggering ofwork hours; or any other schemes designed to spread or restrict privatevehicle demands during peak periods.
Institutional Development
As mentioned above, the key to improving efficiency in the urbantransport sector is the establishment of road maintenance and trafficmanagement units. While ideally these should be located within thetechnical services department of the municipality, in small countries, orwhere qualified professionals are in scarce supply, there may be goodreasons for choosing, at least initially, to establish such units in theMinistry of Works or Transport. (See also "Institution Building forTraffic Management" World Bank Technical Paper No. 8)
In most cities, traffic management is the concern of a number ofpolicy and executive agencies. As a result, there is a pressing need forclose coordination, efficient decisionmaking machinery and enforcement,and clearly defined responsibilities. Once such units are in place theybecome a focus not only for the management of the road network but alsofor transport planning and project evaluation. To fully respond to thesedemands, emphasis will need to be given to training, particularly withregard to traffic management, traffic safety, transport planning, andtraffic enforcement. Such training should involve staff from ministries,municipalities, transport operators and the police.
- 1 -
I. BACKGROUND AND TRENDS
Urbanization
1. The West Africa Region comprises 23 countries with a population of177 million (1982), representing 36 percent of the total population ofAfrica. The region contains some of the poorest countries in the world. In1982, 16 of the 23 countries had a per capita GNP of less than US$500 (seeTable 1) and only two countries (Congo and Gabon) had a per capita GNPgreater than US$1,000. Three countries (Nigeria, Cote d'Ivoire and Cameroon)had a per capita GNP between US$500 and US$1,000.
2. The largest country in the region is Nigeria, with 90 millioninhabitants (51 percent of the region's total population). Ghana has the nexthighest population, with 12 million, or 6.9 percent of the region'spopulation. The smallest country is Sao Tome and Principe, with only 100,000inhabitants. Population growth rates generally fall in the range of 2-3percent per annum. Cote d'Ivoire has one of the highest growth rates at 4.4percent per annum.
3. About 25 percent of the region's population live in urban areas. Morethan half the urban dwellers live in Nigeria. Except for Nigeria andCameroon, the urban population is concentrated in the capital city. Abidjan,Freetown, Dakar and Monrovia all have more than 50 percent of the countries'total urban population resident within the municipal boundaries. In Cameroonapproximately 40 percent of the urban population is resident in the twoprincipal cities of Douala and Yaounde. The urban population in Nigeriaaccounts for about 55 percent of the country's urban population. If currenttrends continue, the urban population in West Africa will increase to 110million by the year 2000 and will represent about 35-40 percent of the totalpopulation.
4. The West African urban population is growing at about 5-6 percent perannum, about twice the rate of the total population. As shown in Table 2,growth rates in the capital cities have been even higher (9 percent in Lagos,8 percent in Yaounde, 7 percent in Abidjan, Bamako and Monrovia, and 6percent in Dakar and Freetown). This substantial growth is due to a highrate of natural population increase and a large influx of people from ruralareas. In the case of Nigeria and Cote d'Ivoire, migration from poorerneighboring countries during periods of high economic growth has alsocontributed to the high urban population growth rates. If current trendscontinue, the number of cities with more than 1 million inhabitants willincrease from 6 to more than 12 by the turn of the century. More than half ofthese will be in Nigeria.
- 2 -
Table 1. Population and GNP per Capita in West African Countries
Population Population GNP per GNP per Capita1982 Growth Rate Capita Growth Rate
Source: Mission findings and World Bank Statistical Tables.
- 3 -
Motorization
5. There are approximately 1.05 million vehicles (excluding motorcycles)operating in the West Africa region, of which about one-third are registeredin Nigeria. As shown in Table 3, the level of motorization in all countriesof the region, except Gabon, is very low, varying from about 5 to 15 vehiclesper 1,000 population. The majority of vehicles (between 50-70 percent) areregistered and operated in the capital and principal cities of the region.The level of motorization in the region's urban areas is therefore muchhigher, ranging from 30 to 60 vehicles per 1,000 inhabitants. Nigeria and theCote d'Ivoire have the largest number of vehicles, accounting for about 55%of the region's total vehicle fleet.
6. Vehicle growth rates over the past five years generally have beengenerally low, except for motorcycles. As shown in Table 3, growth rates haveremained static or declined in three countries; have increased at about 3percent per annum in two, and has increased at 6 percent per annum in onecountry. The principal reason for these low growth rates is poor economicperformance recorded by countries in the region over the past few years. Itseems unlikely that economic conditions will improve suffic-iently to have amajor impact on the level of motorization over the next 5-10 years.
7. Vehicle growth rates in most countries of the region are lower thanpopulation growth rates and significantly less than urban population growthrates. Consequently, the level of motorization is falling both at thenational level and in the principal cities. This situation began to occur inmany African countries during the period 1975-80 as the full impact of thehike in fuel prices began to have a serious impact on the balance of paymentsof the poorer countries. Most governments reacted by strictly controllingforeign exchange spending on all manufactured goods and fuel. Privatevehicles and spare parts have been one of the principal targets for suchcuts, since together with fuel they represent a large proportion of foreignexchange spending.
8. Because of the low level of motorization, public transportation plays avery important role in the daily lives of the region's population,particularly urban dwellers. Several factors point to an even greater rolefor urban public transport vehicles over the next decade: (a) it is veryunlikely that there will be any major improvement in the economies of theWest African countries; (b) the growth of the vehicle fleet will continue tobe low; (c) urban population growth will continue to be very high; and (d)the level of motorization will continue to fall. The trend toward increaseduse of motorcycles in some countries is likely to continue.
9. Unlike the developed nations, where public transportation competes withprivate transport, in the countries of West Africa the only alternative topublic transportation for the vast majority of the population is to walk. Ascities get larger and the distances between homes, workplaces, and communityservices get longer, even this alternative becomes less feasible. It istherefore not surprising to find that the demand for public transportservices in all the major cities of West Africa is very strong and generallyexceeds the supply during peak periods. Unfortunately, those least able toafford public transportation are the ones that live furthest from theprincipal employment centers.
- 4 -
Table 3. Vehicle Fleets, Motorization and Growth Rates
1/ 19822/ 19832/ 19814/ Over five-year period. Cote d'Ivoire and Cameroon over four years.5/ Vehicles per 1,000 population.6/ 19847/ 19808/ 1986
Source: Mission findings. International Road Federation Statistics.
5-
Public Transport
10. The majority of public transportation services in West Africa are
provided by the private sector. Public transport modes take the form of taxis
(the majority of which are unmetered and operate on a shared-ride basis),minibuses, pick-ups, conventional single decker buses and converted trucks.Privately operated vehicles are either owned by small companies or owneroperated. Very few private companies operate more than 20 vehicles. Public
transport operations and fares are regulated by government. Regulations are
generally minimal and mainly consist of showing appropriate licenses, payingthe required fees, and submitting the vehicle to a biannual fitnessinspection. Passenger insurance is a requirement in most countries. Operatorsgenerally have freedom of choice as to which routes they operate. Fares areoften fixed and are close to the maximum stipulated by government.
11. Most public transport vehicles tend to operate on fixed routes. In some
countries the private operators on a given route have formed loosecooperatives to protect their interests from pirates. In Bamako, for examplethere are 18 route-based cooperatives for minibus and pick-up operators.These cooperatives are recognized by the government and act as a pressure
group. In other countries there are various unions and owners or driversorganizations that protect the interests of the operators. Most of the
smaller type of vehicles (carrying up to 18 passengers) are owned byindividuals who hire the vehicle to a driver on a daily basis. A smallerproportion are operated by owner/drivers. From the fares collected, thedriver pays the owner a fixed fee, the operating expenses, the relief driver,
the caller who brings him passengers at the terminus and the fare collector.What is left he keeps for himself. The owner generally pays for repairs,insurance, and taxes. Many taxis are also operated in the same manner.
12. Public bus companies operate in several of the major cities (see Table
4). The largest are SOTRA in Abidjan with 869 buses and 19 boats, LSTC in
Lagos with 540 buses, SOTRAC in Dakar with 440 buses, and SOTUC in Cameroonwith 197 buses in Douala and 115 buses in Yaounde. Public bus companies
1/ Loss shared with Douala; 2/ Including inter-city; y/ 1986Source: Mission findings.
- 6 -
also operate in Freetown, Accra, and Monrovia. The bus companies in Abidjan,Douala, Yaounde, and Dakar are jointly owned by the national governments andRenault Vehicle Industries, with the governments bearing the financialcommitment. Expatriate personnel are employed in key positions in all thesecompanies.
13. There are some major differences in how governments have organized urbanpublic transport in the principal cities throughout the region. In Abidjan,Yaounde and Douala, the government-sponsored bus companies have a completemonopoly within the city limits except for conventional taxis, which areallowed to travel anywhere. In Dakar, the bus company has a partial monoply.In all of these cities the private sector has at some stage been evicted fromparts of the city. In other cities such as Accra, Freetown, and Monrovia thegovernment-sponsored bus companies compete with private operators. In Bamakothe government has backed out of public transportation altogether and it isnow left entirely to the private sector. This is also the situation in almostall the secondary cities in the region.
14. It is notable that all government-sponsored bus companies in the regionhave met with severe financial problems. In Abidjan, Lagos, and Dakar thishas involved annual subsidies of millions of dollars. In Douala and Yaoundethe losses have been less severe, but all capital investment has had to becovered by government grants. Elsewhere in the region, the government-sponsored bus companies are in a very poor state. A large proportion of thefleets (generally in excess of 50 percent) are inoperable due to lack ofspare parts. This experience has left some governments with a feeling ofreluctance to get involved in the provision of public transport services anda growing recognition of the important role played by the private sector.Five-to-ten years ago the situation was the reverse.
15. It is also important to note that the problem of spare parts, which isone of the principal reasons for the poor performance by the bus companies,is mainly a problem for publicly owned operators in those countries with anonconvertible currency (the Anglophone countries). The countries which usethe F.CFA. are less constrained by the availability of foreign exchange dueto their currency's convertibility with the French franc. The privateoperators do not suffer to the same extent in obtaining spares because theymainly operate small, commonly used vehicles that can be readilycannibalized. French and Japanese vehicles are the most popular makes forparatransit services in West Africa.
16. Rapid urbanization in West Africa is bringing with it major developmentproblems across many sectors that are requiring public investment.Governments are becoming increasingly reluctant to invest in loss-makingactivities that may require large annual subsidies. It is also an area wherethe private sector is a willing participant. It is highly unlikely,therefore, that there will be any new direct government participation inpublic bus companies in West Africa in the next five to ten-years. Thepossible involvement of governments in mass transit in the form of suburbanrail is a strong possibility, particularly in Abidjan, Lagos, and Dakar wherestudies are already underway to examine possible mass transit options.
between 5 percent and 10 percent of the surfaced road network (see Table 5).Abidjan has by far the largest ratio of urban to national surfaced roadkilometers (29 percent) and also has a well-developed and well-maintainedroad system. In Accra, Abidjan, and Yaounde, between 50 and 60 percent of theroads are surfaced and the number of surfaced kilometers per 1,000inhabitants falls in the range 3.9 to 5.7. The most deficient cities areDouala and Lagos. Douala has only 22 percent of its roads surfaced. Lagos hasonly 44 percent of its roads surfaced and 2.2 kilometers per 1,000inhabitants.
Table 5. Road Networks in Selected Cities
City Proportion km per National Proportion CityCity Kilometers Surfaced 10,000 pop Kilometers Surfaced Percent
18. Urban road maintenance in the region is generally very poor. AgainAbidjan is a notable exception. Elsewhere, apart from the few kilometers ofnational road network in the principal cities, the urban road networksreceive very little attention. In some cities, large sections of thesecondary and tertiary networks have never been maintained in more than adecade and are only passable at very low speeds.
19. Very few cities have experimented to any extent with traffic management.Traffic control devices and signs are very sparse. Traffic control equipmentis generally old and in a poor state of repair. Very often up to 50 percentof equipment is out of action at any one time. Limited one-way systems havebeen introduced in some cities and these are generally effective. Muchgreater scope for these types of measures exists in all cities. Footways areoften nonexistent or in very poor condition. Much valuable road capacity islost in the central areas through pedestrians being forced to walk on thestreets because of market and trading activities occurring on the footways.Parking is generally a free-for-all with very a poor level of enforcement.Once again, Abidjan is the notable exception in all aspects of the above andalso has more than five kilometers of segregated rights-of-way for buses.
20. Traffic congestion is a major problem in most cities. The congestion ismore often due to poor utilization of road space, inadequate roadmaintenance, and lack of enforcement than a capacity deficiency. Thetraditional market areas and port areas are also a major source of trafficcongestion.
Road Accidents
21. Countries in the West Africa Region have some of the worst accidentstatistics in the world. The number of deaths per 10,000 vehicles in severalcountries in the region is 6-to-60 times greater than in the USA or the UK.1/ The highest ratio of deaths occurs in Nigeria, where traffic accidentsaccount for more deaths than common diseases. Although the data in TRRLReport SR 807 refers to 1978, the situation does not appear to have changedsignificantly.
22. Accident statistics collected from certain countries and cities arepresented in Table 6. Data from the Cote d'Ivoire and Senegal suggest thatup to 80 percent of accidents take place in urban areas, but that the chancesof a fatality in a rural accident are about 2.5 times greater. In Abidjan,pedestrians suffer 75 percent of all deaths and 50 percent of all injuries.Since 1978, accident rates in Abidjan have declined substan-tially. Thisimprovement has been attributed in large part to: (a) the implementation ofcomprehensive traffic management measures involving some 136 sets of trafficsignals; and (b) specific accident blackspot remedial measures.
Table 6. Accident Rates in Selected Countries and Urban Areas 1/
Casualties Fatalitiesper 10,000 per 10,000
City Year Accidents Fatalities Injuries vehicles vehicles
1/ These data should be interpreted and compared with caution.
Source: Mission findings and U.K. Transport and Road Research Laboratory.
i/ G.D. Jacobs and I. Sayer, Road Accidents in Developing Countries,Transport and Road Research Laboratory, Report SR 807, Crowthorne,U.K.,1983.
- 9 -
Sector Responsibilities
23. Responsibility for almost all aspects of urban transport throughout allcountries of the region lies with the central government (or the stategovernments in the case of Nigeria). Municipalities are generally responsiblefor maintenance of the secondary road network and footways. However, becauseof a lack of financial resources they are able to do very little unlessspecific grants are allocated by central government. Enforcement of trafficlaws and regulations is the responsibility of the national police. Mostpolice forces have formed specialized traffic divisions, but these aregenerally understaffed and lack the basic equipment necessary to enforcespeed limits and parking regulations. In Lagos and Abidjan, where tow truckshave been provided, indiscriminate parking on the principal road network hasbeen almost eradicated.
24. Despite the fact that well over half of most countries' transportresources are consumed in urban areas, governments have no clear policy withregard to urban transport. One of the main reasons for this is thatresponsibilities in the sector frequently cut across several ministries. Theresponsibility for construction and maintenance of the road network lies withthe ministry of public works; transport regulations are generally the domainof the ministry of transport; the ministry of justice, interior or defencelooks after police affairs; the ministry of energy is responsible for fuelimports; the ministry of finance takes care of taxes and duties; and theministry of trade and commerce is responsible for import quotas. Otherimportant reasons are the lack of trained staff and poor monitoring oftransport data. Because of this, decisionmakers are unaware of the basicissues, managers are unable to present the right facts, and engineers andtechnicians lack effective guidance. There is often, therefore, no one who isable to speak with real authority on the urban transport sector. Consultantsare sometimes brought in to assist the government. Their inputs are often tooshort and their terms of reference too restrictive. They are asked to dealwith the physical aspects of the urban transport problem, leaving out thepolicy and institutional aspects.
Urban Efficiency and the Economy
25. Urban transport plays a major role in the economies of the West Africancountries but also represents a major cost. Generally the urban areas in theregion contribute between 50 percent and 70 percent of the each country'sGNP. The majority of industry and manufacturing centers are located in theprincipal cities, many of which are also the principal ports and commercialcenters. These businesses are dependent on manpower which must be transportedto and from work as cheaply as possible. Urban transport facilitates thisemployment, provides the means by which materials and products aredistributed to industry and consumers, and creates opportunities foreducation and social contact. Delays due to traffic congestion can reduceproductivity and significantly increase transport costs. The cities of WestAfrica are also the traditional economic marketplaces for the informalsector, upon which a large proportion of the urban community is dependent foremployment and income.
- 10 -
26. Although urban roads represent less than 5 percent of the roadnetwork and less than 10 percent of paved roads, they account for between 45and 70 percent of all vehicle miles travelled. This heavy concentration oftransport on urban roads means that between 50-80 percent of road accidentsoccur in urban areas. The costs of these accidents can represent between 1and 2 percent of a country's GDP. 1/ Typically 10-15 percent of vehiclefleets are involved in accidents each year. This represents a major foreignexchange cost in spare parts and replacement vehicles as well as medicalexpenses. Improving and maintaining heavily trafficked urban roads toadequate standards can also involve significant costs.
27. Clearly the proportion of resources consumed by urban transportationis large and the contribution urban transport makes to the economy isimportant. Governments should therefore be concerned that transport resourcesare used effectively, efficiently, and economically. Nowhere is this moretrue than in the case of petroleum products. Oil prices have increased five-fold since 1973 and now represent a major item in all non-oil producingcountries' foreign exchange budgets. Many countries in the region recognizethis and have eliminated subsidies by instigating regular and signifcantrises in fuel prices. There is still. however, a need for stronger energyconservation measures. This might involve higher duties for fuel inefficientand large engine capacity cars; eliminating long mid-day breaks; and reducingtraffic congestion through traffic management, demand management, andstaggered working hours.
Demand Management
28. The concept of demand management in the urban transport sector usuallyrefers to methods of reducing the demand for road space so that investment innew infrastructure can be avoided. The methods used include high taxes onprivate vehicles and fuel, road pricing, area licensing, parking restraints,etc. Demand management in this sense is not practiced in West Africa exceptin Lagos, where the odd/even number plate system was introduced to cut downtraffic demand between the mainland and Lagos Island. The importation ofvehicles, spare parts, and fuel, however, are controlled closely; not for thepurpose of reducing urban traffic congestion, but to regulate the balance ofpayments and conserve foreign exchange reserves. Controlling urban trafficcongestion is a real need throughout the region. This could be achieved inmost cities through the use of traffic management measures, strict parkingcontrols, and higher parking charges.
1/ P.R. Fouracre and G.D. Jacobs, Comparative Accident Costs forDeveloping Countries, Transport and Road Reserch Laboratory, Report SR206, Crowthorne, U.K., 1976.
- 11 -
II. STRENGTHS AND WEAKNESSES
Current Strengths
Public Transportation
1. The principal strength of the urban transport sector in the WestAfrica region is the extensive participation by private operators in theprovision of public transport services. By keeping their operationssmall, private operators are able to keep costs down. They have developeda mode of operation whereby the responsibility for success rests with theindividual driver. He has a strong incentive to do well because hisearnings are related to the number of passengers he transports.
2. These incentives are not present in the public domain, andgovernments often place constraints on operations (low fares for schoolchildren etc.) All publicly owned transport undertakings in the regionfind it difficult to exist without government grants to cover capitalexpenditures and very often, a large part of their operating costs.Finance for the private sector generally comes from individuals andbusinessmen who are reinvesting profits from operating existing publictransport vehicles or have money available from other sources. Driversfrequently are able to save sufficient money over a period of years topurchase their own vehicle.
3. The potential savings to governments of attracting private resourcesto provide what are are traditionally considered to be public services areenormous. The challenge governments face is one of providing anadministrative and regulatory framework within which private urbanpassenger services can be operated economically. Such a solution has beenfound in Bamako, where the government gave up its attempts to operate apublic bus company in the mid '70s and concentrated on facilitatingprocedures for private operators to enter the market and operate services.There are many similar examples from other parts of the world whereprivate operators provide all urban public transport services. One of thelargest cities with such a bus system is Seoul, Korea, where more than 90operators combine to serve the needs of the city's nine million residents.
Current Weaknesses
4. The urban transport sector in West Africa suffers from severalweaknesses:
(a) poor or nonexistent urban transport policies;
(b) inadequate training opportunities in the transport sector;
(c) lack of investment in new roads and inadequate expenditure onroad maintenance;
- 12 -
(d) insufficient use of traffic management;
(e) high accident rates; and
(f) lack of statistics and data.
Lack of Policy Guidelines
5. Very few countries in the region have come to grips with definingpolicies that relate the value and needs of the transport sector to macro-economic considerations. In the Cote d'Ivoire the government has takentough measures to reduce the imports of fuel and vehicles and hasimplemented relatively low-cost traffic management schemes designed toincrease the efficiency of all urban transport modes, particularly buses,and reduce accidents. Urban road maintenance is also improving. In Mali,the government has recognized the difficulties of running a publicly ownedbus fleet and has wisely encouraged the private sector to provide therequired services. The government plays only a regulatory andadministrative role. In addition,the District of Bamako has set up atransport unit to monitor and improve the traffic situation. This is thefirst such unit to have been set up in the region by a local authority.The authorities in Lagos have attempted to improve the traffic situationthrough the construction of a multimillion dollar ring road network andhave introduced an odd/even number plate control system to try to reduceurban congestion. Elsewhere in the region, very little has been done andno country can be said to have developed a comprehensive urban transportpolicy.
Lack of Training
6. One of the principal reasons for the poor understanding of the urbantransport sector is the lack of qualified local transport planners andengineers who are in a position to influence the decisionmaking process.Practically all studies that have been undertaken in the sector have beendone by expatriate consultants or advisors. Where significant advanceshave been made, as in the case of Abidjan, there has been a major relianceon expatriate assistance within government departments over very longperiods of time. There is, therefore, a strong need for training programsin urban transport-related subjects for government personnel at allprofessional levels.
Lack of Investment in Urban Roads
7. Very few countries in the region have devoted adequate resources tothe maintenance of urban roads over the past decade. Consequently, roadconditions in many cities are extremely poor. Where money has been spentit has been devoted mainly to the national road links, while the secondaryand access roads have remained untouched. There is now a major backlog ofwork to be done to bring urban roads up to adequate standards.
8. To date, the majority of investment in new roads has gone intohousing estate roads and the construction of major new bypass or arterialroads. Very little of this latter type of investment has been undertakenoutside Nigeria, Cameroon and the Cote d'Ivoire. There is a strong
- 13 -
tendency by all governments to consider road construction as the solutionto all traffic problems. In cases where primary road infrastructure isseverely lacking, the construction of a major new road is essential.However, more often than not an adequate medium-term solution can be found
through the judicious use of traffic management techniques. Such schemeshave been used to great effect in Abidjan to defer the construction of
expensive infrastructure.
9. To rectify the backlog of urban road maintenance and upgrading willrequire massive investment i/, which most governments are unable toafford. In Accra, for example, it is estimated that at least US$135million is required to bring the road system up to an adequate standard.Maintaining urban roads, especially in the larger cities, should be a
municipal activity, and in several countries the municipalities arenominally responsible. However, poor municipal management has left most
cities with insufficient resources to afford appropriate road maintenanceprograms. The salaries offered by municipalities are generally low; andconsequently, very few professional engineers are employed. Establishing a
strong municipal tax base and employing adequately trained and experiencedofficials are major necessities for all cities in the region.
Lack of Traffic Management
10. Very little use is made of traffic engineering and managementtechniques throughout the region's urban areas, except in Abidjan, where a
World Bank-sponsored program was begun in 1978 and is still continuing.(The content of this program is described briefly in the followingsection.) Traffic management offers a low-cost approach to resolving urbantraffic problems and can also be used to provide priorities for publictransport vehicles upon which the vast majority of the urban populationdepend. It also involves improving travel conditions and safety forpedestrians. Segregating pedestrians and buses from the general traffic
flow can improve travel conditions for all transport modes.
11. To be effective, traffic management should go hand-in-hand with
strong enforcement, particularly with regard to parking. While severalcities in the region have police traffic units, very few of them areadequately trained or have the necessary equipment to assist them inenforcing penalties for moving and stationary violations. The judicialsystem in several countries does not allow fines to be imposed withoutpassing through the court. This makes issuing tickets an almost fruitlessmeasure, since the court backlog is generally very large and priority isalways given to accident cases. It is also very difficult and timeconsuming in many countries to trace car owners, since there are largeareas in many cities where there are no street names or numbers.Maintaining a system of property records could have a major impact in many
aspects of municipal management and law enforcement.
1/ Road Deterioration in Developing Countries, A World Bank Policy Study,Washington D.C., 1988.
- 14 -
12. The key to improving the traffic situation in the region's urban areaslies in institutional development and training. Little progress will bemade in dealing with urban traffic problems on a continuing basis untiltrained staff are employed in special traffic units, responsible for theday-to-day management of the urban road network. Strong police enforcementof traffic regulations is also a basic requirement.
High Accident Rates
13. Improved traffic management and strong enforcement can have a majorimpact on reducing urban accident rates, as has happened in the Coted'Ivoire and many other countries throughout the world. But action inthese areas alone is not enough. To significantly influence accident ratesrequires concerted action on several fronts at the same time--improveddriver training standards, better school education in road safety,stricter penalties for road traffic violations, etc. Such a comprehensiveapproach can only be achieved through the formation of an agencyresponsible for road safety and detailed monitoring of accident records.Where such agencies have been created, they are generally weak andinadequately financed. The potential savings through reductions in loss oflife, less damage to property, and fewer injuries and deaths could bevery significant; but to achieve them requires a long-term commitment onthe part of governments.
Lack of Data
14. A major handicap to the planning of all sectors in the West Africaregion is the poor data base and lack of monitoring. This is particularlytrue in the urban transport sector, where accurate data are rarelyavailable. Traffic registration statistics very often do not take fullaccount of vehicles that are out of circulation or have been scrapped.Population data is often very sketchy, and accident statistics are rarelyexploitable. The simplest of monitoring exercises to measure fluctuationsof traffic flows is seldom attempted. Without such data it is verydifficult to develop policy guidelines.
- 15 -
III. THE WORLD BANK'S EXPERIENCE TO DATE
Lending for Urban Transport
1. Very little emphasis has been given by the World Bank to urban
transport in West Africa. World-wide (from 1972-85) some 17 urbantransport projects have been approved by the Board and a further 32
projects had significant urban transport components. Three urban transport
projects and eleven urban projects with transport components have been
approved in Africa. In West Africa only two urban projects have included
any significant transport components. Both of these have been in Abidjan.
The transport components of these projects have been among the most
successful of the Bank's operations in the West Africa region and in the
urban transport sector. Two other components in Senegal and Cameroon
provided small amounts of technical assistance. Three more projects with
substantial urban transport components have recently been approved or are
under preparation in Mali, Cameroon, and Ghana.
2. The total cost of the 17 transport projects amounted to US$1.9
billion of which the Bank Group financed US$800 million. In addition the
transport components of urban projects cost US$520 million, of which the
Bank Group financed US$240 million. Urban transport lending world-wide
amounted to US$1,040 million. Lending for urban transport in Africa
amounted to US$180.6 million representing 17 percent of the total. One-
third (US$64.3 million) of this lending, equivalent to 6 percent of the
total, has been in West Africa. Details of loans for urban transport in
Africa are given in Table 8.
Table 8. Urban Transport Lending in Africa
UT Sector UT SectorCost US$ Lending US$
Country Project SAR Date / (millions) (millions)
Tunisia Tunis UT 1973 65.9 18.0 3/
Egypt Greater Cairo UD 1982 90.2 56.6 3/
Tunisia Tunis UT II 1984 82.5 33.0 t/
Cote d'Ivoire Urban D 1976 51.8 20.9 t/
Kenya Second Urban D 1978 0.3 0.3
Tunisia Second Urban D 1979 1.0 0.5
Mauritius Urban Rehab. 1980 2.4 1.8
Cote d'Ivoire Second Urban D 1981 86.3 41.5 yEthiopia Urban D 1982 2.1 1.4
Tunisia Third Urban D 1983 1.8 1.4Cameroon Urban D 1983 0.8 0.4 g/
Zimbabwe Urban D 1984 3.2 2.7
Senegal Tech. Assistance 1984 1.5 1.5 t/
Madagascar Urban D 1984 0.7 0.6
1/ SAR - Staff Appraisal Report.2/ West Africa Projects.2/ Urban Transport Projects.
Source: Urban Transport, A World Bank Policy Study, Washington D.C., 1986.
- 16 -
3. The breakdown of how funds have been spent in urban transport bothworldwide and in West Africa is shown in Table 9. Much of the spending onroads was designed to benefit public transport vehicles and improve accessto low-income housing areas. The small proportion of funds devoted totraffic management reflects the low costs of these measures, whichnonetheless have a high impact and show very high economic rates ofreturn.
Table 9. Expenditure on Different Urban Transport Components
Proportion of CostComponent Type Worldwide West Africa
Road construction, improvement, maintenance 46% 52%Bus acquisition, facilities, priorities 16% 28%Rail systems 16% -Traffic management, road safety 11% 9%Training and technical assistance 5% 10%Pedestrian facilities not included elsewhere 1% 1%Other (sector lending) 5% -
100% 100%
4. A major objective of World Bank lending for urban transport has beento achieve the best use of existing facilities through low-costimprovements and to strengthen traffic and transport agencies. For thisreason, by far the greatest emphasis has been placed on:
(a) rationalization of the use of urban transport facilities, inparticular the use of road space;
(b) providing better access through cost effectiveimprovements and extensions to road networks;
(c) improving the standards and viability of public transportoperations; and
(d) developing a local institutional capacity to plan and implementcomprehensive traffic and transport improvement programs.
5. A more general objective has been to improve travel conditions forthe urban poor by favoring public transport improvements. Other objectiveshave been to reduce accident rates, improve planning and programming andrationalize road maintenance.
- 17 -
The West African Experience
6. The first of the two loans to the Cote d'Ivoire was appraised inDecember, 1975, and closed in November, 1983. The second project wasappraised in June, 1980, and is scheduled to close in 1986. The totalproject cost of the urban transport components were US$51.8 million forthe first project and US$86.3 million for the second project. A thirdurban project, including a US$37 million urban transport component wasappraised in June 1985. Although the projects have been administered bythe central government, the city of Abidjan has been the principalbeneficiary of the transport improvement schemes. Other urban transportcomponents include US$0.8 million for technical assistance in Cameroon(appraised in February 1983) and US$1.5 million for technical assistance(US$0.8 million) and traffic management (US$0.7 million) in Senegal(appraised in March 1984).
7. The impact of the urban transport components in Abidjan has beenextremely positive in policy and physical terms but less so from aninstitutional standpoint. A comprehensive approach to improving urbantransport has been adopted which includes:
(a) various area-wide traffic management improvements in thecentral business district and nearby suburbs, consisting ofone-way street networks, integrated traffic signal schemes, andtraffic signing and road marking programs;
(b) the construction of bus-ways and reserved bus lanes;
(c) the introduction of traffic management measures to improve themovements of pedestrians and buses in low-income suburbs;
(d) the creation of a high-speed express bus network;
(e) upgrading of bus terminals and bus stops and the constructionof a bus depot;
(f) road safety improvements; and
(g) construction of primary roads to improve access to low-incomeareas for public transport vehicles.
8. Before the first project began, key sections of the city's roadnetwork were seriously overloaded, and downtown congestion lasted forseveral hours per day. In other parts of the city, significant delays wereexperienced as buses, cars, taxis, and parked vehicles competed withpedestrians and street traders for road space. As population andmotorization grew, traffic congestion became worse and began to have anadverse effect on the national economy.
9. Considerable all-round improvement has occurred as a result of theprojects. Junction capacities have been increased by as much as 25-to-50percent. The running times for buses across the central area have beenhalved, and delays to other traffic have been significantly reduced. Peak-hour bus flows on one of the busways have reached 180 buses, carrying some30,000 passengers per hour. Accident rates in Abidjan have also been
- 18 -
reduced. These improvements have been achieved even though rush-hourtraffic increased by 20-to-30 percent during the latter half of the 1970s.By making better use of the existing facilities, the Ivoirian Governmentfound it possible to eliminate or defer, several expensive infrastructureprojects and to reduce planned investments between 1981 and 1984 by US$120million.
10. Perhaps the most important impact has been in the field of policydevelopment. The concept of traffic management has been fully accepted;priority is being given to public transport services; low-cost options aresystematically being evaluated as alternatives to major investment in newroads; the importance of improved road safety has been accepted; and roadmaintenance has been significantly improved. On the institutional side, anew agency has been created to manage and maintain all signs, signals, andtraffic control devices. The agency is working well and is now totallystaffed by Ivoirian engineers and technicains. Attempts to establish aplanning and evaluation unit have been less successful and the proposal toestablish a local university training program met with significant delays.
Lessons and Priorities
Lessons
11. The lessons that have been learned through the process ofimplementing the Abidjan urban transport components principally concerninstitutional matters. Very few insurmountable technological problemswere encountered at any stage of the planning and implementation process.The principal lessons can be summarized as follows:
(a) The key to a successful project lies in institutionaldevelopment and strengthening on a long-term basis. Unlike manyother regions of the developing world, there are no educationalestablishments in the region that provide training in urbantransport-related subjects, and there are very fewopportunities for West Africans to see modern traffic systemsand evaluate their effectiveness. There is, therefore, a basiclack of understanding at all professional levels of theconcepts of transport planning and traffic management. It wasnot until the first traffic management schemes had beenimplemented in Abidjan and the benefits seen, that thegovernment recognized the potential for solving trafficproblems in low-cost terms. It is essential, therefore, thatfuture projects in the region recognize the need for long-termtechnical assistance that focuses on on-the-job training andincreasing the awareness of decisionmakers to the need forurban transport policies that improve the efficiency ofexisting facilities.
(b) Priority should be given to strengthening centralgovernment agencies. Where there is very little localexperience in urban transport, important gains, in terms ofnational policy impacts, can be achieved by concentratingtechnical resources in central government agencies. It isinvariably the case in West Africa that nearly all investmentresources are controlled by the state rather than by
- 19 -
municipalities. Providing technical assistance close to thesource of this power is the best way of influencing the way inwhich these resources will be spent. National governmentagencies are also the best placed to have an impact on allurban areas. This has been particularly true in the Coted'Ivoire where the state plays a major role in the finance ofall capital projects and recurrent expenditures. Strengtheningmunicipalities is also important, but should only become anobjective in the urban transport sector if national-levelagencies are already established, or if there is already anucleus of expertise at the local level on which to build, andlocal finances are available to implement traffic or roadimprovement schemes.
(c) Significant resources need to be devoted to training. One areain which the Abidjan projects have not been very successful isin the field of training. As a consequence, expatriateassistance has remained at a high level over a long period.Greater attention needs to be paid not only to short-termtraining, but also to improving in-country trainingopportunities. This could be best achieved by setting uppermanent training programs in existing institutions. Becauseof the relatively small size of many of the countries in theregion it seems that the best approach might be to strengthen,or establish training courses on a regional basis (in oneFrancophone and one Anglophone country).
Priorities
12. Based on the experience in Abidjan and the review of the currentsituation in eight countries of the region, the major priorities for urbantransport in West Africa appear to be as follows:
(a) establishing government or municipal agencies that are able todevelop urban transport policies, and plan, design, andimplement urban traffic and transport improvement projectswhich:
(i) improve the heirarchical structure and operationof the road network;
(ii) reduce traffic congestion;
(iii) improve the efficiency and quality of publictransport operations and encourage private sectorinvolvement; and
(iv) improve travel conditions and safety for all roadusers.
(b) providing transport services to adequately serve the needs ofcommunities at a price that preserves the viability of thepublic transport operators and is affordable to the lowest-paidworkers;
- 20 -
(c) maintaining urban road networks to adequate standards;
(d) introducing traffic management measures; and
(e) reducing accidents rates.
13. Bringing these priorities to reality can only be achieved by makinginstitution building one of the main thrusts of project lending andestablishing training programs that provide engineers, planners, andeconomists with the knowledge and tools to influence decisionmaking. Themain focus of the institutional development measures should be toestablish a strong technical base for the formulation and implementationof policies and projects. The investment that is made in institutionalreforms and development may represent a small proportion of total projectcosts, but its impact can be far-reaching. (Guidelines for the preparationof institutional development components in the urban transport sector aregiven in World Bank Technical Paper No. 8.)
- 21 -
IV. THE WORLD BANK'S ROLE AND STRATEGY
Increasing the Emphasis on Urban Transport
1. Despite more than decade of attempts to arrest the migration of ruralpopulations to the cities of West Africa, urban growth continues at therate of 4-6 percent per annum. It seems likely that this trend willcontinue well into the future, and that the urban population will increasefrom the present level of 22 percent to about 40 percent over the next 15years. In economic terms, the urban areas have been relatively successfulin accommodating this growth. Well over half the GDP of the region isproduced in the industrial and service sectors, which are mainly locatedin the urban areas. More than half the transport resources (vehicles andfuel) are also consumed in these areas.
2. The public sector record has been discouraging. All types ofinfrastructure are lacking--drainage, sanitation, water supply, housing,and roads. To a large extent, the facilities date back to the colonialperiod and have not been improved significantly since that time. This isparticularly true of the urban road networks. A major backlog ofmaintenance and improvement work has accumulated. As a result, travelspeeds are low, traffic congestion is common, and transport isinefficient. Many of these problems can be resolved relatively cheaplythrough improved maintenance, traffic management, and enforcement. Becauseof (a) the high concentration of transport and industrial resources in thecities, and (b) the existing poor state and inefficiency of the roadnetworks, the benefits of such improvements are potentially very large,not only in terms of economic rates of return but also in terms of savingsto the national economy. There is, therefore, a very strong arg-ument forimproving the transport situation in almost all the capital cities of theregion and in the principal industrial, manufacturing, and servicecenters.
3. Until very recently, all the Bank's lending for urban transport inWest Africa has been devoted to Abidjan. This situation is now changing. Agreater awareness on the part of governments of the strategic importanceof urban transport has led to the preparation of urban transport projectcomponents in Accra, Bamako, and Douala. The Accra project, which wasappraised in June 1984, gives emphasis to road and drainage rehabilitationand maintenance, urban upgrading, and municipal resource mobilization. Thecost of the road component is US$15.5 million representing 73 percent ofthe project base costs. The project involves the periodic maintenance of300 kilometers of roads over a six-year period. US$1.5 million is alsoprovided for traffic studies and traffic management measures. In Bamako,the proposed urban development component, which was appraised in June1985, makes provision for the rehabilitaion of 34 kilometers of roads andstreets and 10 kilometers of sidewalks, construction of 13 kilometers ofnew roads and improvement of 20 intersections, along with other trafficmanagement measures. Institutional strengthening and resource mobilizationcomponents focused on the local authority are also included. A strongurban transport component is also proposed for a project in Douala.
- 22 -
4. These projects, together with the Abidjan experience, form animportant beginning in tackling the urban transport problems of theregion. They are located in four of the regions ten largest cities (seeTable 2). Future projects should concentrate on continuing involvement inthese cities and also attempt to tackle the urban transport problems ofthe largest cities whith populations in excess of 500,000. Because of theBank's well-established dialogue in Senegal and Nigeria, obvious short-runcandidates for future urban transport lending are Dakar, Lagos, Ibadan,and Kano. Given the size and backlog of needs, Nigeria is by far the mostimportant country for potential involvement in the urban transport sector.Involvement in other countries should also be considered where there is apositive interest in tackling urban transport issues.
Institutional Targets
5. The most important objective in any urban transport component shouldbe institutional strengthening aimed at:
(a) developing a local capacity to plan, manage, and maintainurban road networks; and
(b) developing and implementing urban transport policies at anational level. 1/
Ideally, the strengthening of local authorities in transport planning,traffic management and road maintenance should be carried out in parallelwith the strengthening of central government agencies responsible forurban transport policies and regulations. However, in most West Africancountries local authorities are extremely weak, and it may be moreexpedient initially, to focus institutional strengthening in centralgoverment agencies. If this course of action is taken it should be clearlyunderstood that the long-term goal should be to transfer responsibilitiesfor traffic management and road maintenance to the local authorities assoon as they have the manpower and financial resouces to successfullyundertake these tasks.
6. The main reason for the involvement of central government agencies intraffic management and transportation planning is to define nationalstandards and make policy decisions that cannot be made at the municipallevel. They also have a role in training and disseminating informationabout these topics and helping local authorities set up traffic managementunits. Once the new techniques have been assimilated and disseminated,then strengthening at the municipal level can take place--providingfinancial resources are available for the establishment of a trafficmanagement unit.
7. Very often road maintenance units are well established in themunicipalities, although they may not be very effective or efficient.Strengthening these units, or the central government agency responsiblefor urban road maintenance, should be an essential component of almost allurban transport project components in West Africa.
1/ Richard Barrett, Institution Building for Traffic Management, WorldBank Technical Paper No. 8, Washington D.C., 1982.
- 23 -
8. Strengthening central governments' capabilities in the area of policydevelopment and implementation is also essential. This will require at
least one high-level advisor in a key government ministry (normally publicworks or transport) that is primarily responsible for investment in the
urban transport sector and for decisions concerning the role and
regulation of private transport operators. Strengthening of road safety
organizations should also be considered.
Involvement of the World Bank
9. The Bank's experience to date in the urban transport sector is thatwell-designed projects, that emphasize insititution building, trafficmanagement, and road maintenance can play a major role in improving the
economic efficiency of cities by making significant reductions in vehicle
operating costs and time savings. Because the costs of such measures are
relatively small and the improvements in speeds are relatively large, the
economic rates of return are very high--amongst the highest of all urban
projects.
10. There are nine areas in which the World Bank can assist countries in
West Africa with urban transportation:
(a) policy guidelines;
(b) resource mobilization;
(c) project planning and evaluation;
(d) training;
(e) road maintenance;
(f) traffic management;
(g) public transportation;
(h) road construction; and
(i) road safety.
Policy Guidelines
11. The most important activities that the World Bank can perform in the
urban transport sector for the region are: (a) to assist governments to
identify key urban transport issues; (b) to suggest policy guidelines to
resolve these issues; and (c) to provide loans to implement institutional
development and urban transport improvement programs. The identification
of issues and suggestions regarding policy guidelines are best carried out
as part of the Bank's sector work. They could also be undertaken during
project preparation activities. The main issues for the urban transportsector, which have been identified as part of this report are listed
below. The majority of these issues were encountered in all countries.
(a) reducing the role of government in the direct provision ofpublic transport services;
- 24 -
(b) resource mobilization;
(c) energy pricing;
(d) energy conservation;
(e) investing in road maintenance;
(f) the role of traffic management versus road construction;
(g) improving police enforcement; and
(h) improving road safety.
12. All of these issues are extremely important to the efficientoperation of the urban transport sector, and several of them have animportant bearing on the national economy. The ideal situation as far asmost countries in the region are concerned would be for governments toencourage the private sector to provide public transportation services,and for the governments themselves to concentrate on regulation of thesector, and planning and improving the road network. Evidence from aroundthe world suggests that privately owned bus services are likely to costless per unit of output than publicly owned services and generally provideas good, if not better, level of service. 1/ Experience from West Africasupports this statement.
13. One of the most important roles government can play is to develop arational fares policy that allows operators to develop their business butalso keeps fares affordable to low-income users. Without this "guarantee"of profits, the private sector will divert its resources into otherventures, leaving the government to provide subsidized public transportservices. Government-owned bus companies would also benefit from such apolicy. In Dakar and Abidjan the agreements (contract-plan) forged betweenthe government and the main public operator during the past five yearshave enabled the bus companies to improve their financial and operationalperformance. A provision for annual fare revisons was a major part ofthese contract-plan agreements.
14. Another vital role of governments is the mobilization of financialresources to ensure that the road network is adequately maintained andthat transport needs are met by expanding the network to cater forincreasing demands. Most governments in the region could significantlyincrease the resources available to the transport sector by;
(a) eliminating fuel subsidies;
(b) introducing higher fuel taxes;
(c) increasing motor vehicle import duties and taxes (especiallyfor high-engine-capacity private cars and trucks); and
1/ Urban Transport, A World Bank Policy Study, Washington D.C., 1986.
- 25 -
(d) introducing parking levies.
15. The objective of such actions should be to make road users pay thetrue costs of transport, as well as creating revenue to maintain andexpand the road network. Since transport sector costs are almost entirelyin foreign exchange, any efforts that are made to increase fuel efficiencyand decrease costs will have a positive impact on the national economy.Decisions on vehicle taxes and duties should recognize the need to promoteefficiency and take account of the valuable contribution of publictransport in this respect. Keeping bus duties and taxes low should enableoperators to keep fares low.
16. One of the principal reasons for the poor state of urban roads in theregion is the low level of expenditure accorded to maintenance. Asignificant increase in road maintenance expenditures is a major need inall countries of the region. Convincing governments to plow scarceresources into maintenance rather than prestigous new projects is adifficult task that can only be achieved if civil servants are able topresent strong technical arguments. Charging higher taxes and duties forvehicles is a first step in making the required resources available.
17. Where governments do have significant urban road constructionprograms, it is often relatively easy to find ways of making savingsthrough greater use of traffic management measures, construction staging,and reductions in design standards. As a general rule, governments tendtowards the construction of prestigious projects even though lower costalternatives could be found. The main reasons for the dearth of trafficmanagement measures in the region are a lack of understanding and designcapability. Experience from elsewhere shows that once governments haveseen the impact that traffic management can have, they are very keen to domore. Effective traffic management requires strong enforcement of trafficregulations and bylaws. A well-equipped traffic police force is thereforea necessary prerequisite for an efficient traffic system. Particularattention should be given to the control of parking in the principalbusiness districts.
18. The cost of road accidents can represent between 1 and 2 percent of acountry's GDP and can involve replacing or repairing up to 15 percent ofthe vehicle fleet each year. A large proportion of this cost is borne bythe foreign exchange reserves for purchasing replacement vehicles, spareparts, and drugs and medicines to treat accident victims. This cost canonly be reduced by giving emphasis to road safety and accident prevention.The establishment of a road safety organization responsible for education,training, publicity, and research is a prerequisite to reducing accidentrates. Securing adequate funding for such an organization is alsoimperative.
Planning and Project Evaluation
19. Because of scarce technical resources, investment decisions aresometimes made for purely political reasons or without adequate evaluationof alternatives. Strengthening the capabilities of government agencies toprepare plans and evaluate projects is a necessary and important step tothe more efficient use of scarce resources. Of particular importance inrapidly expanding urban communities is to plan to provide jobs close to
- 26 -
housing areas or provide adequate transport linkages between housing andjobs. Unfortunately, the new urban dwellers are often located in housingareas on the periphery of the urban area, several kilometers fromemployment centers. These are the people who are least able to affordtransport costs.
Training
20. The Bank could also perform a very useful role by establishingtraining programs for government and municipal officials involved in theurban transport sector. Training programs for engineers, planners, andeconomists should form an important part of project activities. This canbe best achieved in the short-term through technical assistance contracts.In the long-term, the solution lies in setting up permanent courses inlocal teaching establishments. A fundamental prerequisite to the adoptionof such programs is the undertaking of a training needs assessment studyand a review of in-country training opportunities.
21. An attempt was made as part of the Second Urban Development Projectin the Cote d'Ivoire to set up a transport planning and trafficengineering course as part of a university civil engineering program.Unfortunately, the start of this course has been delayed. Similar courseshave been set up with some measure of success in Costa Rica and Indonesia.The possibility of establishing regional training centers on urbantransport related subjects should also be considered.
Road Maintenance
22. The establishment of guod road maintenance practices is the firstessential step in improving urban transport efficiency. There is littlepoint in implementing traffic management programs designed to increasetravel speeds if poor road surface conditions and inadequate drainage areallowed to slow down traffic. The Bank's role in this area should be topromote good road maintenance by establishing strong road maintenanceunits and to assist municipalities to increase revenues to pay for theincreased road maintenance activities. Without this complimentary activityin the area of revenue generation, the physical and institutionalimprovements stand little chance of being sustained after the completionof a project.
Traffic Management
23. Once good road maintenance practices have been established, theoperational efficiency of the road network can be improved through the useof traffic management measures and stronger enforcement. The Bank's rolein this area should be either to strengthen or help establish an agencyresponsible for the day-to-today management of the road network--includingthe maintenance of traffic signals, signs, and road markings--and toassist this agency to implement comprehensive traffic and transportimprovement schemes. Priority should be given to schemes that: (a) assistthe most efficient transport modes (buses and para-transit vehicles); (b)reduce delays in the most congested areas; and (c) improve traffic safety,particularly for pedestrians. Such an approach generally leads toproposals for: (a) areawide improvement schemes in the central businessdistrict and around the principal market areas; (b) corridor improvements
- 27 -
along important traffic arteries; and (c) improvements to isolatedintersections that are either congested or have very bad accident records.The Bank should also assist the police to improve enforcement methods andaccident prevention through technical assistance, training, and equipmentcomponents.
Public Transportation
24. The Bank's traditional role as far as public transportation isconcerned is to improve the operations and management of large buscompanies. This generally is achieved through the financing of accessroads into low-income areas, busways and bus lanes, bus stops depots andterminals, and technical assistance to the bus companies. The Bank rarelyassists with the financing of vehicles, since this can usually be achievedmore readily by the large public bus companies through well-establishedcommercial agencies or bilateral credit agreements. Finance is not soreadily available for private bus operators. This is an area where theBank can potentially play a new role by organizing local credit facilitiesfor individuals to purchase and operate public transport vehicles. Ascheme of this nature was proposed as part of a project in Kenya, but dueto a lack of counterpart funding the project never materialized.Consideration should be given to introducing such components into WestAfrica, where there is a need.
Road Construction
25. All proposals for Bank assistance to construct urban roads should beexamined very carefully and low-cost alternatives should be evaluatedthoroughly. These components present the greatest opportunities forwasting resources through poor analysis of future traffic volumes andinappropriate design standards. Generally speaking, highly capital-intensive urban road components should only be included for financing ifthey offer a significant overall improvement in the performance of theroad network (as in the case of a missing link), carry heavy volumes ofpublic transport vehicles, or perform a vital economic function, such asproviding access to a port. They should also satisfy the Bank's standardeconomic evaluation criteria.
Road Safety
26. The Bank's role to date in the field of road safety has been mainlylimited to the financing of traffic management schemes aimed atsegregating traffic and pedestrians and remedial treatments at accidentblackspots. Such measures have been introduced to good effect in Abidjan,and a detailed road safety study has been financed by the Bank in the Coted'Ivoire. As a result, road safety training programs and equip-ment arebeing financed under the Ivory Coast Third Urban Project. There appears tobe considerable scope for interventions of this kind throughout allcountries of the region.
Project Benefits
27. The Bank's experience in the urban sector has shown that urbantransport components consistently provide some of the highest rates ofreturn (in the range 25-75 percent) and that urban transport projects have
- 28 -
a city-wide impact, bringing direct benefits to major sections of thecommunity. Very often the highest rates of return come from the highimpact, low-cost traffic management improvements. One-way systems andintersection improvements combined with pedestrian, street signing, androad-marking programs often achieve rates of return in excess of 50percent. Road maintenance also provides a high rate of return. Becausethe main focus of urban transport projects is the overall improvement ofthe transport system, in particular public transport operations, thenumber of persons receiving benefits from the project is very large--manyof the beneficiaries coming from the lower-income groups.
28. The principal impact of transport components is in the areas of lowervehicle operating costs and reduced travel times. Operating costs can bereduced from anywhere between 15 and 40 percent, and travel times can beimproved by between 10 and 25 percent. These savings provide considerablebenefits for passengers and freight operations. Proper road maintenanceand good traffic management also reduces the risk of traffic accidents.
29. Reducing vehicle operating costs and delays not only provides directeconomic benefits but can also engender foreign exchange savings. Thecosts of gasoline, lubricants, vehicles, and spare parts have a foreignexchange content of almost 100 percent. Any savings that can be made byreducing wear and tear on vehicles, fuel consumption, and accidents willtherefore have a direct bearing on the economy and the utilization ofscarce foreign exchange reserves.
- 29 -
ANNEX: COUNTRY AND CITY PROFILES
Country City Page
Cameroon Yaounde and Douala 31
Ghana Accra 46
Cote d'Ivoire Abidjan 56
Liberia Monrovia 67
Mali Bamako 76
Nigeria Lagos and Other Cities 87
Senegal Dakar 103
Sierra Leone Freetown 112
- 30 -
Currency Equivalents
Country Currency and Exchange Rate Date
Cameroon F.CFA 470 - US$ 1 May 1985Ghana Cedis 50 - US$ 1 May 1985Cote d'Ivoire F.CFA 480 - US$ 1 June 1985Liberia $1 - US$ 1 May 1985Mali F.CFA 475 - US$ I May 1985Nigeria Naira 3.0 - US$ 1 February 1987Senegal F.CFA 280 - US$ 1 February 1987Sierra Leone Leone 6.0 - US$ 1 May 1985
- 31 -
URBAN TRANSPORT SITUATION IN CAMEROON: YAOUNDE AND DOUALA
SUMMARY
Urban Transport Overview
1. The most urgent need of the municipalities of Douala and Yaounde is todevelop technically competent agencies responsible for all aspects of urbanmaintenance and management. This can only be achieved if the municipalitiesare able to attract qualified engineers, provide necessary equipment, anddeliver sufficient funds to cover the maintenance needs. There is also anurgent need to carry out a comprehensive transport improvement programinvolving traffic management, road and footway maintenance, the rehab-ilitation of the secondary and local road networks, and the construction ofmissing links. Improved coordination between the technical servicesdepartments of the municipalities, the traffic police and the publictransport operator is an essential prerequisite to improving the trafficsituation.
2. At the national level, there is an urgent need to develop an urbantransport policy where more emphasis is given to maintaining and managing theexisting transport networks than to seeking to resolve problems through theconstruction of new roads. Such an approach will require significant trainingin traffic management and road maintenance and the adoption of nationalstandards for signs, traffic signals, and road markings. While it wouldappear that the the responsibility for such actions should lie with theMinistry of Transport, at the present time it is the Ministry of Planning andHousing which is taking the lead in this area. It is clear that formulationof urban transport policy should involve several ministries as well as theNational Police and that a national level coordination or consultativecommittee should be formed to assist in the formulation and implementation ofpolicy.
Needs and Issues
3. There are six main issues that need to be addressed by the governmentand the municipalities:
(a) Road Network Improvements. Compared to other cities inthe region, Douala has a low ratio of road kilometersper inhabitant. There are also major discontinuities inthe road network and capacity bottlenecks caused bynarrow roads. Several major roads are also in need ofrehabilitation. Conditions in Yaounde are less severe.
(b) Road Maintenance. The effective strengthening of theroad maintenance section of the Municipality of Doualais an urgent and important need. At present thematerial, equipment, and manpower resources are notadequate to effectively carry out routine maintenance.The program of rehabilitation and surfacing of thesecondary road system should be considered an urgentpriority as should the construction of missing links in
CAMEROON - 32 -
(c) Traffic Management. A comprehensive program of traffic managementand safety covering the central areas and principal trafficarteries should be undertaken in Douala and Yaounde. The programshould include traffic signals and geometric improvements to 20-to-30 intersections, one-way streets, pedestrian facilities,remedial measures at accident black spots, the provision ofparking, and improvements to assist buses. The need for suchimprovements is greater and more urgent in Douala than in Yaounde.
(d) Traffic Enforcement. Improved performance of the national policein the area of traffic enforcement should be regarded as a majorneed and should be carried out at the same time as any trafficimprovement program. Without complementary actions in this sphere,the value of the traffic improvements will be seriouslyprejudiced. A program of management training to improve efficiencyin the fields of traffic enforcement and accident preventionshould be undertaken in Douala and Yaounde.
(e) Institutional Strengthening. One of the principal constraints toGovernment action is the limited technical expertise available inthe transport sector. Any program for the improvement of roadmaintenance, traffic management, or traffic enforcement will needto rely heavily on inputs from experts in the private sector--both local and foreign. The establishment of training programs forlocal staff is also a major need. There is also a need to developlocal responsibilities in the field of transport, initiallythrough improved coordination between the municipal and nationallevels of government.
(f) Municipal Finance. The second major constraint at the municipallevel is the lack of finance to carry out maintenance andimprovement works. This situation could be significantly improvedwith better revenue collection and increased taxes. In thetransport sector, the introduction of parking charges is anobvious candidate for additional revenues. The introduction andenforcement of parking controls would also have a positive impacton the traffic situation.
Bank Role and Strategy
4. Bank involvement in the urban transport sector in Cameroon shouldinitially focus on improving the urban transport situation in Douala, whereconditions are the most serious. The improvements should not only address thephysical requirements of the city in terms of traffic management, improvedpublic transport performance, and road maintenance, but also theinstitutional needs of the city and the national agencies involved in theurban transport sector including: (a) strengthening the Municipal RoadMaintenance Unit; (b) developing expertise in traffic management, trafficcontrol, and enforcement at the national level (which could eventually beapplied to other cities); (c) developing national standards for trafficengineering; and (d) promoting local training programs in traffic management,enforcement, and road maintenance.
- 33 - CAMEROON
I. NATIONAL PERSPECTIVE
Urbanization
5. Cameroon is located in the southern part of the West Africa region onthe Atlantic Coast. It is bordered by Nigeria to the north and west, Chad andthe Central African Republic to the east, and the Congo, Gabon, andEquatorial Guinea to the south. The country covers an area of 475,000 squarekilometers and had a population of 9.26 million in 1982. The populationgrowth rate between 1973 and 1982 was 3.1 percent. The populations anddensities of each province are given in Table I.1. The provinces with thehighest densities are all located in the western part of the country.
6. The urban and rural population forecasts for 1986 and 2001 are shown inTable I.2. The proportion of urban population is expected to increase from 37percent in 1986 to 52 percent by the year 2001. Douala and Yaounde, withpopulations of 842,000 and 648,000 respectively in 1986, together accountedfor 42 percent of the total urban population, or 15 percent of the nationalpopulation. Both these cities have been growing at an annual rate of 6-8percent per annum over the last decade. Three other towns have populations inexcess of 100,000.
The Transport Sector
Road Network
7. Camerooon's classified road network totalled 31,700 kilometers in 1983,of which 2,800 kilometers (8.8 percent) were paved. In addition there are31,000 kilometers of non-classified roads. Road density averages 13.8kilometers per 100 square kilometers. Table I.3 presents a breakdown of roadlengths by type and province in 1983.
Vehicle Fleet
8. The official estimates of the national vehicle fleet are shown in TableI.4. The fleet grew at a rate of about 6 percent per year over the period1979 to 1983. The level of motorization in 1983 was 8.6 vehicles per 1000population or 5.6 cars (including taxis) per 1000. The highest rate ofincrease (23 percent per year) was for motorcycles which grew from 22,400 in1979 to 51,300 in 1983.
Urban Vehicle Usage
9. Since 1981 Cameroon has gradually become self-sufficient in fuelsupply. The proportion of imports (in monetary terms) devoted to fuelpurchase fell from 14.8 percent in 1981 to 1.4 percent in 1983. Fuelconsumption over the period 1981-83 (see Table I.5) rose by an average of 5percent per year. At the same time prices rose by about 6 percent per year. Abreakdown of fuel consumption, vehicle fleet, and level of motorization byprovince is given in Table I.6. Approximately 62 percent of fuel was consumedin the provinces of Littoral, Centre, and Sud. Three-fourths of all vehicles
CAMOERON - 34 -
Table I.1 Population and Density by Province in 1983
Distributiona Area Distribution DensityProvince Population Percent sq.km. Percent pop/sq.km.
Centre + 1,789,000 19.6 118,000 24.8 15.2Sud
Est 419,000 4.6 111,000 23.4 3.8
Littoral 1,218,000 13.3 20,500 4.3 59.4
Adamaoua + 2,628,000 28.7 165,000 34.7 15.9Extreme Nord +Nord
Nord-Ouest 1,149,000 12.6 18,000 3.8 63.8
Ouest 1,210,000 13.2 14,500 3.1 83.4
Sud-Ouest 732,000 8.0 28,000 5.9 26.1
Total 9,145,000 100.0 475,000 100.019.3
Source: Ministry of Equipment
are registered in these provinces. They also accommodate one third of thepopulation and have the highest levels of motorization. Thirty-four percentof the classified road network is located in these provinces. The largestcity, Douala, is located in the Littoral and the second largest city,Yaounde, is located in the Centre. Douala contains 2 percent of the nationalroad network but has 43 percent of the national fleet - Yaounde contains 1.5percent of the national road network and has 39 percent of the vehicle fleet.
Road Accidents
10. The number of recorded road accidents in Cameroon during the period1977-82 is shown in Table I.7. The number of fatalities per 100,000 personsin 1980 was about 8.0, and the number of fatalities per 10,000 vehicles wasabout 101. The number of casualties per 10,000 vehicles was 1,135. Seventy-five to eighty percent of all accidents over the period 1977 to 1980 occurredin urban areas. Statistics for 1982-84 in Douala and 1978-79 in Yaounde arepresented in Table I.8. The number of fatalities per 10,000 vehicles was 20in Yaounde and 62 in Douala. Approximately 75 percent of all accidents inCameroon occur in Douala and Yaounde.
- 35 - CAMEROON
Table I.2 Population Estimates for the Principal Urban Settlements
1986 2001Urban Population Percent Percent Population Percent PercentArea (thousands) Urban Total (thousands) Urban Total
11. The total duties on private cars and vehicles with less than 12horsepower is 72 percent, for larger vehicles it is 80 percent. The dutiespayable on trucks and buses varies between 39 and 66 percent.
12. Motor vehicle license fees vary according to engine power up to 24horsepower. Over 24 horsepower is a fixed fee. The tax payable is halved forvehicles between six and eight years old. Vehicles over eight years old donot pay the horsepower tax. Private cars are taxed at twice the rate of othervehicles. Typical values for cars, light trucks, and small buses are F.CFA16,800, 10,800 and 11,800 respectively.
13. The tax payable on the various grades of gasoline are as follows:premium grade gasoline, 30 percent, regular gasoline, 27 percent, and diesel17 percent. The pump price was increased in July 1984 to F.CFA 174 per liter(US$1.40 per gallon) for premium grade, F.CFA 163 per liter (US$1.31 pergallon) for regular and F.CFA 139 per liter (US$1.12 per gallon) for diesel.These prices are well below international levels.
CAMEROON - 36 -
Table I.3 National Road Network by Type of Road and Province in 1983
Provin- Depart- Total Per- DensityProvince National cial mental Rural (km) cent (km/lOOsqkm)
Notes: There are 31,100 kilometers of unclassified roads. There are 2,800kilometers of surfaced roads - 2,190 kilometers national, 100 kilometersprovincial, 130 kilometers department, 30 kilometers rural and 350 kilometersurban roads.
Source: Ministry of Equipment
Table I.4 Vehicle Fleet in Cameroon 1979 - 1983
Car Light Special 1/Year Taxi Goods Bus Truck Vehicles Total
Number of 10,553 12,500 12,020 11,933 5,855 / 4,006 yAccidents
Percent 74% 76% 74% 80%Urban
Fatalities 696 780 765 671 781 752 y
Percent 28% 20% 23% 23%Urban
Injuries 6,450 8,091 8,000 6,820 6,671
Percent 40% 37% 29% 42%Urban
1/ Inexplicable reduction in urban accidents - probably due toadministrative or statistical error.
,4/ Only rural accidents.
Source: Ministry of Transport
Table I.8 Traffic Accidents in Douala and Yaounde
Yaounde Douala1978 1979 1982 1983 1984
Fatal Accidents 53 44 201 110 91
Serious Injuries 538 689 8441,028 1,007 /
Slight Injuries 1,041 834 904
Damage 3,123 3,200 2,977 2,430 2,977
Total 44204 4,251 4,757 4,063 4,816
1/ Serious and slight not differentiated in Yaounde
Source: National Police.
- 39 - CAMEROON
The Economy
14. Even before the start of petroleum production in 1978, the Camerooneconomy had been one of the strongest in West Africa. This strength came froma vigorous agricultural sector, which produces sufficient food to feed thecountry's population. In addition to petroleum, the country possesses gas andforestry and timber reserves that have not yet been fully exploited. Theboost given by the oil revenues has now placed the country in a uniquedevelopment situation. A major handicap is the limited capacity of theadministration at both the central and local government levels to implementprojects. GNP per capita in 1982 was US$ 880.
CAMEROON - 40 -
II. LOCAL PERSPECTIVE
City Form and Constraints
15. The two principal cities in Cameroon are Douala, the principal port andthe chief commercial and industrial center of the country, and Yaounde, theadministrative center and the capital. These two cities, which account for 42percent of the urban population, are growing at about 5 percent per year. Bythe year 2000, half the country's population will live in urban areas andhalf of these will live in Douala or Yaounde.
16. Douala is located on the estuary of the Wouri river, about 20kilometers. from the sea. Approximately 90 percent of the population islocated on the east bank of the river. The two banks are linked by aroad/rail bridge. The urbanized area covers about 86 square kilometers withan average population density of 10,000 persons per square kilometer, varyingfrom 7,800 in the center to about 17,000 - 22,000 in the low-income suburbs.As well as being the principal port, Douala is the center of air communic-ations for the country. About 75 percent of industrial production isconcentrated in Douala.
17. Yaounde is located in the interior of the country approximately 300kilometers from the coast. The city is situated in a hilly region with thecentral area being located at the convergence of 11 valleys. In 1979 theurbanized area covered 53 square kilometers with an average density of 7,600persons per square kilometer, varying from 1,600 in the central andadministrative area to about 24,000 in the low-income suburbs. AlthoughYaounde is the seat of government, in economic and commercial terms it isvery much regarded as the "second" city of Cameroon.
Transport Demand
18. The population of Douala grew from 476,000 in 1976 (date of the lastnational census) to an estimated 800,000 in 1985 at an annual growth rate ofabout 6 percent. The population is expected to continue to rise at a slightlylower rate over the next decade, reaching about 2 million by 2001. Themajority of this growth will take place on the left bank.
19. The population of Yaounde grew from 314,000 in 1976 to an estimated580,000 in 1985 at an annual growth rate of about 8 percent. The populationis expected to rise at a slightly lower rate over the next decade reachingabout 1.7 million by 2001.
20. The estimated passenger vehicle fleet operating in Douala in 1982 and inYaounde in 1980 is given in Table II.1. The level of motorization in Doualawas 48 vehicles per 1000 population and 59 in Yaounde. The proportion of thenational vehicle fleet in each city was estimated to be 43 percent in Doualaand 39 percent in Yaounde.
21. Household interviews carried out in Douala in 1982 showed that thenumber of daily trips was 880,000, of which 37 percent were on foot and 63percent were by motorized modes (trip rate of 0.82 for motorized modes).Interviews carried out in Yaounde in 1980 gave figures of 990,000 daily
- 41 - CAMEROON
Table I1.1 Vehicle Fleet Operating in Douala and Yaounde
trips, of which 56 percent were on foot and 44 percent were by motorizedmodes (trip rate of 0.98 for motorized modes). The breakdown of daily tripsby mode in the two cities is given in Table II.2. The proportion of trips bybus is relatively low in both cities, particularly in Yaounde where thenumber of buses per inhabitant is very low. There are a significant numberof trips by motorcycle in Douala whereas there are very few in Yaounde. Thisis due to the difficult topographic conditions existing in Yaounde. In 1982it was estimated from home interview surveys that there were some 27,000motorcycles and 12,000 bicycles in Douala. Journeys to and from workaccounted for the majority of trips--42 percent of daily trips in Yaounde and37 percent of daily trips in Douala.
Public Transport
22. Two forms of public transport are available in Douala and Yaounde--busservices provided by SOTUC and taxis. SOTUC is a public enterprise; 65percent of its shares are held by the government and 35 percent by RenaultVehicle Industries. The headquarters of the company are based in Yaounde.SOTUC is responsible to the Ministry of Transport, which sets fares. Thepresent level of fares is F.CFA 60 for journeys from one end of a route tothe other, and F.CFA 50 for all other journeys. Prior to January 1983 thefares were F.CFA 50 and F.CFA 35. They were then increased to F.CFA 60 andF.CFA 45 until January 1985, when the present fares were introduced. Taxifares were raised to F.CFA 100 in 1984. Most taxis are owned by individualsand rented out to drivers, who must provide a guaranteed return to the owner.In general, the driver pays the fuel costs and the owner pays formaintenance. Informal transport modes such as pick-ups and minibuses operatefrom the city limits to the surrounding towns and villages. The principalproblems of the public transport operators are in order of importance; (a)the lack of road maintenance on the main roads; (b) poor access into thelow-income areas; (c) traffic congestion caused by poor traffic management;and (d) a lack of enforcement of traffic regulations. All public transportvehicles are required to pass a quarterly road fitness test administered bythe Ministry of Transport.
23. Buses. SOTUC was created in 1973 to provide public transport servicesin the major cities of Cameroon. At present the only services provided are inDouala and Yaounde. The company has a guaranteed monopoly on urban transportservices for 25 years. SOTUC currently operates 197 buses in Douala and 115in Yaounde. All buses are Renault S105's with seating for 27 and a totalcapacity of 100. The two networks are run independently, with the headoffice providing overall management and financial control. There are 14routes in Douala covering 125 kilometers and 9 routes in Yaounde covering 104kilometers. The average turn out is about 95 percent. The average number ofpassengers per bus per day is 1,650 in Douala and 1,750 in Yaounde. Thenumber of employees per bus is 5.3 in Douala and 5.6 in Yaounde. The numberof persons per bus is about 4,100 in Douala and 5,000 in Yaounde. Thesefigures are very high and account for the relatively low proportion of modalsplit attributable to buses and the high proportion for taxis. SOTUC has madeconsiderable progress in reducing this rate and intends to reduce it further.
- 43 - CAMEROON
24. On the financial side, SOTUC has been regularly receiving an operatingsubsidy from the government. The amount of subsidy has grown from F.CFA 523million in 1980/81 to F.CFA 1,418 million in 1983/84. Part of the reason forthe subsidies is the cost incurred in increasing the fleet from approximately150 vehicles in 1980 to approximately 310 in 1985--an annual average increaseof about 20 percent.
25. Taxis. Taxis are unmetered and normally operate on the shared rideprincipal. In 1985 there were about 3,500 to 4,000 taxis operating in Doualaand 2,500 taxis in Yaounde. Taxi drivers are required to pay about F.CFA6,000 to F.CFA 8,000 per day to the owners. Additional revenues are kept bythe driver to cover fuel costs and provide his income. The number ofpassenger trips per day is on the order of 120-to-150, depending on thenumber of hours worked by the driver.
Road Network
26. There are approximately 680 kilometers of roads in Douala, of which 152kilometers are surfaced. A major road improvement program is currentlyunderway to improve the very poor secondary road system and improve access. Amajor effort is also required to improve drainage. In Yaounde there areapproximately 540 kilometers of roads, of which 280 kilometers are surfaced--a much higher ratio of surfaced road per capita than Douala (There are 1.9kilometers of surfaced road per 10,000 inhabitants in Douala compared to 4.8kilometers per 10,000 inhabitants in Yaounde). Footways in the centre ofYaounde are in an extremely poor state of repair. The condition of thesurfaced roads in both cities is generally quite good. Where there are potholes they often remain unrepaired for several months. Almost all unsurfacedroads are in a poor state of repair. There is an absence of structure to theroad networks, characterised by an inadequate primary road network andsecondary road network that has missing links and a lack of surfaced roads.This lack of structure is particularly evident in Douala.
27. Traffic Conditions. The problem of traffic congestion in Douala andYaounde is concentrated in the central areas and at key intersections on theprincipal road network. Certain streets and areas that serve as markets arealso congested, the most important one being the Lagos market in Douala.Peak traffic conditions are concentrated around four times of the day--07:30, 12:00, 14:30 and 18:00. The highest peaks occur in the morning(07:30) and afternoon (14:30). One of the potentially greatest congestionblackspots is the bridge across the Wouri river in Douala. This three-lanebridge 1,830 meters long, is nearing saturation and will need expanding orreplacing within a few years. Some short-term improvement may be possible bymaking the centre lane reversible and controlling traffic on the approaches.However, the long-term solution will require significant investment in newinfrastructure.
CAMEROON - 44 -
Traffic Management
28. Traffic management in both Douala and Yaounde is relatively poor. Thereare a total of approximately 30 sets of traffic signals in Douala andYaounde. Maintenance in both cities is carried out through subcontracts withprivate firms. Long delays occur when a new part is required since there areseveral makes of signals in use and no stocks are kept in Cameroon.Consequently about one-third to a one-half of the signals are not working orare operating in a defective manner. Additional signals are required in bothcities and many of the existing signals should be replaced. Road markings arealmost completely absent in Douala and are in relatively poor condition inYaounde. There are insufficient traffic signs in both cities, and theexisting signs are poorly maintained. Very little use is made of one-waystreets. An additional problem are the several roundabouts in Yaounde, whichtend to lock up at peak hours due to the give-way-to-the-right rule. Thisgives priority to traffic approaching the roundabout rather than traffic onthe roundabout. There are very few facilities for buses except occasional buslaybys. Bus flows on several streets in Douala and in the center of Yaoundeexceed 50 buses per hour. A major program of improvements to provide busshelters and other passenger facilities is planned by SOTUC.
29. Parking regulations in both cities are very poorly enforced, resultingin severe traffic congestion in the central areas during peak hours. Bothcities are in urgent need of a comprehensive traffic improvement program.Work on such a program has begun in Douala as part of the preparation of aWorld Bank Urban Development Project that would concentrate on transport anddrainage. Plans for a traffic improvement program in Yaounde are currentlyunder discussion.
Responsibilities
30. The principal agencies involved in urban transport at the national levelare the Ministry of Planning and Housing, the Ministry of Transport, theMinistry of "Equipment" (major infrastructure), and the National Police. Theprincipal actor at the local level is the municipal authority.
31. Ministry of Planning and Housing. The involvement of this Ministryoccurs at the master planning stage and the programming of urbaninfrastructure needs. The Ministry is also responsible for the implementationof road and drainage infrastructure schemes.
32. Ministry of Transport. The Ministry of Transport is responsible for theorganization of the transport sector, including government policy on landtransport, the conception and enforcement of transport regulations, thepromotion and control of transport organizations, and all aspects of vehicleand road safety. The principal interventions of the ministry at the urbanlevel are in the licensing and regulation of public transport vehicles,vehicle inspection, and road safety.
33. Ministry of Equipment. The principal role of this ministry concerns thedevelopment and maintenance of the national road network. Within urban areas,the ministry is only responsible for the construction and maintenance ofnational roads.
- 45 - CAMEROON
34. National Police. The National Police are responsible through theirlocal police stations for the enforcement of traffic laws and regulationsgoverning the use of vehicles and traffic control. The Traffic PoliceDepartment in Douala has 121 officers and 4 motorcycles. A special departmentis concerned with the prevention of accidents and the compilation of accidentstatistics.
35. Municipality. The principal responsibilities of the municipality in thetransport sector are the maintenance of all roads except the national roadsand the construction of secondary and local roads. The local council has verylittle say in matters concerning the provision of bus and taxi services andsafety and enforcement. These are handled by the Ministry of Transport andthe National Police. Cooperation and coordination between the municipalityand the national agencies is severely lacking. The roads section of themunicipality is responsible for all road works, signs, traffic signals, andmarkings as well as road maintenance. In effect the municipalities mainlyconcentrate on building and rehabilitating roads and have undertaken verylittle maintenance or traffic management. The principal reasons for the poorperformance of the municipalities is a lack of technical expertise andfinance.
36. In Douala, the secondary road improvement program is contracted out toprivate firms and supervised by the municipality. For many years theMunicipality of Douala has been without engineers. The first engineer beganworking in the technical services department in 1984. There are now threeengineers, but due to administrative constraints it is very difficult to paythe same levels of salary as in the ministries or in the private sector.Until this problem is resolved it will be very difficult to attract the rightcalibre of person to make the municipality effective in the field ofinfrastructure construction and maintenance.
- 46 -
URBAN TRANSPORT SITUATION IN GHANA: ACCRA
SUMMARY
Urban Transport Overview
1. The principal problems of the urban transport sector in Accra at thecurrent time are the chronic lack of foreign exchange for vehicles, spareparts and tires, and the extremely poor quality of the paved road network.Additional problems include poor continuity of the main road network,inefficient use of road space, and poor performance of the two publicly ownedbus companies. Improvement of the sector is severely handicapped by a lack oftechnical expertise and financial resources. Some of these problems arebeginning to be tackled by the government through the use of World Bankfunds.
2. The impact of the lack of foreign exchange has been severe. It isestimated that in 1983 about 70 percent of Ghana's motor vehicle fleet wasoff the road awaiting spare parts or tires. About US$200 million would berequired to rehabilitate the entire fleet. The World Bank's ReconstructionImport Credit provided approximately 10 percent of this total and was mainlyused for the purchase of spare parts, batteries, and tires for the truckingindustry and public transport operators. This Bank assistance, together withthe government's rehabilitation program, has reversed the situation so thattraffic volumes are back to normal and rapidly increasing. The lack offoreign exchange has also had a devastating effect on road construction andmaintenance, which are foreign exchange intensive. An estimated US$300million is required to rehabilitate the road network. The World Bank's AccraDistrict Rehabilitation Project will provide approximately US$22 million, ofwhich about 75 percent will be spent on the road sector. A comprehensivetraffic improvement study will also be undertaken and low-cost trafficmanagement measures will be implemented.
Needs and Issues
3. The principal needs of the transport sector are for the government togive it a higher priority, since it is vital for economic recovery andexports. There is also an urgent need to develop and implement a policy toimprove the efficiency of the sector. This could be achieved by providingincentives for public transport operators, particularly the private sector,which currently carries about 80 percent of daily trips in Accra. Attentionshould also be given to improving the performance of the public bus companiesor converting these into private operations. Immediate increases in importduties and purchase taxes for private cars, coupled with the prohibition ofcars with large engine capacities should be considered along with increasesin fuel taxes. Significant savings in foreign exchange could be made throughwide-scale use of traffic management measures, by reducing congestion andvehicle operating costs, and reducing accidents.
- 47 - GHANA
C. Bank Role and Strategy
4. The World Bank has an important role to play in the rehabilitation ofthe urban transport sector in Ghana and particularly in the Accra region,where most of the country's industrial activities are located. The emphasisgiven in recent Bank projects to financing essential imports, tackling theproblems of road maintenance, and introducing traffic management is preciselywhat is required. The opportunity has been taken to influence governmentpolicy and provide training in the sector. This will be achieved through thethe proposed traffic management and improvement study, which will help createa Traffic Management Unit, provide training, and advise on policy matters.The proposed Technical Advisory Committee, which involves most of thenational agencies and the principal local agencies involved in the sector,will provide a useful forum for the review of policy matters.
GHANA - 48 -
I. NATIONAL PERSPECTIVE
Urbanization
5. Ghana is located on the West African Coast, between 5 and 10 degreesnorth of the equator. It is bordered by Cote d'Ivoire to the west, BurkinaFaso to the north, and Togo to the east. The country covers an area of238,477 square kilometers and had a population of 12.17 million in 1982. Thepopulation growth rate between 1973 and 1982 was 2.9 percent. The averagepopulation density was 51 persons per square kilometer.
6. In 1982 the urban population was about 4.4 million, representing 36percent of the national total. The urban sector has been growing at a rate of5.1 percent per annum and the urban population is expected to exceed 50percent of the total population by the turn of the century. The largest urbancenter is Greater Accra, with an estimated population of about 1.4 million.The city is expected to continue to expand at a rate of about 5 percent perannum reaching more than 2.8 million by the year 2000.
The Transport Sector
Road Network
7. Ghana's road network comprises some 27,369 kilometers of roads of which5,456 kilometers (20 percent) are paved. The road density averages 11.9kilometers per 100 square kilometers. Table I.1 presents a breakdown of roadlengths by category.
Table I.1 National Road Network by Type of Road (kilometers)
Trunk RoadsPaved Gravel Total Feeder Roads Total
5,456 7,753 13,209 14,160 27,369
Source: Ghana Highway Authority and Department of Feeder Roads
Vehicle Fleet
8. The official estimates of the vehicle fleet are based on the number ofactual licenses in 1970 updated by new registrations and assumptions aboutthe number of scrapped vehicles. The actual number of vehicles in circulationis not known. Table I.2 presents vehicle fleet estimates for 1970, 1980, and1983. The figures for 1970 are not directly comparable with those for the1980s since the vehicle categories are not the same. The figures given inthis table are in relatively close agreement with the figures available fromthe vehicle inspection centers shown in Table I.3. The national level ofmotorization in 1983 was about 5.6 vehicles per 1000 population or 3.9 cars(including taxis) per 1000 population.
- 49 - GHANA
Table I.2 Vehicle Fleet in Ghana in 1970, 1980, and 1983
Cars OtherYear Taxis Buses Trucks Vehicles Y/ Total
9. Because of the difficult economic situation between 1981 and 1983, fuelconsumption decreased by an average of 15 percent per year. As shown in TableI.4, until 1981 fuel consumption had been increasing steadily at about 3percent per annum. Figures from the Accra vehicle testing center in 1983indicate that about 50 percent of the national vehicle fleet was operating inthe Accra region.
Source: Ghana Supply Commission and Quarterly Digest of Statistics.
Road Accidents
10. In Accra in 1983 there were 2,272 accidents and 277 deaths involving3,181 vehicles; for 1984 the figures were 1,788 accidents, 234 deaths, and2,533 vehicles. The number of fatalities per 10,000 vehicles was 28. Thisrelatively low figure is possibly due to low travel speeds because of thepoor road surface conditions. About 10 percent of all vehicles are involvedin accidents each year.
Transport Costs
11. The import duties on all vehicles is 30 percent. The purchase tax onprivate cars is 10 percent. The prices of petroleum products were increasedfour times between the beginning of 1983 and the end of 1984. The pricesintroduced in September 1984 were, on average, 5-to-7 times greater than thepre-April 1983 prices. These increases were necessary because of a fall invalue of the currency and also to eliminate subsidies. Fuel prices have againbeen increased and currently (May 1985) stand at 75 cedis per gallon(US$1.50) for regular gasoline and 67 cedis per gallon (US$1.33) for diesel,well below current international price levels. There is no tax on fuel.Ghana now produces enough crude oil to provide for about 7 percent of itsneeds. The remainder is imported and refined domestically.
- 51 - GHANA
The Economy
12. Ghana once enjoyed a fairly high standard of living compared to otherWest African nations. However, due to gross mismanagement during the 1970s,the government incurred large budget deficits, which in turn led to a markedincrease in domestic inflation. Exports declined and imports were restricteddue to a lack of foreign exchange. This led to an erosion of the tax base,which forced the government to cut back on maintenance and capitalinvestment.
13. The impact of the economic decline on the transport sector has beendevastating since maintenance and operations are foreign exchange intensive.Road construction and maintenance are estimated to have a foreign exchangecontent of 75 percent and vehicle operating costs over 80 percent. The roadnetwork is in need of significant repair, and there is a shortage of operablevehicles. In 1983 it was estimated that about 70 percent of the nationalvehicle fleet was off the road because of a lack of spare parts and tires.
14. These problems are due almost entirely to Ghana's shortage of foreignexchange and the fact that past governments have not allocated sufficientfunds for spare parts. For example, motor distributors had requested US$580million during the period 1980-82 of which only US$18 million (3 percent) wasgranted.
GHANA - 52 -
II. LOCAL PERSPECTIVE
City Form and Constraints
15. Accra is located on the Atlantic Coast in the dry southeastern coastalplain. The Greater Accra region is made up of four districts - Accra, Tema,and two inland rural districts. Accra is the capital of Ghana as well as theprincipal commercial center and the seat of government. Accra District is thesecond most important industrial center after the neighbouring district ofTema. The Greater Accra Region covers 1,390 square kilometers giving anaverage population density of 1,010 persons per square kilometer. The mostpopulous area is Accra District, with a 1984 population of 965,000.
Transport Demand
16. The population of the Greater Accra Region is expected to grow at about5 percent per annum from 1.4 million in 1984 to more than 2.8 million by theturn of the century. The majority of this growth is expected to take place inlow-income suburbs on the periphery of Accra District.
17. The vehicle fleet operating in the Greater Accra Region (estimated fromvehicle inspection records) is about 36,000 vehicles, of which 21,100 (59percent) are cars, 6,180 (17 percent) are taxis, 4,420 (12 percent) are smallbuses, and 1,690 (5 percent) are large buses. There are also approximately2,140 trucks and about 750 motorcycles. At the present time, due toshortages of spare parts and tires, only a small proportion of the fleet isoperational. The level of motorization, assuming all vehicles are operable,is approximately 26 vehicles per 1000 population, or 19 cars and taxis per1000. Between 1979 and 1982 the number of 'rivate cars and trucks decreasedslightly, while public transport vehicle'7 increased significantly - cars andtrucks decreased by about 14 percent and 21 percent, respectively, and taxis,light buses, and heavy buses increased by 57 percent, 52 percent, and 38percent respectively.
Public Transport
18. There are several types of public transport service available in Accra:medium to large buses carrying 60 to 120 passengers, "Mammy Trucks" or "TroTros" carrying 35-to-45 passengers, minibuses carrying 20-to-40 passengers,and taxis. There are two government-backed public transport companies--Omnibus Service Authority and City Express. All other services are providedby private operators, who carry approximately 80 percent of daily trips. Busfares are set by the Ministry of Transport and Communications and the minimumfare for journeys under two miles is 3 cedis. In the past, principal problemsof both private and public operators were the availability of spare parts andthe poor condition of the roads leading to high operating costs. A recentReconstruction Import Credit facility provided by the World Bank hasassisted with the provision of tires, batteries, and spare parts for busesand trucks. The private operators union has expressed concern that they havenot been consulted about government purchases of the type of tires and sparesthat they need. This concern of the private operators should be taken into
- 53 - GHANA
account in any future program of this type. The question of road maintenanceis also being adressed by the World Bank in the Accra District Rehabilitationand Development Project.
19. Omnibus Service Authority. OSA operate bus services throughout Ghana.Out of a total of 44 buses, a maximum of only 38 percent are operational. Theaverage turn out is 24 percent. The vehicle fleet available in Accracomprises 44 large buses, of which an average of 10.5 are operated on a dailybasis (24 percent turnout). Each bus covers about 159 miles per day for arevenue of 69.93 cedis per mile. The average fare charged by OSA in Accra was6.5 cedis. The depot and workshop are large enough to handle well in excessof 100 buses and the staff are sufficient to operate at least 60 buses. Thecompany records are well kept. The principal problems facing OSA are: (a)revenue leakage; (b) theft of spares; (c) investment in new buses; and (d)lack of motivation. Recent quarterly accounts show a deteriorating financialsituation. During 1984, OSA losses were 13.5 million cedis (US$250,000).
20. City Express. City Express provide services exclusively in Accra buthas no depot, few maintenance facilities, and requires an operating subsidyfrom government. The possible amalgamation of OSA and City Express is underdiscussion.
21. Private Sector. In contrast to the public sector operations, theprivate sector is running various types of buses, apparently with areasonable level of profitability. The private sector operates 665 largebuses, 1,464 minibuses, and 1,545 mammy wagons (trucks converted to passengertransporters). Access to the market is open to all and any type of vehiclecan be used except buses with wooden bodywork. Routes are allocated by thePrivate Road Transport Union, which represent the private operators innegotiations with government and provides some degree of self-regulationwithin the industry. The Union also provides training and is anxious to setup a communal servicing facility for the use of which the union would collectfees.
22. The largest of the private operators is the King of Kings Bus Companywhich operates buses from the outskirts of Accra to the central businessdistrict. On average, 22 of the fleet of 30 buses are available (73 percentturnout). Each bus covers about 121 miles per day for a revenue of 41.69cedis per mile (US$0.83). The average fare is about 9 cedis (US$0.18). Someof the buses operated were obtained from OSA, which had discarded them asscrap. The company has a small workshop and buses are stored at the rear ofthe owner's private residence. King of Kings makes an annual profit of 1.28million cedis (US$ 24,000).
23. The difference in the financial performance of OSA and King of Kings isquite significant and mainly due to difference in staff overheads. OSAemploys 296 staff, giving an employee-to-operational-bus ratio of 28.2:1. Bycontrast King of Kings employs 121 staff giving an employee-to-operational-bus ratio of 5.5:1. Staff costs of OSA represent about 40 percent of revenue.
GHANA -54-
24. Taxis. All taxis are unmetered and usually operate on a shared ridebasis. There are two types of taxi in operation--small vehicles carryingthree-to-five passengers and larger cars that can take up to eightpassengers. It is estimated from vehicle inspection data that there were some3,260 taxis operating in Accra in 1984.
Road Network
25. There are approximately 940 kilometers of roads in Accra, of which 550kilometers (58 percent) are paved--approximately 9.8 kilometers of roads per10,000 inhabitants or 5.7 kilometers of paved road per 10,000 inhabitants. Asmall proportion of the paved roads (28 kilometers) form part of the nationalroad network. The remaining 522 kilometers are city arterials and localstreets. There are some significant discontinuities in the road network,particularly in the outer by-pass. The condition of much of the road networkis very poor. This is principally due to a lack of maintenance. The poorsurface conditions and missing network links cause extensive delays and veryhigh operating costs, especially for port traffic. Roads in many of the olderlow-income suburbs are in very poor condition, making it difficult for publictransport vehicles to adequately serve these areas. The Accra DistrictRehabilitation Project will tackle many of these problems by: (a) improvingand completing the Accra Motorway; (b) rehabilitating three other major roadsections; and (c) improving routine and periodic maintenance of road anddrainage networks.
Traffic Conditions
26. Traffic congestion in Accra is limited to certain locations and times ofthe day. Most of the delays are due to poor road surface conditions ratherthan design capacity. In the central area, street trading causes significantdelays for traffic and the safety of pedestrians in these areas is at risk.Travel speeds are generally low and cross-city bus trips involving twointerchanges can take up to 1.5 hours to travel about 10 kilometers. Many ofthese problems can be remedied by simple low-cost measures involving trafficmanagement, channelization, and junction treatments. The Accra DistrictRehabilitation Project will include provision for carrying out acomprehensive traffic study to: (a) formulate traffic management actions; (b)to set up a Traffic Management Unit; and (c) implement low cost trafficimprovement schemes.
Traffic Management
27. Traffic management is relatively poor and little used. There are ahandful of traffic signals, which are usually out of order. Traffic signs androad markings are scarce and are generally in poor condition. Very littleuse is made of one-way streets. Travel conditions for pedestrians are poor--footways are poorly maintained or absent, and there are no footbridges orsubways. No special provision is made for buses and other public transportvehicles. Illegal parking is widespread and causes very considerablecongestion.
- 55 - GHANA
Responsibilities
28. The principal agencies involved in the urban transport sector are theMinistry of Roads and Highways, the Ministry of Transport and Communicationsand the Traffic Police. The principal responsibilities of the City Councilin the transport sector are road lighting and street cleaning.
29. Ministry of Roads and Highways The MRH is responsible for theconstruction and maintenance of all roads in the country. This responsibilityis exercised through the Ghana Highway Authority (GHA) and the Feeder RoadsDepartment. The City Engineers Department of the Accra City Council wasresponsible for the construction and maintenance of non-trunk roads withinthe Accra District until the end of 1983, when this responsibility wasshifted to the Accra District Roads Unit (ADRU) of the Ghana HighwayAuthority. This had the effect of concentrating scarce technical skills andequipment. A timetable for handing back responsibility to the City Council atthe end of 1987 has been agreed, and the two organizations are cooperating toachieve this aim. The World Bank's Accra District Rehabilitation Projectwill assist in achieving this objective by strengthening the ADRU andassisting the City Council with municipal resource mobilization. The majorpart of the loan will go directly to improving the roads sector.
30. Ministry of Transport and Communications. The MOTC is responsible forthe regulation of the transport industry. It also controls the two governmentbacked public transport undertakings. The MOTC recognizes the need to involvethe private sector in the provision of transport services while ensuringadequate safeguards with respect to passenger and vehicle safety. The MOTCoperates vehicle testing stations and also looks after driver and vehiclelicensing.
31. Traffic Police. The Accra City Motor Traffic Unit (MTU) forms part ofthe national police responsible to the Ministry of Defence. The MTU comprises122 officers, of which 34 are assigned to traffic control and seven to theprevention of accidents. The remainder are assigned to foot patrol andadministrative tasks. There is one motorcycle patrolman. The MTU possess onlyone motorcycle and one patrol car. The MTU considers that to work effectivelythey require 12 patrol cars and 30 motor cycles. Accident reporting is doneby the MTU and other divisions. Little use is made of the accident dataexcept for charges concerned with violations.
- 56 -
URBAN TRANSPORT SITUATION IN COTE D'IVOIRE: ABIDJAN
SUMMARY
Urban Transport Overview
1. Abidjan boasts one of the best urban road networks and transport systemsin the whole of Africa. The cost of this achievement has been high. Emphasishas been given to road construction, road maintenance, and relatively low-cost traffic management and bus priority improvements. These works have had amajor impact on traffic speeds and capacities, and the traffic managementmeasures have enabled some high capital cost road schemes to be deferred.
2. Overzealous expansion of the state controlled bus company (SOTRA),combined with inadequate fare revisions, led the company into a spiralingdeficit situation over the period 1976-82. The government's annual subsidygrew from US$1.8 million to US$26.6 million over this period. Strong actionsto remove unprofitable services, reduce overheads, and improve productivityhave been taken. Subsidies are being held at US$16 million per annum which,taking into account inflation and no fare revision since 1982, means that thecompany is steadily improving its financial performance. These improvementshave been facilitated by the "contract-plan" agreement between government andSOTRA. The relatively low number of inhabitants per bus and the reasonableoperating statistics are indicative that a good level of service is beingprovided to Abidjan's residents. Private transporters who assure services inthe suburbs, where operating conditions are more difficult, also play a veryimportant role in the Abidjan transport system.
Needs and Issues
3. The economic crisis that has gripped the Cote d'Ivoire over the pastfive years has had a beneficial effect on the transport sector. The level oftraffic volume has fallen significantly and the growth of the motor vehiclefleet has halted. Roads that were planned in the late 1970s and built in theearly 1980s have left the transport system with excess capacity. TheGovernment of the Cote d'Ivoire now has to address two important issues.
4. First, it is certain that this relatively beneficial transport situationwill not last more than a few years since the economy will begin toaccelerate again. It is now more than eight years since a comprehensivetransport study was undertaken in Abidjan. A strategic transport plantherefore needs to be prepared to evaluate transport investment options forthe next decade, including road and rail systems. Plans to develop a suburbanrail system, which were shelved during the economic crisis, should also bereevaluated.
5. Second, the improved road network and traffic management system that hasbeen implemented over the past few years will need to be maintained. PreviousBank projects have made financial provision for maintenance of the signalequipment, road markings and signs, and the supply of a strong level oftechnical assistance. These costs now need to be absorbed by the governmentas part of its recurrent budget.
- 57 - COTE D'IVOIRE
Bank Role and Strategy
6. The Bank's involvement in the urban transport sector during twosuccessive loans has had a major impact on government policy and decision-making. Significant gains and improvements have been made in planning and inimplementing urban transport, traffic management, and road safety schemes,and reducing the operating defecit of SOTRA. However, given the relativelystrong position of the sector, due to earlier investment and decreaseddemand, the Bank's financial involvement should be reduced and investmentshould be concentrated on consolidating the gains already made at both theoperational and institutional levels. Important areas for investment are theextension of public transport improvements, the expansion of trafficmanagement schemes and the implementation of road safety measures. In orderto consolidate the institutional gains, the Bank should also support thedevelopment of training programs.
COTE D'IVOIRE - 58 -
I. NATIONAL PERSPECTIVE
Urbanization
7. The Cote d'Ivoire is situated between 5 and 10 degrees north of theequator on the Coast. It is bordered by Liberia and Guinea to the west, Maliand Burkina Faso to the north, and Ghana to the east. The country covers anarea of 332,000 square kilometers and had a population of 8.17 million in1982. The population growth rate between 1973 and 1982 was 4.4 percent. Thisrate is expected to decrease gradually over the next decade. The averagepopulation density in 1982 was 24.6 persons per square kilometer.
8. In 1980 the urban population was 3.1 million, representing 38 percent ofthe national total. The urban sector has been growing at a rate of about 8.4percent per annum. The highest growth occurred in Abidjan, where thepopulation increased from 990,000 in 1975 to 1.7 million in 1980--a growthrate of just over 10 percent per annum. The current population of GreaterAbidjan is estimated to be about 2.4 million and will reach 3.4 million by1990.
9. Growth in the secondary cities varies considerably but is muchhigher than the national average. Bouake, the second largest city with apopulation of 280,000 in 1980, has been growing at 8 percent per annum, andDaloa the third largest city (1980 population 83,000) has been growing at 6percent per annum. If current trends continue, up to 60 percent of thenational population could be living in urban areas by the year 2000.
10. Migration, which accounts for over half the urban growth, has had amajor impact on the urban sector. This migration, both from within thecountry and from neighboring countries, is primarily a consequence of therobust record of economic growth. Abidjan's growth and that of the othercities in the southern and central regions has been influenced to a largeextent by the high investment per capita received by these regions comparedto other parts of the country.
The Transport Sector
Road Network
11. The Cote d'Ivoire's classified road network totalled 47,880 kilometersin 1984, of which 3,620 kilometers (8.8 percent) were paved. These figuresinclude 11,450 kilometers of roads that were previously unclassified. Roaddensity averages 14.3 kilometers per 100 square kilometers. Table I.1presents a breakdown of road lengths by category.
Vehicle Fleet
12. The official estimates of the national vehicle fleet are shown in Table1.2. The fleet grew at an rate of 11 percent per annum between 1976 and 1981.Since that time the severe economic recession and the dispositions taken bygovernment significantly reduced the number of new vehicles entering thecountry. The number of new registrations decreased from 23,715 in 1980 to11,174 in 1983. The fleet then stabilized at about 146,000 vehicles.
Recent indications are that the fleet is begining to expand again in linewith an improvement of the economy. The level of motorization in 1983 was17.8 vehicles per 1000 population or 12.0 cars (including taxis) per 1000.
Urban Vehicle Usage
13. Between 1976 and 1980, gasoline consumption in the Cote d'Ivoireincreased by 8 percent per annum. As the economic recession took hold, fuelconsumption began to decrease and from 1981 to 1984 gasoline consumption fellat a rate of just over 8 percent per annum. Diesel consumption over the sameperiods rose by 7 percent per annum and then fell by just under 5 percent perannum. The quantity of gasoline consumed in 1984 was the same as in 1976. Thequantity of diesel consumed in 1984 was about 8 percent higher than in 1976.Table I.3 shows details of fuel consumption over the period 1976 to 1984.Abidjan, with approximately 4 percent of the national road network and 46percent of the registered vehicle fleet, accounted for 47 percent of gasolinesales and 38 percent of diesel sales in 1984.
Road Accidents
14. The number of recorded road accidents in the Cote d'Ivoire in 1982 was4,600. One-third of these occurred in Abidjan and a further 17 percent inother urban areas. (See Table 1.4) In 1982 the number of fatalities per100,000 population was about eight and the number of fatalities per 10,000vehicles was 48. The number of casualities per 10,000 vehicles was 680.Approximately 12 percent of the total vehicle fleet was involved in accidents
COTE D'IVOIRE - 60 -
every year. Accident rates in Abidjan increased over time until 1978, whenthey began to fall substantially. This decline was attributable tocomprehensive traffic management improvements and a well-enforced seat beltlaw. In Abidjan pedestrians are at the greatest risk, accounting for 75percent of all deaths and 50 percent of all injuries. Young children areparticularly vulnerable. Over 40 percent of all accidents occur atintersections and 40 percent occur on relatively wide roads. It is estimatedthat 15 percent of all accidents occur in secondary ciuLes. Average vehicledamage costs are approximately F.CFA 330,000.
Transport Costs
15. Import duties in 1983 were 82 percent for cars with leis than 1300 cubiccentimeters engine capacity and 89 percent for cars over 1300 cubiccentimeters. Importation of luxury cars is prohibited.
16. Motor vehicle license fees vary according to engine power up to 15 horse-power. The minimum fee is F.CFA 12,000 and the maximum fee is F.CFA 120,000.Registration (Carte Grise) fees vary according to horsepower. The minimum feeis F.CFA 3,125 and the maximum fee is F.CFA 9,125.
17. The tax payable on gasoline and diesel in 1983 was 30 percent and 15percent respectively. The pump price was increased in March 1985 to F.CFA 350per liter (US$2.76 per gallon) for premium grade, F.CFA 325 per liter(US$2.56 per gallon) for regular gasoline and F.CFA 255 per liter (US$2.01per gallon) for diesel.
The Economy
18. During the first two decades after independence in 1960, the Coted'Ivoire experienced an average 7 percent per annum rate of growth of itsGDP, one of the fastest development rates for nonoil exporting countries inthe world. The prime sources of the increased prosperity were from theagricultural sector--namely coffee, cocoa, and timber. This growth led thecountry to undertake a vast public investment program during the 1970'sfinanced by surpluses and borrowings from the international capital market.However, rates of return were low on major elements of these investments andthey did little to sustain projected growth rates. Furthermore, risingrecurrent costs and higher interest payments boosted public expenditure to 41percent of GDP by 1980, while the terms of trade declined by 30 percentbetween 1977 and 1980. This led to a substantial deterioration in publicsavings and to a severe financial crisis in 1980.
19. At the end of 1980, the government launched a financial recovery programsupported by the IMF and structural adjustment loans from the World Bank.The government took a number of politically difficult measures, including anoverall reduction of the public investment program; increases in the pricesof rice, gasoline, and bus fares; and decreases in subsidies. Recent evidencesuggests that these measures have turned the economy around and real GDP hasbegun to grow again at a rate of between 2-to-4 percent. GNP per capita fellfrom US$910 in 1982 to US$720 in 1983. Approximately 63 percent of GDP isurban generated.
- 61 - COTE D'IVOIRE
Table 1.3 Fuel Consumption in the Cote d'Ivoire 1976 - 1984 i/
Table 1.4 Road Accidents in the Cote d'Ivoire in 1982
Rural OtherRoads Abidjan Urban Total
Accidents 2,285 1,515 800 4,600
Deaths 488 162 40 690
Injuries 6,772 1,598 880 9,250
Source: OSER
COTE D'IVOIRE - 62 -
II. LOCAL PERSPECTIVE
City Form and Constraints
20. Abidjan is located on the Atlantic Coast, approximately five degreesnorth of the equator. The city is built on low-lying land and surrounded byseveral lagoons. The presence of these lagoons has been a determinativefactor in the planning of the transport system and the development of thecity. The urbanized area covers 120 square kilometers and comprises 10communes. The modern commercial center is located in the commune known asthe Plateau. In 1980, the average population density was 14,200 persons persquare kilometer. Abidjan is the capital of the Cote d'Ivoire, the principalport and airport, and the center of economic, commercial, and industrialactivity.
21. During the last decade, two important growth areas have developed to thenorth and west of the Plateau. In the north, the commune of Abobo, a poorlyplanned and unserviced low-income housing area, was estimated to house morethan 300,000 inhabitants in 1980. To the west of the Plateau lies the Bancoarea, which is being developed to accommodate a short-term population of350,000 and up to a million in the longer term.
Transport Demand
22. The population of Abidjan is expected to grow from 2.4 million in 1985to 3.4 million by 1990 at a rate of 7 percent per annum. The majority of thisgrowth will occur in the low-income suburbs to the north and west of thePlateau.
23. The size of the vehicle fleet operating in Abidjan is not knownprecisely. It has been estimated that in 1983 there were approximately48,000 cars, 3,500 taxis, 1,035 state-owned buses, and 500 informal minibusesoperating in Abidjan. In addition ther were approximately 15,000 pick-ups,trucks, and other buses. Due to the high population growth rate and theeconomic recession, the level of motorization appears to have fallen fromabout 38 vehicles per 1000 inhabitants in 1980 to 30 in 1983.
24. The total number of estimated daily trips in Abidjan in 1981 was 1.6million, or 0.86 motorized trips per inhabitant. Approximately 52 percent ofall trips were by public transport (40 percent by SOTRA and 12 percent bygbaka), 35 percent by car, and 13 percent by taxi. Since that time theproportion of daily trips by public transport has probably risen, since thenumber of taxis has declined by about 1,000 and the number of cars has notsignificantly increased.
Public Transport
25. There are four forms of public transport available in Abidjan: bus andboat services provided by SOTRA, privately operated minibuses (gbakas) andtaxis. Since 1976, when SOTRA was given a monopoly on all servicesoriginating in the center of Abidjan, the privately operated minibuses haveonly been allowed to provide suburban services. Some of the more popularsuburban routes are also operated by SOTRA in competition with the mini-buses. SOTRA is a public enterprise of which 60 percent of the shares areowned by the state and 40 percent by Renault Vehicle Industries. SOTRA is
- 63 - COTE D'IVOIRE
responsible to the Ministry of Public Works, Construction, Post andTelecommunications, which sets fares. The taxis and gbakas are owned byindividuals who rent out the vehicles to drivers for a guaranteed cashreturn. There are also some owner-drivers. The drivers generally cover fuelcosts and the owners pay for maintenance. Bus fares for normal services areF.CFA 100, 125, or 200 depending on the length of the trip. The maximum fareon the majority of routes is F.CFA 100. Combined tickets for boat and busjourneys are F.CFA 150. A variety of weekly and monthly passes at a discountprice are also available. A monthly pass costs F.CFA 12,800. The fares of thegbakas vary from F.CFA 75 to F.CFA 125 depending on the distance travelled.
26. SOTRA. SOTRA was established in 1960 and was one of the first publictransport undertakings to be set up in West Africa. SOTRA currently operates869 buses with a capacity of 100 to 135 (S 105's and S 105R's), 131 buseswith a capacity of 60 (SM 8's), 24 buses with a capacity of 40 (SG 4's), 63buses (SG 2's parcel service) with a capacity of 22, and 19 boats with acapacity of 96 or 144. Routes operated include 48 regular bus routes, 14parcel service routes and two regular boat services to and from the Plateau.There are approximately 700 kilometers of bus routes. The average turnoutvaries between 85 percent and 90 percent except for the SG 4's, which achievea 60 percent turnout. The average age of the fleet is 61 months. On anaverage day (annual figure divided by 365) the normal bus services carry600,000 pasengers, the parcel services carry 3,500 passengers, and the boatservices carry 20,000 passengers (26,000 on a weekday). Receipts on the busservices average F.CFA 568 per kilometer. The number of employees per bus is5.33. The number of inhabitants per SOTRA bus was 2,490 in 1985. Includingthe 500 gbakas operating in the suburbs, this ratio drops to 1,700.
27. SOTRA's operations produced satisfactory financial results until 1974,when a trading loss was reported that was principally due to inflationarycosts outstripping fare increases. The situation worsened over the next fewyears as the fleet was significantly expanded. The average daily passengertrips per bus fell from about 1,000 to 540 and the annual kilometrage per busfell from 60,000 to 35,000. The surge in physical resources had not beenmatched by a proportionate increase in service kilometers or passengerdemand, and the fleet expansion had been too rapid for SOTRA'S absorptivecapacity. An additional factor that worsened the financial situation was therestraint placed on fares by the government. Fare rises from F.CFA 40 to 50in September 1976 and to F.CFA 60 in January 1979 were not enough to rectifythe losses, which went from F.CFA 840 million (US$1.8 million - using 1985exchange rate) in 1976 to F.CFA 4,792 million (US$10.1 million) in 1978/79.The situation continued to worsen, reaching a maximum defecit of F.CFA 12,647million (US$26.6 million) in 1981/82.
28. With strong action by government and assistance provided under the WorldBank loan, losses were reduced to F.CFA 8,000 million (US$16.8 million) andF.CFA 7,449 million (US$15.7 million) in the following two years. This wasachieved by cutting loss-making services, reducing overheads, and improvingefficiency and productivity. The fares were increased to their current level(a 66 percent increase) in October 1982. The fare increase that had beenplanned for 1982/83 was not implemented, but instead the level of guaranteedsubsidy was fixed at F.CFA 8,000 billion. This target was met by the companyand a further improvement was recorded in the following year.
COTE D'IVOIRE - 64 -
29. Gbakas. The principal routes served by the gbakas are between Adjameand Abobo, and Adjame and Youpougon. Other routes include Treichville andKoumassi to Port Bouet and Grand Bassam. The number of bus journeys on thetwo principal routes increased at a rate of 32 percent per annum over theperiod 1981-83. It is estimated that there were some 500 gbakas in operationin 1983. Two sizes of minibus are used--14 and 22 seaters mainly of Japanese(Toyota Dyna) and French (Renault SG2) origin. Interviews with 25 owners ordrivers indicated that 56 percent of those interviewed owned one vehicle, 16percent owned two vehicles, 16 percent owned 3 vehicles and 12 percent owned4 vehicles. On the Abobo route with the 22 seater (Renault SG2) each vehicledoes about 40 trips per day working about 17 hours. The daily kilometersaverages 475 and the number of passengers averages 830. Each passenger paysF.CFA 75 and the total daily receipts average F.CFA 62,250. The driver paysthe owner between F.CFA 20,000 - 35,000 per day (in 1983) depending on thesize and condition of the vehicle. The driver receives from the owner amonthly wage of F.CFA 30,000 - 40,000 in addition to the excess receipts. Thedriver employs a relief driver whom he pays F.CFA 1,000 per day and with whomhe shares the excess receipts. Two apprentices are also employed at F.CFA 500per day to collect fares. They keep any extra charges for parcels. The driveralso pays F.CFA 200 per day to the passenger collectors located in the busstations.
30. Taxis. All taxis are metered. It was estimated that in 1985 there weresome 3,500 taxis operating in Abidjan--approximately 1,000 less than in 1981.Now that the economic crisis is receding indications are that the number oftaxis is increasing.
Road Network
31. A recent survey has shown that there are 1,700 kilometers of roads inAbidjan, of which 62 percent are surfaced. The communes of Plateau, PortBouet, Cocody and Treichville have more than 80 percent of their roadssurfaced. There are approximately 6.5 kilometers of road per 10,000inhabitants or 4.0 kilometers of surfaced road per 10,000 inhabitants. Thecondition of the surfaced roads is generally good except in some of the low-income areas. The first phase (70 kilometers) of a major program ofresurfacing is complete. A second phase involving 72 kilometers is currentlyunderway. A third phase is also planned. A program of footway maintenance isalso underway, involving all footways on the Plateau. The road network isquite well structured with good standard expressways linking the Plateau withthe principal suburbs. The cost of this achievement over the past five yearshas been of the order of F.CFA 62,000 million (US$130 million).
Traffic Conditions
32. Available statistics show that the recent economic crisis has had amarked effect on the level of traffic volumes and travel generally. Urbantraffic reached a peak in 1980; since then it has diminshed at a rate ofabout 4 percent per annum until 1984. The number of bus passengers fell overthe same period by about 7 percent. The annual number of new vehiclespurchased over the same period more than halved. This decrease in travelappears to have come to a halt in 1985, as a result of improved economicconditions. Many major road projects designed in the late seventies and nowconstructed were designed on the basis of continued growth in traffic. Thelate 1970s and early 1980s also saw a major citywide improvement in traffic
- 65 - COTE D'IVOIRE
management and public transport improvements financed by the World Bank.Traffic volumes in 1985 were about 15 percent less than in 1980--more similarto the conditions that existed in 1976/77. It is therefore not surprisingthat there is very little traffic congestion in Abidjan in 1985.
Traffic Management
33. Thanks to the emphasis given in the World Bank's first and second UrbanDevelopment Projects over the period 1978-85, Abidjan has one of the bestmanaged road networks in the whole of Africa. There are some 136 sets oftraffic signals of which the majority are centrally computer controlled. Thesignal system is well managed and maintained. Road markings are generallykept in good condition and are well dispersed over the road network. ThePlateau has a system of one-way streets that works well, and traffic signsare evident at almost all junctions. Many safety improvements have also beenintroduced both for pedestrians and vehicles. Much has also been done toimprove public transport operations. Two new bus stations have been built and5.25 kilometers of segregated right-of-way for buses has been implemented.Bus flows on these facilities average 180 buses per hour per direction--ofthe order of 30,000 passengers per hour. These physical achievements havebeen pararalleled with institutional improvements involving the creation of aTraffic Management Unit and a Transport Studies Group. Technical assistancehas played a major role in the success of this operation.
34. Parking regulations are quite well enforced by the Traffic Police andthere are ample signs denoting no parking areas and the location of off-street car parks, of which there are several on the Plateau. Vehicles thatinfringe the laws are towed away, or immobilized by wheel clamps. One of themajor benefits to the Police of the improved traffic signal system is thatmany police officers have been relieved of point duty and are thus able toconcentrate on other enforcement matters. Parking meters were installed onthe Plateau, but were quickly removed after questions were raised in thepress about the destination of the revenues collected.
Responsibilities
35. The principal agencies involved in the urban transport sector are theMinistry of Public Works, Construction, Post and Telecommunications (MTPCPT)and the National Police. The role of the Municipality of Abidjan in thetransport sector is limited to minor improvements to footways and roads.
36. MTPCPT. The MTPCPT is responsible for the design, construction, andmaintenance of roads and the formulation of transport policy and regulations.It is supported in its tasks by three autonomous organizations--theDirectorate for the Control of Major Works (DCGTX), the Public WorksLaboratory, and the Road Safety Office (OSER). The Directorate of Roads isresponsible for the preparation and execution of investments up to F.CFA 700million (US$ 1.5 million) and the formulation of maintenance programs basedon information received from the regional directorates. The DCGTX isresponsible for all projects over F.CFA 700 million. The Directorate ofTransport is in charge of monitoring the road transport industry throughregulations and tariffs. The Traffic Management Unit (SEC) and the TheTransport Study Group (DEP) are located in the Directorate of Roads. SEC isresponsible for the day-to-day management of the traffic system, including
COTE D'IVOIRE - 66 -
traffic signals, road marking, traffic signs, and safety improvements.Surveillance of the traffic signals and manning of the central control roomis carried out by a team from the SEC office who are linked by radio to theprivate subcontractor responsible for maintenance. Most faults in thetraffic signal system are repaired in under 24 hours. All signing and markingis carried out by contractors under the supervison of SEC.
37. The Transport Study Group is involved in studies being undertaken inAbidjan and the secondary cities and has played an important role in thepreparation of the traffic management programs and bus priority measures thathave been introduced during the past five years. The road safety organiz-ation, OSER, is active in the fields of research and education in road safetymatters. A recently completed investigation into the road accident situationin the Cote d'Ivoire, funded by the World Bank, has assisted OSER in definingits goals and targets for actions in the road safety field.
38. National Police. The Traffic Police in Abidjan come under the controlof the Abidjan Police Comissioner and are located in the same building asthe central police communications system and the traffic control center . TheTraffic Police appear to operate quite efficiently and can be often seencontrolling speeding, checking use of seat belts, and verifying papers.
- 67 -
URBAN TRANSPORT SITUATION IN LIBERIA: MONROVIA
SUMMARY
Urban Transport Overview
1. The principal issues of the urban transport sector in Monrovia aretraffic management, road maintenance, and the institutional andadministrative environment. These problems arise because of a lack ofprofessional expertise in engineering and transport planning, a shortageof funds, and weak direction in terms of urban transport policy.
2. The National Police play a key role in the operations of the sector,being responsible for vehicle inspection, driver licensing, enforcement,and safety. The Police are also responsible for traffic control but relyon the national electric company to procure and maintain traffic signals.The city also has its own police force. The Ministry of Public Works isinvolved in the planning and implementation of road improvement schemes.The provision of public transport is mainly the concern of the privatesector, with little involvement and regulation by the State. The MonroviaTransit Authority (MTA) is a fully independent public corporation runningabout 7% of the city buses. The MTA performs poorly and is experiencingfinancial difficulties.
Needs and Issues
3. The most urgent need for the City Corporation is to strengthen anddevelop its Department of Traffic and Public Safety so that it is able totackle the problems of traffic congestion and assist in reducingaccidents. This should be done through the development and implementationof a comprehensive traffic improvement program in Monrovia, involvingtraffic management, intersection improvements, and improved facilities forpublic transport vehicles and pedestrians. Improvements in the enforcementof parking regulations should also form part of the program.
4. At the national level, more resources need to be devoted to roadmaintenance. Insufficient funding of this sector over the past few yearshas led to a steady decline in the road network, particularly of thesecondary roads in Monrovia. Many sidewalks are also in need ofimprovement. The World Bank's recent Fifth Highway Project is intended tostrengthen the Ministry of Public Works' road maintenance capability.Because of the national scope of this project, it is unlikely that it willmeet all the requirements for improved road maintenance in Monrovia. Thecapability of the City Engineer's Department in this area is minimal andshould be strengthened.
5. The urban transport sector also suffers from weak planning, lack offirm policies, and fragmented responsibilities. The problems are furthercompounded by a lack of expertise in traffic and transport matters at alllevels of government.
LIBERIA - 68 -
Bank Role and Strategy
6. The urban transport situation in Monrovia is typical of many citiesin Africa, but because of the relatively small size of the capital theproblems of urban traffic congestion and road safety have not yetdeveloped to serious proportions. There is undoubtedly much that could bedone to assist the government in developing a stronger policy frameworkand improving traffic operations through the implementation of acomprehensive traffic improvement program combined with strengthening inthe fields of road maintenance and traffic enforcement. Assistance inthese matters could form part of an urban development project that shouldconcentrate on institutional development. Responsibilities for themaintenance of different categories of urban roads need to be clearlydefined.
- 69 - LIBERIA
I. NATIONAL PERSPECTIVE
Urbanization
7. Liberia is situated on the West African coast approximately fivedegrees north of the equator. It is bordered by Sierra Leone to the west,Guinea to the north, and Cote d'Ivoire to the east. The country covers anarea of 111,370 square kilometers and had a population of 2.01 million in1982. The population growth rate between 1973 and 1982 was 3.5 percent.The average population density in 1982 was 18.1 persons per squarekilometer.
8. In 1981 the urban population was approximately 630,000, representingone-third of the national total. The population of Monrovia was estimatedto be 330,000, representing 17 percent of the national total or 52 percentof the urban population. The population of Monrovia is growing at about 7percent per annum and was about 400,000 in 1985. It is expected to reach600,000 by 1990.
The Transport Sector
Road Network
9. The Liberian road network totalled 9,980 kilometers in 1981 of which739 kilometers (7.4 percent) were paved. These figures include 2,372kilometers (24 percent) of private roads, of which 150 kilometers arepaved. The road density averages 9.0 kilometers per 100 square kilometers.Table I.1 presents a breakdown of road lengths by type of construction.
Vehicle Fleet
10. Vehicle fleet estimates for Liberia are derived from vehicleregistration records. The official estimates are shown in Table I.2. Overthe period 1976-81 the number of private cars fell by an average of 6percent per annum while taxis and trucks increased by averages of 14 and 2percent per annum. Buses decreased by an average of over 8 percent perannum. The difficult economic conditions are mainly responsible for thegradual reduction in new registrations and the consequent fall in thefleet. Even if, as suspected, not all vehicles are officially registered,it is important to note that the total fleet did not significantly changeover the period 1976-81. The level of motorization in 1981 was 9.0vehicles per 1000 population or 5.7 cars (including taxis) per 1000.
Transport Costs
11. Import duties in 1985 varied from 24.5 percent for buses to 51.5percent for large cars. The duty payable on small cars was 29.5 percent,and on spare parts was 40 percent. There is an additional surcharge of 10percent on all imports.
12. Fuel taxes have been a major source of income for the Liberiangovernment. Current taxes include a 5 percent sales tax plus $1.60 pergallon. The pump price of gasoline is currently $3.0 and $2.25 for diesel.In mid-1983, when fuel tax was $0.92 per gallon, road user charges wereexpected to generate US$30 million during the following twelve months.
LIBERIA - 70 -
Table I.1 National Road Network 1981 (kilometers)
Public Paved Gravel i/ Earth / Total
Primary 589 1,286 - 1,875
Secondary 2,068 3,663 5,731
Sub-Total 589 3,354 3,663 7,606
Private 150 2,222 t/ 2,372
Total 739 5,576 3,663 9,978
i/ All Weather Road.2/ Dry Weather Road.tJ Gravel and Earth.
Source: Ministry of Finance, Motor Vehicle Division
The Economy
13. Liberia is well endowed with natural resources, notably iron ore,timber, and rubber. These allowed the country to realize rapid economicgrowth in the sixties and early seventies. However, the energy crisisand the subsequent recession in the industrialized countries killed theexport-led boom and the rate of GDP growth fell to less than 1 percentbetween 1974 - 1979, despite an expansionistic policy. Persistent weakexternal demand, deterioration of the investment climate, and reducedpublic investment led to a decrease in real GDP of about 15 percentbetween 1980 and 1982. The medium-term outlook for a resumption of rapideconomic growth appears bleak.
- 71 - LIBERIA
14. During the first development plan (1976/77 - 1979/80) availableresources were mainly channeled into new roads (50 percent expansion ofpaved and all weather roads) rather than road maintenance. The quality ofthe road network deteriorated significantly during this period. The seconddevelopment plan (1981/82 -1984/85) switched the emphasis away from newprojects to the maintenance of the existing network and the expansion offeeder roads to increase agricultural output. Liberia uses the US$ as itscurrency and thus has no foreign exchange problems per se. However, it hasvery serious problems because of its lack of revenue and substantialdeficits in its current account balance of payments.
LIBERIA - 72 -
II. LOCAL PERSPECTIVE
City Form and Constraints
15. Monrovia is located on a rocky ridge overlooking the Atlantic Coaston the estuary of the river Mesurado. The city is built on two narrowstrips of land forming an "L" shape, with the Ocean on one side and animmense swamp on the other. The northern arm of land is connected to thesouthern arm by two bridges crossing the river Mesurado, which feed intothe central business district. Each arm of land is served by a principalspine road linking together the various communities that are spread out inthe form of ribbon development. Roads are generally set out on a strictgrid-iron network and consequently in some areas steep gradients arerequired to overcome the hilly topography. The growth of the city willeventually be constrained by these natural barriers. At the moment growthis occurring by infilling vacant sites on the two narrow land strips. Theurban area covers 30 square kilometers with an average population densityof about 13,300 per square kilometer. Monrovia is the capital of Liberia,the principal port and airport, the railhead of the national railway, andthe center of commerce and industry.
Transport Demand
16. The population of Monrovia is expected to grow from about 400,000 in1985 to around 600,000 by 1990 at a rate of 7 percent per annum. Themajority of this growth is expected to take place in the land arms to thenorth and east of the city center.
17. The vehicle fleet operating in Monrovia in 1984 has been estimated at12,016, representing about 65-to-70 percent of the national vehicle fleet.The fleet comprised, 5,909 cars (49 percent), 2,155 taxis (18 percent),2,003 pickups (17 percent), 1,015 buses (8 percent), and 934 trucks (8percent). The level of motorization was approximately 30 vehicles perinhabitant, or 20 cars (including taxis) per inhabitant.
Public Transport
18. There are four forms of public transport available in Monrovia - bus,taxi, pick-up, and passenger trucks. Bus services are provided by a publicoperator (Monrovia Transit Authority), and private operators. Privateoperators also provide taxi, pick-up and truck services. The MonroviaTransit Authority (MTA) is a public corporation receiving capitalsubsidies from the central government in the form of new buses. Thecorporation is required to cover its operating costs. MTA operates in fullcompetition with the private sector. Entry into the private sector is opento anyone with an appropriate driving license and a vehicle that haspassed a fitness test. Fares are regulated by government and were $0.35and $0.15 for students. MTA has introduced a graduated fare system. Mostprivate sector public transport vehicles are either owner-operated or arerented out to a driver by the owner for a fixed daily return. The ownerspay for maintenance, insurance, and licenses and the driver pays for fuel.
- 73 - LIBERIA
19. MTA. The Monrovia Transit Authority was set up in 1979 to providebus services throughout Monrovia and some inter-city services. MTA has 78buses, of which 70 are assigned to nine city routes and eight to inter-city services. The nine city routes cover 24 route kilometers. Of the 70city buses, 40 are serviceable and an average of 32 are in use on anygiven day (45 percent turnout). The buses have a capacity of about 70,with 29 seated and 41 standing. The principal problems of KTA are: (a)shortages of spare parts; (b) over-manning; (c) revenue leakage; and (d)dead mileage. Recent changes in the management team have led to reductionsin staff, improved revenue collection, and rerouting to cut down deadmileage. Renault Vehicle Industries have been involved with MTA byproviding technical assistance and financing vehicles and spares throughFrench aid.
20. MTA is currently operating at a loss. Average monthly expenses in1984 exceeded income by about $56,000 giving an annual deficit on theorder of $672,000. The new management of the MTA is pressing Governmentfor tax concessions and the granting of an exclusive franchise for allservices within Monrovia. The Ministry of Commerce, Industry and Transportis unsympathetic to these requests and would rather encourage the privatesector, which is flourishing despite shortages of spares and complaintsabout diminishing patronage.
21. Private Buses. There are some 600 private buses operating inMonrovia. Buses are mainly 22-27 seaters with a crush capacity of about 35passengers. Most buses are of Japanese origin. Buses appear to keep toregular routes and charge a maximum flat fare of $0.35 and $0.15 forstudents. In reality, the average fare paid is about $0.25. Most buses aredriven by the owners but there are some operators with two, three, or fourbuses. These are hired out to drivers at about $40-$60 per day. The driveralso pays the fuel costs (about $60 per day) and keeps the surplus for hiswages. It has been estimated that each bus carries some 450-500 passengersper day.
22. Taxis. There are approximately 2,100 taxis operating in Monrovia.They are very popular and widely used. They operate on a shared fare basisand are not metered. Charges vary from $0.40 for short distances in theCBD to $0.65 in the main city areas and $1.05 for longer journeys. Faresare regulated by government, but the fares charged are very often lessthan the maximum. There are no restrictions on entry into the market apartfrom the necessary license. The majority of taxis are of Japanese orKorean origin.
23. Other Modes. Other public transport modes include pick-ups andpassenger trucks. There are approximately 360 pick-ups and 180 trucksoperating in Monrovia. These vehicles are not allowed in the CBD area andare mainly used to serve the outlying townships, carrying both passengersand goods.
LIBERIA - 74 -
Road Network
24. The present condition of the road surfaces is reasonably good,because much of the paved road network is relatively recent. Conditionsare, however, rapidly deteriorating and very little money is being spenton maintenance activities. Sidewalks are likewise not well maintained andmore facilities are required.
Traffic Conditions
25. Traffic congestion is limited to certain locations and times of theday except in the area of West Side where market activities and streettrading cause significant congestion throughout the day. Travel speedsthroughout the road network can be very irregular. The MTA terminal islocated in this West Side area and it is also the busiest location fortaxis and small buses. The existing problems in West Side and at the keyintersections on the road network could all be readily improved atrelatively low cost by traffic management measures involving one-waystreets, channelization, marking, signing, and enforcement.
Traffic Management
26. Traffic management is not well developed in Monrovia, and there is anotable absence of signs and markings. There are some 20 sets of trafficsignals, the majority of which are located in the CBD area. The signalsare reasonably well maintained by the national electricity company (LEC),but damaged poles and heads are not replaced. A traffic managementcomponent was proposed for the World Bank funded Monrovia UrbanDevelopment Project, but this component had been excluded by the time theproject was appraised in 1981. Parking is poorly organized andinadequately enforced.
Responsibilities
27. The principal agencies involved in the urban transport sector are theMinistry of Public Works, the Ministry of Commerce, Industry andTransport, the Ministry of Justice, the Ministry of Finance, the LiberianElectric Corporation, and the Monrovia City Corporation.
28. Ministry of Public Works. The MPW is responsible for theconstruction and maintenance of all roads in Liberia except for minorroads in Monrovia that are maintained by the Monrovia City Corporation.The MPW is the principal focus of the World Bank-funded Fifth HighwayProject, which began in 1984. The principal objective of the project is toimprove road maintenance by strengthening the MPW's capacity to carry outroad maintenance.
29. Ministry of Commerce, Industry and Transport. The MCIT isresponsible for the formulation and implementation of road transportpolicy. This is a purely administrative function.
- 75 - LIBERIA
30. Ministry of Justice. The MJ is responsible for all legislationconcerning transport and is also responsible for the National LiberianPolice. The Police are responsible for vehicle inspection, driverlicensing, and vehicle registration as well as assuming an enforcementrole with regard to traffic control and safety. There are some 140 policeinvolved in traffic duties in Monrovia. These are mainly assigned toaccident investigation (39 staff), enforcement duties (53 staff), andintersection control (26 staff). The police are poorly equipped, havingonly four cars and 16 motorcycles. There is also a need fortelecommunications equipment. Traffic offenses are dealt with on a fixedpenalty system, which was only recently introduced. The police liaiseclosely with the Electric Company for the repair and maintenance oftraffic signals. In the nine months from July 1984 to April 19B5 thepolice recorded 916 accidents, of which 44 were fatal and 762 involvedinjuries. The principal cause was reckless driving. Recommendations forremedial actions are made by the police and passed to the MOW.
31. Ministry of Finance. The MOF is responsible for the collection ofall fees and duties with regard to vehicles and drivers.
32. Liberian Electric Corporation. The LEC is a public agencyresponsible for the generation, transmission, and distribution ofelectricity. It is also responsible for the procurement, installation, andmaintenance of traffic signals and street lights.
33. Monrovia City Corporation. The MCC is composed of five departmentsincluding a department of Traffic and Public Safety and Planning andWorks. Neither of these departments is adequately staffed and both sufferfrom a lack of funds and adequate equipment.
- 76 -
URBAN TRANSPORT SITUATION IN MALI: BAMAKO
SUMMARY
Urban Transport Overview
1. Despite the physical shortcomings of the traffic situation in Bamako(poor road maintenance and lack of traffic management), there are manypositive aspects of the organization of the urban transport sector.Particularly important are the strength and flexibility of the privatetransport operators and the enlightened approach of the National TransportOffice with regard to the control and regulation of the sector. Theminimal regulations, mainly in the area of vehicle and passenger safety,allow the operators to organize their own activities to their bestadvantage, requiring little input by the ministry in the area ofenforcement. The principal areas of weakness at the ministerial level arethe lack of an adequate mechanism for the regular revision of passengerfares and the financial policy with regard to fuel subsidies.
2. In the District of Bamako, a major program of road rehabilitation isurgently required. A parallel action to strengthen the Road MaintenanceUnit of the Technical Services Department is also urgently needed. Thenewly formed Transport Office represents a major step forward in trying toimprove the urban traffic and transport system. This office, however, willrequire assistance if it is to develop and implement a comprehensivetraffic improvement program. This is being provided in the World Bank'ssecond urban project, which includes road maintenance and trafficmanagement components.
Needs and Issues
3. There are two basic issues that need to be addressed by theGovernment of Mali and the District of Bamako. These concern roadmaintenance and traffic management.
Road Maintenance
4. The establishment of an effective road maintenance unit within theDistrict of Bamako is a major need. The present organization hasinsufficient resources even to carry out a satisfactory level of routinemaintenance. Without strong action in this area there is little that canbe done to significantly improve the traffic situation. A major crashprogram of rehabilitation, including drainage works and the provision offootways, is urgently required. At the same time, the existing roadmaintenance organization requires strengthening so that routine procedurescan be effectively carried out.
- 77 - MALI
Traffic Management
5. There is much that could be done in the central area of Bamako toimprove traffic flow, provide greater safety for pedestrians and improvepublic transport operations. The District's Transport Office has alreadymade a small start by trying to organize public transport parking. A muchgreater effort, however, is needed. A comprehensive traffic improvementprogram should be developed for the central area, incorporating one-waystreets, intersection improvements, traffic signals, lane markings andsignposting. Although the Transport Office is ideally suited to undertakethis activity, it will require some strengthening if it is to develop andimplement such a plan. The work already started in raising revenues fromtransport users is to be encouraged, and if possible, expanded upon.
Bank Role and Strategy
6. The Bank's Second Urban Project includes a major road componentinvolving the rehabilitation of streets and footways, clearing andrepairing drains, traffic management measures in the city center and theconstruction of new roads. Technical assistance is provided to assist ininstitutional development through improving implementation and planningprocedures. The project also addresses the question of resourcemobilization for financing routine works. The project should go a long waytoward improving traffic conditions in Bamako and institutionalperformance in the sector.
MALI -78 -
I. NATIONAL PERSPECTIVE
Urbanization
7. Mali is a land-locked country situated in the Sahel region of WestAfrica. It is bordered by Algeria to the north, Mauritania and Senegal tothe west, Guinea, Cote d'Iviore and Burkina Faso to the south, and Nigerto the east. The country covers an area of 1.24 million square kilometresand had a population of 7.1 million in 1982. The population growth ratebetween 1965 and 1976 (date of the last census) was 2.6 percent. Since1976 the population has continued to grow at the same rate. The country isdivided for adminstrative purposes into eight areas--the capital, Bamako,and seven regions. The urban and rural populations of each area are shownin Table I.1. It has been estimated that the total population in 1985 was7.9 million of which 23 percent live in urban areas. The population ofBamako in 1983 was estimated at 675,000, equivalent to 37 percent of thetotal urban population. The proportion of the urban population in Bamakois expected to increase to 45 percent by 1995. Four other towns areexpected to reach 100,000 population by 1995.
The Transport Sector
Road Network
8. The classified road network of Mali consists of 13,000 kilometers ofnational, regional, and local roads, of which just under 2,000 kilometersare paved and 4,100 kilometers are improved gravel roads. In additionthere are 930 kilometers of non-classified roads. Road density averages1.1 kilometers per 100 square kilometres. Table I.2 gives a breakdown ofthe lengths of different types of roads. The proportion of paved roads is14.1 percent.
Vehicle Fleet
9. The vehicle fleet estimates are based on annual vehicle registr-ations. The National Transport Office has recently brought all its data upto date in preparation for computerization of its data bank. The officialestimates are given in Table I.3. These figures probably underestimate thetotal. The fleet has grown at a rate of about 4 percent over the pastdecade from a total of 19,100 vehicles in 1974 to 27,900 in 1983. Vehicleownership in 1983 was about four vehicles per 1000 population or just overtwo cars per 1000. Significant changes have occurred in the vehicle fleetsince 1974. While the proportion of passenger cars has remained at about60 percent, the number of light trucks, essentially for passengerservices, has more than doubled, increasing their share from 21 to 29percent. The number of buses increased by a factor of 3.7 over the sameperiod.
-79- MALI
Table I.1 Population and Density by Administrative Area in 1976
Admin. Urban Rural Urban Density
Division Population Population Total Percent pop/sq.km.
10. Fuel consumption, which had risen at an annual rate of 9.5 percentbetween 1974 and 1980, declined sharply following the substantial priceincreases of 1981. In 1983 consumption was at the 1978 level. Table I.4shows the annual fuel consumption for road vehicles between 1974 and 1983.Sales distribution statistics for 1982 and 1983 show that, on average, 65percent of all gasoline and 36 percent of all diesel was sold in theBamako region.
- 81 - MALI
Transport Costs
11. Motor vehicle license fees (Carte Grise) vary according to the horse-power of the vehicle. The minimum and maximum charges are F.CFA 5,000 andF.CFA 60,000. Road tax is F.CFA 17,500 for cars and varies for trucks fromF.CFA 15,000 to F.CFA 37,500 depending on the maximum allowable ladenweight.
12. The import price of fuel, net of taxes, varies depending on the portof origin (Dakar, Abidjan, and Cotonou). The government sets a singleprice that includes a varying amount of tax depending on the country fromwhich the fuel was imported. In 1983, the tax on gasoline varied between25 percent and 44 percent and the tax on diesel between 25 percent andzero. The pump price of fuel in May 1985 was F.CFA 260 per liter (US$2.07per gallon) for gasoline and F.CFA 182.50 per liter (US$1.45 per gallon)for diesel. These prices have been in force since 1981, when a 50 percentincrease was introduced. This means that the government has been absorbingthe increased costs of fuel since 1981. Recent data on import costs showsthat fuel is now subsidized by government.
The Economy
13. Despite the general poverty of the country (GNP per capita was US$170 in 1982), Mali's cities, in general, and Bamako, in particular, arevital commercial and production centers, in which a large share of theeconomic development process is taking place. The urban share of GNP isgrowing quickly--it is estimated that non-farm production grew at anaverage rate of 4.7 percent in real terms during the past decade versus2.6 percent for the agricultural sector.
MALI - 82 -
II. LOCAL PERSPECTIVE
City Form and Constraints
14. The city of Bamako was originally founded on the left bank of theRiver Niger. The construction of a bridge across the river in the late1950s encouraged the growth of settlements on the right bank. Today some31 percent of the population lives on the right bank and 69 percent on theleft bank. Future growth is mainly expected to take place on the rightbank. It has been estimated that the right bank will accommodate 45percent of the total population by 1995. Bamako covers an area of 50square kilometres and had a population density of 15,600 persons persquare kilometre in 1985.
15. Bamako is the capital of Mali and the seat of government. It is alsothe principal economic and commercial center of the country. Sixty ninepercent of Mali's industrial plants are located in Bamako, accounting for45 percent of industrial output. Forty-three percent of industrial workersare employed in Bamako. It has the country's only international airport.
Transport Demand
16. The population of Bamako grew from 419,000 in 1976 to 675,000 in 1983at an annual growth rate of 7 percent. The population in 1985 wasestimated to be 780,000. The city is expected to continue to grow at arate of about 6.5 percent, reaching 1.43 million by 1995. Because a majorpart of this growth will occur on the Right Bank there will be a steadyincrease in the demand for cross river trips and the already saturatedbridge will need to be expanded in the very near future.
17. There appears to be some confusion in recently published reportsconcerning the number of vehicles operating in Bamako. The Groupe Huitreport indicates that there were 25,000 vehicles in Bamako in 1980 butfigures for the same year from the National Transport Office show only23,000 for the whole of Mali. It would appear that the figures given inthe Groupe Huit report for Bamako are in reality the figures for the wholeof Mali. Other data obtained from the National Transport Office for 1983indicated that the proportion of passenger and goods vehicles based inBamako represented 64 percent of the national total. If this proportionwere applied to all vehicles, then the vehicle fleet in Bamako would havebeen approximately 18,000 in 1983--giving a level of motorization of 27vehicles per 1000 population.
18. Household interviews carried out by Groupe Huit in 1984 showed thatthe number of daily trips was 1.3 million, of which 63 percent (800,000)were on foot and 37 percent (500,000) by motorized transport. A studycarried out in 1983 by Rhein Ruhr/Beller estimated the number of motorizedtrips at 600,000--giving 0.89 trips per inhabitant. Approximately 50percent of these trips were to and from work. The most frequently usedtransport mode was the motorized bicycle (41 percent-246,000 trips) withpublic transport (30 percent-180,000 trips) and private cars (29 percent-174,000 trips) coming second and third. Of the 180,000 public transporttrips, 72 percent of all passengers were carried by Dourounis (smallpublic transport vehicles), 22 percent by taxis and 6 percent by theprivate bus company SOTRAMA.
- 83 - MALI
Public Transport
19. Since 1975, public transport services in Bamako have been providedexclusively by the private sector. Two attempts were made by thegovernment to operate bus services in Bamako between 1960 and 1968, andlater between 1970 and 1975. The services were abandoned on both occasionsbecause of the poor financial situations of the companies. One of theprincipal reasons given for the poor performance was the government'sreluctance to grant fare increases. There are now four types of publictransport available in Bamako--dourounis, taxis, SOTRAMA minibuses, andlarge buses operated by Mamadou Atch. This latter service was introducedin March 1985. Fares are the same for all types of service except taxis.The cost of a bus ride on the Left Bank is F.CFA 40--if the passengertraverses the Niger, the fare is F.CFA 50. Taxis are unmetered and chargesare dependent on distance travelled. Three fares are used--F.CFA 80, 160,and 225. The last fare increase was in 1982. The principal problems citedby all operators were, in order of importance: (a) the very poor roadsurface conditions; (b) the lack of spare parts for Japanese vehicles; and(c) the congested traffic conditions on the approaches to the Niger bridgeat peak hours. The majority of vehicles are in reasonable condition. Allpublic transport vehicles have to pass a biannual inspection. Privatevehicles are not subject to the test.
20. Dourounis. This type of service is provided by private operators whobelong to a syndicate. Each syndicate exploits a particular route. Thereare eighteen routes currently serviced. Officials of the syndicate controloperations from the terminal points, making sure that each operator has afare share of the market. Most dourounis are owned by individuals andrented out to a driver who has to provide a guaranteed cash return ofF.CFA 5,000 - 8,000 per day. The driver must pay for the gasoline, and theowner pays for repairs. Each vehicle carries about 200-300 passengers perday. It is estimated by at least two official sources that there are about850 dourounis operating in Bamako. The most frequently used vehicle forthis type of service is a Peugeot 404 converted to carry up to 14passengers. Minibuses carrying up to 18 passengers are also used.
21. Taxis. There are approximately 450 taxis operating in Bamako. Theyare unmetered and mainly operate on the shared ride principle. The driversrent the vehicles and provide a guaranteed cash return to the owners.
22. SOTRAMA. This private company was set up in 1978 to provide servicesalong six routes radiating from a central station next to the Mosque.Forty minibuses were initially brought into service. The company soon gotinto financial difficulties and converted itself into a "dourounis"-typeof organization whereby the company rents the vehicles to the drivers,who provide a guaranteed return to the company. Since 1978 the number ofvehicles has diminished to 29, of which only 10 are operational. Fourtypes of vehicles are used--4 Innos, with a capacity of 40 passengers; 3Renaults with a capacity of 36 passengers; 7 Nissans with a capacity of 30passengers and 15 minibuses (Toyota and Mazda) with a capacity of 15passengers. One of the company's principal problems is maintaining thevehicles and obtaining spare parts. Although the company has a largedepot, there are practically no facilities for repairing vehicles--noteven a covered workshop.
MALI - 84 -
23. Mamadou Atch. In March of 1985 Mr. Atch bought 15 Berliet buses witha capacity of about 100 passengers from the Marseilles Public TransportOrganization. These were vehicles that had been amortized over a period ofeight years and were being replaced. The cost of each bus was F.CFA 1.2million (US$ 2,500) plus an additional F.CFA 3.8 million (USS 8,000) forshipping and import duties. The buses are being run on the main citytraffic arteries and are extremely popular. After two months of operationfour of the buses were out of service awaiting spare parts. Five had beentaken out of service because the operator had tried to charge F.CFA 50instead of F.CFA 40 on services on the Left Bank. The National TransportOffice refused to allow this charge and impounded the five buses operatingon the left bank. According to Mr.Atch the situation would be resolvedwhen the government declared a fare increase. (The last one was in 1982).The buses are operated by paid drivers and conductors. Each bus carriesabout 1000 passengers per day, travels 180 kilometers and brings in F.CFA50,000 per day. Mr.Atch employs 18 drivers, 36 conductors and 12mechanics.
24. Affordability. The average income per household in 1983 was F.CFA62,000 per month. The average household size was 7.2 giving a per capitaincome of F.CFA 8,600 per month or F.CFA 103,000 per year. More than 36percent of households had monthly incomes less than F.CFA 31,000. Themonthly cost of transport for a worker who travelled to and from work bybus from the Right Bank was about F.CFA 2,800, or 9 percent of income forthe lowest paid income group.
Road Network
25. There are approximately 140 kilometers of surfaced roads in Bamako,the majority of which are located in the central area and along the mainradials on the Left Bank. A survey carried out in 1984 on 80 kilometers ofroads showed that 30 percent of the roads required major rehabilitationworks and that a further 36 percent were in need of significantmaintenance. Most of these roads fall under the responsibility of theDistrict and are located around the central area. The best kept roads arethe principal radials, which are maintained by the regional arm ofgovernment. Many of the suburban roads are in very poor condition makingit almost impossible for public transport vehicles to gain access to thelow-income housing areas.
26. Approximately 7 kilometers of surfaced roads have been built inBamako in the last five years (including major rehabilitation works) at acost of F.CFA 550 million, representing an investment of F.CFA 163 perhabitant per year. The road maintenance budget has remained constant overthe past few years at about F.CFA 120 million--hardly enough to carry outroutine maintenance, let alone tackle the major problems of rehabilitationthat are becoming increasingly urgent.
Traffic Conditions
27. The most serious traffic congestion occurs on the approaches to theNiger bridge during the morning and afternoon peak hours (7:00 to 8:00 and14:00 to 15:00). The existing bridge provides two traffic lanes, a bicyclelane, and a pedestrian footpath. The total daily traffic crossing thebridge in 1983 was approximately 20,000 vehicles and 27,000 motorized
- 85 - MALI
cycles. Urgent consideration is being given to the construction of asecond bridge.
28. Elsewhere, traffic congestion is mainly localized around the centralcore, where much of the market activity takes place. The principal causesof congestion are traders and pedestrians taking up part of the roadway,poor organization of the principal junctions, and the narrowness of thestreets (most streets in the central area are only 6.00 meters wide). Thelack of street capacity is further exacerbated by open drains runningalongside the road and a complete lack of footways. Travel conditions atnight are particularly dangerous for pedestrians and motorcyclists becauseof the poor street lighting.
Traffic Management
29. Ten intersections are equipped with traffic signals, of which abouttwo-thirds are in working order. The signals are poorly located and thephasing and timing could be improved in most instances. Maintenance ofsignals is carried out by the national power utility company. There is anoticeable lack of traffic signs and road markings. The most conspicuousand well kept signs are those placed by the public transport operators tomark bus stops. Much greater use could be made of one-way streets toassist traffic flow. Where these have been introduced, traffic isnoticeably more free flowing.
30. Parking on the main thoroughfares is prohibited and most roads areclearly marked with signs. The police appear to be quite vigilant inenforcing the regulations. The parking of public transport vehicles at theterminal points is quite well organized and fees are collected by theDistrict.
31. Several recent studies have been undertaken to develop a ten-yearinvestment plan and a traffic improvement program for Bamako. These haveculminated in the prepartion of a transport component to be included inthe World Bank's urban development project.
Responsibilities
32. The principal agencies involved in the urban transport sector are theMinistry of Transport and Public Works, the District of Bamako, and theTraffic Police Department (Compagnie de Circulation).
33. Ministry of Transport and Public Works. The National Directorate ofPublic Works within the MTPW is responsible for plannning, designing,constructing and maintaining the road system, and it also supervisestechnical studies. Road maintenace is carried out through the eightregional directorates, one of which is responsible for the maintenance ofthe national and regional road network in Bamako. The National TransportOffice is responsible for all matters relating to the regulation andsafety of the road transport sector. Its responsibilities include vehicleregistration, licensing, and inspection; driving tests; and the setting offares and tariffs. The NTO is also responsible for the formulation of roadtransport policy and its implemetation.
MALI - 86 -
34. District of Bamako. The Technical Services Department of theDistrict is responsible for the maintenance of the secondary and localroads of the communes that make up the District. The resources devoted tothis activity in terms of manpower, finance, and equipment are completelyinadequate for the city's needs. A Transport Office was created by theDistrict in February 1984 to be responsible for the day-to-day managementof the traffic and transport system. The office has two sections, oneresponsible for studies and planning and one responsible for operations,including traffic signs, signals, and road markings. Most of the 48persons employed are assigned to the public trasport terminals for controland revenue collection. Although a good start has been made by thisoffice, particularly with regard to public transport organization and datacollection, the senior staff of the office are relatively inexperiencedand need some technical guidance.
35. Traffic Police Department. The TPD consists of 200 officers, 30motorcycles and two cars. Only 20 of the motorcycles are operational. TheTPD is responsible for traffic control and the enforcement of regulations.There are eight local police stations in Bamako, which are responsible foraccident reporting. The TPD's interventions are limited due to a lack ofequipment. High on the list of requirements are two tow trucks, to removebroken down vehicles from the bridge and badly parked cars, additionalsmall cars, luminous traffic signs, and additional traffic signals.
- 87 -
URBAN TRANSPORT SITUATION IN NIGERIA: LAGOS, IBADAN, AND OTHER CITIES
SUMMARY
Urban Transport Overview
1. The massive investment program in new infrastructure that was undertakenin the late 1970s using revenues from oil has enabled Nigeria to develop aprimary road network that serves the needs of the nation. The major roadconstruction program in Lagos has had a major impact on the traffic situationbut has failed to completely eliminate traffic congestion in the high densitytravel corridors linking Lagos Island to the mainland. Traffic congestion isalso still endemic at key intersections and public transport transfer pointson the secondary road network. It is noticeable, however, that trafficcongestion is gradually decreasing in Lagos due to a reduction in trafficvolumes, improved enforcement of parking regulations, and the implementationof a limited number of traffic management improvement schemes. Elsewhere,traffic congestion can be found in all urban areas. Much of the congestion iscaused by unsatisfactory road surface conditions and poor utilization of roadspace.
2. The economic recession that began to take hold in 1982 has had two majorimpacts on the urban transport sector. First, it has caused a reduction intraffic volumes through higher ownership charges and user costs, andsecondly, it has reduced the availability of public transport vehicles.Public transport operator costs have risen considerably over the past fouryears, but fares have remained the same. These effects have been mitigated toa certain extent by the private operators shortening the length of their farestages. The Lagos State Transport Corporation, because of its officialstatus, has been unable to shorten its stages, and consequently it is stillusing the fare levels initiated in 1978.
Needs and Issues
3. The first and most basic need is for the state authorities to focustheir attention on improving the efficiency of the existing road network andtransportation system. This will require increased expenditure on trafficmanagement, secondary road rehabilitation and construction, and roadmaintenance. Public transport priority programs should figure largely amongthe traffic management schemes, particularly in the vicinity of publictransport terminals. In Lagos, attention should also be given to makingmedium-term plans for the development of a mass transit system.
4. Considerable scope also exists for further demand management measures inLagos involving the raising of parking charges on Lagos Island. Supplementarycharges for vehicles entering or leaving the car parks during peak hoursshould be considered. Such measures, introduced in conjunction with publictransport improvements and designated busways or lanes on the bridges leadingto Lagos Island, could have a significant impact on traffic congestion.
5. These improvements, which are heavily management oriented rather thancapital intensive, can only be implemented in the short-term throughsignificant strengthening of the Transportation Directorate of the LagosState Ministry of Public Works and Transport. Staff expansion and trainingare therefore immediate priorities.
NIGERIA - 88 -
5. Other important issues that need to be resolved in the short-terminclude: (a) the need for a detailed study of the financial requirements ofthe operators of public transport services; (b) the rationalization ofresponsibilities for traffic management on federal roads within Lagos State;(c) the justification for the completion of the Third Mainland Bridge and areview of traffic forecasts; and (d) a review of policy with regard to thefuture of ferry services.
Bank Role and Strategy
6. The Bank could play a significant role in the urban transport sector inNigeria through projects and policy studies. There are two urgent issueswhich need to be tackled in the urban transport sector. These are: (a)traffic congestion; and (b) public transport supply. Further issues that needto be addressed in Lagos include; (c) the division of responsibilities fortraffic management between federal and state government; (d) the need for thecompletion of the Third Mainland Bridge; and (e) the role of the ferryservices.
7. Project components should focus on:; (a) traffic management, emphasizingpublic transport priority schemes; (b) secondary road upgrading andconstruction; and (c) institutional development giving particular emphasis totraining. The policy studies should be strongly directed towards developingan economically viable public transport system (both private and public) andthe introduction of further demand management measures to reduce trafficcongestion. Of particular importance is the need to introduce higher busfares and parking charges.
- 89 - NIGERIA
I. NATIONAL PERSPECTIVE
Urbanization
8. Nigeria is the largest country in West Africa, housing more than halfthe region's population. It is situated between four and 13 degrees north ofthe equator on the Atlantic Coast. Nigeria is bordered by Benin to the west,Niger to the north, and Cameroon to the east. The country covers an area of923,800 square kilometers and had an estimated population of 90 million in1982. The last census was taken in 1963, when the population was 56 million.The population growth rate between 1973 and 1982 was 2.6 percent. The averagepopulation density in 1982 was 9.7 persons per square kilometer.
9. In 1980 the urban population in Nigeria was about 25 millionrepresenting 30 percent of the national total. The urban sector has beengrowing at a rate of about 7.0 percent per annum, and the urban population isexpected to reach 75 million by the turn of the century when about a dozencities will have a population of more than 1 million. The largest urbancenter is Metropolitan Lagos, with an estimated 1985 population of about 6.3million. It is also the largest urban center in West Africa. Other importantcities include Ibadan with a population of about 2.7 million, and Kano, witha population of about 1.2 million.
10. Migration, which accounts for a large proportion of the urban growth,has had a major impact on the growth of Lagos. Migration, both from withinthe country and from neighboring countries, is primarily a consequence of theoil boom experienced in the late 1970s. As a result, Lagos has been growingat a staggering 8-9 percent per annum. The recent downturn in the economyhas reduced migration and the population is now expected to increase at alower rate of about 4.6 percent, reaching about 12 million by the year 2000.
The Transport Sector
Road Network
11. Nigeria's road network comprises some 113,000 kilometers of roads ofwhich 31,780 kilometers (28 percent) are paved. More than 70 percent of thefederal road network is paved while only 40 percent of state roads are paved.The road density averages 12.26 kilometers per 100 square kilometers. Table1.1 presents a breakdown of road lengths by category.
Vehicle Fleet
12. The official estimates of the national vehicle fleet are somewhatunreliable because the number of scrapped vehicles is not known. It hasbeen estimated from the number of new vehicle registrations that between 1976and 1982 the number of vehicles doubled (growing at annual rate of 12.5percent). It was further estimated that there were some 353,000 vehicles incirculation in 1982. Since that time actions taken by the government tocombat the economic recession have caused the number of new registrations todecrease dramatically.
13. Nigeria has one of the worst road accident records in the world, trafficfatalities run about three times higher than in other West African countriesand some sixty times higher than industrialized countries of the West. Roadaccidents account for more deaths than all major communicable diseasescombined and represent an economic cost that may well exceed Naira 500million per year. The number of accidents and fatalities over the period1980-83 are shown in Table 1.2. Comparable data for the period August 1984 -July 1985 are also provided. It would appear that the decrease in accidentsover the period 1983 - 1984/85 is probably due to a decrease in trafficlevels rather than an improvement in the safety situation. The number ofdeaths per 10,000 vehicles in 1980 was estimated at 141. The number of deathsper 100,000 population was 10.4. Approximately 8 percent of all accidents and6 percent of fatal accidents occurred in Lagos State.
14. The current economic difficulties in Nigeria have had a major impact onthe road transport sector, resulting in a decline of road transport activity.Between 1982 and 1985 national fuel consumption fell by 21 percent. Sales offuel in Lagos State fell by 12 percent over the same period. The introductionof a Second-tier Foreign Exchange Market (SFEM) has caused a significantincrease in vehicle prices and spare parts. The cost of a standard saloon carassembled in Nigeria increased from about Naira 17,000 to Naira 65,000. Thecost of imported vehicles has risen similarly.
- 91 - NIGERIA
15. Another factor contributing to the decline in road transport activity wasthe doubling of fuel prices in January 1986. The pump price of petrol went upfrom 20.00 kobo per liter (US$0.25 per gallon) to 39.50 kobo (US$0.50 pergallon) and the price of diesel increased from 11 kobo (US$0.14 per gallon)to 29.50 kobo (US$0.37 per gallon). This large increase was intended toeliminate subsidies and bring Nigerian prices into line with internationalprices. However the impact of SFEM in 1986 instead prompted a 60 percentsubsidy on domestic petroleum. It is now anticipated that a further increasein fuel prices will be introduced in 1987, which could increase super anddiesel pump prices to about 63 and 47 kobo per liter (US$0.79 and US$0.59per gallon) respectively.
16. The introduction of the SFEM and increased fuel prices will have a majorimpact on personal mobility and travel demands in urban areas as well asincreasing the costs of freight and passenger transportation. The economicrecession has caused the number of new vehicle registrations to decline byabout 48 percent over the period 1983 to 1986. Further reductions can beanticipated as a result of the SFEM, and existing vehicles are likely to beused less while fuel costs remain high. During the 'boom years" of 1981 and1982 there were more than 70,000 new vehicle registrations per year in LagosState; in 1986 there were only 20,000. Since the expected life of publictransport vehicles is about four-to-five years, the vehicles purchased in1981 and 1982 are now reaching the end of their useful lives. It is,therefore, very likely that the rate of vehicle replacement will besignificantly lower than the rate of scrapping, causing a reduction in theavailable vehicle fleet. This will result in a rapidly developing publictransportation crisis. The number of public transport vehicles will decreasesignificantly during 1987 and the demand for public transportation willincrease (through population increases and families that are now unable tosupport the costs of owning and running a private vehicle). Some of thebenefits of this situation will be reduced traffic volumes and a decrease inthe consumption of fuel--leaving more petroleum available for export. Thepresent charges for registration, licensing, etc. are given in Table I.3.These charges vary according to vehicle weight and were last increased in1983.
17. The buoyant oil market during the 1973-80 period dramatically shiftedNigeria's economy from dependence on the agricultural sector to almostcomplete dependence on the oil sector. By the beginning of the 1980s, oilearnings accounted for 96 percent of exports and over 80 percent of federalgovernment revenues, while the agricultural sector's share of non-oil GDPfell from around 50 percent in the early 1970s to 30 percent by 1980.
NIGERIA - 92 -
18. Reaction to the abrupt end of the oil boom in 1981 by the federal andstate governments was slow and measures taken to curb and redirectexpenditures were insufficient. Consequently, sizeable external and fiscalimbalances emerged. The gradual deterioration of the economy led thegovernment to undertake major policy reforms in 1986 and begin the process ofstructural adjustment. Nigeria has now formulated a growth-orientated,medium-term policy package, including the establishment of a substantialsecond-tier foreign exchange market, diversification of the economy, reformof the parastatals, and the promotion of the private sector. These policiesare having a major impact on the urban transportation sectcr, mainly throughincreased costs. If current levels of transport supply are to be maintained,significant increases in tariffs and/or reductions in taxea and duties willbe necessary in the short term. The GNP per capita in 19a2 was US$850.
- 93 - NIGERIA
II. LOCAL PERSPECTIVE
City Form and Constraints
19. There are currently three cities in Nigeria with populations in excessof 1 million. The largest of these is Metropolitan Lagos, with an estimatedpopulation of about 6.3 million in 1985. Ibadan and Kano with estimatedpopulations of about 2.7 million and 1.2 million, respectively, are Nigeria'ssecond- and third-largest cities. Both Lagos and Ibadan are situated in thesouth-west of the country. Lagos is located in Lagos State, the smallest ofNigeria's 19 states, and contains approximately 90 percent of the state'spopulation. It is the principal port and industrial center of Nigeria.Although it will soon lose its capital city status, when the new capital iscompleted at Abuja, it will undoubtedly remain the country's principaleconomic, industrial, and commercial center. It currently accounts for 50percent of the country's industrial, business and other activities, and 60percent of modern employment is located in the metropolitan area.
20. Metropolitan Lagos is located on low-lying terrain that rises from theocean to a maximum height of 50 meters. The majority of the population livein poorly serviced areas that are subject to flooding during periods of heavyrain. Population densities vary from 1000 per square kilometer in Ikoyi to21,500 in several of the large, low-income areas. The average density isabout 3,800 persons per square kilometer within the Metropolitan area, whichcovers approximately 1,640 square kilometers. Metropolitan Lagos is made upof five local government areas - Ikeja, Lagos Island, Lagos Mainland, Mushin,and Somolu.
Transport Demand
21. The population of Metropolitan Lagos grew from 1.06 million in 1963 (atthe time of the last population census) to an estimated 6.3 million in 1985at an annual growth rate of about 8 percent per annum. Because of theeconomic recession the level of migration to Lagos is expected to decreasesignificantly in the coming years. Consequently a much lower growth rate isexpected (in the region of 4.5 percent). Even so the population ofMetropolitan Lagos is forecast to reach 12 million by the year 2000. It isexpected that this growth will mainly take place in the north and south-west.
22. The size of the vehicle fleet operating in the Lagos area is not knownwith any degree of accuracy. A recent estimate (1986) based on new vehicleregistrations and licence renewals put the fleet at a about 135,000 vehicles,of which about 67 percent are private cars, 7 percent are taxis, 18 percentare pick-ups and trucks, and 6 percent are various types of buses. Othermodes represent about 2 percent. The number of new vehicle registrations inLagos State between 1982 and 1986 is shown in Table II.1. The rapid decreasein new registrations was caused by the economic recession. The number ofvehicles in circulation has been decreasing since 1982, and this trend isexpected to continue for at least two-to-three years. The level ofmotorization is about 21 vehicles per 1000 inhabitants and is graduallyfalling. Motor cycle registrations fell from 9,000 in 1983 to 1,200 in 1986.
NIGERIA - 94 -
Table II.1 New Vehicle Registrations in Lagos State
23. Public transportation services in Metropolitan Lagos currently accountfor about 65 percent of motorized trips. Services are provided by both publicand private operators. The proportion of trips carried by the publicoperators represents less than 10 percent of the total public transporttrips. The public operators include the Lagos State Transport Corporation(LSTC), the Lagos State Ferry Services Corporation, and the National RailwaysCorporation. Private companies operate three types of public transportvehicles: danfos (12-16 seater minibuses), molues (30-40 seater buses), andbolekajas (40-seater wooden-benched buses built on a lorry chassis). Inaddition, there is a large fleet of taxis. The number of vehicles currentlyin operation has been estimated as follows: taxis, 11,000; danfos, 2,000-3,000; molues 1000; and buses, 640.
24. Entry into the public transport market is open to anyone who has a road-worthy vehicle and can produce a driving license. After registering thevehicle, a hackney permit is obtained from the Central Licensing Authorityfor a designated route. Because of a lack of enforcement, operators are freeto operate their vehicles on any route they wish and compete freely with thepublic operator. All privately operated buses are hired out to a driver, whomust provide a fixed amount to the owner at the end of his shift. Currentrates per shift for danfos and molues are between Naira 60-80 and 90,respectively. Total revenues per day are about Naira 260 and 300 for thesetwo types of vehicle. Most vehicles operate on two shifts per day. Thedrivers are responsible for fuel costs and the owner is responsible formaintenance and repairs. The total fleet is made up of many small operatorsand owner/drivers. Fares are set by the licensing authority for each routebased on distance. Official fares are either 10, 20, or 30 kobo. Becausefares have not been reviewed since 1978, private operators have reduced thelength of the stages corresponding to the three fares. LSTC has not been ableto follow suit and is effectively providing a service at about half thecharge of the private operators. Taxis are unmetered and fares are chargedbased on a zonal system. Government has recently taken steps to consolidatethe various owner and driver unions in order to reach a more meaningfuldialogue with the operators.
- 95 - NIGERIA
25. LSTC. The history of the Lagos State Transport Corporation dates backto 1958 when the Lagos City Council acquired a fleet of privately ownedbuses. LSTC currently operates 540 buses, of which 317 are awaitingrehabilitation or reconditioning. The average daily turnout is currentlyrather low, at about 215 buses (40 percent), with an additional eightundergoing routine maintenance. It is planned to increase the turnout toabout 540 buses by carrying out an extensive program of rehabilitation in1987. The corporation operates 420 services on 126 routes and uses threetypes of buses, all manufactured by Daimler Benz--Model 1617 (12 meter buses)with a capacity of 78 passengers operated by a two-man crew; Model 1313(medium-sized buses) with a capacity of 74 passengers, one-man operated, and;Model 608D (minibuses) with a capacity of 25 passengers, one-man operated.Buses run on two shifts, 06:00 to 14:00 and 14:00 to 22:00. LSTC has threedepots and 20 terminals. The average working life of a bus is about fiveyears. LSTC employs 1,650 staff, or about 7.6 staff per operating unit.
26. Because of a lack of investment and poor maintenance, the number of busesin service per day had fallen from 245 in 1980 to about 70 in 1985. The stategovernment provided finance for 278 buses that were purchased in 1986. As aresult, the average monthly revenue has increased from about Naira 685,000 toover 1,160,000 (November 1986). Total revenues in 1984 and 1985 representedbetween 42 percent and 45 percent of operating costs. Revenues increasedsignificantly in 1986 and represented 58 percent of operating costs. Totallosses over the period 1984 to 1986 varied from Naira 4.8 million to about8.4 million. The most important issues that LSTC now facea are: (a) improvingthe proportion of the fleet in service by carrying out a major program of busrehabilitation and improving maintenance activities; (b) initiating a programof bus replacement and fleet expansion; and (c) rationalizing the financialsituation through instituting procedures for annual fare reviews and thegradual elimination of subsidies.
27. Ferry Services. The Lagos State Ferry Services Corporation operates twoboats between Apapa and the Marina on Lagos Island, carrying about 650passengers per day. The fare is 30 kobo. In the mid 1970s six boats wereoperated on the same service, carrying more than 4.3 million passengers peryear. The service is now more expensive that the equivalent bus journey andtakes longer. Revenues cover less than 20 percent of operating costs.
28. Railway Services. The National Railways Corporation operates a workmanshuttle service between Apapa, Agege, and Oshodi and between Iddo, Agege, andOshodi. About 26 suburban trains operate daily carrying about 176,000passengers. The trains are overcrowded and the carriages are in poorcondition. Of the 550 coaches needed to meet the current needs, only 440are available and 80 percent of them are more than 20 years old. With therapid expansion of the city away from the linear rail path, the rail systemis unable to meet the demands of long-distance commuters. As part of thelong-term measures for improving public transportation, the state governmenthas been involved in two abortive attempts to develop a new metropolitan railsystem making use of the existing rail rights-of-way. A third study is aboutto begin which will briefly examine mass transit options and then move on tofeasibility studies and detailed design.
NIGERIA - 96 -
Road Network
29. A recent survey has shown that there are 2,808 kilometers of roads inLagos State, of which 37 percent are surfaced. The local government areas ofIkeja, Lagos Island, Lagos Mainland, Mushin, and Surulere which make up theLagos Metropolitan area have 1300 kilometers of roads of which 44 percent arepaved. Road provision is rather low at approximately 2.2 kilometers of roadand 0.95 kilometers of surfaced road per 10,000 inhabitants. The condition ofthe road surfaces is very variable. The state government has been steadilyincreasing its expenditures on road maintenance and secondary roadconstruction. In 1986, 54 kilometers of road were rehabilitated and 46kilometers of new road were constructed. In addition, local governments inthe state constructed more than 154 kilometers of road in the same year. Themajor drawbacks with the present road system are: (a) the lack of a roadnetwork hierarchy; (b) the lack of adequate secondary and access roadnetworks; and (c) poor geometric design and lack of traffic management. Thesefactors, together with poor road surface conditions and inadequate drainagein high-density areas, contribute significantly to the high levels of trafficcongestion that are particularly apparent at peak travel periods.
Traffic Conditions
30. Traffic conditions in Lagos have improved significantly over the pasttwo to three years as a result of stricter parking enforcement, the work ofthe task forces on environmental sanitation and abandoned vehicles, and theimplementation of some traffic management schemes. But traffic delays stillfall beyond acceptable limits, particularly on the approaches to LagosIsland. Significant delays also occur in the vicinity of public transportterminals and interchange points. Traffic volumes on some links of the mainroad network are as high as 50,000 - 80,0000 vehicles per day. The lack ofadequate secondary road networks also contributes to these high flows.
Traffic Management
31. Traffic management as a tool to alleviate traffic bottlenecks andenhance system capacity has not been used in any systematic manner in Lagos.During the last year or two, several schemes have been introduced that haveimproved traffic flow. While the design of these schemes is basically sound,much more attention needs to be paid to detailed implementation, includingprovision for pedestrians and buses. The 27 sets of traffic signals on LagosMainland are being reasonably well maintained by the Ministry of WorksTraffic Section. However, on Lagos Island, which the Federal Ministry ofWorks regards as its "territory" none of the 29 sets of signals are inworking order. There is a noticeable lack of traffic signs and road markingsthroughout the metropolitan area, and street lighting is still nonexistant orvery poor in many areas. Significant improvements could be made to trafficflow throughout the metropolitan area through the comprehensive use oftraffic management measures. Much could also be done to improve publictransport travel speeds through the use of bus priority treatments.
- 97 - NIGERIA
32. Efforts made by the police, the state government and the localauthorities in towing away and immobilizing vehicles have been verysuccessful. Tougher penalties against abandoned vehicles have also reducedthe incidence of obstruction and contributed to improved safety conditions.This positive enforcement action has also increased revenues for theauthorities concerned. Close to Naira 2 million was collected by the statefrom owners of vehicles that had been towed away in 1985.
33. Despite these positive steps, and the introduction of the odd/evennumber plate restriction for vehicles approaching Lagos Island, trafficdelays are still excessive. The simplest and most effective tool available toreduce congestion levels is parking charges. The present parking charge onLagos Island of 50 kobo per day is extremely low. The standard price shouldbe increased and a supplementary charge made for vehicles entering or leavingcar parks during the peak travel hours. This would have an immediate impacton traffic congestion and would encourage drivers to spread their journeysinto the off-peak periods.
Responsibilities
34. Strictly speaking, urban transport planning in Nigeria is a state andlocal government affair. However, given the duality of Lagos as a federal andstate capital, the federal government has always participated in theconstruction of road infrastructure and maintenance of all expressways andsome arterial roads. The financial, administrative, and legislativeresponsiblity for all other major roads and for all traffic regulations arevested with the state government. The local governments, are generallyresponsible for the maintenance of local roads but a substantial part of thebudgets used for this purpose are derived from the state. The construction,maintenance, and control of motor vehicle parks (bus terminals) is carriedout by the local governments, while the Lagos State Parking Authority, underthe supervision of the Ministry of Works and Transport, is in charge ofpublic car parks. The local authorities also carry out vehicle licensing,registration, and renewal as well as the issuing of driving licenses.Registration and renewal of license and hackney permits for commercial busand taxi operators is carried out by the Central Licensing Authority of LagosState--a parastatal under the State Ministry of Works and Transport.
35. The principal agency involved with traffic and transport planning at thestate level is the Ministry of Public Works and Transport. The ministry isdivided into two directorates--Civil Works and Building and Mechanical,Electrical and Transportation (MET). Four units are concerned withtransportation in the MET directorate--Traffic Signals, Traffic Planning,Ferry Services and Mass Transit. These units report to the chieftransportation engineer and his assistant. Although the Traffic Signal andTraffic Planning units are small, they employ some well qualifiedprofessionals. The early strengthening of these units, to expand theircapabilities to plan, design, implement, and monitor traffic management andtransportation improvement schemes should be an important priority.
NIGERIA - 98 -
36. The control of traffic and enforcement of traffic regulations are vestedin the men and women of the Nigerian police and the traffic wardens employedto assist them. In addition, the state government also utilizes officials ofthe State Parking Authority to apprehend and fine parking offenders. TheMotor Vehicle Department of the National Police Force is responsible for alltraffic control matters and is also involved in reporting traffic accidentsand compiling accident statistics.
- 99 - NIGERIA
III. IBADAN AND OTHER CITIES
Ibadan
Urbanization
37. Ibadan is the capital of Oyo State and the second largest city inNigeria. The metropolitan area of Ibadan is made up of four local governments--Ibadan, Akinyele, Oluyole, and Lagelu. Approximately 85 percent of thepopulation lives in the municipality of Ibadan. The 1985 metropolitanpopulation has been estimated by various researchers and falls in the rangeof 2.0-to-2.75 million. Ibadan municipality covers an area of 452 squarekilometers and has an average population density of about 4,500 persons persquare kilometer. The largest proportion of Ibadan residents (about 45percent) live in the core area, which is the traditional center of the city.A further 25 percent live in the core extension area. Both of these areas aremade up of very old housing with few modern amenities and very few roads.
Traffic Demand
38. The vehicle fleet operating in the Ibadan metropolitan area in 1981 wasestimated to be about 62,000 vehicles comprising: 50,000 private cars, 5,300taxis, and 6,800 buses and commercial vehicles. Since that time the number ofnew vehicle registrations has fallen dramatically (see Table III.1). and thevehicle fleet appears to have decreased. The decrease has affected allvehicle types, particularly buses. The proportion of new buses compared toother vehicles fell from 30 percent in 1981 to 19 percent in 1983, theproportion of cars increased from 57 to 71 percent. Figures for more recentyears are not available. In 1981 there were about 34 vehicles per 1,000population. The level of motorization has since fallen to about 25 vehiclesper 1,000 population.
Table III.1 New Vehicle Registrations in Ibadan and Oyo State
39. It has been estimated that approximately 54 percent of all motorizedschool and work trips are made by public transport: 38 percent by car, 6percent by motorcycle, and 2 percent on other modes. Because of thedifficult economic situation, the number of buses is not keeping pace withincreasing demand. To enable more buses to be kept on the road, the governorhas temporarily granted a waiver on the inspection of public transportvehicles. As a result, the condition of buses has significantly worsened.
NIGERIA - 100 -
Traffic Accidents
40. The number of accidents recorded in the state has been steadily fallingat a rate of 12 percent per year since 1982. According to the police, this isdue to a decline in traffic volume caused by fewer vehicles and higher fuelcharges. On this basis State-wide traffic would appear to have decreased byabout 40-50 percent in four years. The accident statistics for Ibadan and thestate are given in Table III.2
Table III.2 Accident Statistics for Oyo State and Ibadan
41. Public transportation in Ibadan is provided by danfos (12-16 seaterminibuses) and shared-ride taxis. All these vehicles are privately operated.The economic situation, and in particular the introduction of SFEM in 1986,has had a marked impact on the number of new vehicles purchased in the pastfour years. The number of newly registered minibuses in Ibadan fell from2,156 in 1981 to 717 in 1983. Numbers have continued to decrease since 1983,but precise data are not available. The state government is very concernedover the transport supply situation and is initiating studies to examinevarious possibilities for setting up a privately operated bus company with asmall participation by the state. A previous attempt to set up a public buscompany failed in 1976 after about seven years of operation. The stategovernment is also beginning to give consideration to creating a suburbanrail service along the existing national rail right-of-way.
Road Network
42. The road network of Ibadan is made up of 118 kilometers of main roads,of which about 20 kilometers are expressways. These are maintained by thestate which also maintains 264 kilometers of local roads in governmentreservation areas. The Municipality of Ibadan maintains 205 kilometers ofsecondary and access roads, of which about 75 percent are paved. Roadprovision is well below accepted norms, particularly in the core area whereless than 5 percent of the surface area is devoted to roads. There are,therefore, large plots serviced by a single arterial or collector road. Manyroads are in a very poor state of repair. The worst sections of road are inthe core area and at road junctions. The principal cause of the numerous
- 101 - NIGERIA
potholes appears to be poor drainage. In many instances the drainage channelsare blocked with refuse, in other areas they are silted up with earth. Thelack of regular maintenance has been principally a problem of lack of funds.Recent initiatives taken by the state government have led to increasedexpenditures on the maintenance of roads in Ibadan. This change in emphasisfrom capital to recurrent works is long overdue and should have a markedimpact on the road network if the higher investment levels can be maintainedover the coming years. Additional funds have also been devoted to improvingstreet lighting in Ibadan.
Traffic Management
43. There is great scope for traffic management improvement throughoutIbadan, and particular at key intersections and the six main bus terminals.There are about seven sets of traffic signals in Ibadan but none of them arein working order. Traffic signs and lane markings are also lacking. Two citycenter car parks have helped reduce on-street traffic congestion, but thetraffic police are limited in their enforcement efforts by a lack ofequipment. They currently operate two tow trucks with a total capacity ofabout 12 vehicles per day.
Responsibilities
44. The principal agencies involved in the urban transport sector are theState Ministry of Works and Transport, the Ibadan Municipal Council and theMotor Transport Department of the National Police. Various unions andassociations are involved in the provision of public transport services. TheFederal Ministry of Works plays a minimal role within the municipal boundary.Although the State Ministry of Works and Transport has the capacity to carryout road maintenance and traffic management, it has not been active in theseareas. However, in the past two years the budget allocated to roadmaintenance in Ibadan has significantly increased and considerableimprovements have been made. The work of the Ibadan Public Works Departmenthas also been limited by lack of funds. Significant strengthening of theMinistry of Works and Transport is needed in the areas of traffic managementand transport planning as well as expansion of both the state and municipalbudgets allocated to road maintenance. This strengthening should be carriedout through increased training and a limited amount of expatriate technicalassistance.
Enugu
45. Enugu has a current population of about 500,000 and is the seat ofGovernment of Alhambra State. It is estimated that there are approximately10,000 - 15,000 vehicles operating in the city. Public transport is providedexclusively by the private sector.
46. Although a few major road intersections are controlled either by wardensor traffic signals, there is generally a lack of traffic management, trafficsigns and road markings. Traffic congestion occurs in the central area andalong the main traffic corridors during peak periods. Considerableimprovements could be achieved by the introduction of some basic trafficmanagement measures. The road network includes a number of expressways whichare underutilised.
NIGERIA - 102 -
47. In line with practice throughout Nigeria, responsibility for roads isdivided between the federal, state and local governments. There is goodcooperation between these agencies, but a general lack of physical andfinancial resources results in insufficient attention to either trafficmanagement or road maintenance.
48. Public transport in Enugu is provided by about 100 buses, 600 minibusesand 300 taxis. There are no government restrictions on entry into the market,but buses are licensed for specific routes. Enforcement is undertaken bylocal government vehicle inspectors, and there is a significant element ofcontrol of routes by unions. Fares are set by local government in liaisonwith the unions. As in Lagos and Ibadan, the bus fleets are diminishing dueto the lack and high cost of spares and replacement vehicles. With a minimumof additional control and more readily available vehicles and spare parts,the situation could be improved significantly.
Onitsha
49. Onitsha, a major secondary city of Alhambra State, has an estimatedpopulation of about 550,000. There are roughly 10,000 vehicles operating inthe city, of which about 1,000 are public transport vehicles. Unlike Lagosand Enugu, Onitsha has very few expressways. Most roads are narrow, in verypoor state of repair and heavily congested. The poor traffic conditions areexacerbated by indescriminate loading and unloading of trucks and buses. On anumber of four-lane roads traffic is reduced to one lane because of parkingand potholes. The city of Onitsha appears not to have benefited from the samelevel of investment in infrastructure as Enugu.
50. Traffic management and road maintenance are very poor. Large squads ofpolice and traffic wardens are evident at a number of locations, but they areprimarily occupied with examining vehicle and freight papers rather thattraffic control. Much could be done to improve traffic flow through roadmaintenance and traffic management. An essential prerequisite would be theimprovement and strengthening of traffic control and enforcement by thepolice.
51. As in Enugu, public transport comprises private sector buses, mini-buses, and taxis. While access to the market and the level of fares are notsubject to government regulation, there is evidence that the powerful motortransport workers union exercises control over fares and routes. Neverthe-less, a large number of nonunion minibuses from outside areas operate withinthe city and thus provide an element of competition. Representatives of thebus operators complain of police harassment and of the lack of properterminal facilities. A number of basic bus parks are provided by localgovernment in return for a fee. As in the case of Lagos, Ibadan, and Enugu,there is a lack of spare parts and replacement buses, but there is alsoconsiderable scope for improvement.
- 103 -
URBAN TRANSPORT SITUATION IN SENEGAL: DAKAR
SUMMARY
Urban Transport Overview
1. Despite the fact that the transport situation in Dakar has been thesubject of several studies, including the recently published TransportPlan, very little has been done to implement physical improvements to thetransport system. The main causes of the inactivity appear to be: (a) alack of funds; and (b) difficulties in coordination between the variousagencies concerned. This latter problem appears to be in the process ofbeing resolved through the inter-ministerial committee that has been setup to review the work of the Traffic Management Unit and the preparationof the Priority Action Program. The preparation of a transport componentfor the Bank's proposed Third Urban Development Project has also meantfurther work for the committee in selecting priorities for investment. Thethird urban project will also provide some funds for the implementation ofa modest program of improvements.
2. One of the major benefits of the studies has been that the governmentauthorities have been able to formulate a short-term policy for urbantransport that has a solid base. This policy mainly focuses on publictransportation. It proposes: (a) the implementation of a suburban railsystem based on the existing double track line between Dakar and Thies;(b) maintaining the current balance of services provided by SOTRAC and thecar rapides (minibuses); (c) progamming of infrastructure investments toincrease the speed of buses; and (d) expansion of the primary roadnetwork. Initial studies for the suburban rail system show that it iseconomically justifiable and that the total cost is relatively lowcompared to similar systems elsewhere. The majority of the costs are fornew rolling stock.
Needs and Issues
3. The first and most basic transport need in Dakar is to improve theefficiency of the existing road system and the productivity of existingpublic transport modes. These needs have a much higher priority than theconstruction of major new roads. Very significant gains could be obtainedthrough the implementation of comprehensive traffic management measures:(a) in the Plateau area; (b) along the principal traffic corridors; and(c) at key intersections. Public transport would benefit greatly from theimplementation of busways and bus lanes along the most heavily usedsections of the road network. At the same time a vigorous program of roadmaintenance and rehabilitation should be started to improve the secondaryroad network, in particular along important bus routes and access roadsinto high density areas. Attention should also be focused on theorganization of SOTRAC, the range and types of services it offers and onthe rationalization of the existing fare structure. The principalobjective would be to make the company more financially sound and toeliminate the need for annual subsidies. Considerable scope also existsfor eliminating traffic congestion by improving the enforcement of parkingregulations and the elimination of street trading at traffic bottlenecks.The possibility of staggering working hours should also be examined as ameans of reducing the peak hour traffic demands. Eliminating the long
SENEGAL - 104 -
lunch break could significantly reduce the consumption of fuel by privatecars.
4. The impact of these relatively low-cost measures could be verysignificant, resulting in higher capacities, bus productivity gains, andimproved safety. The increases in bus productivity should have abeneficial effect on keeping costs, and hence fares, down. Only when thesemeasures have been taken should attention be focused on capital intensiveimprovements to improve capacity. However, the proposed urban rail lineappears to be a very valid addition to the existing transport system anddetailed feasibilty and design studies should be actively pursued.
Bank Role and Strategy
5. Although there is intense competition for the use of Bank funds inthe various urban sub-sectors, the critical importance of Dakar to theeconomy of the country and the significant role that transport plays,makes it imperative that future Bank lending should not forgo theopportunity to address the most important needs of the urban transportsector. In this respect the Bank's strategy should give emphasis to low-cost, high-impact efficiency improvements and productivity improvementscombined with institutional strengthening in traffic management and roadmaintenance. The Bank also has a role to play in improving publictransport operations through the financing of detailed policy and planningstudies aimed at improving the financial performance and service provisionof SOTRAC. Facilitating access to short-term finance to assist theoperators of car rapides to replace and expand their fleet may also be apotential area of Bank involvement.
- 105 - SENEGAL
I. NATIONAL PERSPECTIVE
Urbanization
6. Senegal, a country of the Sahel region, is located between 12 and 16degrees north of the equator on the coast of West Africa. It is borderedby Mauritania to the north, Mali to the east, and Guinea and Guinea Bissauto the south. The country completely encircles Gambia. Senegal covers anarea of 197,000 square kilometers and had an estimated population of 6.03million in 1982. The population growth rate between 1973 and 1982 was 2.7percent. The average population density in 1982 was 30.6 persons persquare kilometer, making it one of the most densely populated countries inWest Africa.
7. In 1981 the urban population in Senegal was about 1.9 millionrepresenting 32 percent of the national total. The urban sector has beengrowing at a rate of about 4.4 percent per annum. The urban population isexpected to reach 4.3 million by the turn of the century, representingabout 43 percent of the population. The largest concentration of urbanpopulation is in the Cap Vert region, which includes Dakar. Over 75percent of the urban population lives in this region. Cap Vert coversabout 0.03 percent of the national area. Approximately 50 percent of thecountry's urban population, or one person in every six, lives in Dakar.All other cities have populations below 150,000.
The Transport Sector
Road Network
8. Senegal's road network comprises some 14,000 kilometers of roads, ofwhich 3,521 kilometers (25 percent) are paved. Almost 100 percent of theroad network in Cap Vert is paved. The road density averages 7.05kilometers per 100 square kilometers. Table I.1 presents a breakdown ofroad lengths by category. The road network is well maintained and a largeproportion of the paved roads are less than ten years old.
Vehicle Fleet
9. The official estimates of the national vehicle fleet are somewhatunreliable because the number of scrapped vehicles is not known. The bestestimate by the Ministry of Equipment for 1979 was 62,000 vehicles. A morerecent estimate (1986) puts the current vehicle count at 110,000 vehicles,of which about 80,000 are cars, 20,000 are various types of buses and10,000 are trucks. About 70-to-75 percent of the vehicle fleet is locatedin the Dakar region.
Road Accidents
10. Road accident data for the period 1980-85 is presented in Table 1.2.About 80 percent of all accidents in Senegal occur in urban areas. Thenumber of deaths per 10,000 vehicles in 1985 was 44. The number of deathsper 100,000 population was 8.0. In general, urban roads are safer thanrural roads since there are 2.7 times more deaths per accident in ruralareas and 1.5 times more injuries. The severity indices for urban andrural areas are 4.4 and 7.5 respectively. Thus the proportion of deaths
SENEGAL - 106 -
compared to total persons injured or killed is about 1.7 higher on ruralroads. Approximately 12-to-15 percent of the vehicle fleet is involved inroad accidents each year.
Table I.1 National Road Network by Type of Road (kilometers)
11. Revenues from road user charges in Senegal amount to more than thecombined expenditures on road construction and maintenance. Fuel taxesrepresent about 40 percent of the sales price. Pump prices for petroleumfuel have been raised several times over the past few years in line withinternational prices. The last price rise was on June 30, 1985, whenprices were raised to F.CFA 350 per liter (US$4.73 per gallon) for premiumgrade petrol, F.CFA 335 (US$4.53 per gallon) for regular and F.CFA 210
- 107 - SENEGAL
(US$2.84 per gallon) for diesel. Approximately 65 percent of fuel salestake place in the Cap Vert region.
The Economy
12. Senegal entered the 1980s in the midst of a severe developmentcrisis. The economy was registering little growth, internal imbalanceswidened markedly, and the external payments position came under mountingpressure. Senegal's problems were partly due to uncontrollable factorssuch as drought, declining trade terms, inappropriate production, invest-ment, and pricing policies. To combat this situation, the governmentadopted a number of adjustment programs supported by internationalfinancing agencies. Initially these programs were not effective because ofcontinuing drought and weaknesses in policy implementation. However, since1983 steady and substantial progress has been made toward economic andfinancial adjustment. As a consequence, and also due to good weatherconditions, a substantial revival in the economy was registered in1985/86. An important factor in the revival was the record food crop. Theper capita GDP in 1982 was US$490. As a member of the West AfricanMonetary Union, Senegal shares a common currency with six other WestAfrican states. The currency, F.CFA is pegged to the french franc at afixed rate of F.CFA 50 - 1 FF.
SENEGAL - 108 -
II. LOCAL PERSPECTIVE
City Form and Constraints
21. The capital and largest city in Senegal is Dakar, which is located onthe Atlantic Coast at the tip of the Cap Vert region. This region containsabout half the modern sector jobs and about 60 percent of firms. Dakar isat the hub of the nation's transport systems and is the primary port ofentry and exit by sea and air. Dakar comprises three communes and coversan area of 535 square kilometers. The three communes, Dakar Plateau(including the commercial heart of the city), Pikine, and Rufisque(principally low-income housing areas) are spatially separated. Pikine andRufisque are located some 12 kilometers and 24 kilometers, respectivelyfrom the city center. The average population densities in the three areasin 1981 was 7,500, 5,300, and 500 inhabitants per square kilometer. Theaverage population density for the three areas combined in 1986 was 2,400inhabitants per square kilometer.
Transport Demand
13. Dakar has a current population of about 1.3 million and is expectedto continue to grow at about 6 percent per annum to reach 2.8 million bythe year 2000. The majority of this growth will take place in Pikine andRufisque. Because of the concentration of employment in Dakar, there is amajor daily movement of vehicles and passengers along the Rufisque /Pikine / Dakar corridor. In 1983 more than 15,000 vehicles a day, carrying50,000 to 60,000 passengers use this route. About 12 percent of dailytrips take place during the peak hour.
14. The vehicle fleet operating in Dakar is not known with any degree ofaccuracy. A recent estimate put the number of vehicles registered in theDakar area at between 40,000 and 50,000, of which 500 are public buses,800 are minibuses (car rapides), and 3,500 are taxis. The level ofmotorization is about 35 vehicles per 1000 inhabitants. In 1980approximately 35 percent of daily trips were carried by public buses, 18percent by car rapides, 11 percent by taxi, and 32 percent by car. Theremainder were mainly by bicycle. The modal split has probably not changedsignificantly since 1980 and the split between buses and car rapides hasstayed about the same.
Public Transport
15. Public transportation services in the Dakar area are provided by: (a)SOTRAC, a mixed ownership public bus company; (b) car rapides, privatelyowned minibuses; and (c) taxis. SOTRAC has a monopoly in the central areaof Dakar, but competes with the car rapides in the suburbs and on the maincorridor linking Dakar with Pikine and Rufisque. Sixty-four percent ofSOTRAC is owned by the state, 27 percent by Renault Vehicle Industries andthe remainder by local private interests. The board of SOTRAC reports tothe Land Transport Directorate of the Ministry of Equipment, which isresponsible for setting fares. Fares are currently set at F.CFA 110, 120,and 130 for trips within Dakar, between Dakar and Pikine and Dakar andRufisque. The relationship between the Ministry and SOTRAC has beenformalized in the form of a three-year "contract plan" that sets outclearly the obligations and agreements reached between the state and the
- 109 - SENEGAL
operator. The principal obligations of the government are to provide afixed level of subsidy and ensure regular fare revisions in line withrises in costs. Additional subsidy payments can be claimed by the companyfor any delays in implementing fare rises. The obligations of the operatorare to meet certain productivity and financial targets. This arrangementhas worked quite well and has generally enabled the bus company to containthe rapidly rising losses that were being incurred in the late 1970s.However, the financial situation in 1985/86 worsened significantly due totardiness in implementing the fare revision and a decline in passengers.
16. SOTRAC. The public bus operator currently owns 458 buses, of whichbetween 85 and 90 percent are outshedded each day. The company employs2,868 staff, or 6.26 staff per bus. In 1986, 130 buses were assigned tourban services (within Dakar) and 199 to suburban services (outlyingdistricts such as Pikine and Rufisque). The remaining buses were assignedto private operations. The average length of urban routes is 14.4kilometers and of suburban routes is 24.7 kilometers. Suburban buses, onaverage, carry 4.2 passengers per kilometer compared to 7.7 on urbanroutes. Average operating speeds on the urban and suburban routes are 14.4and 24.7 kilometers/hour respectively. Traffic congestion is a major causeof delays particularly in the Plateau area. Because the existing farestructure is not very sensitive to distance, the suburban services operateat a loss while the urban services are mainly profitable. Since newpopulation growth is mainly occurring in the suburbs, the proportion ofsuburban services is likely to increase making it more difficult forSOTRAC to become viable if the existing fare structures are maintained.
17. Car Rapides. In the late 1970's the government's aim was to replacethe car rapides with SOTRAC buses. Since that time the close involvementof the government with the public transport operator through the "contractplan" has brought about a change of attitude. It is now recognized thatthe car rapides have an important role to play in the transport system.The number of private licenses has been carefully regulated to keep theratio of passengers transported in the region of 2:1 in favour of SOTRAC.As in other West African countries the car rapides (informal transportmode) are run by private operators who rent out their buses to a driver inreturn for a fixed fee in the region of F.CFA 15,000-to-20,000 per day.The driver pays for petrol and the owner for repairs. Approximately 50 newlicenses are granted each year. Operators wishing to obtain a licenseapply to the ministry through the transporter's union. Fares charged onthe car rapides vary with distance from F.CFA 65 for 5 kilometers, up toF.CFA 155 for more than 20 kilometers. Thus for short journeys within thesuburbs of Dakar it is much cheaper to use a car rapide than a SOTRAC bus.On the long distance routes some passengers prefer to pay the slightlyhigher fare of the car rapides in order to be assured of a seat. Sincethese new fare levels came in during 1986, the number of passengers usingSOTRAC's urban services has decreased.
18. Taxis: There are two types of taxi in circulation in Dakar - blackand yellow taxis, which have a taxi meter, and green shared taxis with nometer. The green taxis operate in the suburban areas. Metered taxis chargeF.CFA 80 per trip plus F.CFA 122 per kilometer. Collective taxis chargeF.CFA 80 per person per trip.
SENEGAL - 110 -
19. Railway Services. Although there are no suburban services at themoment, the government is giving active consideration to the possibleutilization of the existing double track line linking Dakar with Thies asa suburban railway. The line is well located to serve Rufisque, Pikine andthe principal industrial area of Dakar. Six stations are proposed betweenDakar and Rufisque. The line would have a peak hour frequency of 20minutes.
Road Network
20. A recent survey has shown that there are 638 kilometers of roads inthe three communes that make up the Dakar region. About 90 percent of theroads are surfaced. There are approximately 4.9 kilometers of road per10,000 population. The state is responsible for the maintenance of 216kilometers and the remainder are the responsibility of the CommunauteUrbain of Dakar (recently created comprising Dakar Plateau, Pikine, andRufisque). Approximately 105 kilometers of the state roads are principalurban streets which normally would be the responsibility of the localgovernment. Because of the past poor performance of the three communes inthe area of road maintenance the state assumed responsibility for theseroads. The state roads are all generally in a good state of repair.Approximately 30 percent of the communal roads are in poor condition. Afurther 17 percent are gravel or sand roads. The recently formedCommunaute Urbain has made road maintenance a high priority, and itstechnical services department are currently working hard to establish roadmaintenance gangs and rehabilitate the worst sections of road. Priority isbeing given to the improvement of bus routes.
Traffic Conditions
21. Traffic conditions in Dakar are slowly worsening, both in terms ofthe extent of the areas of congestion and the length of time during whichcongestion exists. The main areas of concern are the Plateau and keyintersections on the principal distribution network. The main causes ofthe delays are lack of intersection capacity, poor use of road space,sand-clogged streets, poor parking enforcement, and street trading. Poorroad conditions on the secondary road network also slow down publictransport vehicles and cause other traffic to avoid these roads.
Traffic Management
22. Despite the recommendations of several studies, little has been doneto alleviate traffic conditions and improve traffic safety by usingtraffic management measures. A traffic management unit was formed underthe World Bank's Second Urban Project and it has put forward a PriorityAction Program containing many sound traffic improvement schemes. Thefirst of these is about to be implemented. This involves the constructionof new roads and road widening in the Pikine area. The budget for thiswork represents a small fraction of the total estimated cost of the actionprogram. There are about 30 sets of traffic signals in Dakar which arereasonably well maintained by a private firm under a subcontract agreementwith the local authorities. Road markings and traffic signs are sparse andgenerally not well maintained.
- 111 - SENEGAL
23. There is much that could be done to improve the traffic situation inDakar through the use of traffic management measures, particularly in thePlateau area and along the principal public transport corridors. There isalso scope for the introduction of bus priority schemes in the form ofbusways and bus lanes. The control of parking also needs to be improvedand the introduction of parking charges should be strongly considered.
Responsibilities
24. The principal government agencies involved in the urban transportsector are the Ministry of Equipment and the recently formed CommunauteUrbain of Dakar. The Police also play a role in traffic control andtraffic safety. The Ministry of Equipment has two general directorates--Land Transport and Public Works. The Directorate of Public Works isresponsible for road maintenance and construction and has a specializedstudy unit for transport matters (Direction des Etudes et Programmation--DEP). The Traffic Management Unit being funded under the World Bankproject is located in the DEP. The Directorate of Land Transport isresponsible for the promotion, regulation, and coordination of transportactivities. This includes vehicle inspection and licensing and thesupervision of SOTRAC. The directorate is also responsible for theregulation of cars rapides.
25. The local governments are principally responsible for the maintenanceof all urban transport facilities (except for local parts of the nationaland regional road network) and the constructio-n of infrastructure withintheir jurisdictions. These responsibilities in the Dakar region haverecently been taken over by the newly formed Communaute Urbain of Dakar.The new Technical Services Department has made a determined start attackling the backlog of maintenance needed on the road network and plansto expand its activities over the next few years.
- 112 -
URBAN TRANSPORT SITUATION IN SIERRA LEONE: FREETOWN
SUMMARY
Urban Transport Overview
1. The traffic problems of Freetown are mainly caused by the blatantdisregard of drivers for traffic regulations, and street traders andpedestrians encroaching on the main highways. These problems arecompounded by poor traffic management and inadequate road maintenance.
2. While there is an urgent need to implement a traffic improvementprogram, nothing significant will be achieved until traffic lawenforcement is improved, street trading on the main thoroughfares isbanned, and road maintenance is improved. Parallel action on all thesefronts is a necessary prerequisite to investment in a traffic improvementprogram.
3. There is also a need to set up a traffic management unit to beresponsible for the day-to-day management of the traffic situation and tomaintain traffic signals, traffic signs, and road markings. The setting upof a traffic and transport policy coordination committee, withrepresentatives from the ministries, the City Council, the police and thetransport operators, should also be regarded as an urgent requirement.
4. The Road Transport Corporation, a public enterprise responsible forthe provision of urban transport services in Freetown and inter-cityservices throughout Sierra Leone, is heavily subsidized and has greatdifficulty in achieving a satisfactory level of productivity. The princip-al causes of these difficulties are a lack of foreign exchange for spareparts and low fares. Both of these problems stem from poor management ofthe urban transport sector at the central government level. The officialtariffs are ignored by the private operators, who charge what theyconsider to be an economic fare.
Needs and Issues
5. There are seven basic issues that the Government of Sierra Leoneneeds to address before it can successfully tackle the urban transportproblems of Freetown. Four of these concern traffic management, twoconcern public transport, and one concerns medium- and long-term planning.
Traffic Management
6. Institutional Development. The establishment of an agency respons-ible for traffic operations and management is an urgent necessity. At thepresent time responsibilities for traffic management are vested in theMinistry of Works but there are no qualified staff to take on theseresponsibilities. There is also a need to bring together the variousagencies involved in urban traffic and transport to coordinate actions anddevelop a comprehensive policy.
7. Traffic Law Enforcement. The establishment of an effective lawenforcement agency is also a necessary prerequisite for the safe andefficient flow of traffic. Such a situation will not be achieved in
- 113 - SIERRA LEONE
Freetown until legislative changes are made to give the police power tocharge fixed penalties for minor offenses, including the return ofvehicles that have been impounded for obstructing the highway. Theadministration of driver and vehicle records will need to be improved tomake such a scheme successful.
8. Street Trading. The prohibition of footway trading along the maintraffic arteries would bring about a significant improvement in thetraffic situation. Low-cost market structures will need to be built toprovide an alternative site for the traders.
9. Road Maintenance. Establishing good road maintenance practices is abasic requirement for an efficient transport system. Even simple trafficimprovement measures will be of no avail if traffic capacity is limited bypoor road surface conditions. The strengthening of the Freetown RoadMaintenance Unit is a major need. Providing adequate financial resourcesas well as equipment and manpower, is also an issue that needs to betackled.
10. When these issues have been satisfactorily resolved, steps should betaken to improve the efficiency of the road network through theimplementation of traffic improvement schemes, involving one-way streets,parking regulations, traffic signals, signs and markings, and bus prioritymeasures.
Public Transport
11. There are two main issues that need to be tackled in order to improvethe operational and financial performance of the Road TransportCorporation.
12. Foreign Exchange. The lack of foreign exchange for the purchase ofspare parts has had a disastrous effect on the availability of buses andon the ability of RTC to cover its costs. Poor financial performance dueto lack of foreign exchange is also an issue for other public enterprisesand requires policy changes at the central Government level if thesituation is to be improved.
13. Fares. With only three fare increases since 1974 it is hardlysurprising that RTC requires significant subsidies to keep afloat. Thesituation where private operators are able to charge more than theofficial fare, but the public bus company cannot, is obviously wrong. Thissituation is in urgent need of rationalization and a firm policy stanceneeds be taken by the government to eliminate the present operationalsubsidies.
Transport Planning
14. The lack of any firm urban development plan is likely to causesignificant medium- and long-term transport problems because of thedifficulty of reserving future widening lines and rights-of-way. There is,therefore, an urgent need to carry out a comprehensive land-use transport-ation study to set out future road reserves and program road investments.
SIERRA LEONE - 114 -
Bank Role and Strategy
15. Bank involvement in the urban transport sector in Sierra Leone shouldfocus on assisting the government to resolve the issues of street trading,traffic enforcement, and road maintenance and on developing a sound policyfor the urban transport sector. Only when positive action has been takenon these issues through improved institutional performance shouldconsideration be given to developing a traffic management programcomprising physical improvements, traffic signal equipment, and technicalassistance and the undertaking of a long-term transport and urbandevelopment study.
- 115 - SIERRA LEONE
I. NATIONAL PERSPECTIVE
Urbanization
16. Sierra Leone is located on the West African Coast. It is bordered byGuinea to the north and east, and Liberia to the south. The country coversan area of 71,740 square kilometers and had a population of 3.19 millionin 1982. The population growth rate between 1973 and 1982 was 2.1 percent.The country is divided for administrative purposes into four areas. Thepopulation and size of each area according to the last census (1974) areshown in Table 1.1.
17. In 1982, approximately 26 percent of the total population of SierraLeone lived in urban settlements of more than 10,000 inhabitants. Thepopulation of Freetown was 444,000, representing approximately 14 percentof the national total. The populations of the principal settlements in1974 and 1982 are shown in Table 1.2.
The Transport Sector
Road Network
18. Sierra Leone's road network totals about 9,000 kilometers, of whichabout 1,220 kilometers are paved (17 percent not including feeder roads)and 1,900 kilometers are feeder roads. The average density of the networkis 12.5 kilometers per 100,square kilometers. Table 1.3 gives a breakdownof the lengths of paved and unpaved roads by administrative area.
Vehicle Fleet
19. According to official estimates, there were approximately 25,200motor vehicles operating in Sierra Leone in 1981. Other sources (GOPAconsultants) estimate the vehicle fleet in 1982 at 19,600 vehicles. Thebreakdown of the official estimates by type of vehicle is given in TableI.4. Vehicle ownership in 1981 was about eight vehicles per 1000population, or about four cars (including taxis) per 1000. The proportionof cars and taxis increased from 66 percent in 1972 to 76 percent in 1981.
Urban Vehicle Usage
20. Data on petroleum production (Table I.5) and distribution (Table I.6)shows that gasoline consumption increased by 6 percent per annum between1977 and 1981. Approximately 50 percent of fuel sales occurred in theWestern Area (Freetown and surrounding area) over the period 1978-80. Thisarea represents 1 percent of the land mass, contains 12 percent of thepopulation and has 5.6 percent of the total paved and gravel roads. It isestimated that 60-to-70 percent of the vehicle fleet operates in thisarea.
Road Accidents
21. The number of recorded road accidents in Sierra Leone during theperiod 1980-82 is shown in Table I.7. Sixty-five percent of all accidentsoccurred in the Western Area. The number of fatalities per 100,000 peoplein 1982 was about 5.5, and the number of fatalities per 10,000 vehicles
SIERRA LEONE - 116 -
was about 70. The number of casualties per 10,000 vehicles was 2,065.Vehicle ownership was 59 per 10,000 persons.
Transport Costs
22. Import duties on vehicles vary by vehicle size and type. In 1982 therates for private passenger vehicles were 40 percent for vehicles notexceeding 2000 cubic centimeters, 100 percent for vehicles between 2000and 2500 cubic centimeters engine capacity, and 125 percent for vehiclesexceeding 2500 cubic centimeters. The rate for trucks was 25 percent andminibuses 45 percent. Import duties on spare parts and tires were 30 and20 percent respectively.
23. Motor vehicle license fees vary by vehicle weight. In 1982 theminimum and maximum annual license fee for cars was Le 30 and Le 101, andLe 38 and 134 for taxis. The minimum and maximum charges for passengervehicles and trucks was Le 44 and 110, and Le 32 and 98, respectively. Thelicense fee for minibuses was Le 24 and for motorcycles Le 5.40.
24. In 1982, excise and import duties on petroleum fuels were 12.5percent for premium grade and 6.7 percent for diesel. Pump prices in 1982were Le 2.86 per gallon for premium grade and Le 2.23 for diesel. Theimportation of crude oil is subsidized. Lack of government funds to payfor the subsidy have led to fuel shortages. In April of 1985 the subsidyrepresented 45 percent of the pump price, which had risen to Le 6.66 pergallon ($1.11) for regular grade gasoline.
The Economy
25. The overall economic situation of Sierra Leone is weak. FinancialYear 84 was the fifth consecutive year with no growth in GDP. Thecontinued recession of the industrial economies, weak export prices, highinterest rates, and tight liquidity positions have made economic recoverya formidable task. Inflation has eroded much of the export advantagegained by devaluation, giving rise to the growth of a parallel market inforeign exchange and the intensification of illegal border trade. The GNPper capita in 1982 was US$390.
26. The availability of foreign exchange in the official market has beenseverely constrained. The government set up a foreign exchange allocationcommittee to reflect overall priorities. However in view of the severeshortage, it was difficult to administer this system. The system was alsoslow to respond to needs due to the need for all public enterprises tomake their requests through their respective ministries.
- 117 - SIERRA LEONE
Table I.1 Population and Density by Administrative Area
Admin. Population Area Population PopulationDivision 1974 sq. Distribution per sq.km.
Northern 1,046,160 35,936 50% 29.11Province
Southern 596,760 19,694 27% 30.30Province
Eastern 775,930 15,553 22% 49.89Province
Western 316,310 557 1% 567.88Area
Total 2,735,160 71,740 100%
Source: Ministry of Lands, Housing and Country Planning
Table I.2 Population Estimates for the Principal Urban Settlements. 1/
Urban Population PopulationArea 1974 1982
Freetown 276,247 444,440Koidu/Senbehun 75,846 v
Bo 39,371 2JKenema 31,458 56,360Makeni 26,781 44,850Lunsar 16,723 31,750Yengema 14,793 23,440Port Loko 10,500 15,750Magburaka 10,347 14,560Kabala 7,857 17,830Mortema 5,501 16,362
1/ The total population of Sierra Leone was estimated at 3.19 million inDecember 1982.
3] 1982 estimate not available
Source: Ministry of Development and Economic Planning I
SIERRA LEONE - 118 -
Table I.3 National Road Network by Type of Road and District
Class I Class II Class II Class IV & V(primary) (secondary) (collector) (local)
Area paved gravel paved gravel paved gravel paved gravel Total
Table I.7 Road Accidents in Sierra Leone 1980 - 1982
1980 1981 1982 Total Western Proportion
Number ofAccidents 3051 2862 2882 8795 5731 65%
Fatalities 229 164 133 526 139 26%
SeriousInjuries 1378 1448 1039 3865 1720 45%
SlightInjuries 2140 2449 2753 7324 4384 60%
Source: Traffic Police Division
SIERRA LEONE - 120 -
II. CITY PERSPECTIVE
City Form and Constraints
27. The city of Freetown lies on the northern shore of a peninsulafacing the Sierra Leone River. The urbanized area is approximately ninekilometers long by 1.6 kilometers wide, bounded on the northern side bythe sea and the southern side by a range of hills rising to over 2,000feet. The city is traversed by a number of ravines that constrain trafficmovements between the central area of the city and the populous easternsuburbs. Additional east-west linkages would be difficult and expensive toconstruct.
28. Freetown is the capital of Sierra Leone, the seat of government, andthe principal port. It has the only international airport in the country.Practically all major businesses and public enterprises have theirheadquarters in Freetown.
Transport Demand
29. The population of Freetown grew from 276,000 in 1974 to an estimated444,000 in 1982--an annual growth rate of approximately 6 percent. Thislarge increase in population has caused significant changes to the city.Population growth has mainly occurred in the the western and easternsuburbs. Future growth will be mainly concentrated in the east where low-income housing sites are being developed by the government. This willexacerbate the already difficult problems of access to the city centerfrom the east. Future population growth is projected at about 4 percentper annum.
30. There are no official statistics concerning the vehicle fleetoperating in Freetown. GOPA consultants have estimated from fuel salesthat more than 60 percent of registered vehicles operate in the Freetownarea. This is in line with the analysis presented in Table I.6. andinformation obtained from the MOW, which indicated that 65 percent ofvehicles in 1984 were registered in Freetown. The level of motorization inFreetown is approximately 32 vehicles per 1000 population. The estimatedpassenger vehicle fleet in Freetown in 1982 is given in Table II.1.
31. It has been estimated that 56 percent of daily passenger movements bypublic transport modes in 1981 were carried by poda-podas (small vehiclesor minibuses carrying 20-to-25 passengers), 41 percent by taxi, and 3percent by bus. In 1972 poda-podas carried one percent more of travellers.The share of taxis was 22 percent, and buses carried 31 percent. Thislarge drop in the market share by the state-owned public transportcorporation (RTC) reflects the serious difficulties that the management ofthe RTC faces.
- 121 - SIERRA LEONE
Table II.1 Vehicle Fleet Operating in Freetown in 1981
1/ Author's estimate.t/ Poda-poda is the local name for minibuses.t/ These vehicles are frequently overloaded by 20 percent.t/ Buses are operated by the Road Transport Corporation (RTC).5/ Estimated as 65 percent of national total.
Source: Sierra Leone Road Passenger Transport Study
Public Transport
32. Three types of public transport service operate in the Freetown area--buses, poda-podas, and taxis. Most taxis and poda-podas are owned byindividuals and rented out to drivers who must provide a guaranteed returnto the owner. The driver takes care of the fuel costs and the owner paysfor the maintenance of the vehicle. The buses operating in Freetown areowned by the Road Transport Corporation (RTC), which is a state-ownedenterprise responsible to the Ministry of Transport and Communications.All public transport vehicles must take a biannual fitness test.
33. Buses. The Road Transport Corporation was formed in 1964 to operatepublic transport services throughout the country. RTC provides inter-cityand city (Freetown) services. In May 1985, of the total of 65 large buses,22 were destined for scrap, 33 were servicable but awaiting spares and 10(15 percent) were in operation. Of the 50 minibuses owned by RTC, only 20were operational (40 percent). The average availability was 32 percent.Five of the large buses are operated in Freetown in addition to the 20available minibuses. The large buses have 55 seats with a crush capacityof about 100. The minibuses have 20 seats, with a total capacity of 30.The large buses carry about 2,000 passengers per day and the minibuses700.
34. On the financial side there have been only two years between 1971 and1981 when a small profit was made. Net operating losses ranged from Le32,000 (US$5,000) and Le 653,000 (US$108,000). The situation is believed
SIERRA LEONE - 122 -
to have deteriorated in 1982 and 1983. The principal causes of the poorfinancial performance are long delays in obtaining government approval offare increases and a lack of foreign exchange for spare parts. RTC hasonly been granted three fare increases since 1974. Its application in 1975was granted in 1979 and its application in 1981 only in 1983. RTC faresare approximately half those charged by the poda-poda operators. Thecharge for a ten mile journey in Freetown costs Le 0.25 by RTC and Le 0.50by poda-poda. A 28-mile journey costs Le 0.40 by RTC and Le 1.00 by poda-poda.
35. Poda-podas. Although poda-podas operate on relatively fixed routes(decided by the driver) they are free to deviate as circumstances dictate.There are no fixed stopping places. The general condition of the vehiclesis reasonable. Poda-podas tend to operate on radial routes between thecity center and the high density suburbs. They operate from fixeddeparture points according to the destination. The vehicles are generallyoverloaded. RTC minibuses compete with poda-podas along the main trafficarteries. The poda-podas provide good service with low waiting times.Average occupancy is about 27 persons. Difficulties are experienced inboarding at peak periods at intermediate points on the routes.
36. Drivers of poda-podas are required to pay to the owner Le 300 per dayor Le 380 if the owner provides the fuel. Additional revenues are kept bythe driver and his assistant as wages. This would require the driver tocarry at least 760 passengers per day at Le 0.50 in order to cover hiscosts.
37. Taxis. Taxis are not metered and are free to operate either on theshared ride principle (the most usual mode) or according to a single partyfare. There are no fixed routes. The service provided is quite good withlow waiting times. Taxi occupancy in the central area averages about 2.6passengers. The vehicles are generally in reasonable condition. The costof a shared ride in the city is Le 0.40. Single party fares arenegotiable.
Road Network
38. There are approximately 120 kilometers of roads in Freetown, themajority of which are paved. No new main roads have been constructed sincethe completion of the urban section of the Coastal Road in 1976. This roadprovides the main link between Freetown and the rest of the country and isthe main access road to the port. In July 1982 this road carried some21,000 vehicles per day. There are 2.7 kilometers of road per 10,000population.
39. The road network in Freetown is in a terrible state of repair. Themain roads are patched from time to time, but the secondary roads andlocal roads are sometimes impassible because of numerous and deep pot-holes. The majority of these roads have not been repaired for at least adecade. The principal problem appears to be a lack of funds at the centraland local government levels for carrying out the maintenance work.
- 123 - SIERRA LEONE
Traffic Conditions
40. Despite Government concern over the traffic situation in centralFreetown, very little has been done to alleviate the congestion thatoccurs during the peak travel periods. Although some of the traffic delaysare due to lack of capacity, the majority can be attributed to improperuse of the highway, inconsiderate driver behaviour, and a lack ofenforcement of traffic regulations. A further significant factor is thepoor condition of the road surface.
41. The most critical junction is the Clocktower, through which alltraffic from the provinces and the eastern suburbs must pass to enter thecentral area. There are four or five other critical junctions that causedelays at peak hours. Other areas of congestion include Guard St., KissySt., Fourah Bay Road, and Kroo Town Road, where street traders andpedestrians effectively reduce the capacity to a single lane for most ofthe day. Journey speeds for buses on these cross-city routes are on theorder of five to eight miles per hour. Travel times increased by 50percent between 1974 and 1981.
Traffic Management
42. Although traffic signals have been installed at 13 junctions in thecity center only about half of them are functioning. Road markings andtraffic signs are in poor condition and relatively sparse. A few one-waystreets have been introduced in the city center. No attempt has been madeto carry out a comprehensive traffic study since the departure of a UNexpert in 1972. The GOPA study does make some short-term trafficmanagement proposals that could assist in reducing congestion.
43. Indiscriminate on-street parking is a major problem in the center ofFreetown, apart from one or two very narrow streets which have prominent"No Parking' signs. There are no off-street car parks, although potentialsites are available. The police would like to improve the situation byerecting more signs, but budget cuts have so far prevented the MOW andCity Council from taking action. A thorough review of the parkingsituation and strong enforcement measures are needed if the presentanarchy is to be eliminated.
Responsibilities
44. The principal agencies involved in the urban transport sector are theMinistry of Works (MOW) and the Ministry of Transport and Communications.The Ministry of Lands, Housing and Country Planning (MLHCP) also getsinvolved in the planning of new roads. The Freetown City Council hasrelatively few responsibilities in the transport sector, except for themaintenance of local roads. Traffic enforcement is carried out by thePolice Traffic Department.
45. Ministry of Works. Since the virtual abandonment of the localgovernment system in 1973, the MOW has assumed full responsibility for themanagement of the Freetown road network. The City Council attempts toconstruct and maintain second-class roads, but their accomplishments overthe past five years have been insignificant. Two-and-half miles of localroads have been constructed but hardly any maintenance has been carried
SIERRA LEONE - 124 -
out. The level of maintenance provided by the MOW on the primary roadnetwork is far from adequate and the secondary road network has not beentouched in years. Steps are now being taken to improve road maintenance ata national level through the World Bank's Second Highway Project. However,no provision has been made for the improvement of roads in the Freetownarea.
46. The planning function of the MOW has recently been improved throughthe setting up of a Transport Planning Unit. A transport economist hasbeen provided under a World Bank-assisted technical assistance agreement.The main activities of the unit are related to national road planning. TheMOW is also responsible for traffic signing and road marking. Very littleis done in these areas. The organization chart of the MOW makes provisionfor a Traffic Management Unit, but due to low salaries and a lack oftrained professionals such a unit has not yet been created.
47. Ministry of Transport and Communications. The MOTC is responsiblefor the regulation of the transport industry through the Department ofRoad Transport and the Road Transport Board. It also controls the RoadTransport Corporation (RTC), which is responsible for the provision ofpublic transport services in Freetown as well as inter-city services. Thepolicymaking function of the MOW is centered in its Planning Unit. Theunit consists of one person who is responsible for the development ofplans and policies for all transport modes.
48. The principal functions of the Department of Transport are vehicleinspection and driver testing. All commercial vehicles (public transportand goods) are required to pass a biannual road-worthiness test. Privatecars are not required to have a fitness certificate but can be made totake the test if required to do so by the police. The general condition ofvehicles is quite good. The vehicle examination center suffers from a lackof equipment and proper facilities.
49. The Road Transport Board is responsible for regulations regardingroad transport (axle loads, license fees, public transport fares,registration of operators, etc.) The Board acts in an advisory capacity tothe Department of Road Transport. Public transport permits are freelydispersed and operations are essentially unregulated. The Board has theauthority to regulate public transport routes and frequencies but lacksthe staff and facilities to do this. The present public transport policyis one of "laissez faire", allowing market forces to regulate the servicesprovided by the operators but not the fares. For the moment this policy ismeeting the needs of the majority of the travelling public, but fuelshortages and a lack of spare parts have caused reduced services. The lackof a fares policy is having a major impact on the Road TransportCorporation's profitability.
50. Ministry of Lands, Housing and Country Planning - The MLHCP isresponsible for planning control and regulation throughout Sierra Leone.As far as Freetown is concerned there is no urban development plan toguide land use and transport planning. A study to develop such a plan isan urgent necessity.
- 125 - SIERRA LEONE
51. The Police Traffic Department. The PTD is responsible for trafficcontrol and enforcement. There were 125 officers assigned to trafficduties in Freetown in May 1983. Of the 50 motorcycles attached to the PTDonly 12 were in working order. The remainder were awaiting spare parts.One of the 5 cars was not operational.
52. Compared to most countries of the world, the traffic police in SierraLeone have rather limited powers. All traffic offenses must pass throughthe courts, which are extremely slow. This lack of flexibility in dealingwith minor traffic offenses means that the system is slow and cumbersome
and open to abuse.
RECENT WORLD BANK TECHNICAL PAPERS (continued)
No. 65. Hegstad and Newport, Management Contracts: Main Features and Design Issues
No. 66F. Godin, Preparation of Land Development Projects in Urban Areas (in French)
No. 67. Leach and Gowen, Household Energy Handbook: An Interim Guide and Reference Manual
No. 68. Armstrong-Wright and Thiriez, Bus Services: Reducing Costs, Raising Standards
No. 69., Prevost, Corrosion Protection of Pipelines Conveying Water and Wastewater: Guidelines
No. 70. Falloux and Mukendi, Desertification Control and Renewable Resource Management in theSahelian and Sudanian Zones of West Africa
No. 71. Mahmood, Reservoir Sedimentation: Impact, Extent, and Mitigation
No. 72. Jeffcoate and Saravanapavan, The Reduction and Control of Unaccounted-for Water:Working Guidelines
No. 73. Palange and Zavala, Water Pollution Control: Guidelines for Project Planning and Financing
No. 74. Hoban, Evaluating Traffic Capacity and Improvements to Road Geometry
No. 75. Noetstaller, Small-Scale Mining: A Review of the Issues
No. 76. Noetstaller, Industrial Minerals: A Technical Review


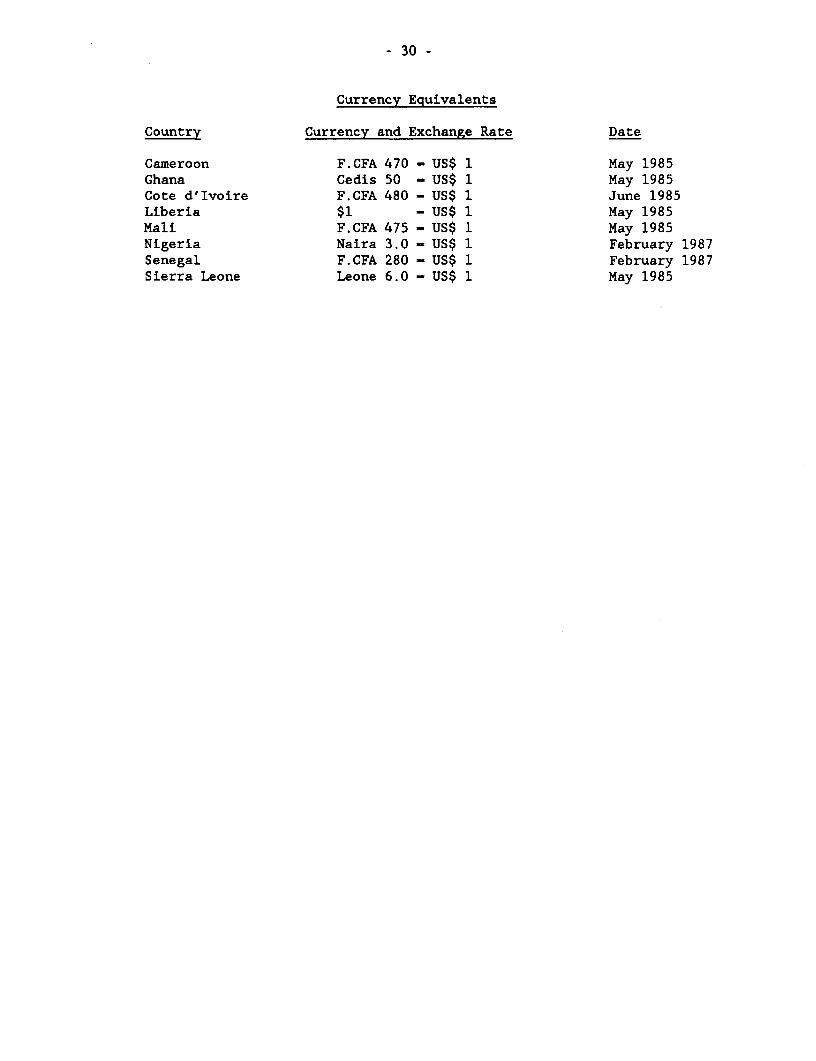


![CHAPTER 3 URBAN TRANSPORT PROBLEMS GUIDELINES FOR PASSENGER TRANSPORT IN SOUTH AFRICA A MULTI MODAL ANALYSIS [Transportation 3B – CBTL302]](https://static.documents.pub/doc/80x56/56649e0c5503460f94af520f/chapter-3-urban-transport-problems-guidelines-for-passenger-transport-in-south.jpg)


