92
1 URBAN UNEMPLOYMENT: A STUDY OF KOCHI CITY B.A. Prakash Department of Economics University of Kerala December 2001.
1
URBAN UNEMPLOYMENT: A STUDY OF KOCHI CITY
B.A. Prakash
Department of Economics University of Kerala
December 2001.
2
Contents
Acknowledgements Page No.
1. Introduction 1
2. Conceptual Frame Work 4
3. Urban Unemployment in Kerala 16
4. A Profile of Kochi City, the Study Area 22
5. Population in the Sample Households 29
6. Structure of Employment 42
7. Unemployment 52
8. Summary and Conclusions 67
References 72
Appendix
3
Acknowledgements The study is done with the financial support of Kerala
Research Programme on Local Level Development (KRPLLD). The funds for the
study is routed through Institute of Planning and Applied Economic Research, John
Mathai Foundation, Thrissur. I take this opportunity to thank Dr. K. Narayanan
Nair, Programme Co-ordinator of KRPLLD for the financial support. I also
express my gratitude to Dr. P.P. Pillai, Director, Institute of Planning and Applied
Economic Research for providing necessary help for the conduct of the study. I am
also thankful to Dr.K. Nagaraj and Dr. P.R. Gopinathan Nair for the comments and
suggestions of the research project at the earlier stages. The secondary data for the
study was provided by the Kochi Municipal Corporation and I thank the
Corporation for their help. I take this opportunity to thank Sri. Vinod Amose and
Sri. Sebastain for conducting the field survey and Sri.V.R. Mahesh for processing
the data.
B.A. Prakash
4
I. Introduction
Chronic unemployment of a large portion of active labour force has
been the most serious socio economic problem of Kerala during the last three decades.
Available evidences suggest that the rate of urban unemployment in Kerala was very
high. According to a survey conducted by the Department of Economics and
Statistics(DES) in 1987, the rate of open unemployment in urban areas was 33 percent.
The survey estimated that 20 percent of the male and 58 percent of the female labour
force were openly unemployed in urban areas. Surveys conducted by the National
Sample Survey Organisation(NSS) also suggest that the rate of urban unemployment in
Kerala was very high. The 50th round survey conducted by the NSS rank Kerala as a
state having the second highest rate of urban unemployment in India. Using the current
daily status measure of unemployment, it was estimated that 14 percent of the male and
28 percent of the female labour force were unemployed in urban areas.
The high incidence of urban unemployment assumes significance in the
context of rapid urbanisation taking place in Kerala. During the second half of the last
century, the decade which witnessed rapid urbanisation in Kerala was 1980’s. Between
1981 and 1991 the growth of urban population was 60.9 percent compared to 3.2 percent
of the rural population. Compared to 1980’s the rate of urbanisation was lower in 1990’s.
The 2001 census estimate the decadal growth as 7.6 percent. According to the census, the
percentage of urban population in Kerala is 25.97 percent in 2001 (Kerala, Director of
Census Operations, 2001). The decline in the rate of urbanisation may be attributed to
the severe recession the state economy has been facing since the mid 1990’s due to the
large scale exodus of emigrants from the Gulf, the crisis in agricultural sector due to steep
fall in the price of major crops especially coconut and rubber and the decline in
investment indicated by a steep fall in credit deposit ratio and the unprecedented fiscal
crisis of the state government resulting in the stoppage of most of the state sponsored
development activities.
A review of the studies on unemployment in Kerala show that two
types of literature are available on unemployment viz., unemployment surveys and
studies examining the characteristics and other issues. The surveys conducted by the
1
2

5
DES and NSS are major sources which give the unemployment estimates for Kerala as a
whole(DES Survey 1982 and DES Survey 1988). Though the latest survey gives an
estimate of urban open and under employment, the survey failed to give a detailed
examination of the characteristics of urban unemployment and its regional variations etc.
From the NSS Surveys we get a good idea about the changing magnitude of
unemployment(NSS 27th,32nd,38th,43rd and 50th rounds). But the information provided in
the surveys about the urban unemployment is meagre.
Though a number of scholars have studied the unemployment problem,
the main focus of most of the studies was educated unemployment. The Centre For
Development Studies (CDS) study was one of the earlier studies which examined the
socio-economic characteristics of educated unemployed, the incidence of unemployment
and interrelations between supply and demand for educated labour in Kerala(C.D.S.
1977). Another study in 1988 examined the socio-economic characteristics, incidence of
unemployment and the job preferences of unemployed based on a sample survey at
Trivandrum(B.A. Prakash, 1988). The subsequent studies have drawn attention to the
worsening problem of educated unemployment in Kerala(Joseph Thomas, 1988 and M.A.
Oommen, 1992). Another study examined the impact of expansion of education on the
characteristics of the labour supply and the adjustment process given the severity of
unemployment. And the study is based on a large scale survey conducted among
registrants in the employment exchanges of kerala in 1989 (Mukherjee and Issac, 1994).
Though the studies have examined the issue of educated unemployment, they have not
given a detailed examination of the characteristics and problems of urban unemployment.
But a recent study examined educated unemployment has given more information about
the characteristics, job preferences, and employment perspectives of educated
unemployment(E.T. Mathew, 1995). Thus the above review suggest that the issue of
urban unemployment has not received due attention from the scholars. This is the
context in which we propose to conduct a study of urban employment and unemployment
in Kochi city with the following objectives.
Objectives (1) to study the nature, characteristics and structure of urban employment.
3

6
(2) to examine the incidence, type and characteristics of urban unemployment and
(3) to present explanations for the high incidence of unemployment.
7
II. Conceptual Framework
In this section we present a review of the labour force framework of
International Labour Organisation (ILO) and the National Sample Survey Organisation
(NSS). The ILO’s labour force framework is widely used by countries all over the world.
The NSS is using a conceptual framework which is similar to the ILO. The estimates of
labour force and not in labour force are estimated in India by using the NSS labour force
framework. In this study we follow the NSS labour force framework to measure
employment and unemployment.
(i) ILO’s Labour force framework
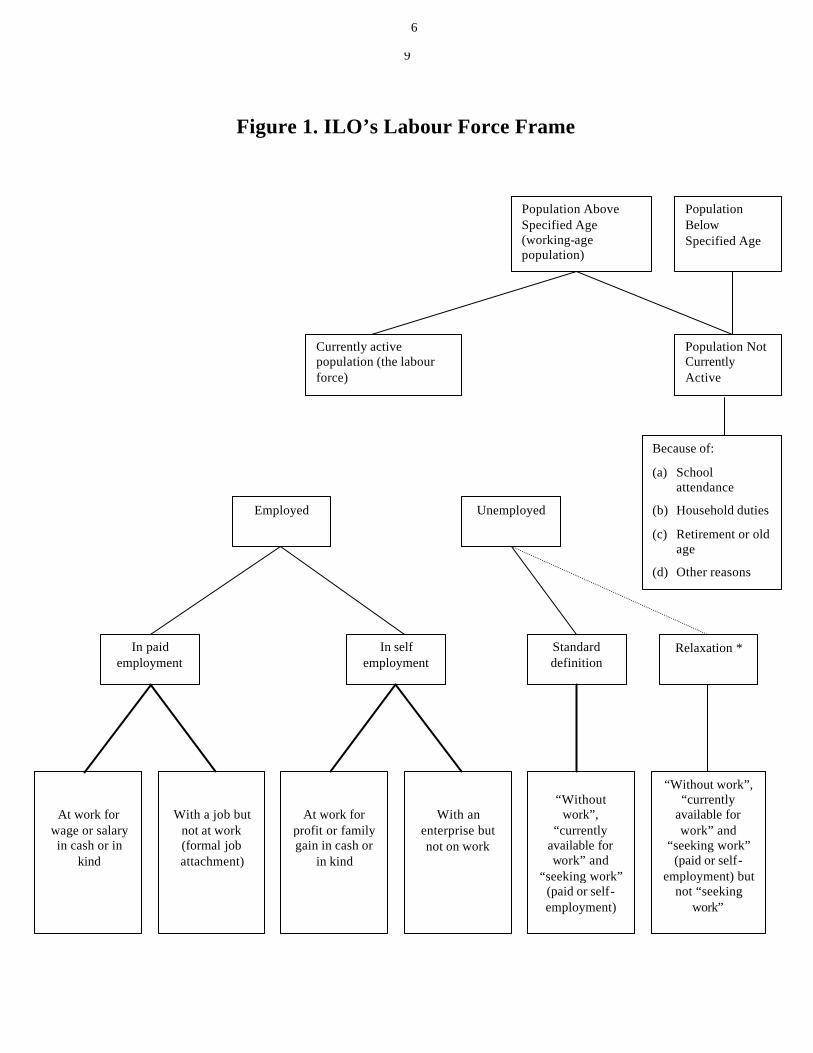
On the basis of a specific set of rules, the labour force framework
classifies, at a given moment of time, the population above a specified minimum age for
measuring the economically active population into three mutually exclusive and
exhaustive categories: employed, unemployed and not in labour force. The employed
and unemployed categories together make up the labour force, or the currently active
population, which gives a measure of the number of persons furnishing the supply of
labour at a given moment of time. The third category(not in the labour force), to which
persons below the age specified for measuring the economically active population are
added, represents the population not currently active. These relationships may be
expressed as:
Population = Labour Force +Not in Labour Force
and
Labour force=Employed+Unemployed
ILO defines employment in terms of paid employment and self
employment. Paid employment covers persons who during the reference period
performed some work for wage or salary, in cash or in kind, as well as persons with a
formal attachment to their job but temporarily not at work; self employment covers
4
8
persons who during the reference period performed some work for profit or family gain,
in cash or in kind, and persons with an enterprise but temporarily not at work.
The definition of unemployment covers persons who during the
reference period were (a) without work; (b) currently available for work; and ( c ) seeking
work. These elements of the international definitions of employment and unemployment
which confirm to the labour force framework are shown in Figure 1.
5
9
Population Below Specified Age
Population Not Currently Active
Population Above Specified Age (working-age population)
Because of:
(a) School attendance
(b) Household duties
(c) Retirement or old age
(d) Other reasons
Currently active population (the labour force)
Unemployed Employed
In paid employment
In self employment
Standard definition
Relaxation *
At work for wage or salary in cash or in
kind
With a job but not at work (formal job attachment)
At work for profit or family gain in cash or
in kind
With an enterprise but not on work
“Without
work”, “currently
available for work” and
“seeking work” (paid or self-employment)
“Without work”, “currently
available for work” and
“seeking work” (paid or self-
employment) but not “seeking
work”
Figure 1. ILO’s Labour Force Frame
6
10
Embedded in the labour force framework are certain rules for sorting
the population into three basic categories (employed, unemployed and not in the labour
force). These rules have three main features. The first feature is the notion of a reference
period which must be short enough to reflect the labour supply situation at a specified
moment of time. The second feature is the concept of activity status according to which
the population is classified into the three categories on the basis of activities performed
during the specified short reference period; a person must be working or more precisely,
must have a job or enterprise in which he or she normally works (employed) or be
seeking and/or available for work(unemployed) to be included in the labour force. The
third feature of the labour force framework is the use of a set of priority rules for ensuring
that each person is classified into only one of the three basic categories of the framework.
Reference period
The labour force framework is designed to monitor current changes in
the employment and unemployment situation, primarily on the basis of data obtained
from household surveys. This means that the concepts of employment and
unemployment should relate to a relatively short time period and that the measurement
should be made at sufficiently frequent intervals, the frequency depending on the national
statistical system and the availability of current data from other sources as well as on the
seasonal patterns of employment.
The international standards identify two appropriate choices for the
length of a short reference period: one week or one day. Since employment and
unemployment are viewed as stock concepts, the corresponding statistics must, in
principle, refer to a precise instant in time. But the nearest practical stretch of time to
reflect an instantaneous situation is a day or a week.
Activity principle
The activity principle of the labour force framework stipulates that a
person’s labour force status should be determined on the basis of what the person was
actually doing during the specified short reference period. Thus, only persons who were
engaged in an economic activity or who were seeking and/or available for such an
7

11
activity are to be considered for inclusion in the labour force. The scope of economic
activity, in as far as it applies to the labour force framework, is, by convention, based on
the concept of production of goods and services as defined by the United Nations System
of National Accounts. This concept includes all activities related to market production
and certain types of activities related to non-market production.
Priority rules
The labour force framework uses a set of priority rules for classifying
the working age population into three basic categories of the framework: precedence is
given to employment over unemployment and to unemployment over economic activity.
Thus, a person who is both working and seeking work is classified as employed, while a
student who is attending school and also seeking work is classified as unemployed. One
corollary of the priority rules is that employment always takes precedence over other
activities, regardless of the amount of time devoted to it during the reference period; a
person working even for only one hour during the reference period will be classified as
employed on the basis of the labour force framework, though he or she may at the same
time be seeking additional work or going to school.
(i) Measurement of employment
According to ILO definition of employment, the “employed” comprise
all persons above the age specified for measur ing the economically active population,
who during a specified brief period (one week or one day) were in the following
categories:
Paid employment (1) “at work”: persons who, during the reference period, performed
some work for wage or salary, in cash or in kind; (2) “with a job but not at work”:
persons who, having already worked in their present job, were temporarily not at work
during the reference period but had a formal attachment to their job.
Self employment (1) “at work”: persons who, during the reference period, performed
some work for profit or family gain, in cash or in kind; (2) “with an enterprise but not at
work”: persons with an enterprise, which may be a business enterprise, a farm or a
9

12
service undertaking who were temporarily not at work during the reference period for
some specific reason.
The international standards further specify that, for international
purposes, the notion of “some work” may be interpreted as work for atleast one hour.
The distinction between paid employment and self employment is meant to emphasise
that employment covers not only work for wage or salary but also work for profit or
family gain, including production for own consumption as mentioned above. The
distinction also permits the use of an appropriate terminology for each of the two types of
employment.
(ii) Measurement of unemployment
The ILO definition of unemployment is based on three criteria to be
satisfied simultaneously: “without work”, “currently available for work” and “seeking
work”. Accordingly, the “unemployed” comprise all persons above the age specified for
measuring the economically active population who during the reference period were:
(a) “without work”, i.e., were not in paid employment or self employment as
specified by international definition of employment.
(b) “Currently available for work”, i.e., were available for paid employment or
self employment during the reference period; and
(c) “seeking work”, i.e., had taken specific steps in a specified recent period to
seek paid employment or self employment.
The without work criterion draws the distinction between employment
and non employment. “Without work” should be interpreted as total lack of work, or,
more precisely, as not having been employed during the reference period. Thus, a person
is to be considered as “without work” if he or she did not work at all during the reference
period (not even for one hour) nor was temporarily absent from work as determined by
the definition of employment.
According to the international standards, persons should be seeking
work to be considered as unemployed. Seeking work is defined as having taken specific
steps in a specified recent period to seek paid employment or self employment. The term
10

13
“work” in the seeking work criterion is to be interpreted in the sense of economic activity
as defined in the international standards. The notion of seeking work is independent from
the duration and type of employment sought. Seeking work covers seeking employment,
part time employment, temporary, seasonal or casual work, and in general, any type of
work considered as economic activity by the international standards.
According to the international standards, persons should be available
for work during the reference period if they are to be considered as unemployed. In the
present context, availability for work means that, given a work opportunity, a person
should be able to ready to work. When used in the context of the standard definition of
unemployment, one purpose of the availability criterion is to exclude persons who are
seeking work to begin at a later date, for example, students who, at the time of the survey,
are seeking work to be taken up after completion of the academic year. In this situation
the availability criterion serves as a test of the current readiness to start work. The
availability criterion also serves to exclude other persons who cannot take up work due to
certain impediments, such as family responsibilities, illness, or commitments to volunteer
community services.
NSS’s Labour Force Framework
In the 50th Round the NSS has used the following definitions to define
employed, unemployed, labour force and not in labour force.
(a) Workers or employed: Persons who are engaged in any economic activity or
who despite their attachment to economic activity have abstained for reason of illness,
injury or other physical disability, bad weather, festivals, social or religious functions or
other contingencies necessitating temporary absence from work constitute workers.
Unpaid helpers who assist in the operation of an economic activity in the household farm
or non farm activities are also considered as workers.
(b) Unemployed: Persons who owing to lack of work had not worked but either
sought work through employment exchanges, intermediaries, friends or relatives or by
making applications to prospective employers or expressed their willingness or
11

14
availability for work under the prevailing condition of work and remuneration are
considered as those seeking or available for work as unemployed.
(c)Labour force: Persons who are either ‘working’ or seeking or available for
work (i.e., unemployed) during the reference period constitute the labour force.
(d)Out of labour force: Persons who were neither working and at the same time
were not seeking nor available for work during the reference period are considered to be
‘out of labour force’. The persons under this category are students, those engaged in
domestic duties, rentiers, pensioners, recipients of remittances, those living on alms,
infirm or disabled, too young or too old, prostitutes, smugglers etc and casual workers not
working due to sickness etc. However a domestic servant who is considered as a member
of the employer’s household is treated as a worker though he/she may be performing only
household chores. The classification of the labour force is given below.
The NSS has classified the persons into various activity categories on
the basis of the activities pursued by them during certain specified reference periods.
Three reference periods are used in these survey. These are
Classification of Labour force and Out of Labour force
Code Employed
11 Worked in household enterprise (self employed as an own account
worker)
12 Worked in household enterprise (self employed) as an employer.
21 Worked in household enterprise as a helper.
31 Worked as regular salaried/wage employee.
41 Worked as casual labour in public works.
51 Worked as casual labour in other types of works.
Code Unemployed
81 Seeking or available for work.
Out of labour force
91 Attended educational institutions.
12
15
92 Attended domestic duties only.
93 Attended domestic duties and was also engaged in free collection of
goods (vegetables, roots, firewood, etc for household).
94 Rentiers, pensioners, remittance recipients etc.
95 Not able to work due to disability.
96 Beggars, prostitutes etc.
97 Others
99 Infants of age 0-4 years.
(i) one year, (ii) one week and (iii) each day of the week. Based on
these three periods three different measures are arrived at. These are termed as usual
status, current weekly status and the current daily status.
Classification according to usual status
In this approach the status of activity on which a person spent relatively
longer time of the preceding 365 days from the date of the survey is considered as the
principal usual status activity of the person.
Employed: Accordingly, a person is considered working or employed if the person was
engaged for a relatively longer time during the past year in any one or more work related
activities.
Unemployed: A person is considered as ‘seeking or available’ for work or ‘unemployed’
if the person was not working but was either seeking or was available for work for a
relatively longer time during the past year.
Classification according to current weekly status
For classification of persons according to current weekly status
approach, they are assigned a unique activity status with reference to a period of 7 days
preceding the date of survey.
Employed: According to this status, a person is considered working or employed if the
person was engaged for atleast one hour on any one day of the previous week on any
work related activity.
13
16
Unemployed: A person who had not worked for even one hour on any one day of the
week, but had been seeking or had been available for work at any time for atleast one
hour during the week days was considered ‘seeking/available for work’.
Classification according to current daily status
The activity pattern of people particularly in the unorganised sector is
such that a person might be pursuing more than one activity during a week and
sometimes even during a day. In the current daily status (cds) upto two activity statuses
were assigned to a person on each day of the reference week. The unit of classification
was thus ‘half day’ in current daily status. In assigning the activity status on a day, a
person was considered working for the entire day if he had worked 4 hours or more
during the day. If he had worked one hour or more but less than 4 hours he was
considered working (employed) for the entire day and seeking/available for
work(unemployed) or not available for work (not in labour force) for the other half day
depending on whether he was seeking /available for work or not. The aggregate of
person days classified under the different activity categories for all the seven days gave
the distribution of person days by activity category during an average week over the
survey period of one year.
In short, the current day status rate of unemployment is the ratio of
unemployed days per week (seeking or available for work) to the total labour supply per
week (working plus seeking plus available days).
Unemployment Rate
Unemployment rate is defined as the number of persons per 100
persons in the labour force.
Definition of an urban area
In 1991 and 2001 censuses, the following definition is used to define an
urban area.
All places with a municipality, corporation, cantonment board or notified town area.
All other places which satisfied the following criteria:
(a) minimum population of 5,000;
14
17
(b) atleast 75 percent of the male working population engaged in non-agricultural pursuits; and
(c) density of population of atleast 400 per sq.km (1,000 per sq.mile).
Urban Agglomeration
According to 2001 census, an Urban Agglomeration is a continuous
spread constituting a town and its urban outgrowths, or two or more physically
contiguous towns together and any adjoining urban outgrowths of such towns. In some
cases, railway colonies, university campuses, port areas, military camps, etc., would have
come up around a city or statutory town outside the statutory limits but within the
revenue limits of a village or villages contiguous to the town. Each such individual area
by itself may not satisfy the minimum population limit to be treated as an independent
urban unit but deserves to be clubbed with the town as a continuous urban spread.
In 2001 census, two more conditions were added to the concept of
Urban Agglomerations. (1) The core town or atleast one of the constituent towns should
necessarily be a statutory town and (2) The total population of all the constituent units
i.e. agglomerations., towns and outgrowths of an urban agglomeration should not be less
than 20,000 (as per 1991 census).
Source of data
The study is based on the data collected from secondary and primary
sources. A sample survey was conducted in Kochi city for collecting primary data in the
first quarter of 1999. For selecting the samples for the study we have used a stratified
sampling method. First we have collected detailed information about the total
population, nature of houses, slum areas within a division, market centres, industrial area
of all the 50 divisions of the Kochi city. A stratified sample is used and five divisions
were selected. Two divisions were selected on the basis of the slum area within the
divisions. One division was selected on the basis of the industrial activity. Another two
divisions were selected on the basis of the nature of houses and shortage of houses. In
order to get a list of all the households we have used the voters’ list of the divisions.
From each division 60 sample households were selected from the voters’ list on the basis
15
18
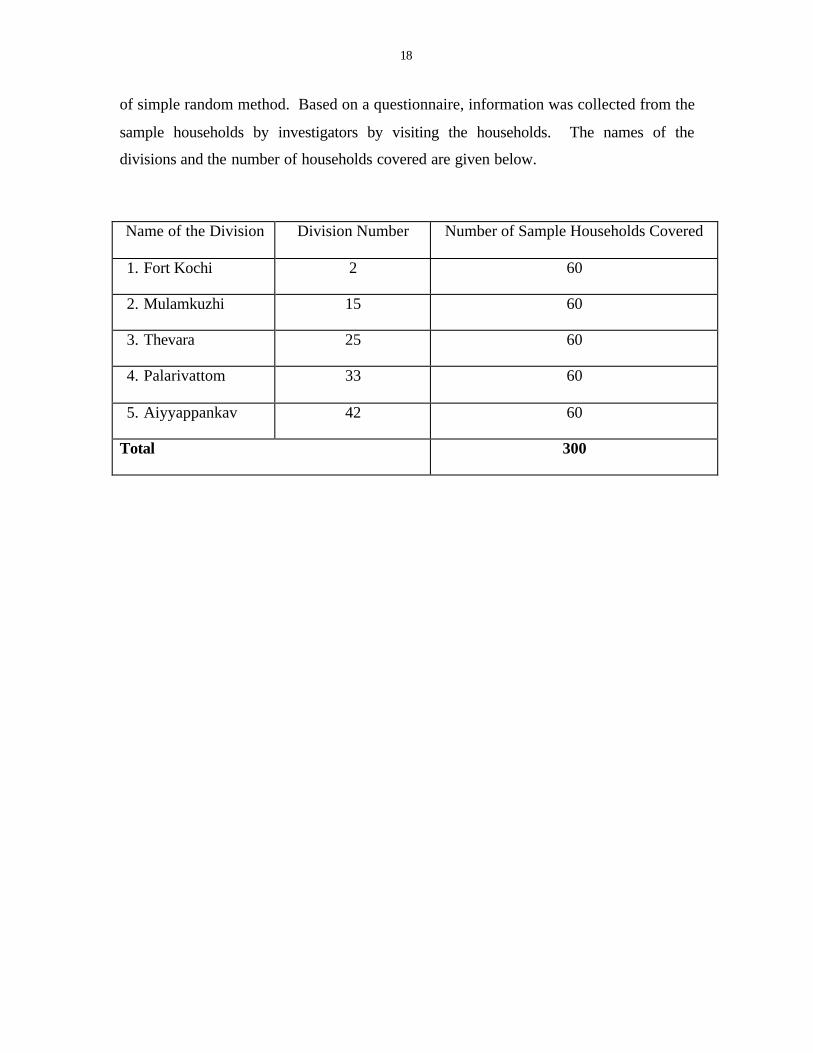
of simple random method. Based on a questionnaire, information was collected from the
sample households by investigators by visiting the households. The names of the
divisions and the number of households covered are given below.
Name of the Division Division Number Number of Sample Households Covered
1. Fort Kochi 2 60
2. Mulamkuzhi 15 60
3. Thevara 25 60
4. Palarivattom 33 60
5. Aiyyappankav 42 60
Total 300

19
III. Urban Unemployment in Kerala
In this section we present a review of the nature and magnitude of urban
unemployment in Kerala based on the surveys conducted by the Department of
Economics and Statistics (DES) and National Sample Survey Organisation (NSS). The
two surveys conducted by DES during 1980’s give some idea about the urban
unemployment prevailed in Kerala during 1980’s.
DES Surveys on Unemployment
The DES Housing and Employment Survey of 1980 provide an
estimate about the urban and rural unemployment of Kerala. In this survey the
employment seekers or the unemployed are defined as those persons between the age of
15 and 60 who were not able to secure job even for a day during the previous year and
are actively searching for a job. Among the surveys conducted to estimate
unemployment, this survey has the merit of the largest coverage as it covered the entire
households of kerala except a few hilly pockets and the like. The survey estimated that
21.5 percent of the urban labour force are unemployed in Kerala in 1980 (Table.1).The
survey results also suggests that the rate of urban unemployment was higher than the
rural unemployment.
Table.1 Distribution of the Unemployed (DES Survey 1980) Area Total Unemployed
(Number in thousands)
Unemployed as percentage of Labour force
Urban 214.07 21.5 Rural 1187.41 17.4 Total 1401.48 18.0
Source:DES, 1982.
Another survey conducted by the DES in 1987 also estimated the urban
unemployment in Kerala. In this survey the term employment seekers or the unemployed
include two categories of unemployed persons namely chronically unemployed and
underemployed persons. Chronically unemployed or openly unemployed persons are
defined as those who had not worked a single day during the reference year and are
available and seeking employment. The underemployed is defined as those who worked
for atleast one day during the year, but not worked for major part of the year (less than
20
183 days) and are available and seeking work for more days. Here, the unemployed
include persons belonging to all age groups of the population.
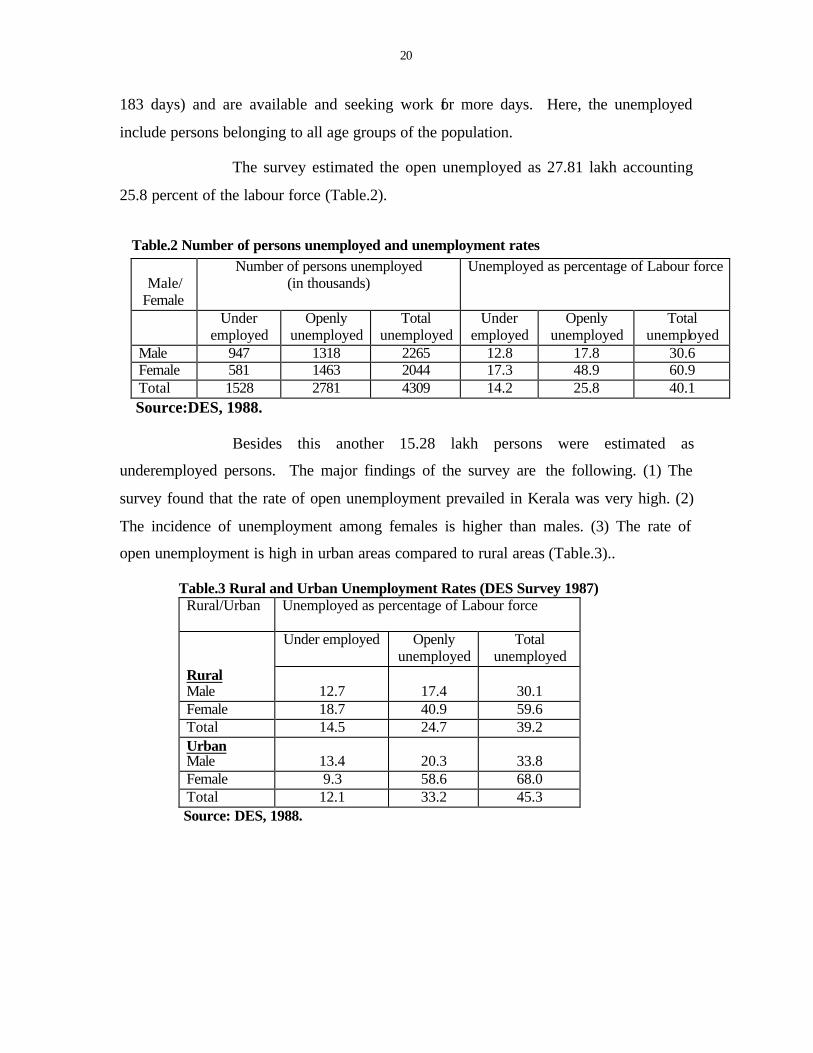
The survey estimated the open unemployed as 27.81 lakh accounting
25.8 percent of the labour force (Table.2).
Table.2 Number of persons unemployed and unemployment rates
Male/ Female
Number of persons unemployed (in thousands)
Unemployed as percentage of Labour force
Under employed
Openly unemployed
Total unemployed
Under employed
Openly unemployed
Total unemployed
Male 947 1318 2265 12.8 17.8 30.6 Female 581 1463 2044 17.3 48.9 60.9 Total 1528 2781 4309 14.2 25.8 40.1
Source:DES, 1988.
Besides this another 15.28 lakh persons were estimated as
underemployed persons. The major findings of the survey are the following. (1) The
survey found that the rate of open unemployment prevailed in Kerala was very high. (2)
The incidence of unemployment among females is higher than males. (3) The rate of
open unemployment is high in urban areas compared to rural areas (Table.3)..
Table.3 Rural and Urban Unemployment Rates (DES Survey 1987) Rural/Urban Unemployed as percentage of Labour force
Under employed
Openly unemployed
Total unemployed
Rural Male
12.7
17.4
30.1
Female 18.7 40.9 59.6 Total 14.5 24.7 39.2 Urban Male
13.4
20.3
33.8
Female 9.3 58.6 68.0 Total 12.1 33.2 45.3
Source: DES, 1988.
21
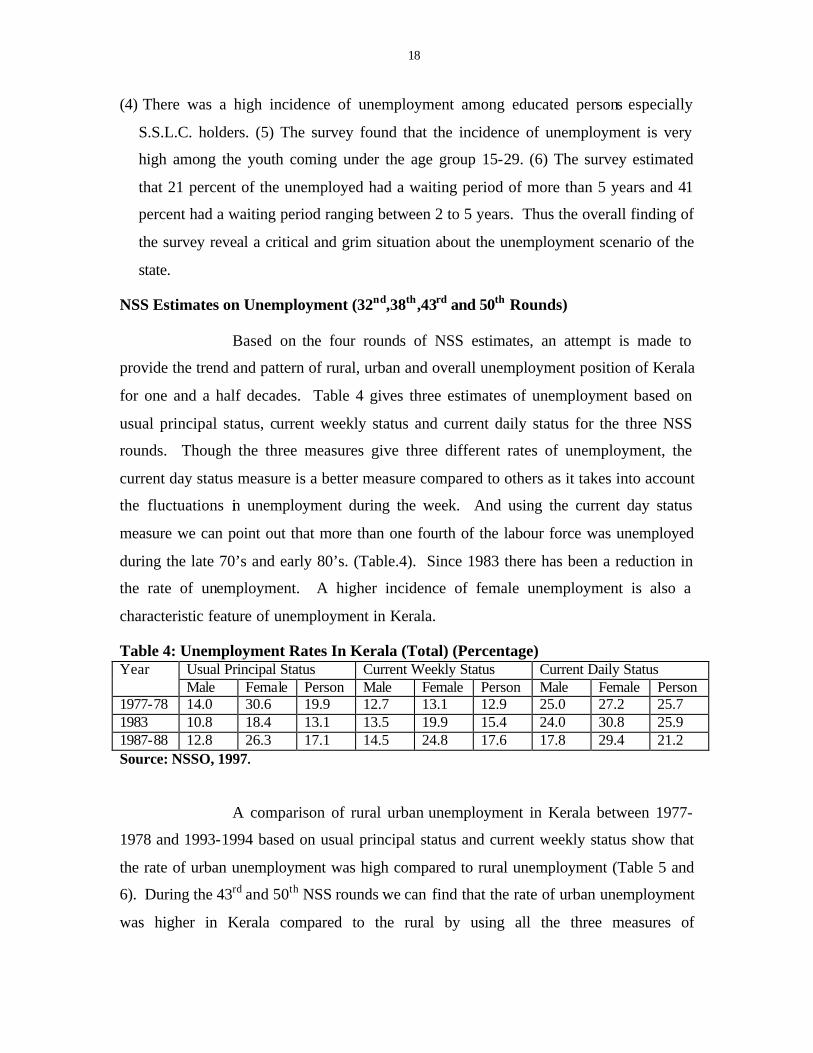
(4) There was a high incidence of unemployment among educated persons especially
S.S.L.C. holders. (5) The survey found that the incidence of unemployment is very
high among the youth coming under the age group 15-29. (6) The survey estimated
that 21 percent of the unemployed had a waiting period of more than 5 years and 41
percent had a waiting period ranging between 2 to 5 years. Thus the overall finding of
the survey reveal a critical and grim situation about the unemployment scenario of the
state.
NSS Estimates on Unemployment (32nd,38th,43rd and 50th Rounds)
Based on the four rounds of NSS estimates, an attempt is made to
provide the trend and pattern of rural, urban and overall unemployment position of Kerala
for one and a half decades. Table 4 gives three estimates of unemployment based on
usual principal status, current weekly status and current daily status for the three NSS
rounds. Though the three measures give three different rates of unemployment, the
current day status measure is a better measure compared to others as it takes into account
the fluctuations in unemployment during the week. And using the current day status
measure we can point out that more than one fourth of the labour force was unemployed
during the late 70’s and early 80’s. (Table.4). Since 1983 there has been a reduction in
the rate of unemployment. A higher incidence of female unemployment is also a
characteristic feature of unemployment in Kerala.
Table 4: Unemployment Rates In Kerala (Total) (Percentage) Year Usual Principal Status Current Weekly Status Current Daily Status Male Female Person Male Female Person Male Female Person 1977-78 14.0 30.6 19.9 12.7 13.1 12.9 25.0 27.2 25.7 1983 10.8 18.4 13.1 13.5 19.9 15.4 24.0 30.8 25.9 1987-88 12.8 26.3 17.1 14.5 24.8 17.6 17.8 29.4 21.2 Source: NSSO, 1997.
A comparison of rural urban unemployment in Kerala between 1977-
1978 and 1993-1994 based on usual principal status and current weekly status show that
the rate of urban unemployment was high compared to rural unemployment (Table 5 and
6). During the 43rd and 50th NSS rounds we can find that the rate of urban unemployment
was higher in Kerala compared to the rural by using all the three measures of
18
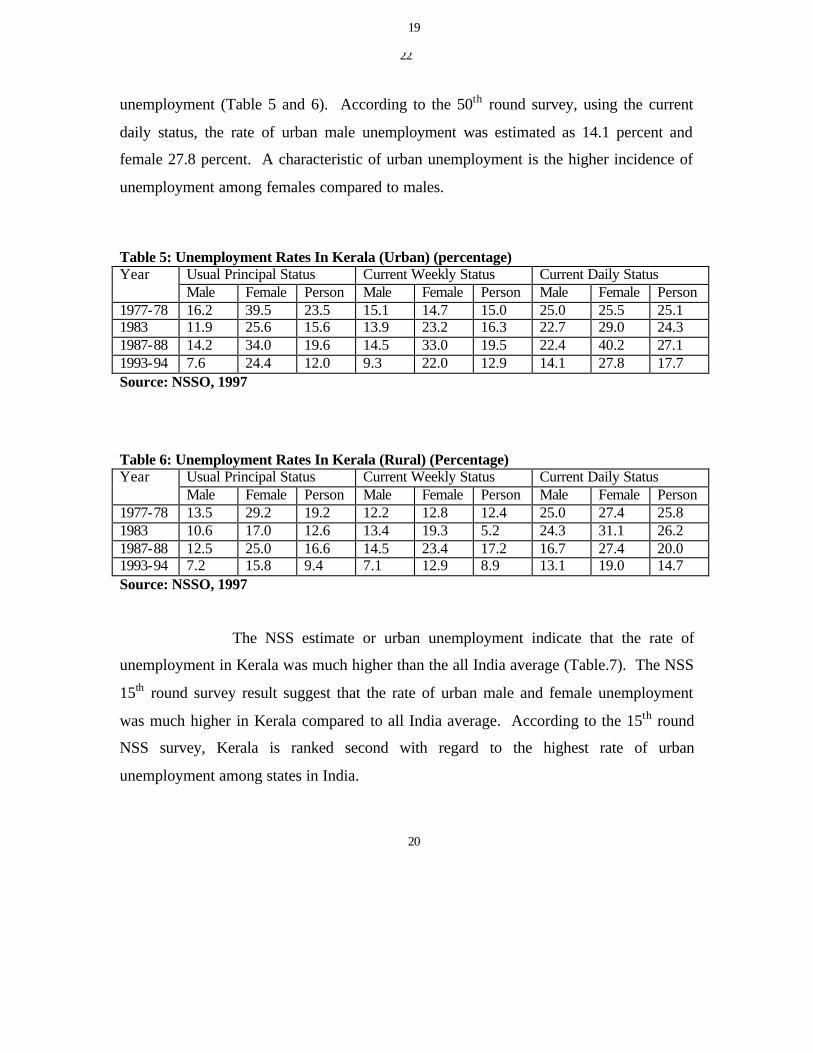
22
unemployment (Table 5 and 6). According to the 50th round survey, using the current
daily status, the rate of urban male unemployment was estimated as 14.1 percent and
female 27.8 percent. A characteristic of urban unemployment is the higher incidence of
unemployment among females compared to males.
Table 5: Unemployment Rates In Kerala (Urban) (percentage) Year Usual Principal Status Current Weekly Status Current Daily Status Male Female Person Male Female Person Male Female Person 1977-78 16.2 39.5 23.5 15.1 14.7 15.0 25.0 25.5 25.1 1983 11.9 25.6 15.6 13.9 23.2 16.3 22.7 29.0 24.3 1987-88 14.2 34.0 19.6 14.5 33.0 19.5 22.4 40.2 27.1 1993-94 7.6 24.4 12.0 9.3 22.0 12.9 14.1 27.8 17.7 Source: NSSO, 1997 Table 6: Unemployment Rates In Kerala (Rural) (Percentage) Year Usual Principal Status Current Weekly Status Current Daily Status Male Female Person Male Female Person Male Female Person 1977-78 13.5 29.2 19.2 12.2 12.8 12.4 25.0 27.4 25.8 1983 10.6 17.0 12.6 13.4 19.3 5.2 24.3 31.1 26.2 1987-88 12.5 25.0 16.6 14.5 23.4 17.2 16.7 27.4 20.0 1993-94 7.2 15.8 9.4 7.1 12.9 8.9 13.1 19.0 14.7 Source: NSSO, 1997
The NSS estimate or urban unemployment indicate that the rate of
unemployment in Kerala was much higher than the all India average (Table.7). The NSS
15th round survey result suggest that the rate of urban male and female unemployment
was much higher in Kerala compared to all India average. According to the 15th round
NSS survey, Kerala is ranked second with regard to the highest rate of urban
unemployment among states in India.
19
20

23
Table 7: Urban Unemployment Rate 1993-94 (Percentage) Kerala All India
Male Female Person Male Female Person Usual Principal Status
7.6 24.4 12.0 4.5 8.3 5.2
Current Weekly Status
9.3 22.0 12.9 5.2 8.4 5.8
Current Daily Status 14.1 27.8 17.7 6.7 10.5 7.4 Source: Sarvekshana, July -September 1996.
The NSS survey results suggest that a sizeable section of the young
labour force in urban areas are unemployed. An agewise distribution of the urban
unemployed persons in Kerala revealed that more than one fourth of the labour force
belong to the age group 15-29. ( Table.8). On the otherhand, only a small portion of the
young labour force are unemployed if we take the national average. Nearly 45 percent of
the unemployed female labour force in Kerala belong to the age group 15-29. The NSS
survey findings also suggest that the rate of unemployment among educated unemployed
is much higher in Kerala. According to NSS 50th round, more than one fifth of the
educated persons are unemployed in kerala (Table.9). More than one third of the female
educated labour force is also unemployed. A comparison of the educated unemployment
in Kerala with the national average suggest that the rate of educated unemployment in
Kerala is
much high.
21

24
Table 8: Urban Unemployment Rate 1993-94 (Usual Principal Status) Kerala All India Age
Male Female Person Male Female Person 15-19 33.5 43.7 36.8 13.4 16.8 14.1 20-24 21.2 47.7 29.7 13.9 27.7 16.5 25-29 10.1 42.1 18.4 6.7 12.9 7.8 15-29 19.0 45.2 26.8 10.8 19.4 12.4
Source: Sarvekshana, July -September 1996
Table 9: Urban Unemployment Rate For The Educated, 1993-94 (15 Years and above)
Kerala All India Male Female Person Male Female Person
Usual Status 12.6 40.6 21.4 6.9 20.6 8.9 Current Weekly Status
13.3 36.5 20.7 7.0 19.6 9.0
Source: Sarvekshana, July -September 1996.
25
IV. A Profile of Kochi City, the Study Area
History
Kerala began its trade relations with the world about five thousand
years ago. Kerala was well known for its spices and this was the factor which attracted
foreigners to the state. In the beginning trade was carried out through sea. Kochi gained
importance after Musiris port near Kodungalloor was closed due to a flood in 1341. It
was in 1502 that Vasco da Gama arrived in Kochi. It was after the arrival of Vasco da
Gama that Kochi began to extend its trade with the rest of the world significantly. After
his arrival, Kochi came under the dominance of the Portugeese. Kochi was under the rule
of Portugeese from 1502 to 1663. At this period there were frequent wars between the
King of Kozhikode and the Samoothiris. Eventhough the Portugeese did not at first
engage in the war, later they supported the king in defeating the Samoothiris.
The idea of the Portugeese behind the friendly relationship with the
King of Kochi was to protect their trade interests. For the realisation of this objective,
they established a Fort in Kochi with the consent of the king. It was the first European
Fort in India. Later they defeated the Samoothiris and captured Kodungalloor. In 1557,
the Portugeese constructed the Santa Cruz church. In 1555 the Portugeese built a palace
for the King of Kochi at Mattancherry. Today this is known as the Dutch palace as the
Dutch who came after the Portugeese in 1663 made some modifications in it.
In 1565 the Jews reached Kochi from Kodungalloor. The Kochi Raja
agreed to protect them. In 1567 they constructed a church which is attracting tourists
from many parts of the world even today. The Chineese were the next who influenced
the people of Kochi after the Jews. This is evident from the Chineese nets, pots, and also
Chineese silks which is seen in Kochi even today.
The supremacy of the Dutch continued till 1795 when the British East
India Company captured power from them. The British established their supremacy in
the economic, social and cultural fronts of Kochi. The British had contributed much in
developing Kochi into a modern city. Under the direct rule of the British, Fort Kochi
became a municipal town in 1866. During the British period Kochi made considerable
22

26
progress in the industrial and commercial activities. There was substantial increase in
exports and imports through Kochi port under the British colonial rule. The major items
of export were coffee, coconut, pepper, oil, spices etc. And the items of import were
food grains, metals, textiles, oil seeds etc.
The English school which was established in Ernakulam in 1845 was
accorded the status of a college in 1875. It is known as Maharajas college sine 1925. The
famous ‘Wellington’ island, a man made island, was developed during the British period.
The island which can be reached by air, water and road later became an important trading
centre in Kochi. The most significant contribution of the British was the construction of
the modern port in Kochi in 1929.
It was in 1905 that railway line was extended to Kochi. The airport in
Wellington island had helped Kochi to extent its contacts with other important cities.
Ernakulam lies on the sides of the famous Vembanad lake. It was the capital of Kochi
Raja till the unification of Travancore Kochi in July 1949.
The Kochi Municipal Corporation in the present form was formulated
on 1st November 1967. It comprises an area of 94.88 square kilometres coming under the
municipalities namely Fort Kochi, Mattancherry and Ernakulam and the panchayats such
as Pallurithi, Vyttila, Vennala and Edappally. Of this, Fort Kochi belong to the region of
Malabar, Edappally under Travancore and the rest of the areas belong to Kochi state.
Population
Kochi city is a commercial, industrial and port city witnessing rapid
changes during the last three decades. The city has an area of 95 sq.kms spread over in
two taluks, Kochi and Kanayannoor. According to 1991 census, the city had 108,924
households with a population of 5.64 lakh (Table.10).
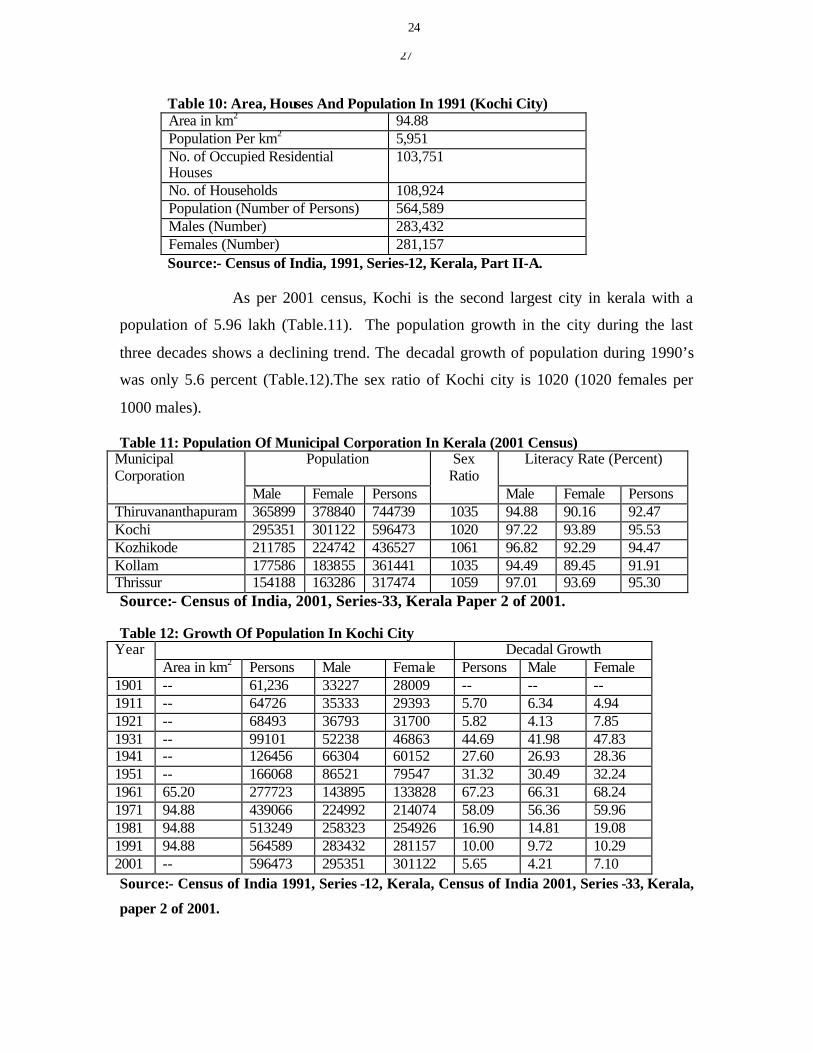
27
Table 10: Area, Houses And Population In 1991 (Kochi City) Area in km2 94.88 Population Per km2 5,951 No. of Occupied Residential Houses
103,751
No. of Households 108,924 Population (Number of Persons) 564,589 Males (Number) 283,432 Females (Number) 281,157
Source:- Census of India, 1991, Series-12, Kerala, Part II-A.
As per 2001 census, Kochi is the second largest city in kerala with a
population of 5.96 lakh (Table.11). The population growth in the city during the last
three decades shows a declining trend. The decadal growth of population during 1990’s
was only 5.6 percent (Table.12).The sex ratio of Kochi city is 1020 (1020 females per
1000 males).
Table 11: Population Of Municipal Corporation In Kerala (2001 Census) Municipal Corporation
Population Sex Ratio
Literacy Rate (Percent)
Male Female Persons Male Female Persons Thiruvananthapuram 365899 378840 744739 1035 94.88 90.16 92.47 Kochi 295351 301122 596473 1020 97.22 93.89 95.53 Kozhikode 211785 224742 436527 1061 96.82 92.29 94.47 Kollam 177586 183855 361441 1035 94.49 89.45 91.91 Thrissur 154188 163286 317474 1059 97.01 93.69 95.30 Source:- Census of India, 2001, Series-33, Kerala Paper 2 of 2001. Table 12: Growth Of Population In Kochi City
Year Decadal Growth Area in km2 Persons Male Female Persons Male Female 1901 -- 61,236 33227 28009 -- -- -- 1911 -- 64726 35333 29393 5.70 6.34 4.94 1921 -- 68493 36793 31700 5.82 4.13 7.85 1931 -- 99101 52238 46863 44.69 41.98 47.83 1941 -- 126456 66304 60152 27.60 26.93 28.36 1951 -- 166068 86521 79547 31.32 30.49 32.24 1961 65.20 277723 143895 133828 67.23 66.31 68.24 1971 94.88 439066 224992 214074 58.09 56.36 59.96 1981 94.88 513249 258323 254926 16.90 14.81 19.08 1991 94.88 564589 283432 281157 10.00 9.72 10.29 2001 -- 596473 295351 301122 5.65 4.21 7.10 Source:- Census of India 1991, Series -12, Kerala, Census of India 2001, Series -33, Kerala,
paper 2 of 2001.
24
28
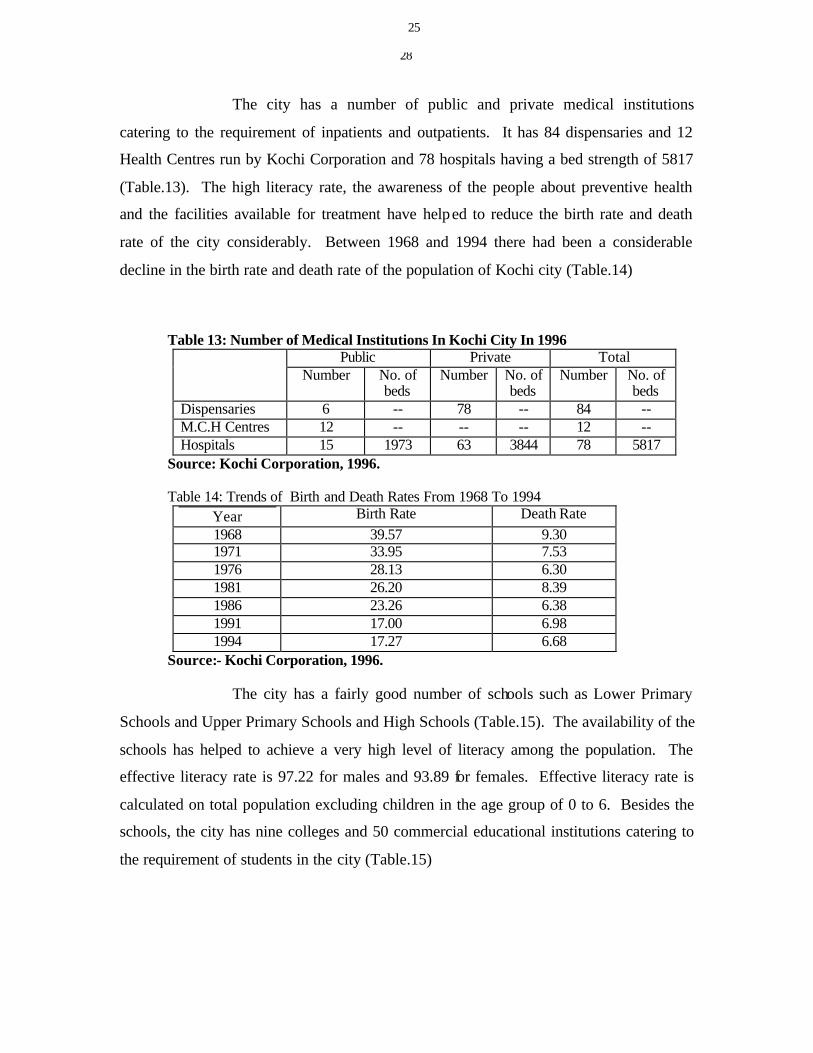
The city has a number of public and private medical institutions
catering to the requirement of inpatients and outpatients. It has 84 dispensaries and 12
Health Centres run by Kochi Corporation and 78 hospitals having a bed strength of 5817
(Table.13). The high literacy rate, the awareness of the people about preventive health
and the facilities available for treatment have helped to reduce the birth rate and death
rate of the city considerably. Between 1968 and 1994 there had been a considerable
decline in the birth rate and death rate of the population of Kochi city (Table.14)
Table 13: Number of Medical Institutions In Kochi City In 1996 Public Private Total Number No. of
beds Number No. of
beds Number No. of
beds Dispensaries 6 -- 78 -- 84 -- M.C.H Centres 12 -- -- -- 12 -- Hospitals 15 1973 63 3844 78 5817
Source: Kochi Corporation, 1996.
Table 14: Trends of Birth and Death Rates From 1968 To 1994 Year Birth Rate Death Rate 1968 39.57 9.30 1971 33.95 7.53 1976 28.13 6.30 1981 26.20 8.39 1986 23.26 6.38 1991 17.00 6.98 1994 17.27 6.68
Source:- Kochi Corporation, 1996.
The city has a fairly good number of schools such as Lower Primary
Schools and Upper Primary Schools and High Schools (Table.15). The availability of the
schools has helped to achieve a very high level of literacy among the population. The
effective literacy rate is 97.22 for males and 93.89 for females. Effective literacy rate is
calculated on total population excluding children in the age group of 0 to 6. Besides the
schools, the city has nine colleges and 50 commercial educational institutions catering to
the requirement of students in the city (Table.15)
25

29
Table 15: Number Of Educational Institutions In Kochi
Category of Institution
Government Private Total
(a) Lower Primary Schools
15 54 69
(b) Upper Primary Schools
6 22 28
(c) High Schools 16
32
48
(d) Other Schools 1) Nursery School 2) Training
School
2 1
33 3
35 4
(e) Colleges 2
7
9
(f) Other Commercial Institutions
1 49 50
Total 43 200 243 Source: Kochi Corporation, 1996.
Employment and Poverty
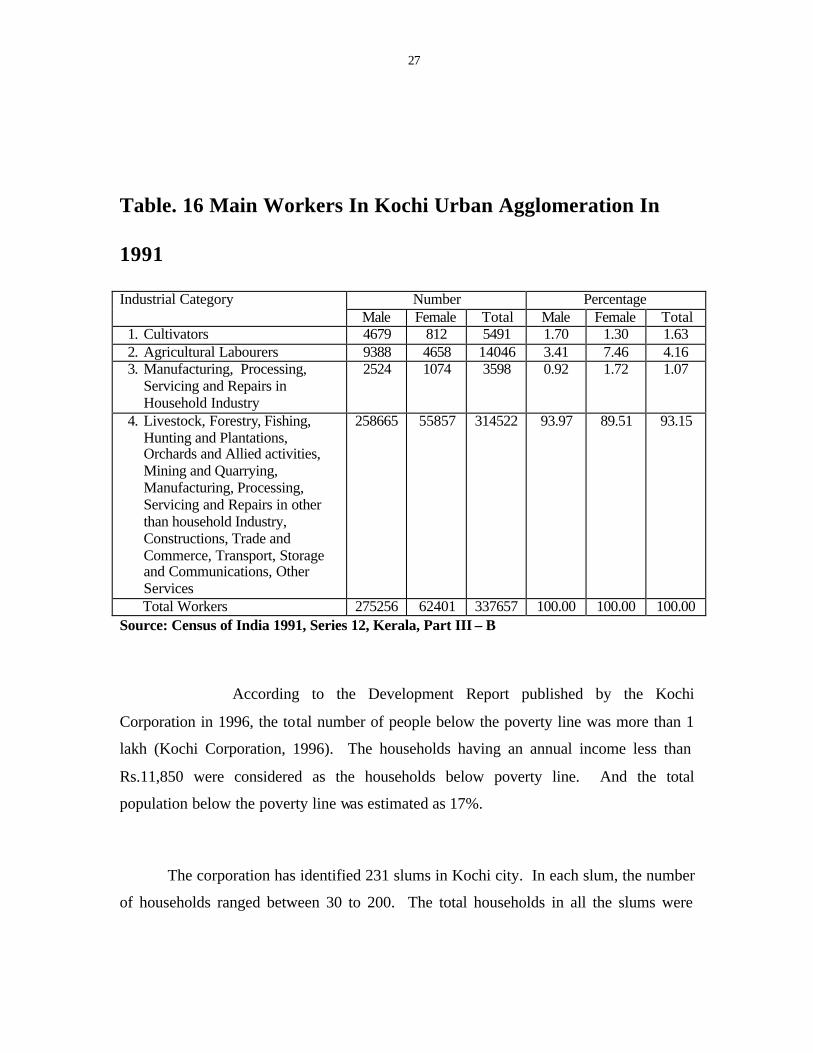
We do not have data to show the industrial or occupational category of
workers in Kochi city. But the 1991 census has published an industrial category of main
workers for the Kochi urban agglomeration. Besides Kochi Corporation, the urban
agglomeration includes the towns and urban outgrowths adjoining the Kochi city (Note
1). The 1991 census has estimated that of the total main workers in Kochi urban
agglomeration, 1.6 percent is cultivators, 4.1 percent, agricultural labourers and 1 percent
are engaged in household, industrial and service activities. The rest of them were
engaged in activities such as livestock, forestry, fishing, hunting and plantations, orchards
and allied activities, mining and quarrying, manufacturing, processing, servicing and
repairs in other than household industry, constructions, trade and commerce, transport
storage and communications and other services (Table.16). This indicates that Kochi is a
highly urbanised area having employment only in non agricultural activities.
26
30
Table. 16 Main Workers In Kochi Urban Agglomeration In
1991
Number Percentage Industrial Category Male Female Total Male Female Total
1. Cultivators 4679 812 5491 1.70 1.30 1.63 2. Agricultural Labourers 9388 4658 14046 3.41 7.46 4.16 3. Manufacturing, Processing,
Servicing and Repairs in Household Industry
2524 1074 3598 0.92 1.72 1.07
4. Livestock, Forestry, Fishing, Hunting and Plantations, Orchards and Allied activities, Mining and Quarrying, Manufacturing, Processing, Servicing and Repairs in other than household Industry, Constructions, Trade and Commerce, Transport, Storage and Communications, Other Services
258665 55857 314522 93.97 89.51 93.15
Total Workers 275256 62401 337657 100.00 100.00 100.00 Source: Census of India 1991, Series 12, Kerala, Part III – B
According to the Development Report published by the Kochi
Corporation in 1996, the total number of people below the poverty line was more than 1
lakh (Kochi Corporation, 1996). The households having an annual income less than
Rs.11,850 were considered as the households below poverty line. And the total
population below the poverty line was estimated as 17%.
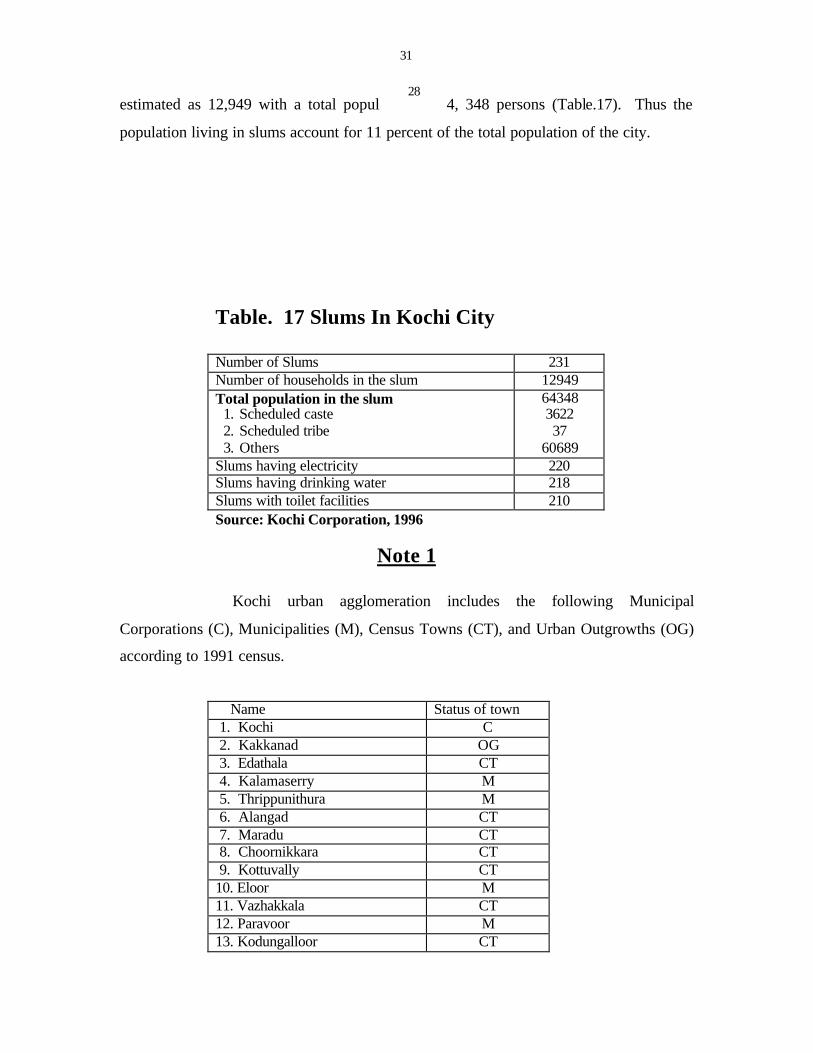
The corporation has identified 231 slums in Kochi city. In each slum, the number
of households ranged between 30 to 200. The total households in all the slums were
27
31
estimated as 12,949 with a total population of 64, 348 persons (Table.17). Thus the
population living in slums account for 11 percent of the total population of the city.
Table. 17 Slums In Kochi City
Number of Slums 231 Number of households in the slum 12949 Total population in the slum
1. Scheduled caste 2. Scheduled tribe 3. Others
64348 3622 37
60689 Slums having electricity 220 Slums having drinking water 218 Slums with toilet facilities 210 Source: Kochi Corporation, 1996
Note 1
Kochi urban agglomeration includes the following Municipal
Corporations (C), Municipalities (M), Census Towns (CT), and Urban Outgrowths (OG)
according to 1991 census.
Name Status of town 1. Kochi C 2. Kakkanad OG 3. Edathala CT 4. Kalamaserry M 5. Thrippunithura M 6. Alangad CT 7. Maradu CT 8. Choornikkara CT 9. Kottuvally CT 10. Eloor M 11. Vazhakkala CT 12. Paravoor M 13. Kodungalloor CT
28

32
14. Aluva M 15. Varappuzha CT 16. Maluvukad CT 17. Cheranalloor CT 18. Kedamangalam CT 19. Thiruvamkulam CT 20. Cheriyakadavu CT
Source: Census of India, 1991, series - 12, Kerala, Part II-A.
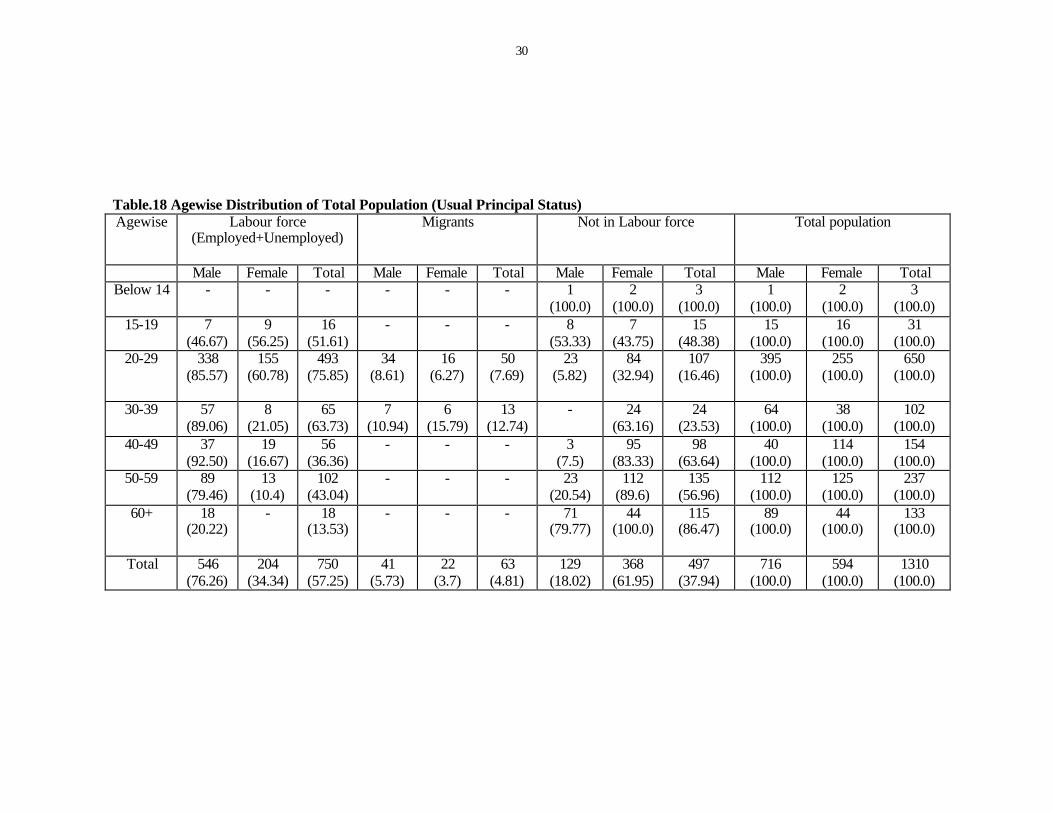
V. Population in the Sample Households 1. Population and Labour force: In this section we present a profile of the population of
the sample survey conducted in 300 households in Kochi city. The population is
classified into labour force, migrants and not in labour force. An attempt is also made
to examine the socio-economic characteristics of the sample households based on the
occupation of the Head of the Household. According to the sample survey, the total
population in the 300 sample households was 1310 comprising 716 males and 594
females (Table.18). Of the total population, the labour force accounts for 57.2
percent, migrants 4.8 percent and persons not in labour force is 37.9 percent. The
survey results suggest that nearly half of the population are young and belong to the
age group of 20-29 (Table.19). The old people aged 60 and above accounted for 10
percent of the total population of the sample (Table.19). It may also be noted that 79
percent of the migrants belong to the age group ranging between 20-29.
29
29
Table.18 Agewise Distribution of Total Population (Usual Principal Status) Agewise Labour force
(Employed+Unemployed)
Migrants
Not in Labour force
Total population
Male Female Total Male Female Total Male Female Total Male Female Total Below 14 -
- - - - - 1
(100.0) 2
(100.0) 3
(100.0) 1
(100.0) 2
(100.0) 3
(100.0) 15-19 7
(46.67) 9
(56.25) 16
(51.61) - - - 8
(53.33) 7
(43.75) 15
(48.38) 15
(100.0) 16
(100.0) 31
(100.0) 20-29 338
(85.57) 155
(60.78) 493
(75.85) 34
(8.61) 16
(6.27) 50
(7.69)
23 (5.82)
84 (32.94)
107 (16.46)
395 (100.0)
255 (100.0)
650 (100.0)
30-39 57
(89.06) 8
(21.05) 65
(63.73) 7
(10.94) 6
(15.79) 13
(12.74) - 24
(63.16) 24
(23.53) 64
(100.0) 38
(100.0) 102
(100.0) 40-49 37
(92.50) 19
(16.67) 56
(36.36) - - - 3
(7.5) 95
(83.33) 98
(63.64) 40
(100.0) 114
(100.0) 154
(100.0) 50-59 89
(79.46) 13
(10.4) 102
(43.04) - - - 23
(20.54) 112
(89.6) 135
(56.96) 112
(100.0) 125
(100.0) 237
(100.0) 60+ 18
(20.22) - 18
(13.53) - - - 71
(79.77) 44
(100.0) 115
(86.47)
89 (100.0)
44 (100.0)
133 (100.0)
Total 546 (76.26)
204 (34.34)
750 (57.25)
41 (5.73)
22 (3.7)
63 (4.81)
129 (18.02)
368 (61.95)
497 (37.94)
716 (100.0)
594 (100.0)
1310 (100.0)
30

30
Table.19 Agewise Distribution of Population (percentage)
Labour force (Employed+Unemployed)
Migrants Not in Labour force Total population Age- wise Male Female Total Male Female Total Male Female Total Male Female Total
Below 14
- - - - - - 0.78 0.54 0.60 0.14 0.34 0.23
15-19 1.28 4.41 2.13 - - - 6.20 1.90 3.02 2.09 2.69 2.37 20-29 61.90 75.98 65.73 82.93 72.73 79.37 17.83 22.83 21.53 55.17 42.93 49.62 30-39 10.44 3.92 8.67 17.07 27.27 20.63 - 6.52 4.83 8.94 6.40 7.79 40-49 6.78 9.31 7.47 - - - 2.33 25.82 19.72 5.59 19.19 11.75 50-59 16.30 6.37 13.60 - - - 17.83 30.43 27.16 15.64 21.04 18.09 60+ 3.30 - 2.40 - - - 55.04 11.96 23.14 12.43 7.41 10.15
Total 100.0 100.0 100.0 100.0 100.0 100.0 100.0 100.0 100.0 100.0 100.0 100.0
31
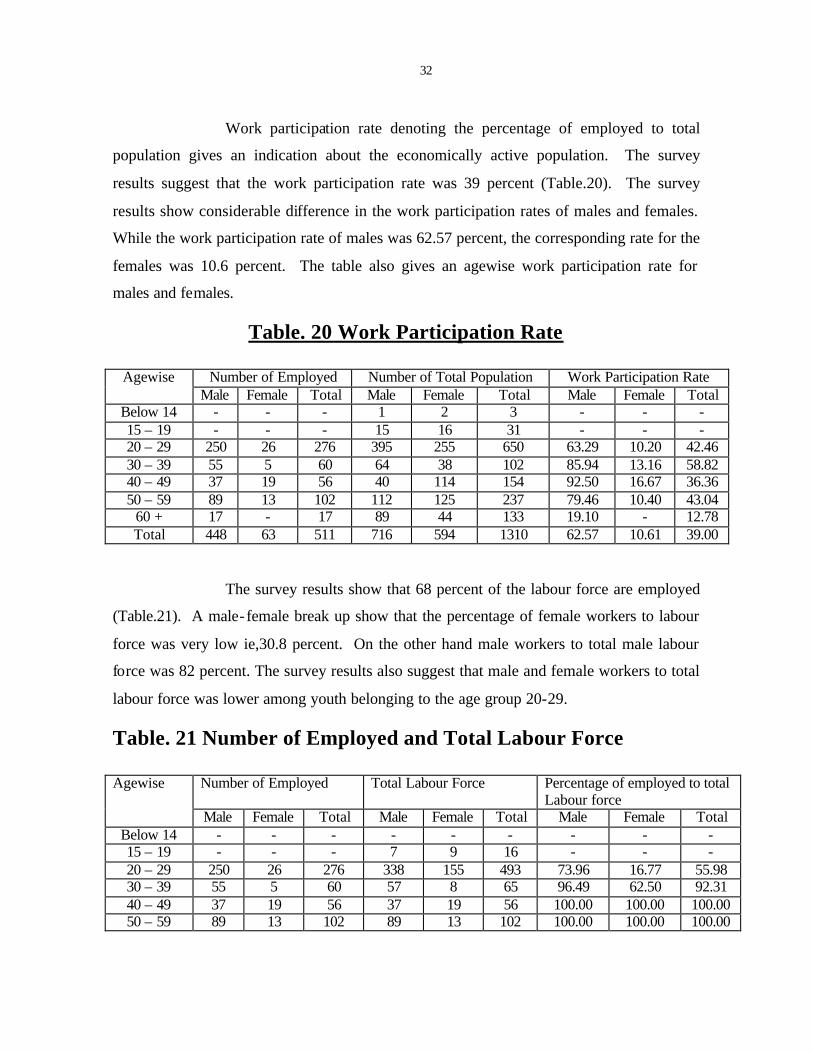
Work participation rate denoting the percentage of employed to total
population gives an indication about the economically active population. The survey
results suggest that the work participation rate was 39 percent (Table.20). The survey
results show considerable difference in the work participation rates of males and females.
While the work participation rate of males was 62.57 percent, the corresponding rate for the
females was 10.6 percent. The table also gives an agewise work participation rate for
males and females.
Table. 20 Work Participation Rate
Number of Employed Number of Total Population Work Participation Rate Agewise Male Female Total Male Female Total Male Female Total
Below 14 - - - 1 2 3 - - - 15 – 19 - - - 15 16 31 - - - 20 – 29 250 26 276 395 255 650 63.29 10.20 42.46 30 – 39 55 5 60 64 38 102 85.94 13.16 58.82 40 – 49 37 19 56 40 114 154 92.50 16.67 36.36 50 – 59 89 13 102 112 125 237 79.46 10.40 43.04
60 + 17 - 17 89 44 133 19.10 - 12.78 Total 448 63 511 716 594 1310 62.57 10.61 39.00
The survey results show that 68 percent of the labour force are employed
(Table.21). A male-female break up show that the percentage of female workers to labour
force was very low ie,30.8 percent. On the other hand male workers to total male labour
force was 82 percent. The survey results also suggest that male and female workers to total
labour force was lower among youth belonging to the age group 20-29.
Table. 21 Number of Employed and Total Labour Force
Number of Employed Total Labour Force Percentage of employed to total Labour force
Agewise
Male Female Total Male Female Total Male Female Total Below 14 - - - - - - - - - 15 – 19 - - - 7 9 16 - - - 20 – 29 250 26 276 338 155 493 73.96 16.77 55.98 30 – 39 55 5 60 57 8 65 96.49 62.50 92.31 40 – 49 37 19 56 37 19 56 100.00 100.00 100.00 50 – 59 89 13 102 89 13 102 100.00 100.00 100.00
32

32
60 + 17 - 17 18 - 18 94.44 - 94.44 Total 448 63 511 546 204 750 82.05 30.88 68.13
The survey finding suggest that the incidence of unemployment was very
high in Kochi city. The unemployment rate for male was estimated as 17.9 percent and
females 69.1 percent (Table.22). In the case of youth belonging to the age group 20-29, the
rate of unemployment was reported as very high and alarming.
Table. 22 Unemployment Rate
Number of Employed Total Labour Force Unemployment Rate Agewise Male Female Total Male Female Total Male Female Total
Below 14 - - - - - - - - - 15 – 19 7 9 16 7 9 16 100.00 100.00 100.00 20 – 29 88 129 217 338 155 493 26.03 83.22 44.02 30 – 39 2 3 5 57 8 65 3.51 37.50 7.69 40 – 49 - - - 37 19 56 - - - 50 – 59 - - - 89 13 102 - - -
60 + 1 - 1 18 - 18 5.56 - 5.56 Total 98 141 239 546 204 750 17.95 69.12 31.87
The not in labour force comprises of students, old people and others. Out
of the total population coming under the category of not in labour force, 10.9 percent were
students, 21.9 percent old people and 67 percent were others (Table.23). Among the
students, nearly 95 percent belonged to the age group 20-24. On the other hand, among the
old people more than 70 percent belonged to the age 60 and above. The others include
female persons engaged in domestic duties and others who are not seeking or available for
work.
Table. 23 Population Not in Labour Force
Population Not in Labour Force Agewise Male Female Total
Below 14 1 2 3 15 – 19 8 7 15 20 – 29 23 84 107 30 – 39 - 24 24
33
33
40 – 49 3 95 98 50 – 59 23 112 135
60 + 71 44 115 Total 129 368 497
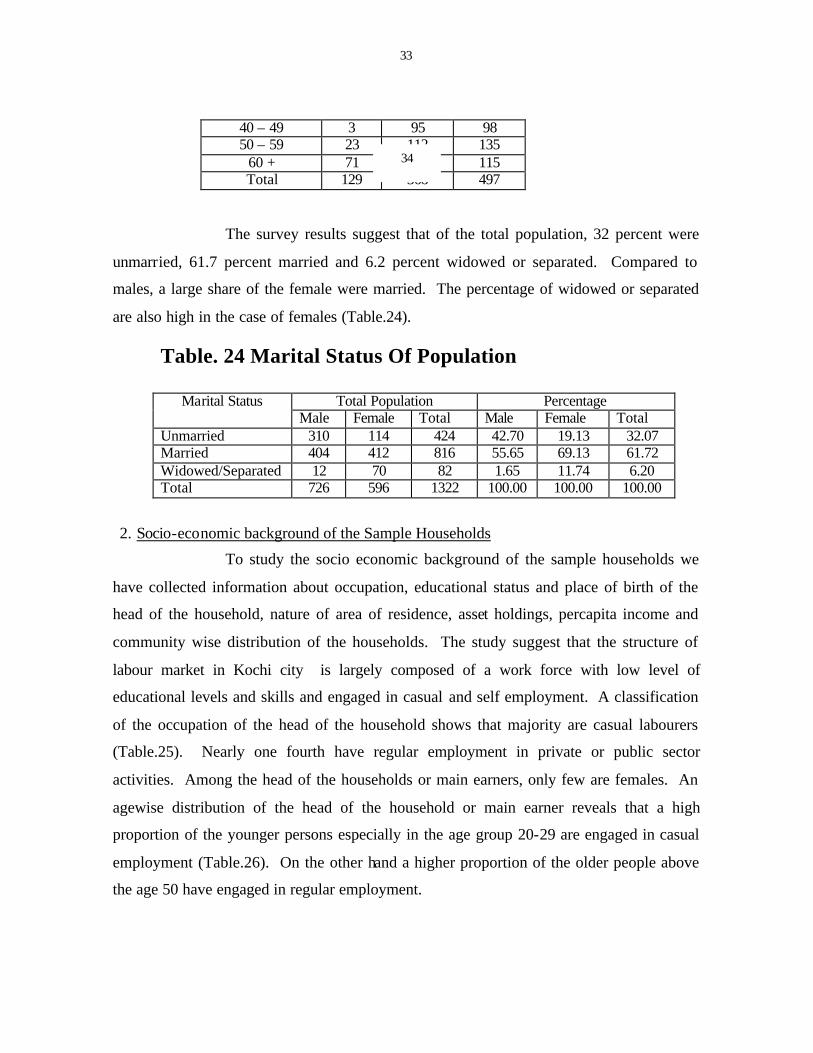
The survey results suggest that of the total population, 32 percent were
unmarried, 61.7 percent married and 6.2 percent widowed or separated. Compared to
males, a large share of the female were married. The percentage of widowed or separated
are also high in the case of females (Table.24).
Table. 24 Marital Status Of Population
Total Population Percentage Marital Status Male Female Total Male Female Total
Unmarried 310 114 424 42.70 19.13 32.07 Married 404 412 816 55.65 69.13 61.72 Widowed/Separated 12 70 82 1.65 11.74 6.20 Total 726 596 1322 100.00 100.00 100.00
2. Socio-economic background of the Sample Households
To study the socio economic background of the sample households we
have collected information about occupation, educational status and place of birth of the
head of the household, nature of area of residence, asset holdings, percapita income and
community wise distribution of the households. The study suggest that the structure of
labour market in Kochi city is largely composed of a work force with low level of
educational levels and skills and engaged in casual and self employment. A classification
of the occupation of the head of the household shows that majority are casual labourers
(Table.25). Nearly one fourth have regular employment in private or public sector
activities. Among the head of the households or main earners, only few are females. An
agewise distribution of the head of the household or main earner reveals that a high
proportion of the younger persons especially in the age group 20-29 are engaged in casual
employment (Table.26). On the other hand a higher proportion of the older people above
the age 50 have engaged in regular employment.
34
34
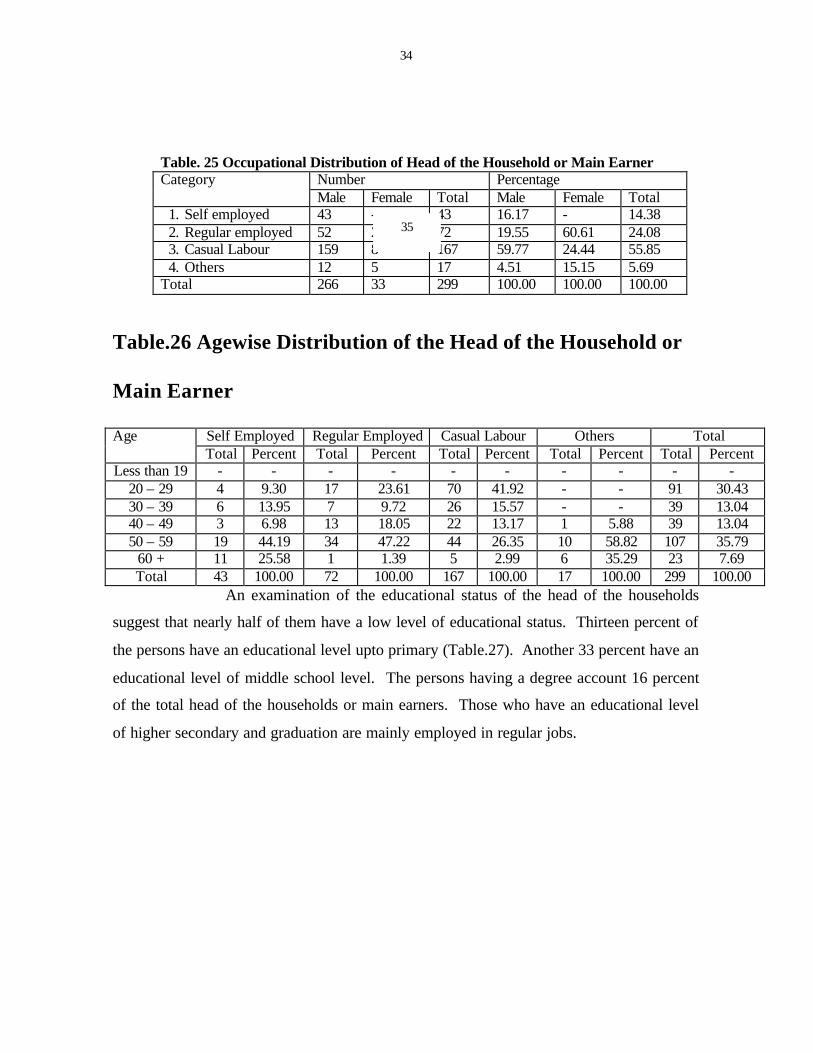
Table. 25 Occupational Distribution of Head of the Household or Main Earner Number Percentage Category Male Female Total Male Female Total
1. Self employed 43 - 43 16.17 - 14.38 2. Regular employed 52 20 72 19.55 60.61 24.08 3. Casual Labour 159 8 167 59.77 24.44 55.85 4. Others 12 5 17 4.51 15.15 5.69
Total 266 33 299 100.00 100.00 100.00
Table.26 Agewise Distribution of the Head of the Household or
Main Earner
Self Employed Regular Employed Casual Labour Others Total Age Total Percent Total Percent Total Percent Total Percent Total Percent
Less than 19 - - - - - - - - - - 20 – 29 4 9.30 17 23.61 70 41.92 - - 91 30.43 30 – 39 6 13.95 7 9.72 26 15.57 - - 39 13.04 40 – 49 3 6.98 13 18.05 22 13.17 1 5.88 39 13.04 50 – 59 19 44.19 34 47.22 44 26.35 10 58.82 107 35.79
60 + 11 25.58 1 1.39 5 2.99 6 35.29 23 7.69 Total 43 100.00 72 100.00 167 100.00 17 100.00 299 100.00
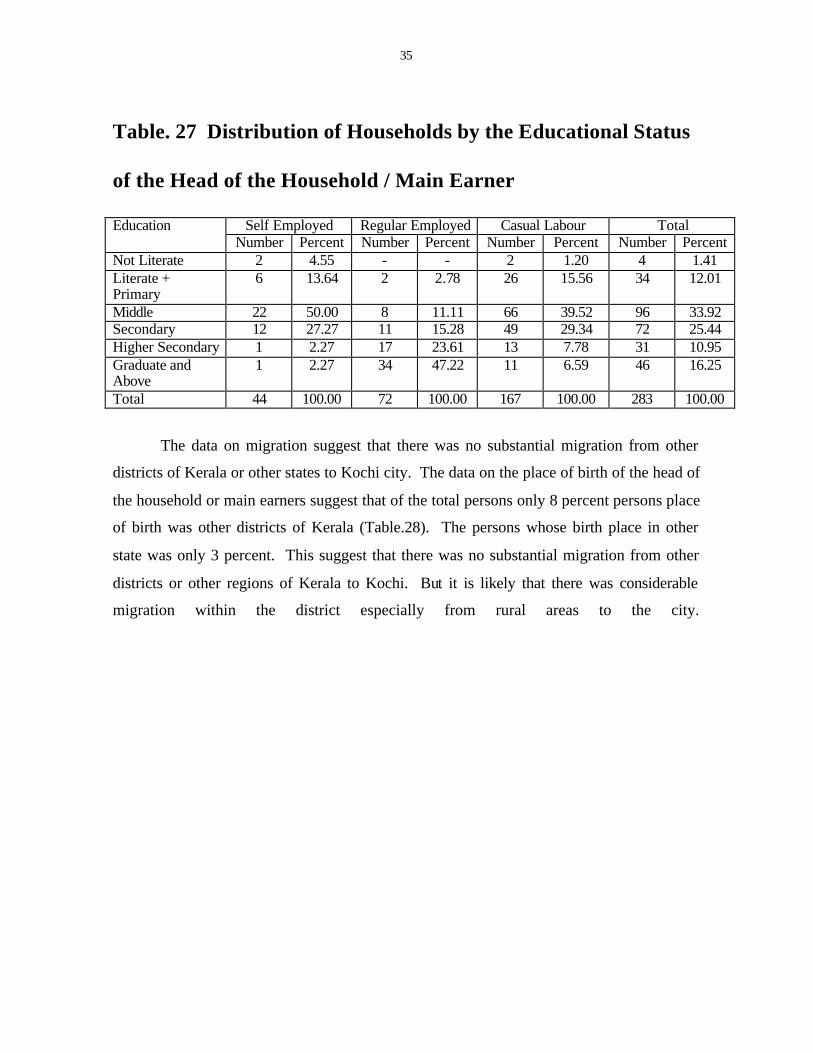
An examination of the educational status of the head of the households
suggest that nearly half of them have a low level of educational status. Thirteen percent of
the persons have an educational level upto primary (Table.27). Another 33 percent have an
educational level of middle school level. The persons having a degree account 16 percent
of the total head of the households or main earners. Those who have an educational level
of higher secondary and graduation are mainly employed in regular jobs.
35
35
Table. 27 Distribution of Households by the Educational Status
of the Head of the Household / Main Earner
Self Employed Regular Employed Casual Labour Total Education Number Percent Number Percent Number Percent Number Percent
Not Literate 2 4.55 - - 2 1.20 4 1.41 Literate + Primary
6 13.64 2 2.78 26 15.56 34 12.01
Middle 22 50.00 8 11.11 66 39.52 96 33.92 Secondary 12 27.27 11 15.28 49 29.34 72 25.44 Higher Secondary 1 2.27 17 23.61 13 7.78 31 10.95 Graduate and Above
1 2.27 34 47.22 11 6.59 46 16.25
Total 44 100.00 72 100.00 167 100.00 283 100.00
The data on migration suggest that there was no substantial migration from other
districts of Kerala or other states to Kochi city. The data on the place of birth of the head of
the household or main earners suggest that of the total persons only 8 percent persons place
of birth was other districts of Kerala (Table.28). The persons whose birth place in other
state was only 3 percent. This suggest that there was no substantial migration from other
districts or other regions of Kerala to Kochi. But it is likely that there was considerable
migration within the district especially from rural areas to the city.

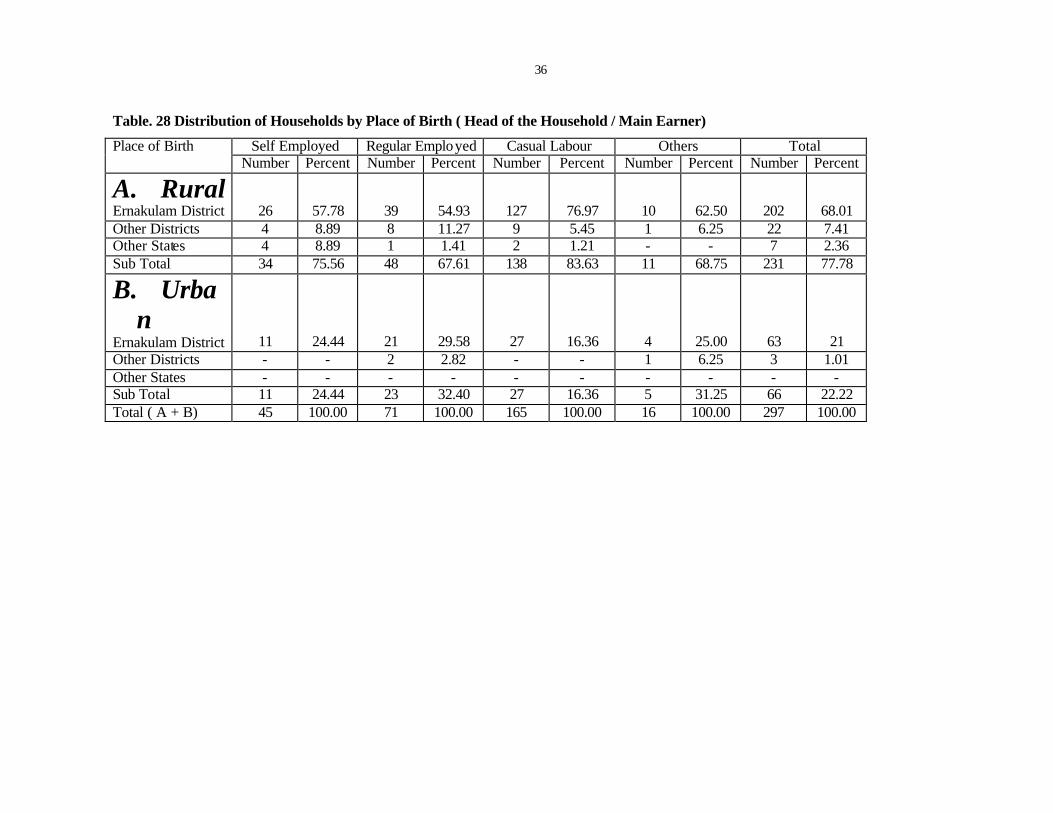
Table. 28 Distribution of Households by Place of Birth ( Head of the Household / Main Earner)
Self Employed Regular Employed Casual Labour Others Total Place of Birth Number Percent Number Percent Number Percent Number Percent Number Percent
A. Rural Ernakulam District
26
57.78
39
54.93
127
76.97
10
62.50
202
68.01
Other Districts 4 8.89 8 11.27 9 5.45 1 6.25 22 7.41 Other States 4 8.89 1 1.41 2 1.21 - - 7 2.36 Sub Total 34 75.56 48 67.61 138 83.63 11 68.75 231 77.78
B. Urban
Ernakulam District
11
24.44
21
29.58
27
16.36
4
25.00
63
21 Other Districts - - 2 2.82 - - 1 6.25 3 1.01 Other States - - - - - - - - - - Sub Total 11 24.44 23 32.40 27 16.36 5 31.25 66 22.22 Total ( A + B) 45 100.00 71 100.00 165 100.00 16 100.00 297 100.00
36 36

38
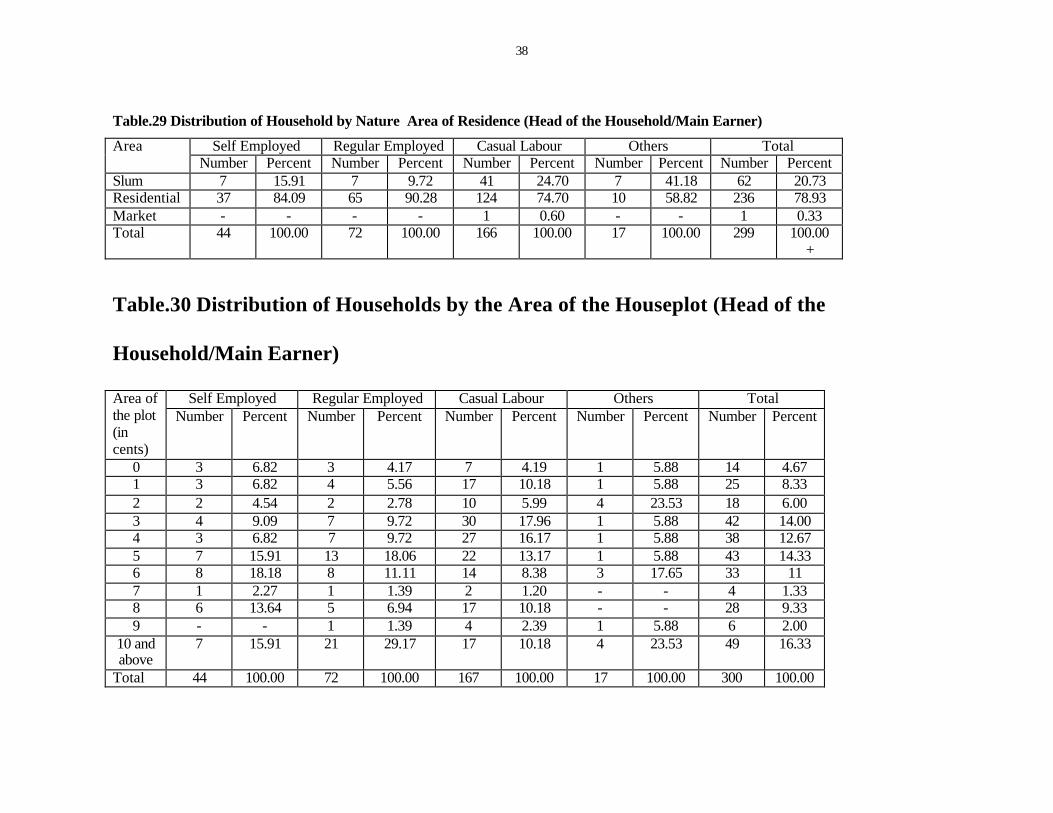
In Kochi city, a considerable share of population live in slum areas. The survey results show that 21
percent of the population are living in slum areas (Table.29). Compared to regular and self employed, a
higher proportion of casual labour households live in slum areas.
Due to low economic status, nearly 33 percent of the households have an
area of house plot upto 3 cents (Table.30). Another 38 percent of the households have an
area ranging between 4 to 6 cents. Only 16 percent of the households have an area of 10
cents or more. It may be noted that the regular employed have a larger area of house plot
compared to other categories.
The survey findings suggest that a considerable number of households in
Kochi city are poor households. A distribution of the households on the basis of monthly
percapita income reveals that one fourth have an income ranging below Rs.200 to 1000
(Table.31). All the households in this income group belonged to the category of casual
labour or self employed. Another 18 percent of the households having a percapita monthly
income ranged between Rs.1001 and 1800. These households are belonged to the category
of casual labour or self employed. Among the three employment categories, the regular
employed have the highest percapita income.
The population in Kochi city can be grouped into three categories on the
basis of caste viz. Forward caste, Other Backward communities and Scheduled Caste and
Tribe. A castewise distribution of the households shows that other backward communities
account for 76 percent of the households (Table.32). The share of the forward communities
is 19 percent and scheduled caste and tribe 4 percent. Majority of the head of the
household or main earner who belonged to forward caste are employed in regular jobs. In
the case of backward communities only one fifth are employed in regular jobs. On the other
hand, nobody from scheduled caste or tribe is employed in regular jobs.
37 38 37
39
Table.29 Distribution of Household by Nature Area of Residence (Head of the Household/Main Earner)
Self Employed Regular Employed Casual Labour Others Total Area Number Percent Number Percent Number Percent Number Percent Number Percent
Slum 7 15.91 7 9.72 41 24.70 7 41.18 62 20.73 Residential 37 84.09 65 90.28 124 74.70 10 58.82 236 78.93 Market - - - - 1 0.60 - - 1 0.33 Total 44 100.00 72 100.00 166 100.00 17 100.00 299 100.00
+
Table.30 Distribution of Households by the Area of the Houseplot (Head of the
Household/Main Earner)
Self Employed Regular Employed Casual Labour Others Total Area of the plot (in cents)
Number Percent Number Percent Number Percent Number Percent Number Percent
0 3 6.82 3 4.17 7 4.19 1 5.88 14 4.67 1 3 6.82 4 5.56 17 10.18 1 5.88 25 8.33 2 2 4.54 2 2.78 10 5.99 4 23.53 18 6.00 3 4 9.09 7 9.72 30 17.96 1 5.88 42 14.00 4 3 6.82 7 9.72 27 16.17 1 5.88 38 12.67 5 7 15.91 13 18.06 22 13.17 1 5.88 43 14.33 6 8 18.18 8 11.11 14 8.38 3 17.65 33 11 7 1 2.27 1 1.39 2 1.20 - - 4 1.33 8 6 13.64 5 6.94 17 10.18 - - 28 9.33 9 - - 1 1.39 4 2.39 1 5.88 6 2.00
10 and above
7 15.91 21 29.17 17 10.18 4 23.53 49 16.33
Total 44 100.00 72 100.00 167 100.00 17 100.00 300 100.00
38

40
Table.31 Distribution of Households by Monthly Income of Head of the Household
Self Employed Regular Employed Casual Labour Others Total Household Monthly Percapita Income
Number Percent Number Percent Number Percent Number Percent Number Percent
Below 200 3 6.82 - - 3 1.80 17 100.00 23 7.67 201 – 400 - - - - 2 1.20 - - 2 0.67 401 – 600 1 2.27 - - 8 4.79 - - 9 3.00 601 – 800 1 2.27 - - 12 7.19 - - 13 4.33
801 – 1000 4 9.09 - - 19 11.38 - - 23 7.67 1001 – 1200 - - - - 12 7.19 - - 12 4.00 1201 – 1400 3 6.82 - - 4 2.39 - - 7 2.33 1401 – 1600 1 2.27 6 8.33 21 12.57 - - 28 9.33 1601 – 1800 - - - - 5 2.99 - - 5 1.67 1801 – 2000 7 15.91 5 6.94 24 14.37 - - 36 12.00 Above 2000 24 54.54 61 84.72 57 34.13 - - 142 47.33
Total 44 100.00 72 100.00 167 100.00 17 100.00 300 100.00
Table. 32 Distribution of Households by Caste (Head of the Household / Main Earner) Self Employed Regular Employed Casual Labour Others Total Caste
Number Percent Number Percent Number Percent Number Percent Number Percent Forward 4 9.09 27 37.50 25 14.97 2 11.76 58 19.33 OBC 38 86.36 45 62.50 132 79.04 14 82.35 229 76.33 SC/ST 2 4.54 - - 10 5.99 1 5.88 13 4.33 Total 44 100.00 72 100.00 167 100.00 17 100.00 300 100.00
39
41
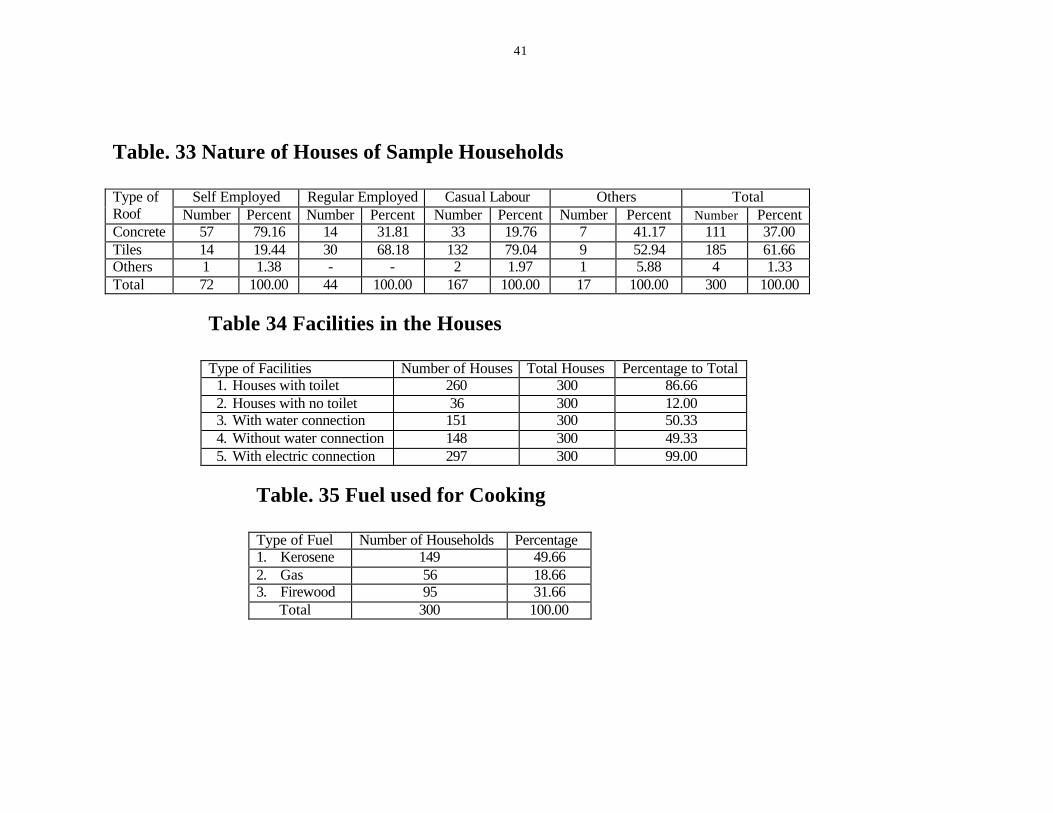
In order to know the housing and other facilities available, we have
collected information about it. There are two types of houses viz. houses with tiled roof
and concrete roof. Of the total sample houses, 37 percent have concrete roofs and 62
percent have tiled roofs (Table.33). It is found that the regularly employed have better
houses compared to self employed and casually employed. Among the three categories, the
houses belonging to the casual employed are of lower quality compared to others.
An enquiry about the facilities available in the houses reveals that 87
percent of the houses have toilet facilities (Table.34). On the other hand, 12 percent of the
houses have no toilet facility. Half of the households have water connections. The other
half have no water connection and are depending on public taps or wells for water. A
notable aspect is that almost all the houses have electric connections. For cooking
purposes, the households are using Kerosene, firewood and gas. It is found that half of the
households are using Kerosene for cooking purposes. Nearly one third uses firewood for
cooking (Table.35). The houses which are using gas for cooking will account for nearly
one fifth of the total houses. The survey results suggest that the regular employed
households have better facilities in the house compared to self employed and casual
employed. Among the three categories, the casual employed households
have the lowest facilities in their houses.
40
42
Table. 33 Nature of Houses of Sample Households
Self Employed Regular Employed Casual Labour Others Total Type of Roof Number Percent Number Percent Number Percent Number Percent Number Percent Concrete 57 79.16 14 31.81 33 19.76 7 41.17 111 37.00 Tiles 14 19.44 30 68.18 132 79.04 9 52.94 185 61.66 Others 1 1.38 - - 2 1.97 1 5.88 4 1.33 Total 72 100.00 44 100.00 167 100.00 17 100.00 300 100.00
Table 34 Facilities in the Houses
Type of Facilities Number of Houses Total Houses Percentage to Total 1. Houses with toilet 260 300 86.66 2. Houses with no toilet 36 300 12.00 3. With water connection 151 300 50.33 4. Without water connection 148 300 49.33 5. With electric connection 297 300 99.00
Table. 35 Fuel used for Cooking
Type of Fuel Number of Households Percentage 1. Kerosene 149 49.66 2. Gas 56 18.66 3. Firewood 95 31.66 Total 300 100.00
41
43
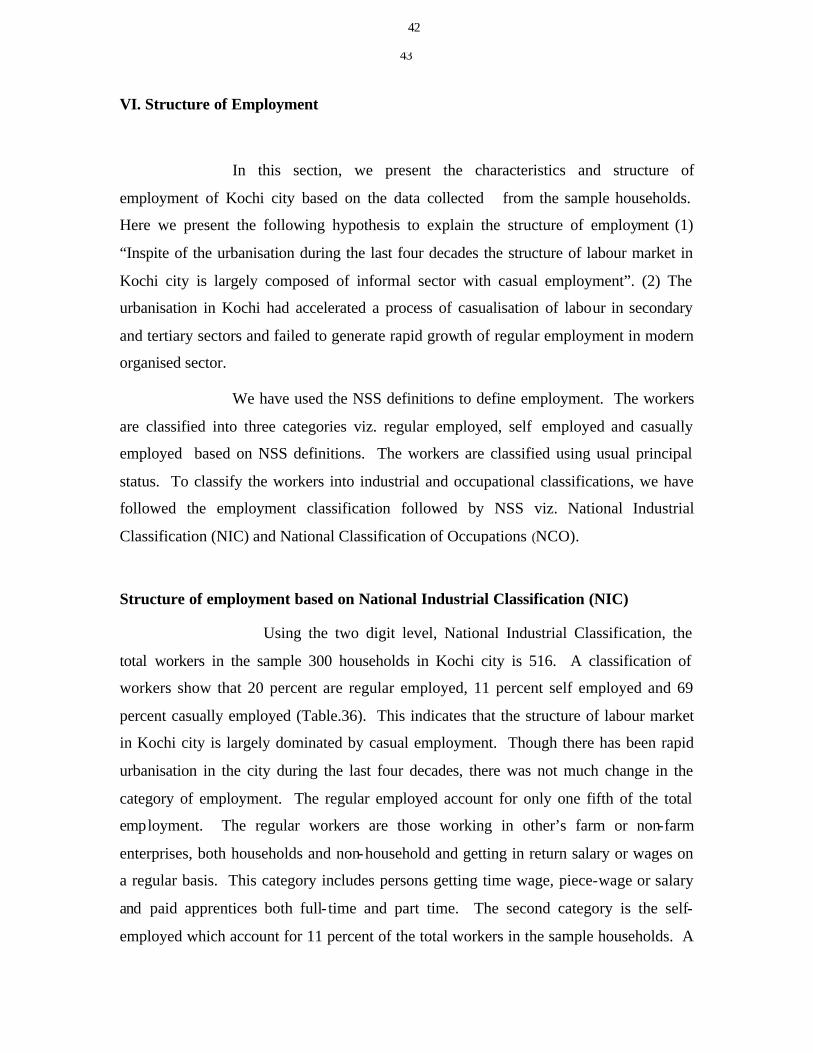
VI. Structure of Employment
In this section, we present the characteristics and structure of
employment of Kochi city based on the data collected from the sample households.
Here we present the following hypothesis to explain the structure of employment (1)
“Inspite of the urbanisation during the last four decades the structure of labour market in
Kochi city is largely composed of informal sector with casual employment”. (2) The
urbanisation in Kochi had accelerated a process of casualisation of labour in secondary
and tertiary sectors and failed to generate rapid growth of regular employment in modern
organised sector.
We have used the NSS definitions to define employment. The workers
are classified into three categories viz. regular employed, self employed and casually
employed based on NSS definitions. The workers are classified using usual principal
status. To classify the workers into industrial and occupational classifications, we have
followed the employment classification followed by NSS viz. National Industrial
Classification (NIC) and National Classification of Occupations (NCO).
Structure of employment based on National Industrial Classification (NIC)
Using the two digit level, National Industrial Classification, the
total workers in the sample 300 households in Kochi city is 516. A classification of
workers show that 20 percent are regular employed, 11 percent self employed and 69
percent casually employed (Table.36). This indicates that the structure of labour market
in Kochi city is largely dominated by casual employment. Though there has been rapid
urbanisation in the city during the last four decades, there was not much change in the
category of employment. The regular employed account for only one fifth of the total
employment. The regular workers are those working in other’s farm or non-farm
enterprises, both households and non-household and getting in return salary or wages on
a regular basis. This category includes persons getting time wage, piece-wage or salary
and paid apprentices both full- time and part time. The second category is the self-
employed which account for 11 percent of the total workers in the sample households. A
42

44
notable aspect of self employed is that except one female all are males. The self
employed is defined as persons who operate their own farm or non-farm enterprises or
are engaged independently in a profession or trade on own account or a few partners or
self employed in household enterprises. The essential feature of self employment is that
the remuneration is determined wholly or mainly by sales or profits of the goods or
services which are being produced. The self employed persons are categorized into three
groups, viz. own account workers, employers, helpers in household enterprises. The third
category or workers are casual employed accounting for 69 percent of the total workers in
the sample households. This indicates that the urbanisation in Kochi city had accelerated
a process of casualisation of labour in secondary and tertiary activities. A casual labourer
is defined as a person casually engaged in other’s farm or non-farm enterprises (both
household and non-household) and getting in return, wage according to the terms of daily
or periodic work contract.
Table.36 Total workers in the Sample Households Number of workers
Percent
Category of workers
Male Female Total Male Female Total 1. Regular
employed 65 36 101 14.38 56.25 19.57
2. Self Employed
57 1 58 12.61 1.56 11.24
3. Casual 330 27 357 73.00 42.18 69.18 Total 452 64 516 100.00 100.00 100.00
A classification of the workers into male and female in Kochi city show
that the share of female workers was very low ie,12.4 percent (Table.37). Except in the
case of regular employment, the share of female workers in self employed and casual
categories is very low. In the case of self employed and casual employment, more than
90 percent of the workers are males.
44
45
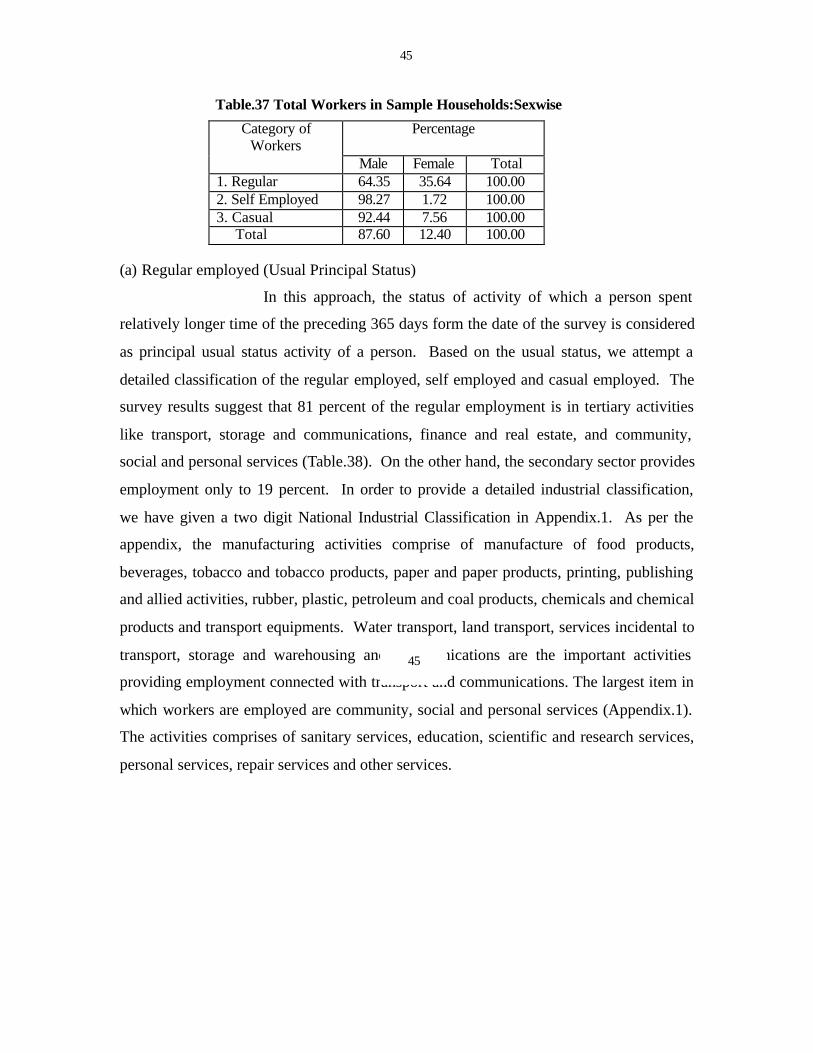
Table.37 Total Workers in Sample Households:Sexwise
Percentage
Category of Workers
Male Female Total 1. Regular 64.35 35.64 100.00 2. Self Employed 98.27 1.72 100.00 3. Casual 92.44 7.56 100.00 Total 87.60 12.40 100.00
(a) Regular employed (Usual Principal Status)
In this approach, the status of activity of which a person spent
relatively longer time of the preceding 365 days form the date of the survey is considered
as principal usual status activity of a person. Based on the usual status, we attempt a
detailed classification of the regular employed, self employed and casual employed. The
survey results suggest that 81 percent of the regular employment is in tertiary activities
like transport, storage and communications, finance and real estate, and community,
social and personal services (Table.38). On the other hand, the secondary sector provides
employment only to 19 percent. In order to provide a detailed industrial classification,
we have given a two digit National Industrial Classification in Appendix.1. As per the
appendix, the manufacturing activities comprise of manufacture of food products,
beverages, tobacco and tobacco products, paper and paper products, printing, publishing
and allied activities, rubber, plastic, petroleum and coal products, chemicals and chemical
products and transport equipments. Water transport, land transport, services incidental to
transport, storage and warehousing and communications are the important activities
providing employment connected with transport and communications. The largest item in
which workers are employed are community, social and personal services (Appendix.1).
The activities comprises of sanitary services, education, scientific and research services,
personal services, repair services and other services.
45

46
Table.38 Industrial Classification of Regular Employed (UPS) Number
Percentage
National Industrial Classification
Male Female Total Male Female Total 1. Manufacturing 16 1 17 24.62 2.78 16.83 2. Construction 2 - 2 3.08 - 1.98 3. Wholesale and
Retail Trade 5 - 5 7.69 - 4.95
4. Transport, Storage and Communications
11 1 12 16.92 2.78 11.88
5. Finance and Real Estate
22 9 31 33.85 25.00 30.69
6. Community, Social and Personal Services
9 25 34 13.85 69.44 33.66
Total 65 36 101 100.00 100.00 100.00 UPS: Usual Principal Status
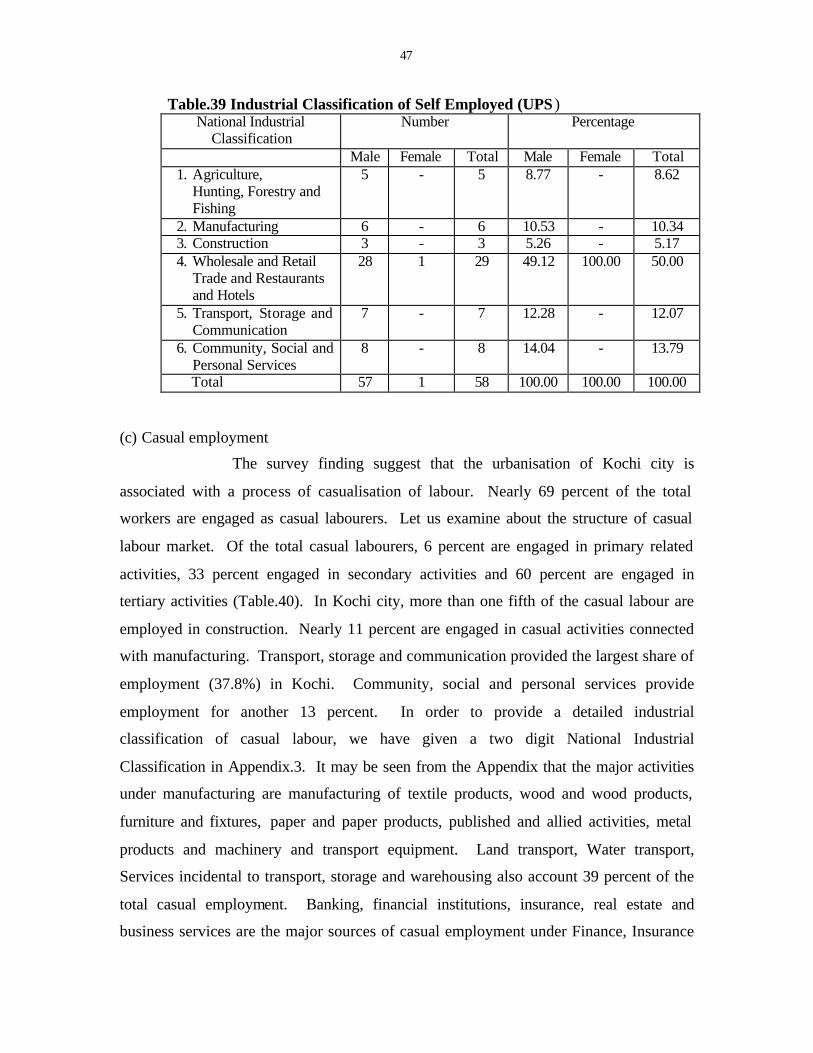
(b) Self employed
The survey findings suggest that nearly half of the self employed are
engaged in activities related to wholesale, retail trade, restaurants and hotels (Table.39).
The other tertiary activities in which the self employed are engaged are transport, storage
and communications, community, social and personal services. Only one tenth of the self
employed are engaged in manufacturing activity. The self employed persons engaged in
primary related activities account 9 percent. In order to provide a detailed industrial
classification of self employed activities, we have given a two digit National Industrial
Classification in Appendix.2. It may be seen from the appendix that nearly half of the
self employed are engaged in wholesale trade in food, textiles, live animals, beverages,
retail trade in food, food articles, beverages, tobacco and intoxicants, fuel items of
household utilities and durables. It is evident that nearly 47 percent of the self
employment is activities connected with retail trade. In manufacturing, the major
activities are manufacture of paper and paper products, printing and publishing, metal
products and parts and other manufacturing items. The major industrial activities in
primary sector are livestock production and fishing.
46
47
Table.39 Industrial Classification of Self Employed (UPS ) National Industrial
Classification Number
Percentage
Male Female Total Male Female Total
1. Agriculture, Hunting, Forestry and Fishing
5 - 5 8.77 - 8.62
2. Manufacturing 6 - 6 10.53 - 10.34 3. Construction 3 - 3 5.26 - 5.17 4. Wholesale and Retail
Trade and Restaurants and Hotels
28 1 29 49.12 100.00 50.00
5. Transport, Storage and Communication
7 - 7 12.28 - 12.07
6. Community, Social and Personal Services
8 - 8 14.04 - 13.79
Total 57 1 58 100.00 100.00 100.00
(c) Casual employment
The survey finding suggest that the urbanisation of Kochi city is
associated with a process of casualisation of labour. Nearly 69 percent of the total
workers are engaged as casual labourers. Let us examine about the structure of casual
labour market. Of the total casual labourers, 6 percent are engaged in primary related
activities, 33 percent engaged in secondary activities and 60 percent are engaged in
tertiary activities (Table.40). In Kochi city, more than one fifth of the casual labour are
employed in construction. Nearly 11 percent are engaged in casual activities connected
with manufacturing. Transport, storage and communication provided the largest share of
employment (37.8%) in Kochi. Community, social and personal services provide
employment for another 13 percent. In order to provide a detailed industrial
classification of casual labour, we have given a two digit National Industrial
Classification in Appendix.3. It may be seen from the Appendix that the major activities
under manufacturing are manufacturing of textile products, wood and wood products,
furniture and fixtures, paper and paper products, published and allied activities, metal
products and machinery and transport equipment. Land transport, Water transport,
Services incidental to transport, storage and warehousing also account 39 percent of the
total casual employment. Banking, financial institutions, insurance, real estate and
business services are the major sources of casual employment under Finance, Insurance
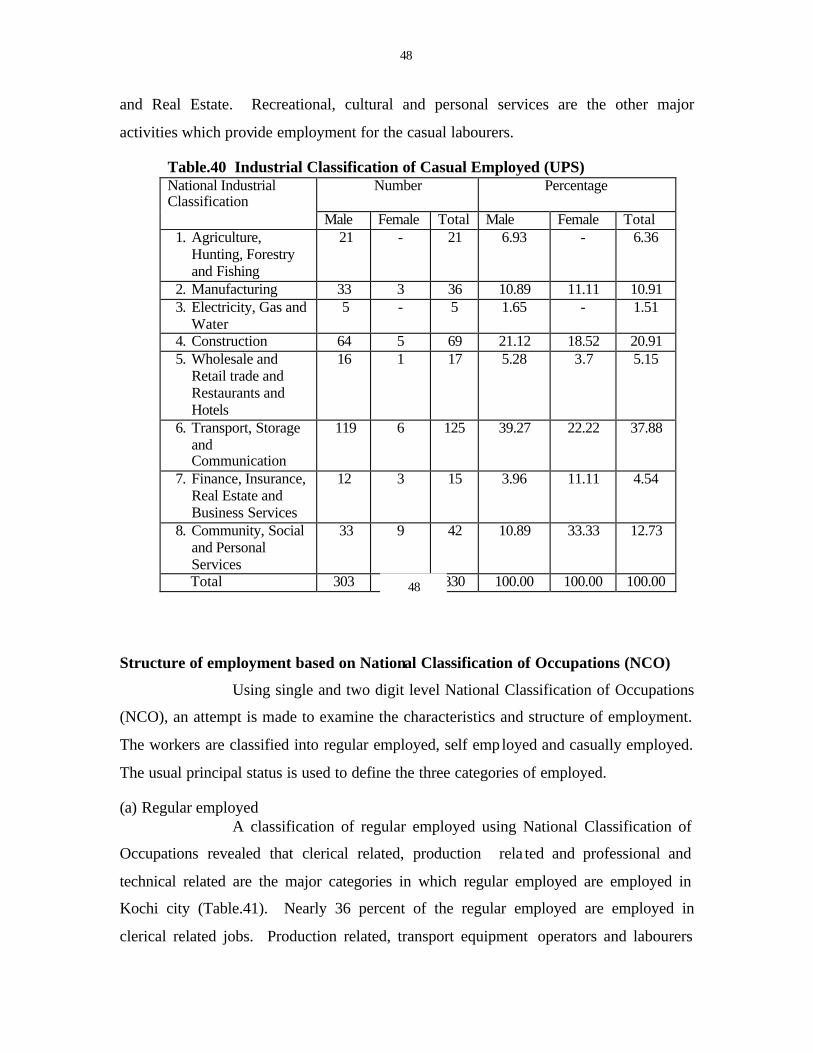
48
and Real Estate. Recreational, cultural and personal services are the other major
activities which provide employment for the casual labourers.
Table.40 Industrial Classification of Casual Employed (UPS) Number
Percentage
National Industrial Classification
Male Female Total Male Female Total 1. Agriculture,
Hunting, Forestry and Fishing
21 - 21 6.93 - 6.36
2. Manufacturing 33 3 36 10.89 11.11 10.91 3. Electricity, Gas and
Water 5 - 5 1.65 - 1.51
4. Construction 64 5 69 21.12 18.52 20.91 5. Wholesale and
Retail trade and Restaurants and Hotels
16 1 17 5.28 3.7 5.15
6. Transport, Storage and Communication
119 6 125 39.27 22.22 37.88
7. Finance, Insurance, Real Estate and Business Services
12 3 15 3.96 11.11 4.54
8. Community, Social and Personal Services
33 9 42 10.89 33.33 12.73
Total 303 27 330 100.00 100.00 100.00
Structure of employment based on National Classification of Occupations (NCO)
Using single and two digit level National Classification of Occupations
(NCO), an attempt is made to examine the characteristics and structure of employment.
The workers are classified into regular employed, self employed and casually employed.
The usual principal status is used to define the three categories of employed.
(a) Regular employed A classification of regular employed using National Classification of
Occupations revealed that clerical related, production rela ted and professional and
technical related are the major categories in which regular employed are employed in
Kochi city (Table.41). Nearly 36 percent of the regular employed are employed in
clerical related jobs. Production related, transport equipment operators and labourers
48
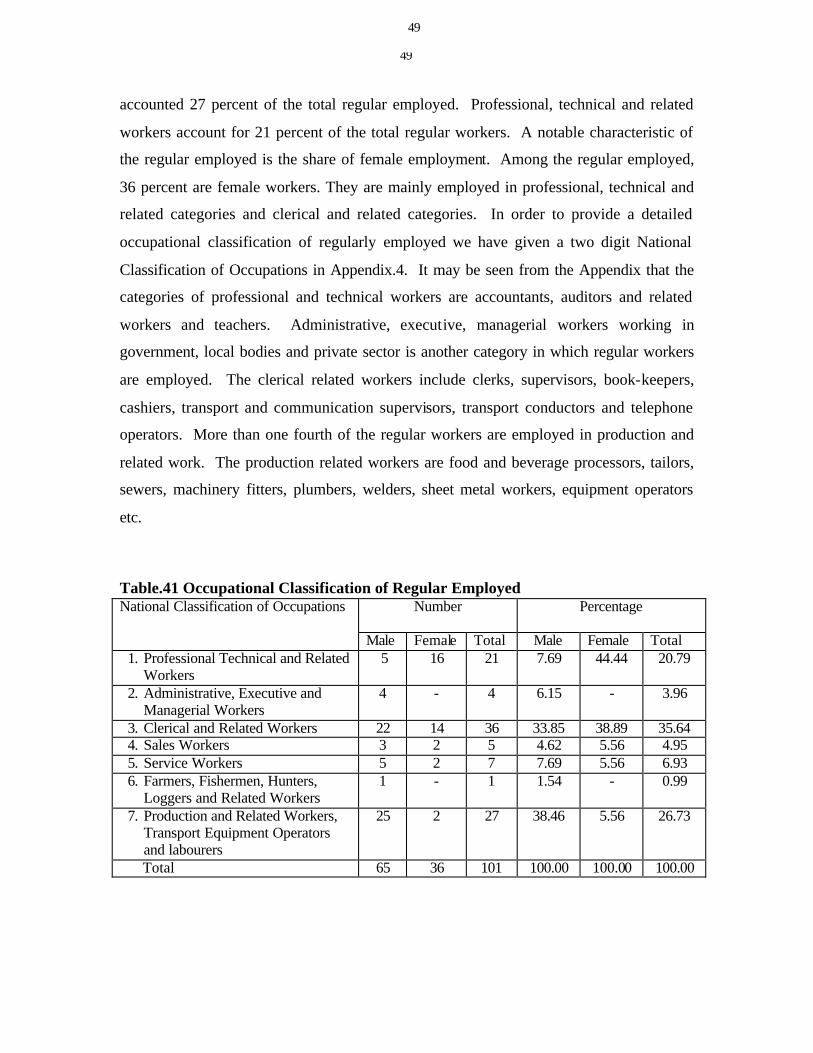
49
accounted 27 percent of the total regular employed. Professional, technical and related
workers account for 21 percent of the total regular workers. A notable characteristic of
the regular employed is the share of female employment. Among the regular employed,
36 percent are female workers. They are mainly employed in professional, technical and
related categories and clerical and related categories. In order to provide a detailed
occupational classification of regularly employed we have given a two digit National
Classification of Occupations in Appendix.4. It may be seen from the Appendix that the
categories of professional and technical workers are accountants, auditors and related
workers and teachers. Administrative, executive, managerial workers working in
government, local bodies and private sector is another category in which regular workers
are employed. The clerical related workers include clerks, supervisors, book-keepers,
cashiers, transport and communication supervisors, transport conductors and telephone
operators. More than one fourth of the regular workers are employed in production and
related work. The production related workers are food and beverage processors, tailors,
sewers, machinery fitters, plumbers, welders, sheet metal workers, equipment operators
etc.
Table.41 Occupational Classification of Regular Employed Number
Percentage
National Classification of Occupations
Male Female Total Male Female Total 1. Professional Technical and Related
Workers 5 16 21 7.69 44.44 20.79
2. Administrative, Executive and Managerial Workers
4 - 4 6.15 - 3.96
3. Clerical and Related Workers 22 14 36 33.85 38.89 35.64 4. Sales Workers 3 2 5 4.62 5.56 4.95 5. Service Workers 5 2 7 7.69 5.56 6.93 6. Farmers, Fishermen, Hunters,
Loggers and Related Workers 1 - 1 1.54 - 0.99
7. Production and Related Workers, Transport Equipment Operators and labourers
25 2 27 38.46 5.56 26.73
Total 65 36 101 100.00 100.00 100.00
49
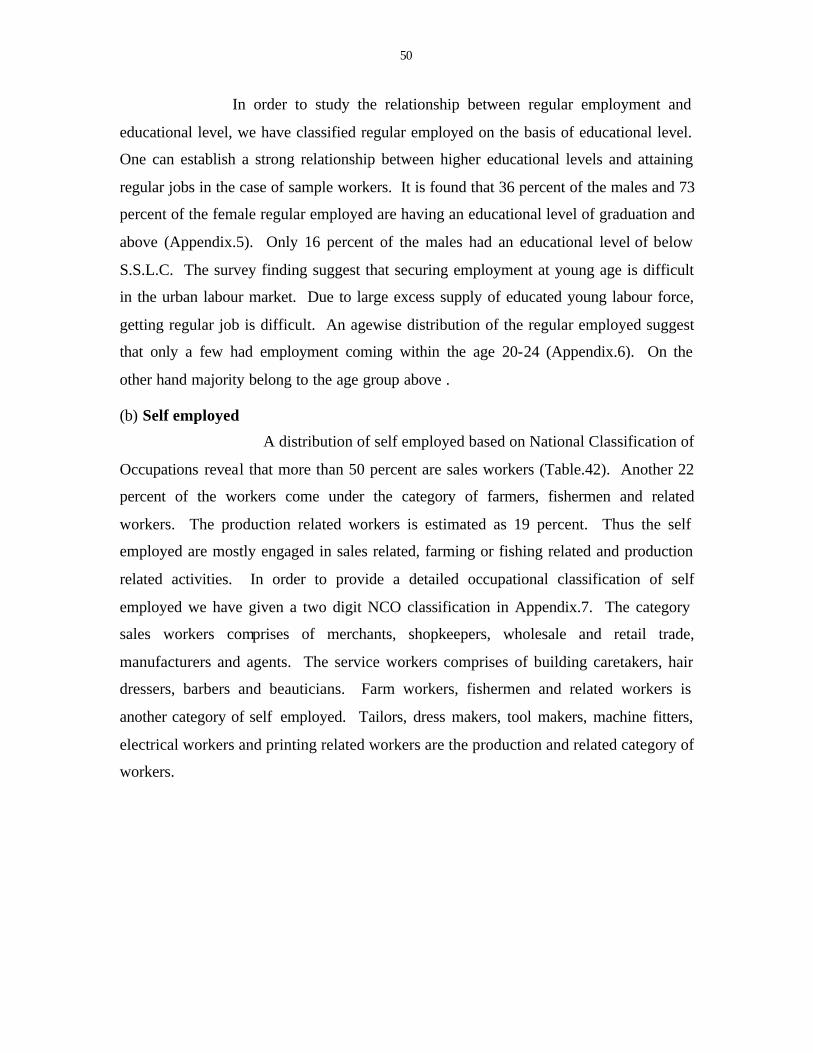
50
In order to study the relationship between regular employment and
educational level, we have classified regular employed on the basis of educational level.
One can establish a strong relationship between higher educational levels and attaining
regular jobs in the case of sample workers. It is found that 36 percent of the males and 73
percent of the female regular employed are having an educational level of graduation and
above (Appendix.5). Only 16 percent of the males had an educational level of below
S.S.L.C. The survey finding suggest that securing employment at young age is difficult
in the urban labour market. Due to large excess supply of educated young labour force,
getting regular job is difficult. An agewise distribution of the regular employed suggest
that only a few had employment coming within the age 20-24 (Appendix.6). On the
other hand majority belong to the age group above .
(b) Self employed
A distribution of self employed based on National Classification of
Occupations reveal that more than 50 percent are sales workers (Table.42). Another 22
percent of the workers come under the category of farmers, fishermen and related
workers. The production related workers is estimated as 19 percent. Thus the self
employed are mostly engaged in sales related, farming or fishing related and production
related activities. In order to provide a detailed occupational classification of self
employed we have given a two digit NCO classification in Appendix.7. The category
sales workers comprises of merchants, shopkeepers, wholesale and retail trade,
manufacturers and agents. The service workers comprises of building caretakers, hair
dressers, barbers and beauticians. Farm workers, fishermen and related workers is
another category of self employed. Tailors, dress makers, tool makers, machine fitters,
electrical workers and printing related workers are the production and related category of
workers.
51
Table.42 Occupational Classification of Self Employed (UPS) Number
Percentage
National Classification of Occupations
Male Female Total Male Female Total 1. Sales Workers 30 - 30 52.63 - 51.72 2. Service Workers 3 1 4 5.26 100.00 6.90 3. Farmers, Fishermen and Related
Workers 13 - 13 22.81 - 22.41
4. Production and related Workers, Transport Equipment Operators and Labourers
11 - 11 19.3 - 18.97
Total 57 1 58 100.00 100.00 100.00
(c) Casual Employment
In the urban labour market of Kochi, casual employment account
for 69 percent of the total employment. The data on casual employment suggest tha t a
process of casualisation is taking place in the urban labour market. The survey finding
suggest that of the total casual workers, 64 percent are engaged as production related,
transport equipment operators and labourers (Table.43). The second category which give
large employment in Kochi city are farmers, fishermen, loggers and related workers.
Another 9 percent of the casual workers are in the category of sales workers. On the
other hand a very few of the casual workers are engaged in professional, technical,
administrative, executive and related jobs. In order to provide a detailed occupational
classification of casual workers we have given a two digit National Classification of
Occupations in Appendix.8. It may be seen from the Appendix that major share of the
casual workers are engaged as production related, transport equipment operators and
labourers. The three major items of casual workers are construction workers, material
handling workers, head load workers and transport equipment operators. The other major
category of production related workers are metal processors, wood workers, tailors, stone
cutters, machinery fitters, electrical workers, plumbers, welders, printing workers,
painters etc. The sales workers engaged in casual employment comprises of workers in
wholesale and retail trade, salesmen and shop assistants, real estate, security and business
services and money lenders and pawn brokers. In order to examine the relationship
between casual employment and educational level, we have classified the workers on the
basis of educational level. We can establish a strong relationship between lower

52
educational levels and casual employment. It is found that 46 percent of the males and 46
percent of the females have an educational level upto middle school (Appendix.9). Those
with secondary level of education are employed as sales workers, service workers and
production related workers. It is interesting to note that 27 percent of the casual workers
have an educational level of graduation and above and engaged as clerical related
workers, service workers and production related workers.
Table.43 Occupational Classification of Casual Employed (UPS)
Number
Percentage
National Classification of Occupations
Male Female Total Male Female Total 1. Professional Technical and
Related Workers 7 1 8 2.12 3.70 2.24
2. Administrative, Executive and Managerial Workers
2 - 2 0.61 - 0.56
3. Clerical and Related Workers 17 5 22 5.15 18.52 6.16 4. Sales Workers 27 4 31 8.18 14.81 8.68 5. Service Workers 9 3 12 2.73 11.11 3.36 6. Farmers, Fishermen, Hunters,
loggers and related Workers 52 3 55 15.76 11.11 15.41
7. Production and Related Workers, Transport Equipment Operators and labourers
216 11 227 65.45 40.74 63.59
Total 330 27 357 100.00 100.00 100.00
53
VII. Unemployment
In this section, we examine the characteristics and magnitude of
unemployment based on the sample survey conducted in Kochi city. An attempt is also
made to explain the causes for the high incidence of unemployment. To explain the
causes of unemployment we are presenting the following hypotheses.
(1) “The high incidence of unemployment in Kochi city is due to low rate of
growth of employment, the nature of labour market characterised by informal and
casual employment and low participation of educated unemployed labour force in
informal and casual activities”.
(2) “The large supply of educated young labour force leading to an excess
supply of labour force on the one side, the small size and slow growth of organised
sector leading to a low demand for regular employment on the other, result in high
incidence of educated unemployment among youth; and
(3) “Due to severe unemployment, young and educated labour force are forced
to migrate to other parts of India and abroad for employment”.
The NSS definitions used to measure unemployment are usual principal
status, current week status and current day status. (1) In the usual status approach, the
status of activity on which a person spent relatively longer time of the preceding 365 days
from the date of survey is cons idered as the principal usual status activity of a person.
According to this status, a person is classified as unemployed if he was not working but
was either seeking or available for work for a relatively longer time during the reference
period in the usual status. (2) The current weekly status approach classifies a person as
unemployed if he has not worked for atleast one hour on any one day of the week but had
been seeking work or had been available for work at any time during the week. (3) The
current day status rate is the ratio of unemployed days per week (seeking or available for
work) to the total labour supply per week (working+seeking+available days). The unit of
classification was thus ‘half day’ in the cds. In assigning the activity status on a day, a
person was considered working for the entire day if he had worked 4 hours or more
during the day. If he had worked one hour or more but less than 4 hours, he was
considered working (employed) for half day and seeking/available for work
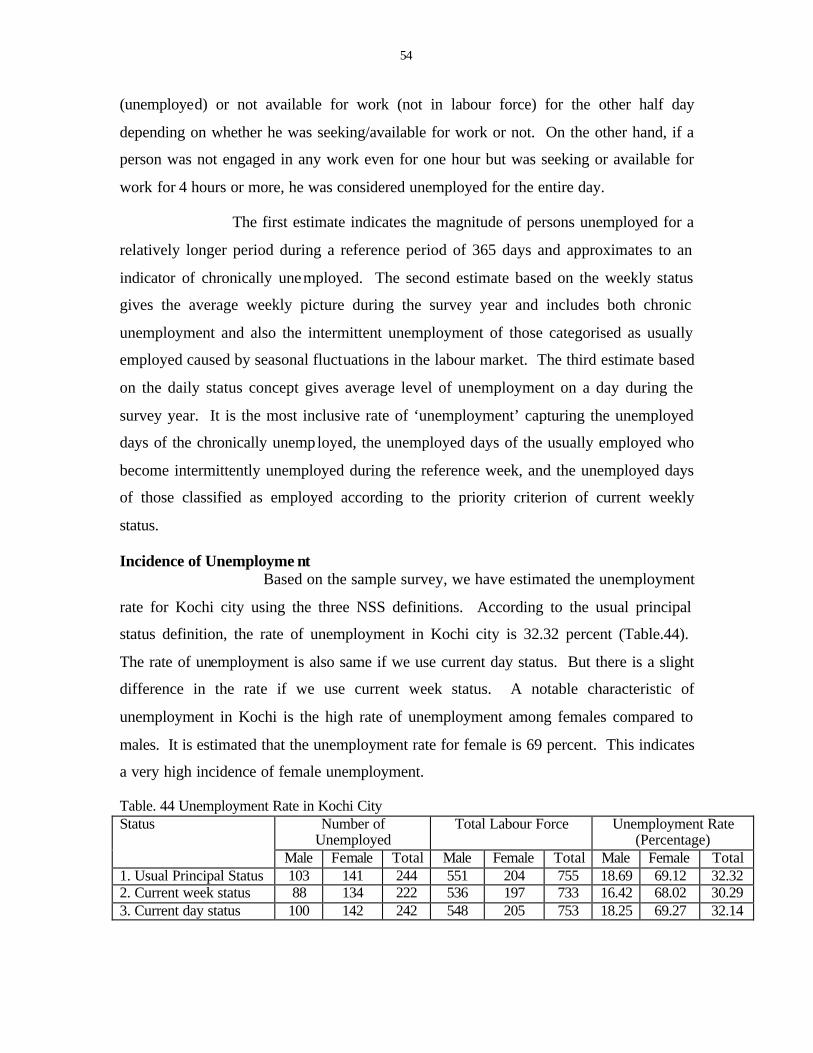
54
(unemployed) or not available for work (not in labour force) for the other half day
depending on whether he was seeking/available for work or not. On the other hand, if a
person was not engaged in any work even for one hour but was seeking or available for
work for 4 hours or more, he was considered unemployed for the entire day.
The first estimate indicates the magnitude of persons unemployed for a
relatively longer period during a reference period of 365 days and approximates to an
indicator of chronically unemployed. The second estimate based on the weekly status
gives the average weekly picture during the survey year and includes both chronic
unemployment and also the intermittent unemployment of those categorised as usually
employed caused by seasonal fluctuations in the labour market. The third estimate based
on the daily status concept gives average level of unemployment on a day during the
survey year. It is the most inclusive rate of ‘unemployment’ capturing the unemployed
days of the chronically unemployed, the unemployed days of the usually employed who
become intermittently unemployed during the reference week, and the unemployed days
of those classified as employed according to the priority criterion of current weekly
status.
Incidence of Unemployme nt Based on the sample survey, we have estimated the unemployment
rate for Kochi city using the three NSS definitions. According to the usual principal
status definition, the rate of unemployment in Kochi city is 32.32 percent (Table.44).
The rate of unemployment is also same if we use current day status. But there is a slight
difference in the rate if we use current week status. A notable characteristic of
unemployment in Kochi is the high rate of unemployment among females compared to
males. It is estimated that the unemployment rate for female is 69 percent. This indicates
a very high incidence of female unemployment.
Table. 44 Unemployment Rate in Kochi City Number of
Unemployed Total Labour Force Unemployment Rate
(Percentage) Status
Male Female Total Male Female Total Male Female Total 1. Usual Principal Status 103 141 244 551 204 755 18.69 69.12 32.32 2. Current week status 88 134 222 536 197 733 16.42 68.02 30.29 3. Current day status 100 142 242 548 205 753 18.25 69.27 32.14
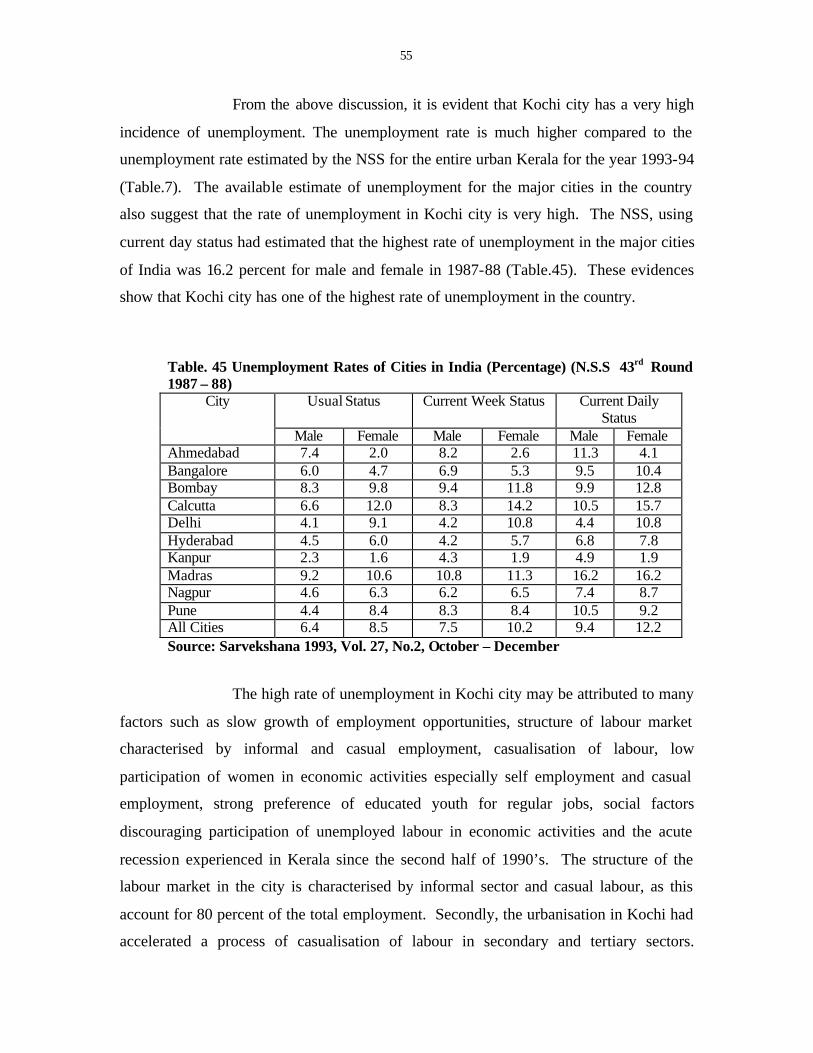
55
From the above discussion, it is evident that Kochi city has a very high
incidence of unemployment. The unemployment rate is much higher compared to the
unemployment rate estimated by the NSS for the entire urban Kerala for the year 1993-94
(Table.7). The available estimate of unemployment for the major cities in the country
also suggest that the rate of unemployment in Kochi city is very high. The NSS, using
current day status had estimated that the highest rate of unemployment in the major cities
of India was 16.2 percent for male and female in 1987-88 (Table.45). These evidences
show that Kochi city has one of the highest rate of unemployment in the country.
Table. 45 Unemployment Rates of Cities in India (Percentage) (N.S.S 43rd Round 1987 – 88)
Usual Status Current Week Status Current Daily Status
City
Male Female Male Female Male Female Ahmedabad 7.4 2.0 8.2 2.6 11.3 4.1 Bangalore 6.0 4.7 6.9 5.3 9.5 10.4 Bombay 8.3 9.8 9.4 11.8 9.9 12.8 Calcutta 6.6 12.0 8.3 14.2 10.5 15.7 Delhi 4.1 9.1 4.2 10.8 4.4 10.8 Hyderabad 4.5 6.0 4.2 5.7 6.8 7.8 Kanpur 2.3 1.6 4.3 1.9 4.9 1.9 Madras 9.2 10.6 10.8 11.3 16.2 16.2 Nagpur 4.6 6.3 6.2 6.5 7.4 8.7 Pune 4.4 8.4 8.3 8.4 10.5 9.2 All Cities 6.4 8.5 7.5 10.2 9.4 12.2 Source: Sarvekshana 1993, Vol. 27, No.2, October – December
The high rate of unemployment in Kochi city may be attributed to many
factors such as slow growth of employment opportunities, structure of labour market
characterised by informal and casual employment, casualisation of labour, low
participation of women in economic activities especially self employment and casual
employment, strong preference of educated youth for regular jobs, social factors
discouraging participation of unemployed labour in economic activities and the acute
recession experienced in Kerala since the second half of 1990’s. The structure of the
labour market in the city is characterised by informal sector and casual labour, as this
account for 80 percent of the total employment. Secondly, the urbanisation in Kochi had
accelerated a process of casualisation of labour in secondary and tertiary sectors.

56
Another factor is the low participation of female unemployed labour force in economic
activities especially self employment and casual employment in secondary and tertiary
sectors. The social value system and social practices also discourage employment of
women belonging to middle and lower middle class to engage in informal and casual
activities. The strong preference of educated unemployed youth, consisting the major
share of unemployed for regular jobs and their reluctance to take up informal and casual
jobs have also contributed to high incidence of unemployment. The economic recession
which started since the mid 1990’s assumed serious proportions during the subsequent
years and reached an unprecedented economic crisis by the end of 1990’s had also
contributed to high incidence of unemployment. The factors contributing to the recession
are large scale return of Keralite emigrants form the Gulf since 1996, the lack of future
prospects of emigration to the Gulf, the fall in the price of major crops like paddy,
coconut and rubber since the second half of 1990’s and the unprecedented fiscal crisis of
the state paralysing the state sponsored developmental activities.
Unemployment among youth
In order to study the category of unemployed, we have estimated
the rate of unemployment for different age groups, using the three definitions viz. usual
principal status, current week status and current day status. The three estimates using the
three definitions are given in Table.46, 47 and Table.48. It may be seen from the table
that the category of persons having highest incidence of unemployment belong to the age
group 20-24. The next age group having the second highest unemployment is 25 to 29.
Only few are unemployed in the age group 30 and above. This indicates that the urban
unemployment in Kochi is basically the problem of youth. An agewise distribution of the
unemployed show that of the total unemployed 73 percent belong to the age group 15-24
(Table.49). One of the major causes for the high incidence of unemployment among
youth is the lack of regular employment opportunities. As the major share of the youth
are educated, they prefer for regular employment in organised public or private sectors.
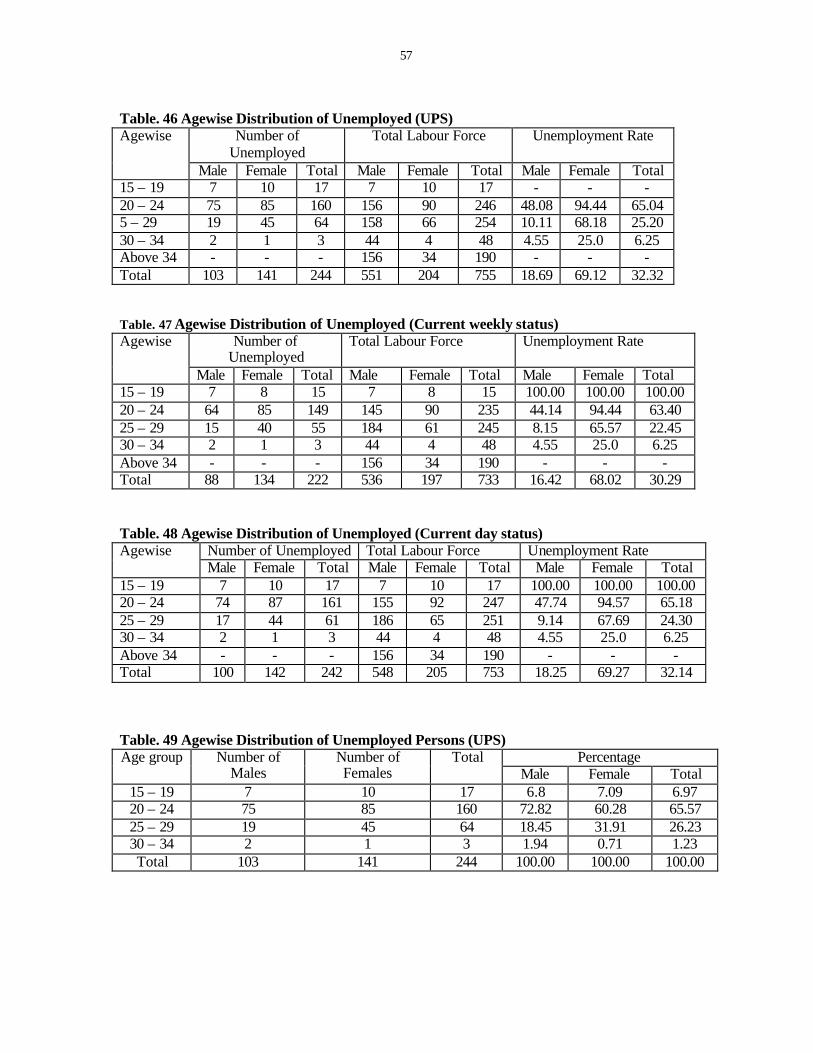
57
Table. 46 Agewise Distribution of Unemployed (UPS)
Number of Unemployed
Total Labour Force Unemployment Rate Agewise
Male Female Total Male Female Total Male Female Total 15 – 19 7 10 17 7 10 17 - - - 20 – 24 75 85 160 156 90 246 48.08 94.44 65.04 5 – 29 19 45 64 158 66 254 10.11 68.18 25.20 30 – 34 2 1 3 44 4 48 4.55 25.0 6.25 Above 34 - - - 156 34 190 - - - Total 103 141 244 551 204 755 18.69 69.12 32.32 Table. 47 Agewise Distribution of Unemployed (Current weekly status)
Number of Unemployed
Total Labour Force Unemployment Rate Agewise
Male Female Total Male Female Total Male Female Total 15 – 19 7 8 15 7 8 15 100.00 100.00 100.00 20 – 24 64 85 149 145 90 235 44.14 94.44 63.40 25 – 29 15 40 55 184 61 245 8.15 65.57 22.45 30 – 34 2 1 3 44 4 48 4.55 25.0 6.25 Above 34 - - - 156 34 190 - - - Total 88 134 222 536 197 733 16.42 68.02 30.29
Table. 48 Agewise Distribution of Unemployed (Current day status) Number of Unemployed Total Labour Force Unemployment Rate Agewise Male Female Total Male Female Total Male Female Total
15 – 19 7 10 17 7 10 17 100.00 100.00 100.00 20 – 24 74 87 161 155 92 247 47.74 94.57 65.18 25 – 29 17 44 61 186 65 251 9.14 67.69 24.30 30 – 34 2 1 3 44 4 48 4.55 25.0 6.25 Above 34 - - - 156 34 190 - - - Total 100 142 242 548 205 753 18.25 69.27 32.14 Table. 49 Agewise Distribution of Unemployed Persons (UPS)
Percentage Age group Number of Males
Number of Females
Total Male Female Total
15 – 19 7 10 17 6.8 7.09 6.97 20 – 24 75 85 160 72.82 60.28 65.57 25 – 29 19 45 64 18.45 31.91 26.23 30 – 34 2 1 3 1.94 0.71 1.23 Total 103 141 244 100.00 100.00 100.00

58
Unemployment Among Educated
The survey has estimated the rate of unemployment among different
categories of educated unemployed. It is found that the unemployment rate is the highest
among persons having an educational status of higher secondary. Using usual principal
status definition, it is estimated that the unemployment rate among persons having higher
secondary education is 44 percent (Table.50). The next category of persons having
highest incidence of unemployment is persons having Secondary School Leaving
Certificates (S.S.L.C). More than one fourth of the persons having an educational level
of graduation and above is reported as unemployed. The survey results also suggest that
the incidence of unemployment among educated females having secondary and higher
secondary education is very high compared to the males. The estimate on unemployment
rate using current week status and current day status is given in Table.51 and 52.
Table. 50 Education Level of Unemployed (UPS)
Number of Unemployed
Total Labour Force Unemployment Rate Educational Level
Male Female Total Male Female Total Male Female Total Upto Primary - - - 65 1 66 - - - Middle 36 50 86 201 56 257 17.91 89.29 33.46 Secondary 34 49 83 153 58 211 22.22 84.48 39.34 Higher Secondary 19 25 44 66 34 100 28.79 73.53 44.00 Graduate & Above 14 17 31 66 55 121 21.21 30.91 25.62 Total 103 141 244 551 204 755 18.69 69.12 32.32 Table. 51 Education Level of Unemployed (Current Weekly Status)
Number of Unemployed
Total Labour Force Unemployment Rate Educational Level
Male Female Total Male Female Total Male Female Total Upto Primary - - - 65 1 66 - - - Middle 31 48 79 196 54 250 15.82 88.88 31.60 Secondary 28 46 74 147 55 202 19.05 83.64 36.63 Higher Secondary 17 25 42 64 34 98 26.56 73.53 42.86 Graduate & Above 12 15 27 64 53 117 18.75 28.30 23.08 Total 88 134 222 536 197 733 16.42 68.02 30.29
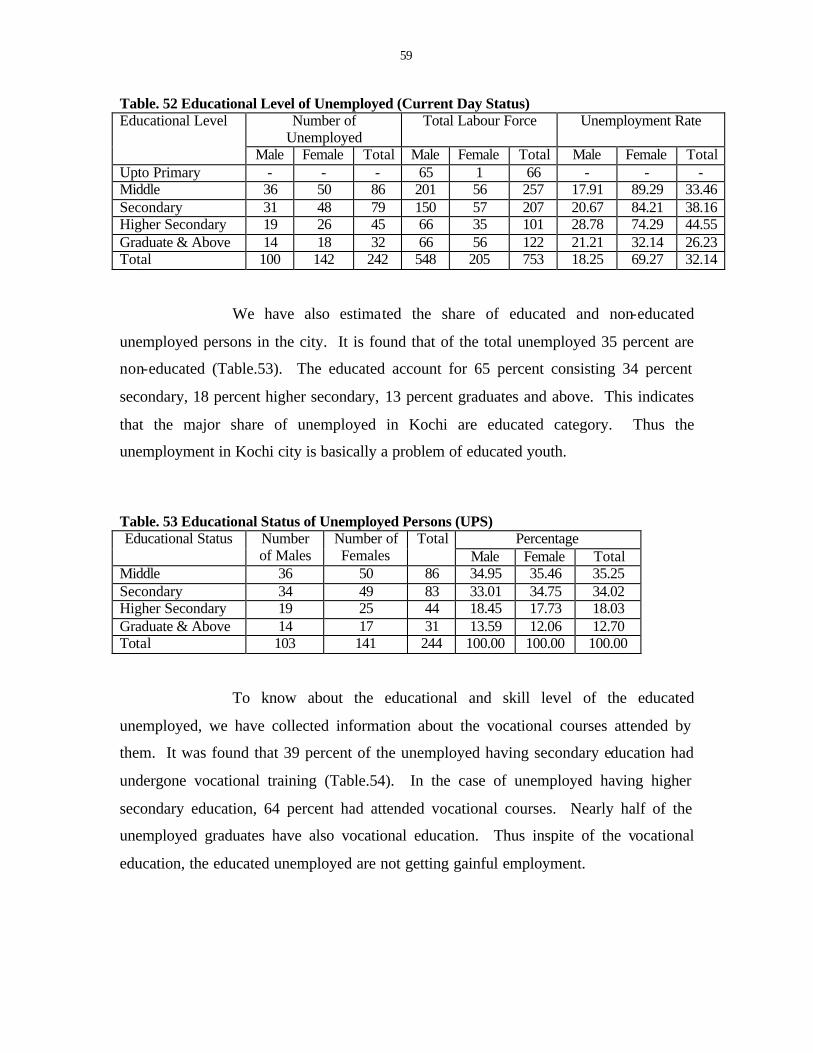
59
Table. 52 Educational Level of Unemployed (Current Day Status) Number of
Unemployed Total Labour Force Unemployment Rate Educational Level
Male Female Total Male Female Total Male Female Total Upto Primary - - - 65 1 66 - - - Middle 36 50 86 201 56 257 17.91 89.29 33.46 Secondary 31 48 79 150 57 207 20.67 84.21 38.16 Higher Secondary 19 26 45 66 35 101 28.78 74.29 44.55 Graduate & Above 14 18 32 66 56 122 21.21 32.14 26.23 Total 100 142 242 548 205 753 18.25 69.27 32.14
We have also estimated the share of educated and non-educated
unemployed persons in the city. It is found that of the total unemployed 35 percent are
non-educated (Table.53). The educated account for 65 percent consisting 34 percent
secondary, 18 percent higher secondary, 13 percent graduates and above. This indicates
that the major share of unemployed in Kochi are educated category. Thus the
unemployment in Kochi city is basically a problem of educated youth.
Table. 53 Educational Status of Unemployed Persons (UPS) Percentage Educational Status Number
of Males Number of Females
Total Male Female Total
Middle 36 50 86 34.95 35.46 35.25 Secondary 34 49 83 33.01 34.75 34.02 Higher Secondary 19 25 44 18.45 17.73 18.03 Graduate & Above 14 17 31 13.59 12.06 12.70 Total 103 141 244 100.00 100.00 100.00
To know about the educational and skill level of the educated
unemployed, we have collected information about the vocational courses attended by
them. It was found that 39 percent of the unemployed having secondary education had
undergone vocational training (Table.54). In the case of unemployed having higher
secondary education, 64 percent had attended vocational courses. Nearly half of the
unemployed graduates have also vocational education. Thus inspite of the vocational
education, the educated unemployed are not getting gainful employment.

60
Table. 54 Unemployed Persons having Vocational Education (UPS) Total Number of
Unemployed Number having
Vocational Education Percentage of persons having
Vocational Education Educational Category
Male Female Total Male Female Total Male Female Total Middle 36 50 86 4 10 14 11.11 20.00 16.28 Secondary 34 49 83 9 23 32 26.47 46.94 38.55 Higher Secondary 19 25 44 11 17 28 57.89 68.00 63.64 Graduate & Above 14 17 31 7 8 15 50.00 47.06 48.39 Total 103 141 244 31 58 89 30.10 41.13 36.48
The high incidence of unemployment among educated youth may be
attributed to the following factors. (1) There is large supply of educated young labour
force compared to the job vacancies ava ilable and resulting in excess supply of labour.
(2) The educated unemployed have a strong preference for regular jobs in public and
private sectors which are scarce. (3) Due to the slow growth and small size of the
organised sector, not much employment opportunities are generated in the urban labour
market. It may be noted that of the total employment, the regular employment account
for only 20 percent. (4) The educated unemployed are not interested to work in low paid,
low status casual jobs which account for about 70 percent of the total employment in the
labour market. (5) Due to the social value system and social practices, the educated
unemployed females are not interested to work as self employed and casual labour. Thus
the large supply of educated young labour force leading to excess supply of labour on the
one side, the small size and slow growth of organised sector leading to a low demand for
regular employment on the other result in high incidence of educated unemployment.
Unemployment Among Lower Income Households
The hypothesis explaining the relationship between low income
and high incidence of unemployment is widely accepted in the case of developing
economies. Based on the survey data, an attempt is made to test the hypothesis in the
context of urban labour market in Kochi. The survey findings suggest that a higher
proportion of the unemployed belong to the households with low monthly per capita
income. It is found that 23 percent of the unemployed belong to the households having a
monthly per capita income below Rs.400/- (Table.55). Another 15 percent of the
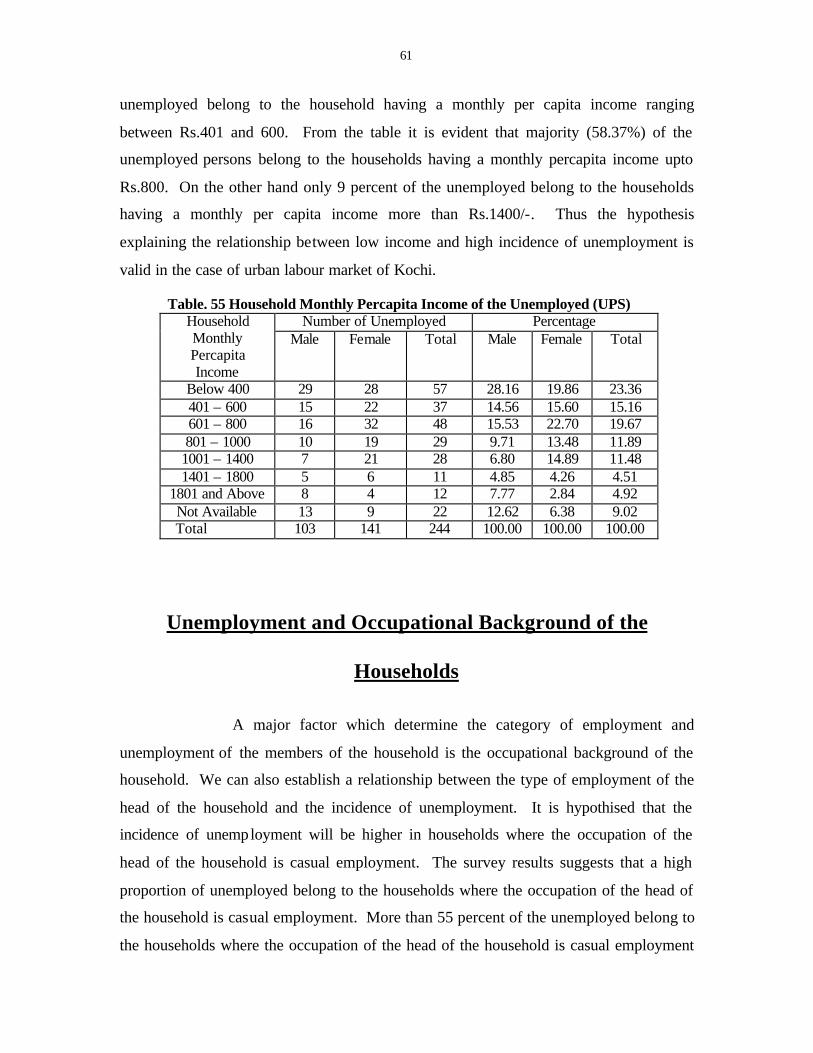
61
unemployed belong to the household having a monthly per capita income ranging
between Rs.401 and 600. From the table it is evident that majority (58.37%) of the
unemployed persons belong to the households having a monthly percapita income upto
Rs.800. On the other hand only 9 percent of the unemployed belong to the households
having a monthly per capita income more than Rs.1400/-. Thus the hypothesis
explaining the relationship between low income and high incidence of unemployment is
valid in the case of urban labour market of Kochi.
Table. 55 Household Monthly Percapita Income of the Unemployed (UPS) Number of Unemployed Percentage Household
Monthly Percapita Income
Male Female Total Male Female Total
Below 400 29 28 57 28.16 19.86 23.36 401 – 600 15 22 37 14.56 15.60 15.16 601 – 800 16 32 48 15.53 22.70 19.67 801 – 1000 10 19 29 9.71 13.48 11.89
1001 – 1400 7 21 28 6.80 14.89 11.48 1401 – 1800 5 6 11 4.85 4.26 4.51
1801 and Above 8 4 12 7.77 2.84 4.92 Not Available 13 9 22 12.62 6.38 9.02
Total 103 141 244 100.00 100.00 100.00
Unemployment and Occupational Background of the
Households
A major factor which determine the category of employment and
unemployment of the members of the household is the occupational background of the
household. We can also establish a relationship between the type of employment of the
head of the household and the incidence of unemployment. It is hypothised that the
incidence of unemployment will be higher in households where the occupation of the
head of the household is casual employment. The survey results suggests that a high
proportion of unemployed belong to the households where the occupation of the head of
the household is casual employment. More than 55 percent of the unemployed belong to
the households where the occupation of the head of the household is casual employment
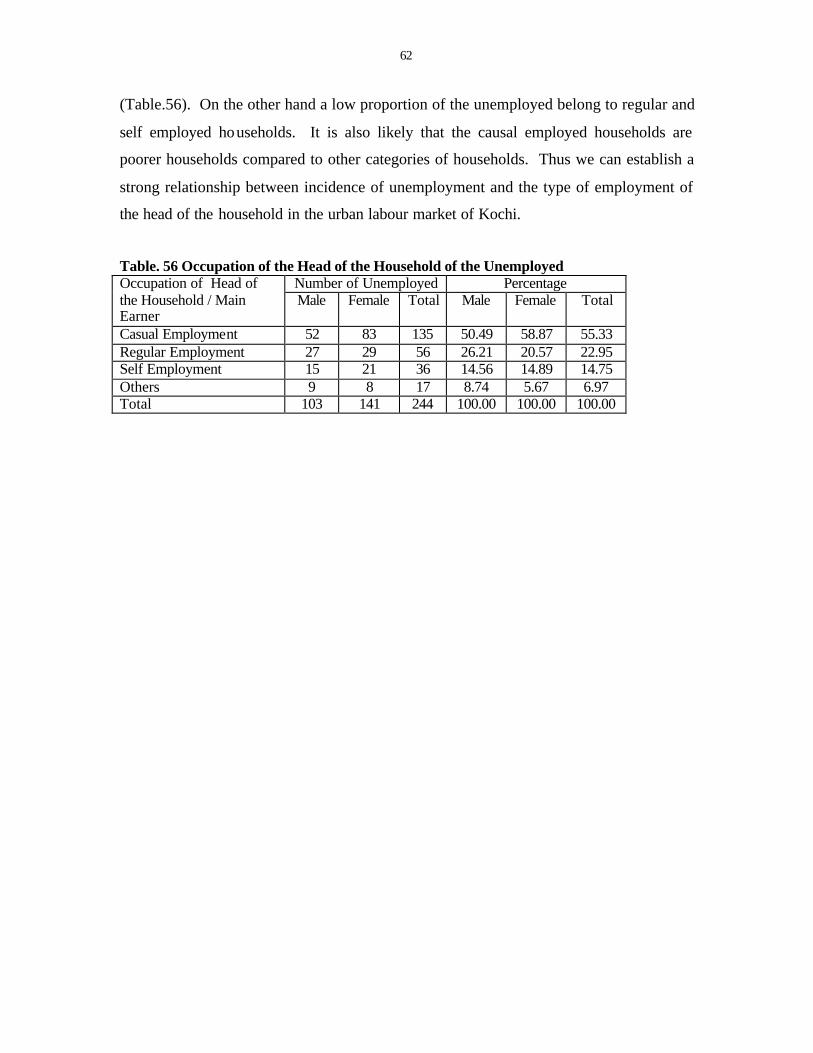
62
(Table.56). On the other hand a low proportion of the unemployed belong to regular and
self employed households. It is also likely that the causal employed households are
poorer households compared to other categories of households. Thus we can establish a
strong relationship between incidence of unemployment and the type of employment of
the head of the household in the urban labour market of Kochi.
Table. 56 Occupation of the Head of the Household of the Unemployed
Number of Unemployed Percentage Occupation of Head of the Household / Main Earner
Male Female Total Male Female Total
Casual Employment 52 83 135 50.49 58.87 55.33 Regular Employment 27 29 56 26.21 20.57 22.95 Self Employment 15 21 36 14.56 14.89 14.75 Others 9 8 17 8.74 5.67 6.97 Total 103 141 244 100.00 100.00 100.00
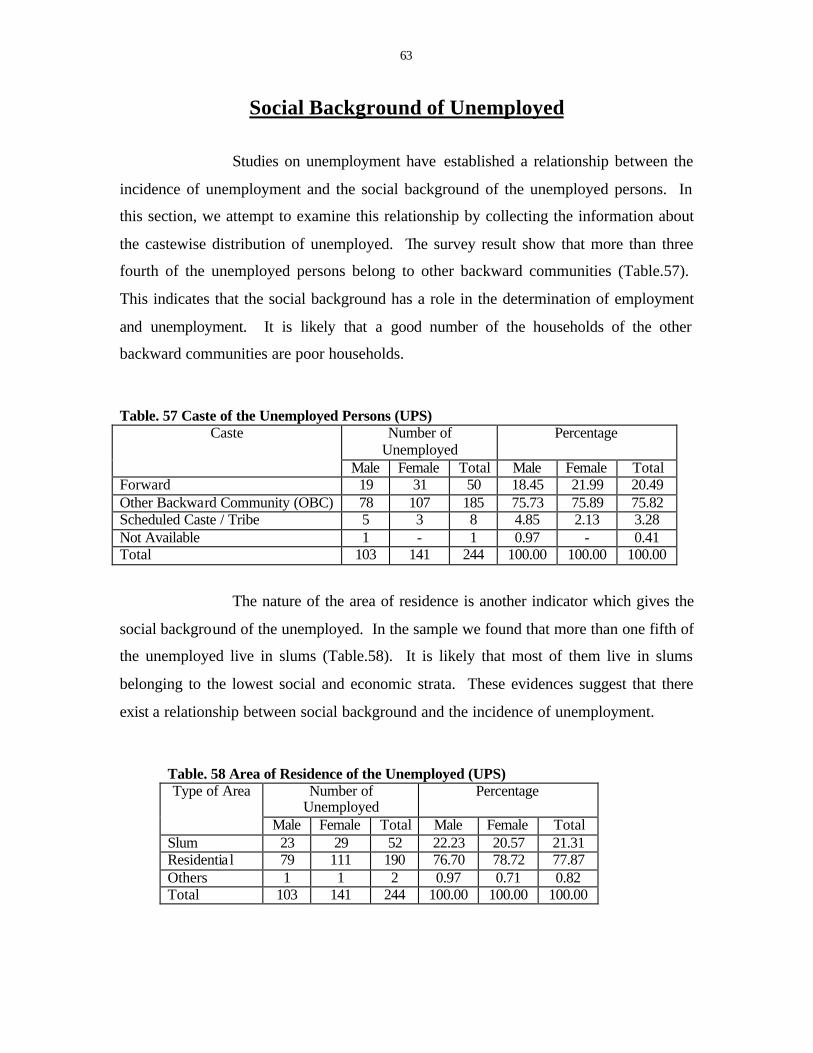
63
Social Background of Unemployed
Studies on unemployment have established a relationship between the
incidence of unemployment and the social background of the unemployed persons. In
this section, we attempt to examine this relationship by collecting the information about
the castewise distribution of unemployed. The survey result show that more than three
fourth of the unemployed persons belong to other backward communities (Table.57).
This indicates that the social background has a role in the determination of employment
and unemployment. It is likely that a good number of the households of the other
backward communities are poor households.
Table. 57 Caste of the Unemployed Persons (UPS) Number of
Unemployed Percentage Caste
Male Female Total Male Female Total Forward 19 31 50 18.45 21.99 20.49 Other Backward Community (OBC) 78 107 185 75.73 75.89 75.82 Scheduled Caste / Tribe 5 3 8 4.85 2.13 3.28 Not Available 1 - 1 0.97 - 0.41 Total 103 141 244 100.00 100.00 100.00
The nature of the area of residence is another indicator which gives the
social background of the unemployed. In the sample we found that more than one fifth of
the unemployed live in slums (Table.58). It is likely that most of them live in slums
belonging to the lowest social and economic strata. These evidences suggest that there
exist a relationship between social background and the incidence of unemployment.
Table. 58 Area of Residence of the Unemployed (UPS) Number of
Unemployed Percentage Type of Area
Male Female Total Male Female Total Slum 23 29 52 22.23 20.57 21.31 Residentia l 79 111 190 76.70 78.72 77.87 Others 1 1 2 0.97 0.71 0.82 Total 103 141 244 100.00 100.00 100.00
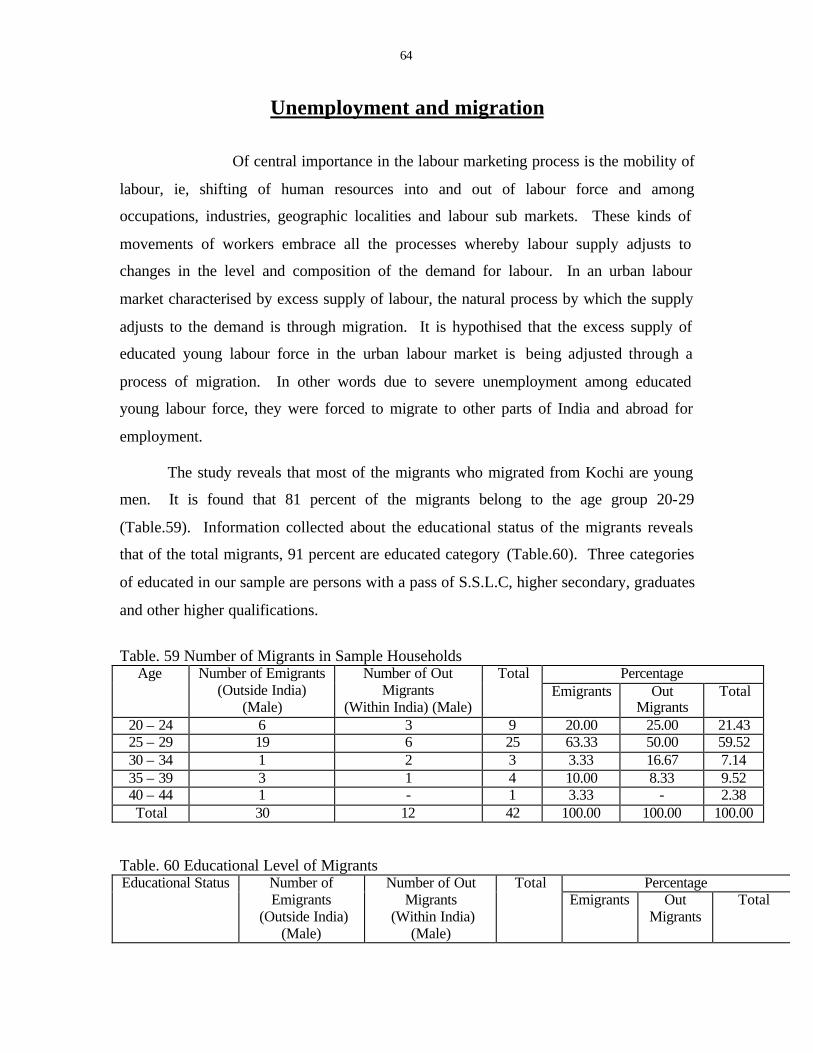
64
Unemployment and migration
Of central importance in the labour marketing process is the mobility of
labour, ie, shifting of human resources into and out of labour force and among
occupations, industries, geographic localities and labour sub markets. These kinds of
movements of workers embrace all the processes whereby labour supply adjusts to
changes in the level and composition of the demand for labour. In an urban labour
market characterised by excess supply of labour, the natural process by which the supply
adjusts to the demand is through migration. It is hypothised that the excess supply of
educated young labour force in the urban labour market is being adjusted through a
process of migration. In other words due to severe unemployment among educated
young labour force, they were forced to migrate to other parts of India and abroad for
employment.
The study reveals that most of the migrants who migrated from Kochi are young
men. It is found that 81 percent of the migrants belong to the age group 20-29
(Table.59). Information collected about the educational status of the migrants reveals
that of the total migrants, 91 percent are educated category (Table.60). Three categories
of educated in our sample are persons with a pass of S.S.L.C, higher secondary, graduates
and other higher qualifications.
Table. 59 Number of Migrants in Sample Households
Percentage Age Number of Emigrants (Outside India)
(Male)
Number of Out Migrants
(Within India) (Male)
Total Emigrants Out
Migrants Total
20 – 24 6 3 9 20.00 25.00 21.43 25 – 29 19 6 25 63.33 50.00 59.52 30 – 34 1 2 3 3.33 16.67 7.14 35 – 39 3 1 4 10.00 8.33 9.52 40 – 44 1 - 1 3.33 - 2.38 Total 30 12 42 100.00 100.00 100.00
Table. 60 Educational Level of Migrants
Percentage Educational Status Number of Emigrants
(Outside India) (Male)
Number of Out Migrants
(Within India) (Male)
Total Emigrants Out
Migrants Total
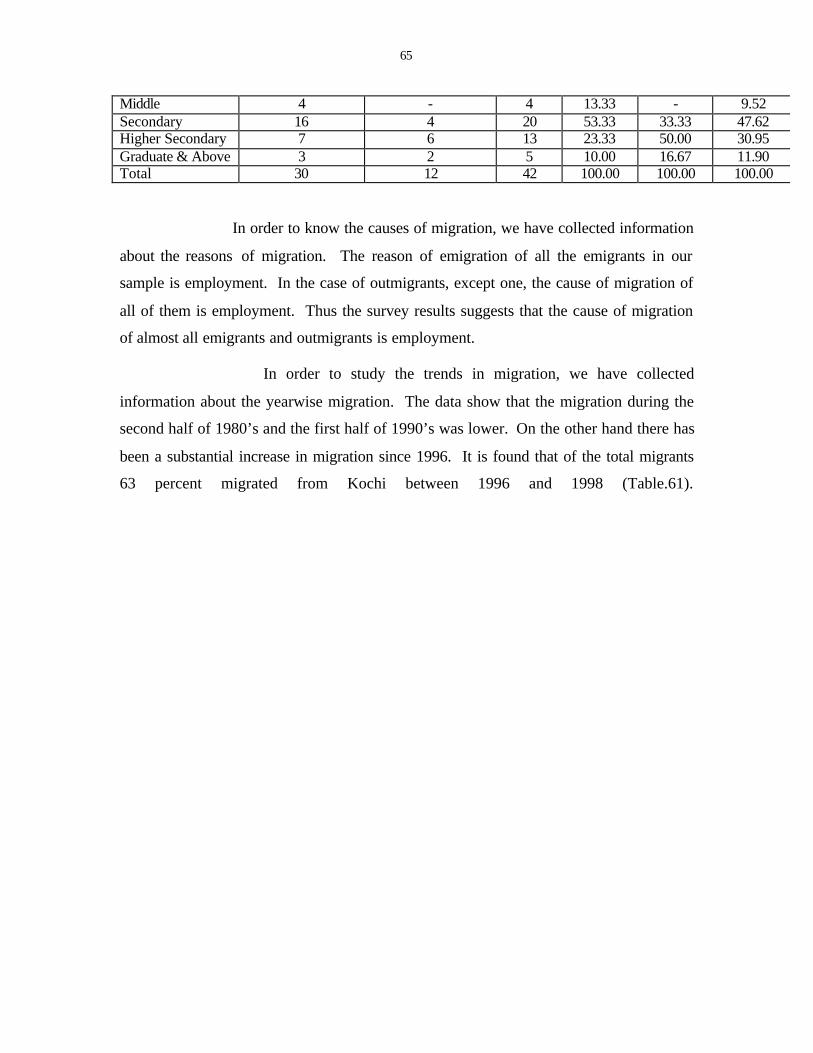
65
Middle 4 - 4 13.33 - 9.52 Secondary 16 4 20 53.33 33.33 47.62 Higher Secondary 7 6 13 23.33 50.00 30.95 Graduate & Above 3 2 5 10.00 16.67 11.90 Total 30 12 42 100.00 100.00 100.00
In order to know the causes of migration, we have collected information
about the reasons of migration. The reason of emigration of all the emigrants in our
sample is employment. In the case of outmigrants, except one, the cause of migration of
all of them is employment. Thus the survey results suggests that the cause of migration
of almost all emigrants and outmigrants is employment.
In order to study the trends in migration, we have collected
information about the yearwise migration. The data show that the migration during the
second half of 1980’s and the first half of 1990’s was lower. On the other hand there has
been a substantial increase in migration since 1996. It is found that of the total migrants
63 percent migrated from Kochi between 1996 and 1998 (Table.61).

66
Table. 61 Yearwise Migration of Migrants
Percentage Year wise Distribution
Number of Emigrants (Outside India)
(Male)
Number of Out Migrants
(Within India) (Male)
Total Emigrants Out
Migrants Total
1984 1 - 1 3.33 - 2.44 1987 1 - 1 3.33 - 2.44 1989 2 - 2 6.67 - 4.88 1990 - 1 1 - 9.09 2.44 1991 - 1 1 - 9.09 2.44 1992 2 - 2 6.67 - 4.88 1994 1 3 4 3.33 27.27 9.76 1995 3 - 3 10.00 - 7.32 1996 11 3 14 36.67 27.27 34.15 1997 6 3 9 20.00 27.27 21.95 1998 3 - 3 10.00 - 7.32 Total 30 11 41 100.00 100.00 100.00
The migration from Kochi is of two types, viz. emigration and out
migration. Of the total emigrants, 71 percent emigrated mainly to the Gulf countries viz.
U.A.E. (Dubai), Qatar, Kuwait and Saudi Arabia. Among the Gulf countries, two major
destinations and Saudi Arabia and U.A.E. (Table.62). The out migration from Kochi is
mainly to other parts of India. Except two persons, all the out migrants migrated to
Bangalore, Mumbai and other places in Tamil Nadu (Table.63).
Table. 62 Destination Of Emigration Name of Country /
Place Number of Persons
(Male) Percentage
Dubai (UAE) 7 23.33 Hong Kong 1 3.33
Qatar 2 6.67 Kuwait 1 3.33
Saudi Arabia 19 63.33 Total 30 10.00

67
Table. 63 Destination Of Out Migration Name of Country / Place Number of Persons
(Male) Percentage
Kasargod 1 8.33 Kottayam 1 8.33 Bangalore 2 16.67 Mumbai 4 33.33 Tamil Nadu 3 25.00 Not Available 1 8.33 Total 12 100.00
Based on the evidences presented above, we can conclude that due to
severe unemployment, young and educated labour force are forced to migrate to other
parts of India and abroad from Kochi for employment.
68
VIII. Summary and Conclusions The objectives of the study are the following.
1. to study the nature, characteristics and structure of urban employment.
2. to examine the incidence, type and characteristics of urban
unemployment
and
3. to present explanations for the high incidence of urban unemployment
In the study we have followed the NSS’s conceptual frame work to
define employed, unemployed, labour force and out of labour force. Accordingly,
‘Workers’ comprises of persons who are engaged in any economic activity and who
despite their attachment to economic activity have abstained from work due to illness,
injury, physical disability or other contingencies necessitating temporary absence from
work. The category of ‘Unemployed’ includes persons who are willing to work but not
worked and had sought employment through employment exchanges, friends or relatives.
The ‘Labour force’ constitutes persons who are either ‘working’ or seeking or available
for work during a reference period. The ‘out of labour force’ includes persons who were
neither seeking, nor available for work during the reference period. To define
employment and unemployment, three definitions viz. usual status, current week status
and current daily status are used.
According to usual principal status, a person is considered ‘employed’
if the person was engaged for a relatively longer time during the past year in any one or
more work related activities in the usual principal status. Similarly, a person is cons idered
‘unemployed’ if he was not working but was neither seeking nor available for work for a
relatively longer time during the past year in the principal usual status.
The ‘current weekly status’ measure classifies a person as employed if
the person was engaged for atleast one hour on any one day of the previous week or any
work related activity. As regards unemployed, a person who had not worked even for one
hour on any one day of the week, but had been seeking or had been available for work for

69
atleast one hour during the week days was considered unemployed or seeking / available
for work.
The current daily status rate is the ratio of unemployed days per week
(seeking or available for work) to the total labour supply per week.(working plus seeking
plus available days)
Primary and secondary data were used for the study. Primary data was
collected from Kochi city through a sample survey conducted during the first quarter of
1999. We have used a stratified sampling method for the collection of data. Of the total
50 divisions in Kochi city, a stratified sample was used and five divisions were selected.
Two divisions were selected on the basis of slum area, one division on the basis of
industrial activity and another two divisions were selected on the basis of nature and
shortage of housing. From each division, 60 sample households were selected on the
basis of simple random method. Based on a questionnaire, the investigators visited the
houses and collected information through interviews. In order to explain the
characteristics, nature and structure of employment and unemployment, we have
presented the following hypotheses.
(1) Inspite of the urbanisation during the last four decades, the structure of
labour market in Kochi city is largely composed of informal sector with casual
employment.
(2) The urbanisation process in Kochi had accelerated a process of
casualisation of labour in secondary and tertiary sectors and failed to generate
rapid growth of regular employment in modern organised sector.
(3) The high incidence of unemployment in Kochi city is due to the low rate
of growth of employment, the nature of labour market characterised by
informal and casual employment and low participation of educated
unemployed labour force in informal and casual activities.
(4) The large supply of educated young labour force leading to an excess
supply of labour force on the one side, the small size and slow growth of
organised sector leading to a low demand for regular employment on the other
have resulted in high incidence of educated unemployment among youth, and
70
(5) Due to severe unemployment, young and educated labour force are forced
to migrate to other parts of India and abroad for employment.
The major findings of the study relating to nature, characteristics and
structure of urban employment in Kochi city are the following. It is found that the total
workers in 300 sample households in Kochi city was 516. Of the total workers, 20
percent are regular employed, 11 percent self employed and 69 percent casually
employed. This indicates that the structure of labour market in Kochi city is largely
dominated by casual employment. It also shows that the urbanisation in Kochi had
accelerated a process of casualisation of labour in secondary and tertiary activities. Thus
the survey findings support the hypothesis we put forward to explain the nature and
structure of employment.
A classification of employment based on industrial classification is
made in the case of regular employed, self employed and casually employed. It is found
that 81 percent of the regular employment were in tertiary activities like transport, storage
and communication, whereas secondary sector accounted for 19 percent. Of the total self
employed nearly half are engaged in activities related to wholesale and retail trade,
restaurants and hotels. Only one tenth were engaged in manufacturing activities. As
regards casual employment, 6 percent are engaged in primary related activities, 33
percent in secondary activities and 60 percent in tertiary activities. More than one fifth of
the casual labourers are engaged in construction activities.
The survey has also classified the three categories of workers using
National Classification of Occupations. A classification of regular employed showed
that 36 percent are engaged in clerical related jobs, 27 percent production and related
activities and 21 percent in professional, technical and related activities. A notable
characteristic is that of the total regular employed, 36 percent are female workers.
Majority of the regular employed belonged to the category of educated and the age group
of above 40.
An occupational classification revealed that of the total self employed,
more than 50 percent are sales workers. Another 22 percent come under the category of

71
farmers, fishermen and other related workers. Among the self employed, the production
related workers account for about one fifth.
Majority of the casually employed are engaged in production related
and transport related activities. Their share is estimated as 64 percent. The second place
is occupied by farmers, fishermen, loggers etc. About 9 percent of the casual workers
were employed as sales workers. Nearly half of the casual workers, both male and
female had an educational level upto middle school.
Let us also present the major findings relating to nature and the
characteristics of urban unemployment in Kochi. Based on usual principal status
definition, the survey estimated the unemployment rate of Kochi city as 32.32 percent. A
characteristic of unemployment in Kochi is the high rate of unemployment among
females, i.e., 69 percent. On the other hand the unemployment rate for males was 18.69
percent. The survey found that the incidence of unemployment among young people
belonging to the age group 20-24 was very high. Of the total unemployed 73 percent
belonged to the age group 15-24.
The survey result revealed that the incidence of unemployment among
educated labour force was very high. It was found that unemployment rate is highest
among persons having an educational status of higher secondary. More than one fourth
of the persons having an educational level of graduation and above were reported as
unemployed. The incidence of unemployment among educated females with secondary
and higher secondary education was found very high. The excess supply of educated
labour force on the one side, the small size and slow growth of organised sector leading
to a low demand for regular employment on the other have resulted in high incidence of
educated unemployed youth.
The survey results showed a relationship between high incidence of
unemployment and low per capita income of households, low occupational category of
the head of the households, the social background denoting to the community to which
they belong and the poor environment in which they live. According to the survey, a
higher proportion of the unemployed belong to the households with low monthly per
capita income. It is also found that a high proportion of unemployed belong to the
72
households where the occupation of the head of the household is casual employment. It is
reported that more than one fifth of the unemployed live in slums.
The survey findings indicate that due to severe unemployment, young
and educated labour force are forced to migrate to other parts of India and abroad for
employment. It is found that 81 percent of the migrants from Kochi belong to the age
group 20-29 and 91 percent are educated. It is reported that the major reasons for
migration was employment. Of the total migrants in our sample, 71 percent emigrated to
the Gulf countries.

73
Bibliography
Centre For Development Studies, (1997), Poverty Unemployment and Development Policy, Orient Longman, Bombay.
David, Tumham, (1993), Employment and Development: A New Review of Evidence, Development Centre for the Organisation for Co-operation and Development, Paris.
DES, (1982), Survey on Housing and Employment, 1980, Trivandrum.
DES, (1988), Report on the Survey on Unemployment in Kerala, 1987,
Trivandrum.
Joseph Thomas, (1988), Some Economic Aspects of Higher Education in Kerala with Special Reference to Education Employment and Income Linkages, Ph.D. Theses, Kerala University.
Kochi Corporation, (1996), Development Report, 1996, The Corporation, Kochi.
Kerala, Director of Census Operations, 2001, Census of India 2001, Series – 33, Kerala, Paper 1 of 2001.
Kerala, Director of Census Operations, 2001, Census of India 2001, Series – 33, Kerala, Paper 2 of 2001.
Mathew, E.T (1995), ‘Educated Unemployment in Kerala’ : Some Socio Economic Aspects, Economic and Political Weekly, Vol.30, No.6, February 11.
Mathew, E.T (1995), Unemployed and Self Employed : Job Preference and Employment Perspectives, Economic and Political Weekly, Vol.30, No.44, November 4.
Mathew, E.T (1997), Employment and Unemployment in Kerala, Sage Publications, New Delhi.
Michael .P. Todaro, (1993), Economic Development in the Third World, Orient Longman, Bombay.
Mukherjee, C and.Thomas Isaac, T.M, (1994), Nine Observations on Educated Unemployment in Kerala (Background Paper presented on one day workshop at C.D.S on January 17, 1994.
N.S.S, Fourth Quinquennial Survey on Employment and Unemployment (Kerala) N.S.S, 43rd Round (1987 – 1988), N.S.S, New Delhi.
73

74
N.S.S, (1993), Survey Results, Employment and Unemployment Situation in Cities and Towns during late Eighties, N.S.S 43rd Round, Sarvekshana, Vol.27, No.2 October-December (1993).
N.S.S (1997), Employment and Unemployment in India, 1993 – 1994 : Fifth Quinquennial Survey, N.S.S Fifth Round, New Delhi.
Oommen, M.A, (1992), The Acute Unemployment Problem of Kerala : Some Exploratory Hypothesis, IASSI Quarterly, Vol.10, No.3.
Paul Bairoch, (1973), Urban Unemployment in Developing Countries, ILO, Geneva.
Pernia, E.M (ed) Urban Poverty in Asia : A Survey of Critical Issues, Oxford University Press, 1994, New Delhi.
Prakash, B.A, (1988), Educated Unemployment in Kerala : Some Observations based on a field study, Working paper 224, C.D.S, Trivandrum.
Prakash, B.A, (1989), Unemployment in Kerala : An analysis of Economic Causes, Working paper 231, C.D.S, Trivandrum.
Prakash, B.A, (1990), Growing Unemployment in Kerala, A study of Nature and Magnitude, Manpower Journal, Vol.25, No.3, October – December.
Ralf Hussmanns, Farhad Mehran and Vijay Verma, (1990), Surveys of Economically Active Population, Employment, Unemployment and Under Employment, ILO, Geneva.
Sarvekshana, (1990), Special Number, September.
Subbiah Kannappan, (1983), Employment Problems and Urban Labour Market in Developing Nations, The University of Michigan.
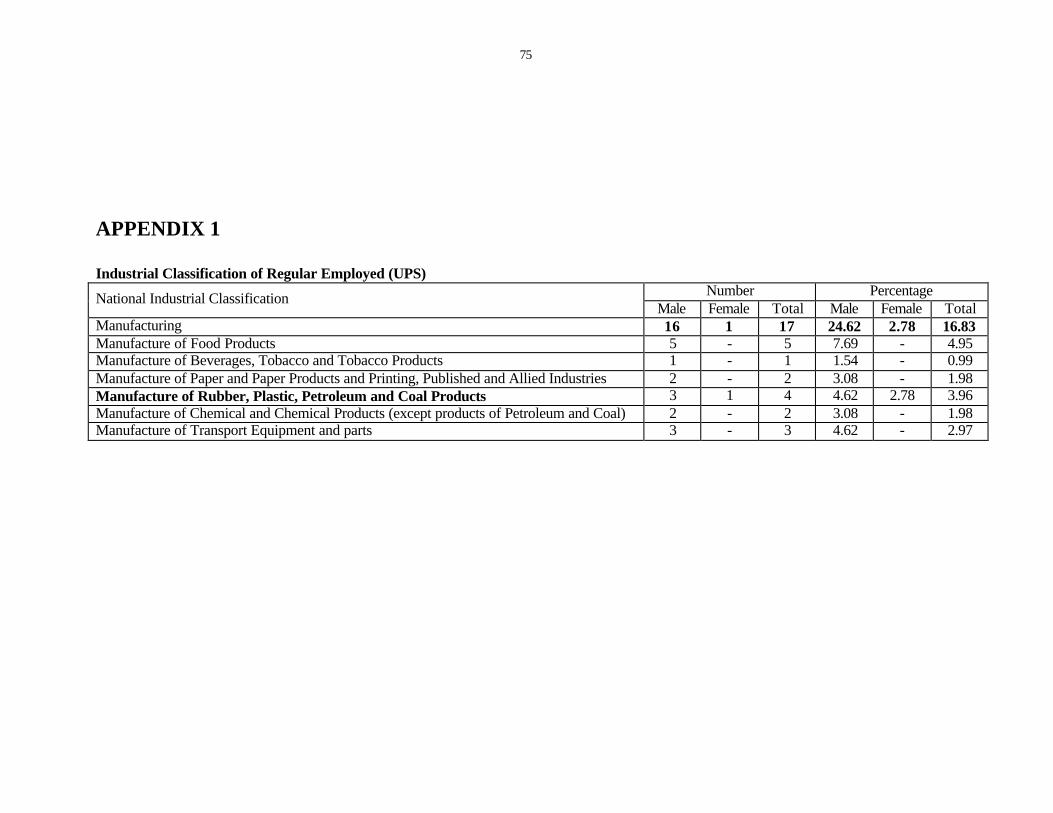
75
APPENDIX 1
Industrial Classification of Regular Employed (UPS) Number Percentage National Industrial Classification
Male Female Total Male Female Total Manufacturing 16 1 17 24.62 2.78 16.83 Manufacture of Food Products 5 - 5 7.69 - 4.95 Manufacture of Beverages, Tobacco and Tobacco Products 1 - 1 1.54 - 0.99 Manufacture of Paper and Paper Products and Printing, Published and Allied Industries 2 - 2 3.08 - 1.98 Manufacture of Rubber, Plastic, Petroleum and Coal Products 3 1 4 4.62 2.78 3.96 Manufacture of Chemical and Chemical Products (except products of Petroleum and Coal) 2 - 2 3.08 - 1.98 Manufacture of Transport Equipment and parts 3 - 3 4.62 - 2.97
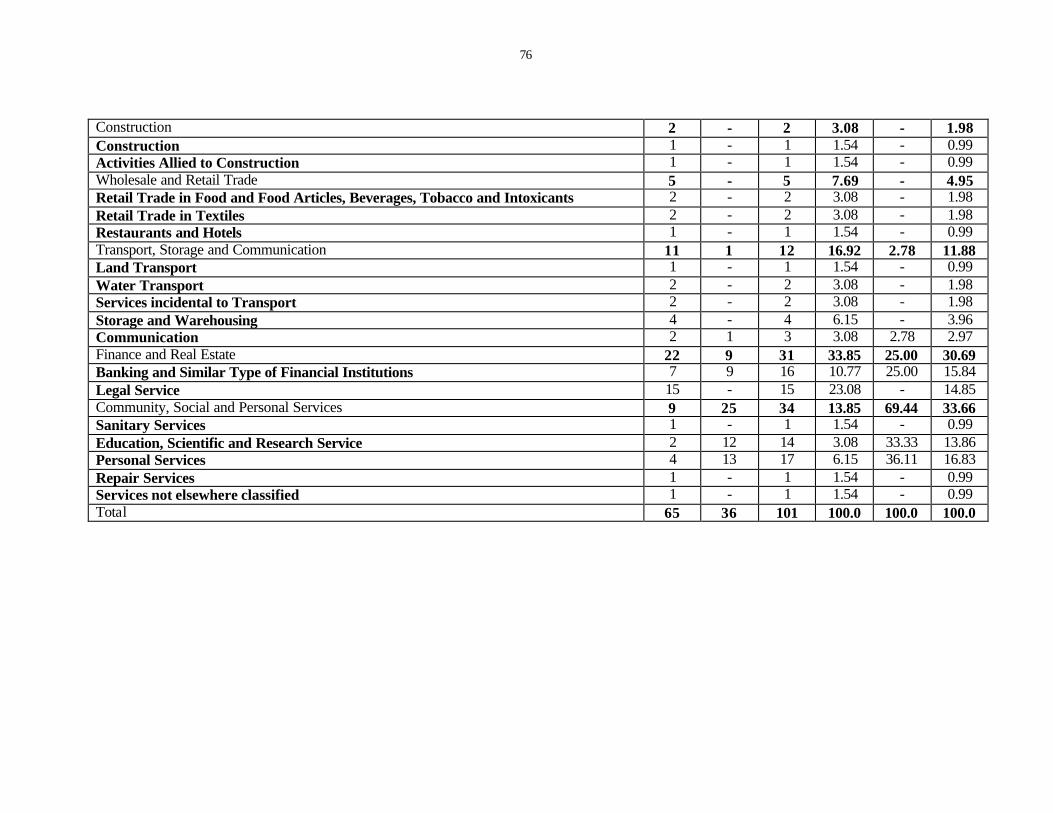
76
Construction 2 - 2 3.08 - 1.98 Construction 1 - 1 1.54 - 0.99 Activities Allied to Construction 1 - 1 1.54 - 0.99 Wholesale and Retail Trade 5 - 5 7.69 - 4.95 Retail Trade in Food and Food Articles, Beverages, Tobacco and Intoxicants 2 - 2 3.08 - 1.98 Retail Trade in Textiles 2 - 2 3.08 - 1.98 Restaurants and Hotels 1 - 1 1.54 - 0.99 Transport, Storage and Communication 11 1 12 16.92 2.78 11.88 Land Transport 1 - 1 1.54 - 0.99 Water Transport 2 - 2 3.08 - 1.98 Services incidental to Transport 2 - 2 3.08 - 1.98 Storage and Warehousing 4 - 4 6.15 - 3.96 Communication 2 1 3 3.08 2.78 2.97 Finance and Real Estate 22 9 31 33.85 25.00 30.69 Banking and Similar Type of Financial Institutions 7 9 16 10.77 25.00 15.84 Legal Service 15 - 15 23.08 - 14.85 Community, Social and Personal Services 9 25 34 13.85 69.44 33.66 Sanitary Services 1 - 1 1.54 - 0.99 Education, Scientific and Research Service 2 12 14 3.08 33.33 13.86 Personal Services 4 13 17 6.15 36.11 16.83 Repair Services 1 - 1 1.54 - 0.99 Services not elsewhere classified 1 - 1 1.54 - 0.99 Total 65 36 101 100.0 100.0 100.0

77
APPENDIX 2
Industrial Classification of Self Employed (UPS) Number Percentage National Industrial Classifications Male Female Total Male Female Total
Agriculture, Hunting, Forestry and Fishing 5 - 5 8.77 - 8.62 Plantation 1 - 1 1.75 - 3.45 Livestock Production 2 - 2 3.51 - 3.45 Fishing 2 - 2 3.51 - 3.45 Manufacturing 6 - 6 10.53 - 10.34 Manufacture of Paper and Paper Products and Printing, Published and Allied Industries 2 - 2 3.51 - 3.45 Manufacture of Metal products and Parts, except Machinery and Transport Equipment 1 - 1 1.75 - 1.72 Other Manufacturing Industries 3 - 3 5.26 - 5.17 Construction 3 - 3 5.26 - 5.17 Construction 3 - 3 5.26 - 5.17 Wholesale and Retail Trade and Restaurants and Hotel 28 1 29 49.12 100.0 50.0 Wholesale Trade in food, Textiles, Live Animals, Beverages and Intoxicants 2 - 2 3.51 - 3.45 Retail Trade in Food and Food Articles, Beverages, Tobacco and Intoxicants 14 - 14 24.56 - 24.14 Retail Trade in Fuel and other Household Utilities and Durables 1 - 1 1.75 - 1.92 Retail Trade in Others 11 1 12 19.30 100.0 20.69 Transport Storage and Communication 7 - 7 12.28 - 12.07 Service Incidental to Transport 7 - 7 12.28 - 12.07 Community, Social and Personal Services 8 - 8 14.04 - 13.79 Personal Services 4 - 4 7.02 - 6.90 Repair Services 3 - 3 5.26 - 5.17 Services not elsewhere classified 1 - 1 1.75 - 1.72 Total 57 1 58 100.0 100.0 100.0

78
APPENDIX 3 Industrial Classification of Casual Employed (UPS)
Number Percentage National Industrial Classification Male Female Total Male Female Total Agriculture, Hunting, Forestry and Fishing 21 - 21 6.93 - 6.36 Fishing 21 - - 6.93 - - Manufacturing 33 3 36 10.89 11.11 10.91 Manufacture of Food Products 1 - 1 0.33 - 0.30 Manufacture of Textile Products (including wearing apparel other than foot wear)
2 3 5 0.66 11.11 1.52
Manufacture of Wood and Wood Products, Furniture and Fixtures 17 - 17 5.61 - 5.15 Manufacture of Paper and Paper Products and Printing, Published and Allied Industries 5 - 5 1.65 - 1.52
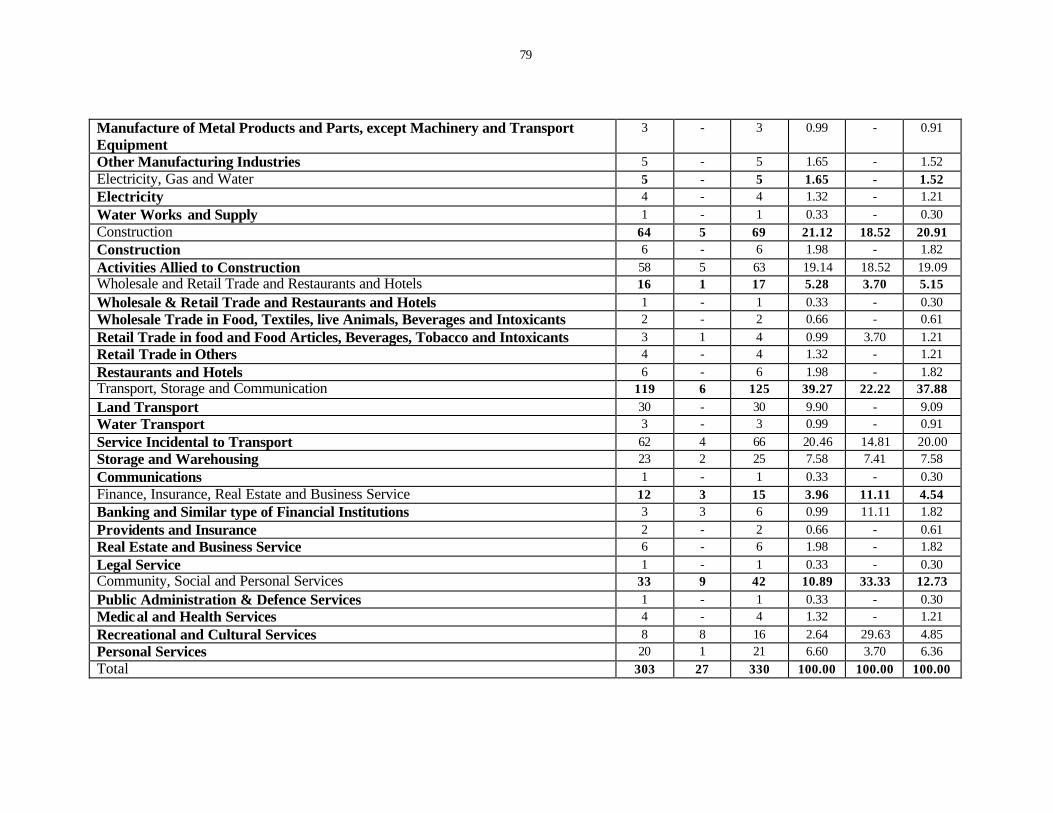
79
Manufacture of Metal Products and Parts, except Machinery and Transport Equipment
3 - 3 0.99 - 0.91
Other Manufacturing Industries 5 - 5 1.65 - 1.52 Electricity, Gas and Water 5 - 5 1.65 - 1.52 Electricity 4 - 4 1.32 - 1.21 Water Works and Supply 1 - 1 0.33 - 0.30 Construction 64 5 69 21.12 18.52 20.91 Construction 6 - 6 1.98 - 1.82 Activities Allied to Construction 58 5 63 19.14 18.52 19.09 Wholesale and Retail Trade and Restaurants and Hotels 16 1 17 5.28 3.70 5.15 Wholesale & Retail Trade and Restaurants and Hotels 1 - 1 0.33 - 0.30 Wholesale Trade in Food, Textiles, live Animals, Beverages and Intoxicants 2 - 2 0.66 - 0.61 Retail Trade in food and Food Articles, Beverages, Tobacco and Intoxicants 3 1 4 0.99 3.70 1.21 Retail Trade in Others 4 - 4 1.32 - 1.21 Restaurants and Hotels 6 - 6 1.98 - 1.82 Transport, Storage and Communication 119 6 125 39.27 22.22 37.88 Land Transport 30 - 30 9.90 - 9.09 Water Transport 3 - 3 0.99 - 0.91 Service Incidental to Transport 62 4 66 20.46 14.81 20.00 Storage and Warehousing 23 2 25 7.58 7.41 7.58 Communications 1 - 1 0.33 - 0.30 Finance, Insurance, Real Estate and Business Service 12 3 15 3.96 11.11 4.54 Banking and Similar type of Financial Institutions 3 3 6 0.99 11.11 1.82 Providents and Insurance 2 - 2 0.66 - 0.61 Real Estate and Business Service 6 - 6 1.98 - 1.82 Legal Service 1 - 1 0.33 - 0.30 Community, Social and Personal Services 33 9 42 10.89 33.33 12.73 Public Administration & Defence Services 1 - 1 0.33 - 0.30 Medical and Health Services 4 - 4 1.32 - 1.21 Recreational and Cultural Services 8 8 16 2.64 29.63 4.85 Personal Services 20 1 21 6.60 3.70 6.36 Total 303 27 330 100.00 100.00 100.00
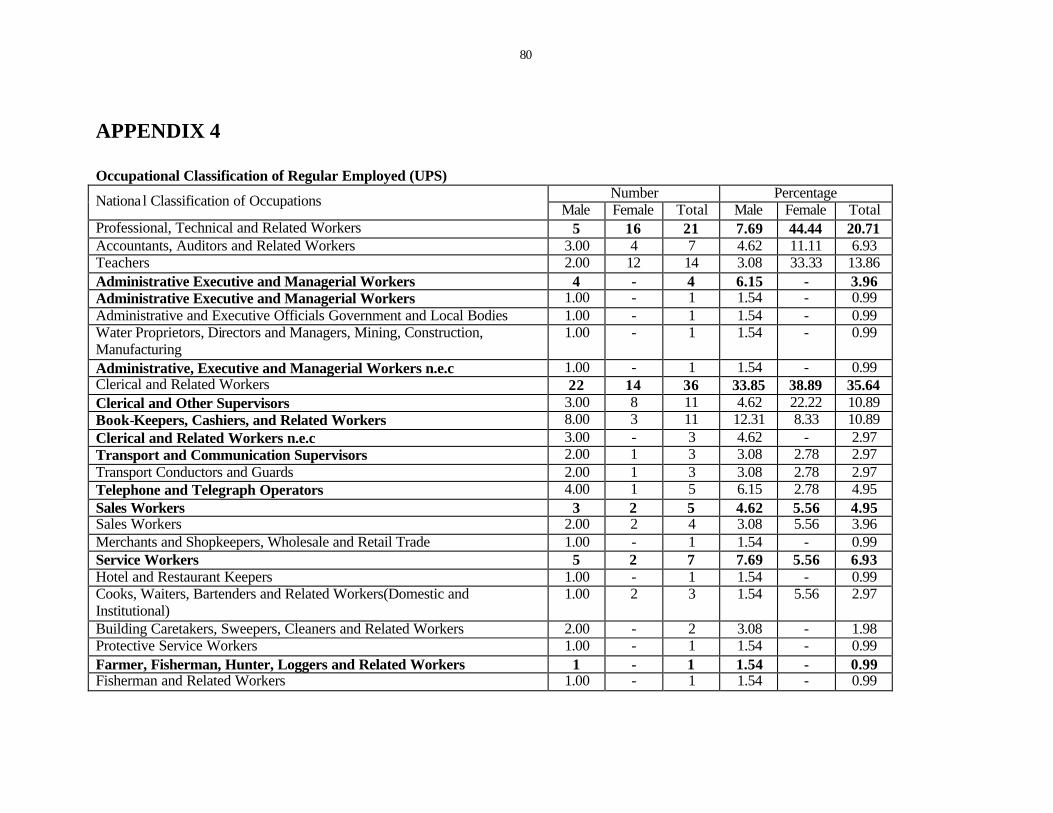
80
APPENDIX 4
Occupational Classification of Regular Employed (UPS) Number Percentage Nationa l Classification of Occupations Male Female Total Male Female Total
Professional, Technical and Related Workers 5 16 21 7.69 44.44 20.71 Accountants, Auditors and Related Workers 3.00 4 7 4.62 11.11 6.93 Teachers 2.00 12 14 3.08 33.33 13.86 Administrative Executive and Managerial Workers 4 - 4 6.15 - 3.96 Administrative Executive and Managerial Workers 1.00 - 1 1.54 - 0.99 Administrative and Executive Officials Government and Local Bodies 1.00 - 1 1.54 - 0.99 Water Proprietors, Directors and Managers, Mining, Construction, Manufacturing
1.00 - 1 1.54 - 0.99
Administrative, Executive and Managerial Workers n.e.c 1.00 - 1 1.54 - 0.99 Clerical and Related Workers 22 14 36 33.85 38.89 35.64 Clerical and Other Supervisors 3.00 8 11 4.62 22.22 10.89 Book-Keepers, Cashiers, and Related Workers 8.00 3 11 12.31 8.33 10.89 Clerical and Related Workers n.e.c 3.00 - 3 4.62 - 2.97 Transport and Communication Supervisors 2.00 1 3 3.08 2.78 2.97 Transport Conductors and Guards 2.00 1 3 3.08 2.78 2.97 Telephone and Telegraph Operators 4.00 1 5 6.15 2.78 4.95 Sales Workers 3 2 5 4.62 5.56 4.95 Sales Workers 2.00 2 4 3.08 5.56 3.96 Merchants and Shopkeepers, Wholesale and Retail Trade 1.00 - 1 1.54 - 0.99 Service Workers 5 2 7 7.69 5.56 6.93 Hotel and Restaurant Keepers 1.00 - 1 1.54 - 0.99 Cooks, Waiters, Bartenders and Related Workers(Domestic and Institutional)
1.00 2 3 1.54 5.56 2.97
Building Caretakers, Sweepers, Cleaners and Related Workers 2.00 - 2 3.08 - 1.98 Protective Service Workers 1.00 - 1 1.54 - 0.99 Farmer, Fisherman, Hunter, Loggers and Related Workers 1 - 1 1.54 - 0.99 Fisherman and Related Workers 1.00 - 1 1.54 - 0.99
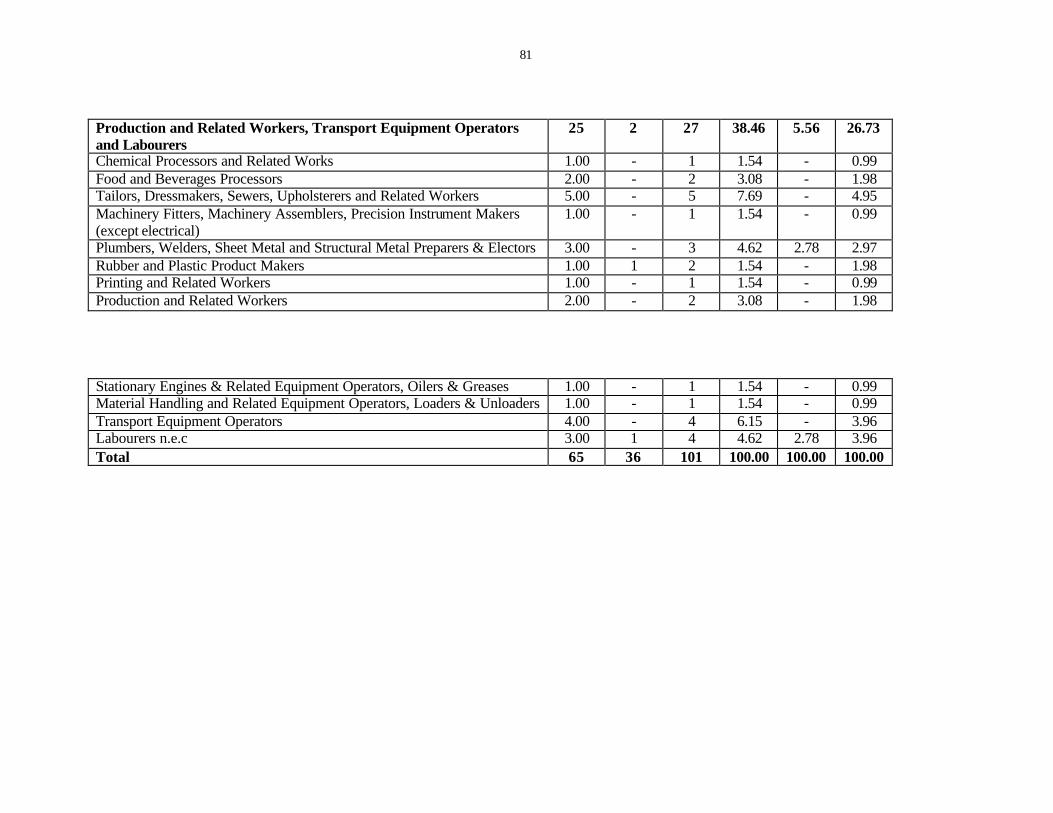
81
Production and Related Workers, Transport Equipment Operators and Labourers
25 2 27 38.46 5.56 26.73
Chemical Processors and Related Works 1.00 - 1 1.54 - 0.99 Food and Beverages Processors 2.00 - 2 3.08 - 1.98 Tailors, Dressmakers, Sewers, Upholsterers and Related Workers 5.00 - 5 7.69 - 4.95 Machinery Fitters, Machinery Assemblers, Precision Instrument Makers (except electrical)
1.00 - 1 1.54 - 0.99
Plumbers, Welders, Sheet Metal and Structural Metal Preparers & Electors 3.00 - 3 4.62 2.78 2.97 Rubber and Plastic Product Makers 1.00 1 2 1.54 - 1.98 Printing and Related Workers 1.00 - 1 1.54 - 0.99 Production and Related Workers 2.00 - 2 3.08 - 1.98 Stationary Engines & Related Equipment Operators, Oilers & Greases 1.00 - 1 1.54 - 0.99 Material Handling and Related Equipment Operators, Loaders & Unloaders 1.00 - 1 1.54 - 0.99 Transport Equipment Operators 4.00 - 4 6.15 - 3.96 Labourers n.e.c 3.00 1 4 4.62 2.78 3.96 Total 65 36 101 100.00 100.00 100.00
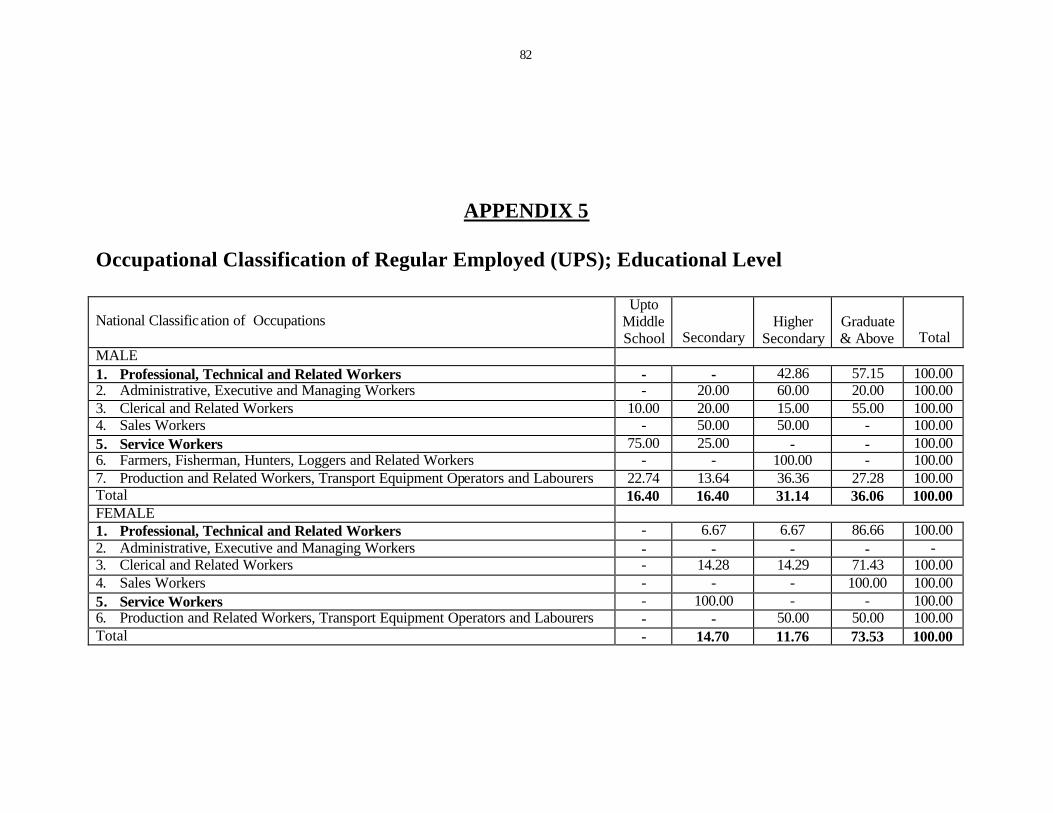
82
APPENDIX 5
Occupational Classification of Regular Employed (UPS); Educational Level
National Classification of Occupations Upto
Middle School Secondary
Higher Secondary
Graduate & Above Total
MALE 1. Professional, Technical and Related Workers - - 42.86 57.15 100.00 2. Administrative, Executive and Managing Workers - 20.00 60.00 20.00 100.00 3. Clerical and Related Workers 10.00 20.00 15.00 55.00 100.00 4. Sales Workers - 50.00 50.00 - 100.00 5. Service Workers 75.00 25.00 - - 100.00 6. Farmers, Fisherman, Hunters, Loggers and Related Workers - - 100.00 - 100.00 7. Production and Related Workers, Transport Equipment Operators and Labourers 22.74 13.64 36.36 27.28 100.00 Total 16.40 16.40 31.14 36.06 100.00 FEMALE 1. Professional, Technical and Related Workers - 6.67 6.67 86.66 100.00 2. Administrative, Executive and Managing Workers - - - - - 3. Clerical and Related Workers - 14.28 14.29 71.43 100.00 4. Sales Workers - - - 100.00 100.00 5. Service Workers - 100.00 - - 100.00 6. Production and Related Workers, Transport Equipment Operators and Labourers - - 50.00 50.00 100.00 Total - 14.70 11.76 73.53 100.00

83
APPENDIX 6 Occupational Classification of Regular Employed UPS ; Agewise (Percentage)
Agewise Distribution National Classification of Occupations 20-24 25-29 30-39 40-49 50-59 Total
MALE 1. Professional, Technical and Related Workers - 37.5 25.00 25.00 12.50 100.00 2. Administrative, Executive and Managing Workers - 66.67 33.33 - - 100.00 3. Clerical and Related Workers 9.52 28.57 - 9.52 52.38 100.00 4. Sales Workers - - - - 100.00 100.00 5. Service Workers 50.00 25.00 - - 25.00 100.00 6. Farmers, Fisherman, Hunters, Loggers and Related Workers - 100.00 - - - 100.00 7. Production and Related Workers, Transport Equipment Operators and Labourers - 39.13 21.74 8.70 30.44 100.00 Total 6.56 36.06 13.11 9.84 34.43 100.00 FEMALE 1. Professional, Technical and Related Workers - 14.29 4.76 57.14 23.81 100.00 2. Clerical and Related Workers 20.00 10.00 10.00 10.00 50.00 100.00 3. Sales Workers - 100.00 - - - 100.00 4. Service Workers 50.00 50.00 - - - 100.00 5. Production and Related Workers, Transport Equipment Operators and Labourers - 50.00 - - 50.00 100.00 Total 8.33 19.44 5.56 36.11 30.55 10.00
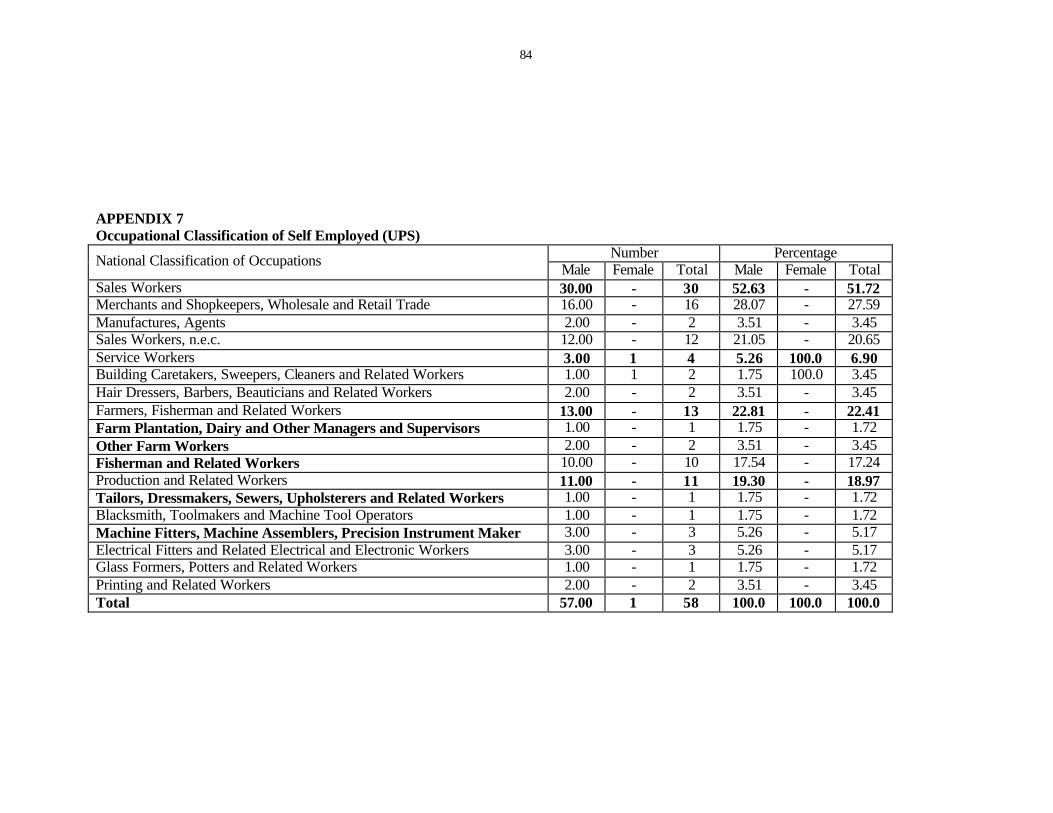
84
APPENDIX 7 Occupational Classification of Self Employed (UPS)
Number Percentage National Classification of Occupations Male Female Total Male Female Total Sales Workers 30.00 - 30 52.63 - 51.72 Merchants and Shopkeepers, Wholesale and Retail Trade 16.00 - 16 28.07 - 27.59 Manufactures, Agents 2.00 - 2 3.51 - 3.45 Sales Workers, n.e.c. 12.00 - 12 21.05 - 20.65 Service Workers 3.00 1 4 5.26 100.0 6.90 Building Caretakers, Sweepers, Cleaners and Related Workers 1.00 1 2 1.75 100.0 3.45 Hair Dressers, Barbers, Beauticians and Related Workers 2.00 - 2 3.51 - 3.45 Farmers, Fisherman and Related Workers 13.00 - 13 22.81 - 22.41 Farm Plantation, Dairy and Other Managers and Supervisors 1.00 - 1 1.75 - 1.72 Other Farm Workers 2.00 - 2 3.51 - 3.45 Fisherman and Related Workers 10.00 - 10 17.54 - 17.24 Production and Related Workers 11.00 - 11 19.30 - 18.97 Tailors, Dressmakers, Sewers, Upholsterers and Related Workers 1.00 - 1 1.75 - 1.72 Blacksmith, Toolmakers and Machine Tool Operators 1.00 - 1 1.75 - 1.72 Machine Fitters, Machine Assemblers, Precision Instrument Maker 3.00 - 3 5.26 - 5.17 Electrical Fitters and Related Electrical and Electronic Workers 3.00 - 3 5.26 - 5.17 Glass Formers, Potters and Related Workers 1.00 - 1 1.75 - 1.72 Printing and Related Workers 2.00 - 2 3.51 - 3.45 Total 57.00 1 58 100.0 100.0 100.0
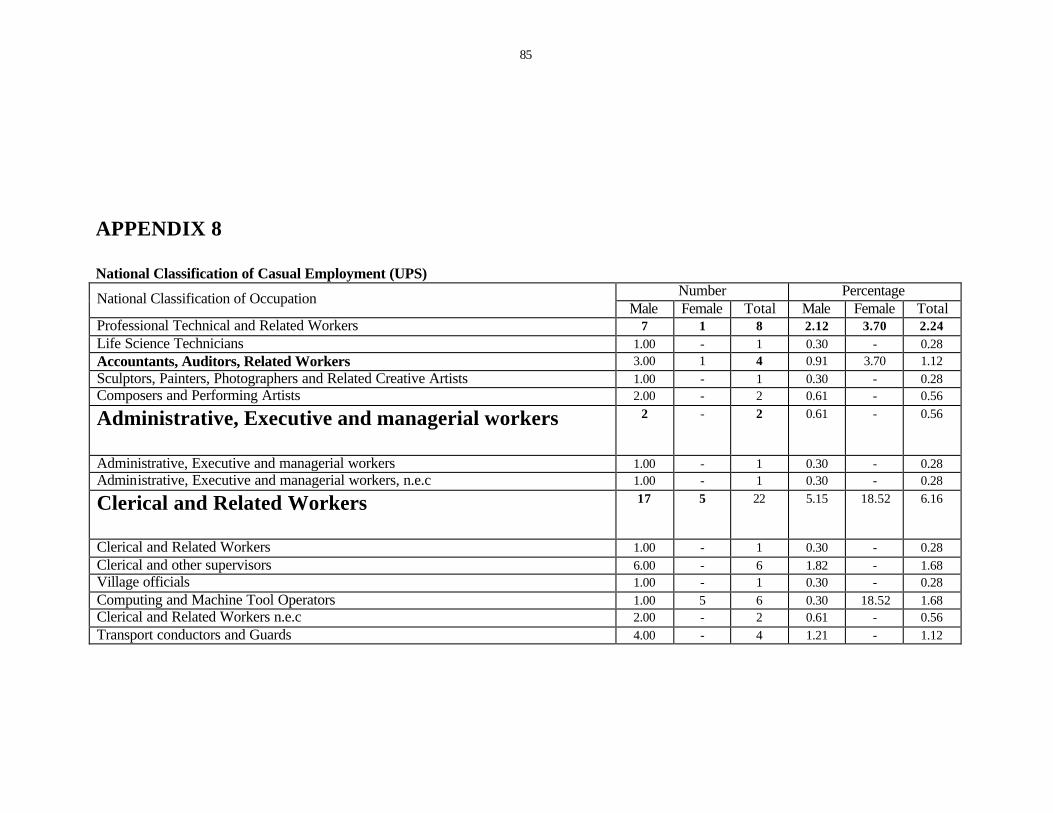
85
APPENDIX 8
National Classification of Casual Employment (UPS) Number Percentage National Classification of Occupation
Male Female Total Male Female Total Professional Technical and Related Workers 7 1 8 2.12 3.70 2.24 Life Science Technicians 1.00 - 1 0.30 - 0.28 Accountants, Auditors, Related Workers 3.00 1 4 0.91 3.70 1.12 Sculptors, Painters, Photographers and Related Creative Artists 1.00 - 1 0.30 - 0.28 Composers and Performing Artists 2.00 - 2 0.61 - 0.56
Administrative, Executive and managerial workers 2 - 2 0.61 - 0.56
Administrative, Executive and managerial workers 1.00 - 1 0.30 - 0.28 Administrative, Executive and managerial workers, n.e.c 1.00 - 1 0.30 - 0.28
Clerical and Related Workers 17 5 22 5.15 18.52 6.16
Clerical and Related Workers 1.00 - 1 0.30 - 0.28 Clerical and other supervisors 6.00 - 6 1.82 - 1.68 Village officials 1.00 - 1 0.30 - 0.28 Computing and Machine Tool Operators 1.00 5 6 0.30 18.52 1.68 Clerical and Related Workers n.e.c 2.00 - 2 0.61 - 0.56 Transport conductors and Guards 4.00 - 4 1.21 - 1.12

86
Mail Distributors and Related Workers 1.00 - 1 0.30 - 0.28 Telephone and Telegraph operators 1.00 - 1 0.30 - 0.28 Sales workers 27 4 31 8.18 14.81 8.68 Merchants and Shopkeepers, Wholesale and Retail Trade 4.00 - 4 1.21 - 1.12 Manufacturers, Agents 1.00 - 1 0.30 - 0.28 Technical salesmen and Commercial Travellers 1.00 - 1 0.30 - 0.28 Salesmen, Shop Assistants and Related workers 10.00 4 14 3.03 14.81 3.92 Insurance, Real Estate, Securities and Business Service Salesmen and Auctioners 5.00 - 5 1.52 - 1.40 Money lenders and Pawn brokers 2.00 - 2 0.61 - 0.56 Sales workers n.e.c 4.00 - 4 1.21 - 1.12 Service workers 9 3 12 2.73 11.11 3.36 Hotel and Restaurant keepers 3.00 - 3 0.91 - 0.84 Cooks, Waiters, Bartenders and Related workers (Domestic and Institutional) 1.00 1 2 0.30 3.70 0.56
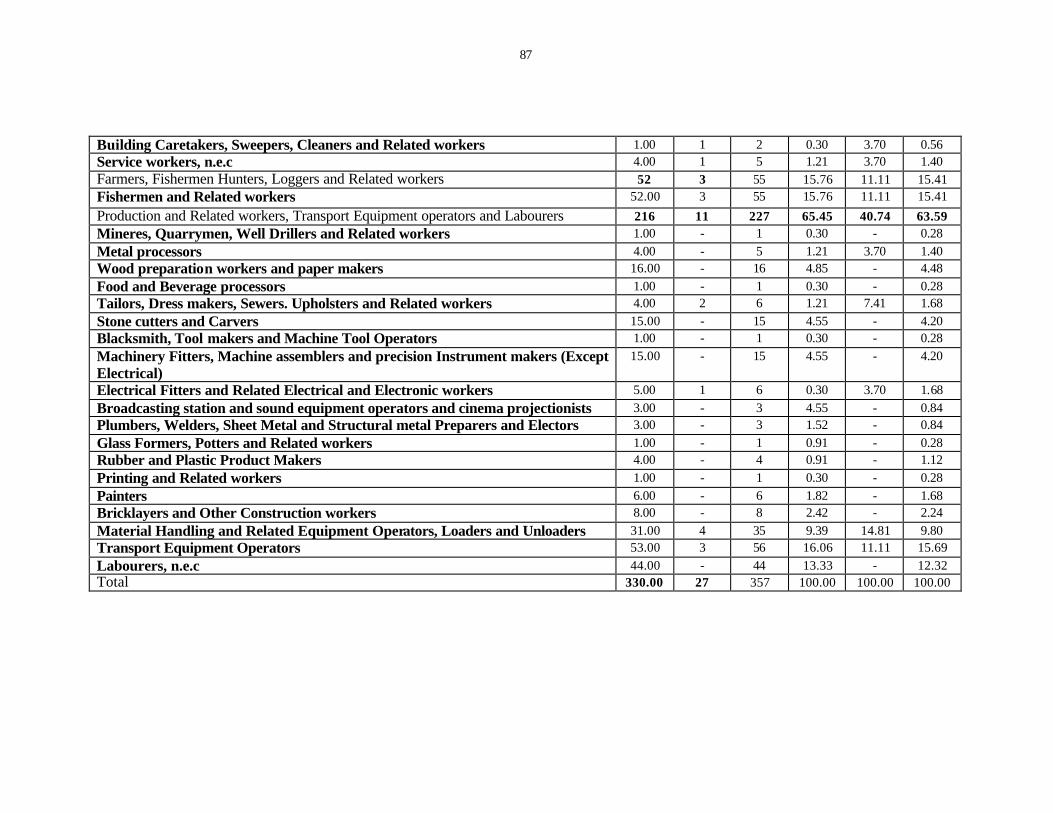
87
Building Caretakers, Sweepers, Cleaners and Related workers 1.00 1 2 0.30 3.70 0.56 Service workers, n.e.c 4.00 1 5 1.21 3.70 1.40 Farmers, Fishermen Hunters, Loggers and Related workers 52 3 55 15.76 11.11 15.41 Fishermen and Related workers 52.00 3 55 15.76 11.11 15.41
Production and Related workers, Transport Equipment operators and Labourers 216 11 227 65.45 40.74 63.59 Mineres, Quarrymen, Well Drillers and Related workers 1.00 - 1 0.30 - 0.28 Metal processors 4.00 - 5 1.21 3.70 1.40 Wood preparation workers and paper makers 16.00 - 16 4.85 - 4.48 Food and Beverage processors 1.00 - 1 0.30 - 0.28 Tailors, Dress makers, Sewers. Upholsters and Related workers 4.00 2 6 1.21 7.41 1.68 Stone cutters and Carvers 15.00 - 15 4.55 - 4.20 Blacksmith, Tool makers and Machine Tool Operators 1.00 - 1 0.30 - 0.28 Machinery Fitters, Machine assemblers and precision Instrument makers (Except Electrical)
15.00 - 15 4.55 - 4.20
Electrical Fitters and Related Electrical and Electronic workers 5.00 1 6 0.30 3.70 1.68 Broadcasting station and sound equipment operators and cinema projectionists 3.00 - 3 4.55 - 0.84 Plumbers, Welders, Sheet Metal and Structural metal Preparers and Electors 3.00 - 3 1.52 - 0.84 Glass Formers, Potters and Related workers 1.00 - 1 0.91 - 0.28 Rubber and Plastic Product Makers 4.00 - 4 0.91 - 1.12 Printing and Related workers 1.00 - 1 0.30 - 0.28 Painters 6.00 - 6 1.82 - 1.68 Bricklayers and Other Construction workers 8.00 - 8 2.42 - 2.24 Material Handling and Related Equipment Operators, Loaders and Unloaders 31.00 4 35 9.39 14.81 9.80 Transport Equipment Operators 53.00 3 56 16.06 11.11 15.69 Labourers, n.e.c 44.00 - 44 13.33 - 12.32 Total 330.00 27 357 100.00 100.00 100.00
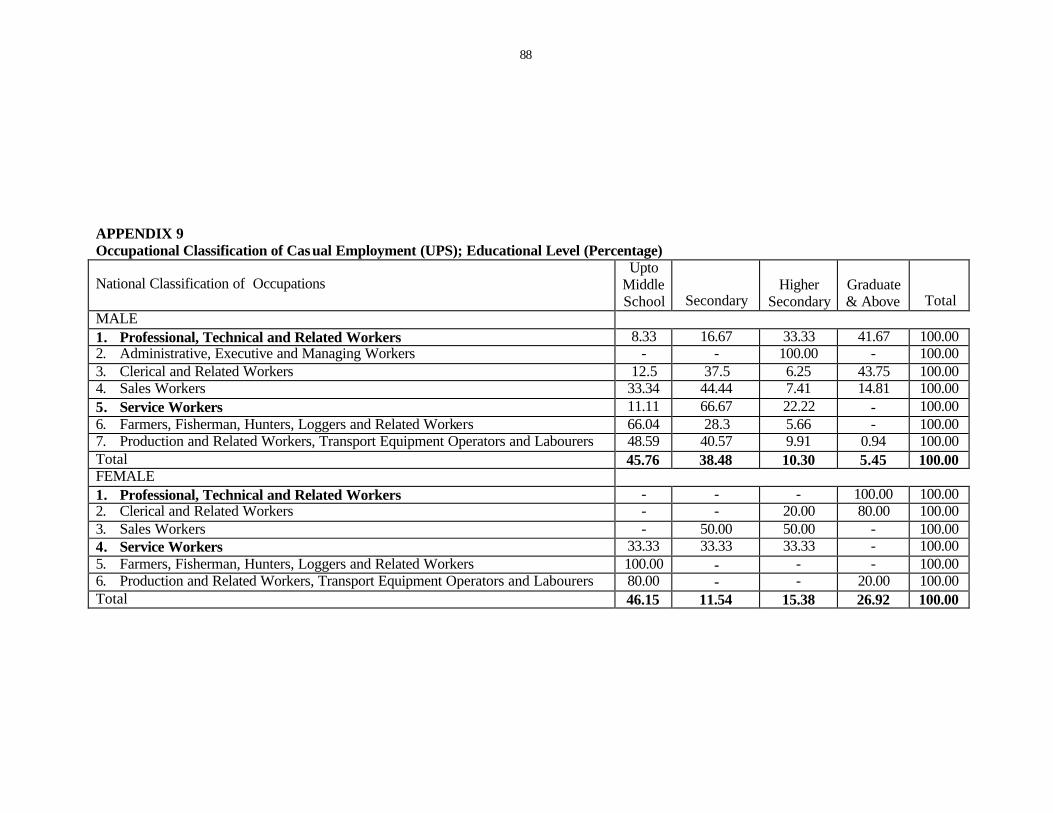
88
APPENDIX 9 Occupational Classification of Casual Employment (UPS); Educational Level (Percentage)
National Classification of Occupations Upto
Middle School Secondary
Higher Secondary
Graduate & Above Total
MALE 1. Professional, Technical and Related Workers 8.33 16.67 33.33 41.67 100.00 2. Administrative, Executive and Managing Workers - - 100.00 - 100.00 3. Clerical and Related Workers 12.5 37.5 6.25 43.75 100.00 4. Sales Workers 33.34 44.44 7.41 14.81 100.00 5. Service Workers 11.11 66.67 22.22 - 100.00 6. Farmers, Fisherman, Hunters, Loggers and Related Workers 66.04 28.3 5.66 - 100.00 7. Production and Related Workers, Transport Equipment Operators and Labourers 48.59 40.57 9.91 0.94 100.00 Total 45.76 38.48 10.30 5.45 100.00 FEMALE 1. Professional, Technical and Related Workers - - - 100.00 100.00 2. Clerical and Related Workers - - 20.00 80.00 100.00 3. Sales Workers - 50.00 50.00 - 100.00 4. Service Workers 33.33 33.33 33.33 - 100.00 5. Farmers, Fisherman, Hunters, Loggers and Related Workers 100.00 - - - 100.00 6. Production and Related Workers, Transport Equipment Operators and Labourers 80.00 - - 20.00 100.00 Total 46.15 11.54 15.38 26.92 100.00


