51
4 August 2016 H Jacobs URBANISATION & IMPACT ON BASIC SERVICE DELIVERY Presentation to PP&DF

4 August 2016 H Jacobs
URBANISATION & IMPACT ON BASIC SERVICE DELIVERY
Presentation to PP&DF

Urbanisation & what it means for basic service
delivery in the Western Cape?
Problem Statement
- A Big-Numbers Rapid-Review -
Urbanisation = increase in the urban population of a
country or area due to the following components of
urban population growth:
• urban natural increase,
• urban net migration, and
• the reclassification of parts of the rural population
into the category ‘urban’ (due to the sprawl of
existing urban areas into their rural surroundings or
the development of new towns in former rural
areas)

© Western Cape Government 2013| MinMay June 2016
Demographic Forecasts – Western Cape
Population is expected to increase by just over 32% over the next 25 years (from
6.2 million in 2015 to 8.2 million in 2040)
The urban population is expected to increase from 4.2 to 6.2 million (an increase
of 47.6% over the next 25 years)
4
4.5
5
5.5
6
6.5
5
5.5
6
6.5
7
7.5
8
8.5
2015 2020 2025 2030 2035 2040
Ura
bn
Po
pu
latio
n (
mill
ion
s)
Po
pu
latio
n (
mill
ion
s)
Population Urban Population
6.2 million
8.2 million
1.57% / annum
1.12% / annum

© Western Cape Government 2013| MinMay June 2016
Urbanisation – Western Cape
An even larger portion of the Western Cape population will be living in urban areas
(nearly 76% of the population by 2040*
In 2015 approximately 62% of the South African population were living in urban areas**• Source: FuturesCape, 2016
• ** Source: Gapminder, data source
0
1
2
3
4
5
6
7
64
66
68
70
72
74
76
78
2015 2020 2025 2030 2035 2040
Urb
an
Po
pu
latio
n (
mill
ion
s)
Urb
an
isa
tio
n (
Pe
rce
nt)
Urbanisation Rate Urban Population
4.2 mil
76%
69%

© Western Cape Government 2013| MinMay June 2016
Youth and Pensioners – Western Cape
The number of individuals over 65 is forecast to more than double, from 389 000 to
949 000, by 2040
The number of school aged kids (6-19) is forecast to increase by 12% by 2040
(from 1.5 million to 1.65 million)
In 2040 pensioners will make up 11% of the total population, while school aged
youth will make up 20 percent
0%
5%
10%
15%
20%
25%
30%
2015 2040
Pe
rce
nt
of To
tal Po
pu
latio
n
Ages 6-19 Over 65

© Western Cape Government 2013| MinMay June 2016
URBANISATION :- HOUSEHOLD FORMATION VS. POPULATION GROWTH
7
Western Cape household growth @
33.6% [Drives the need for access to
basic services]
Western Cape population growth @
19.0% [Drives need for health,
education, recreational, social, etc.
facilities]

© Western Cape Government 2013| MinMay June 2016
Relative changes in dwelling type per Province
8
The period 2007 to 2011 saw a remarkable increase in the percentage of households living in informal type of dwellings in the Western Cape – and increase of 3.9 percentage points. All other Provinces experienced a decrease in percentage of households living in informal type dwellings (Northern Cape the exception with a 2.2% movement).
Source: Statistics SA, Census 2011 Provinces at a Glance. Report No. 03-01-43

© Western Cape Government 2013| MinMay June 2016
Context
9
By 2030 750 Global Cities
Majority of growth within Cape Metro / City
Region & Southern Cape (George, Mossel
Bay, Bitou)
Informality, basic services backlog & poverty
= remains a reality
Socio-economic current truths & Ecological
Services Endowment
Receiving Environment
© Western Cape Government 2013| MinMay June 2016
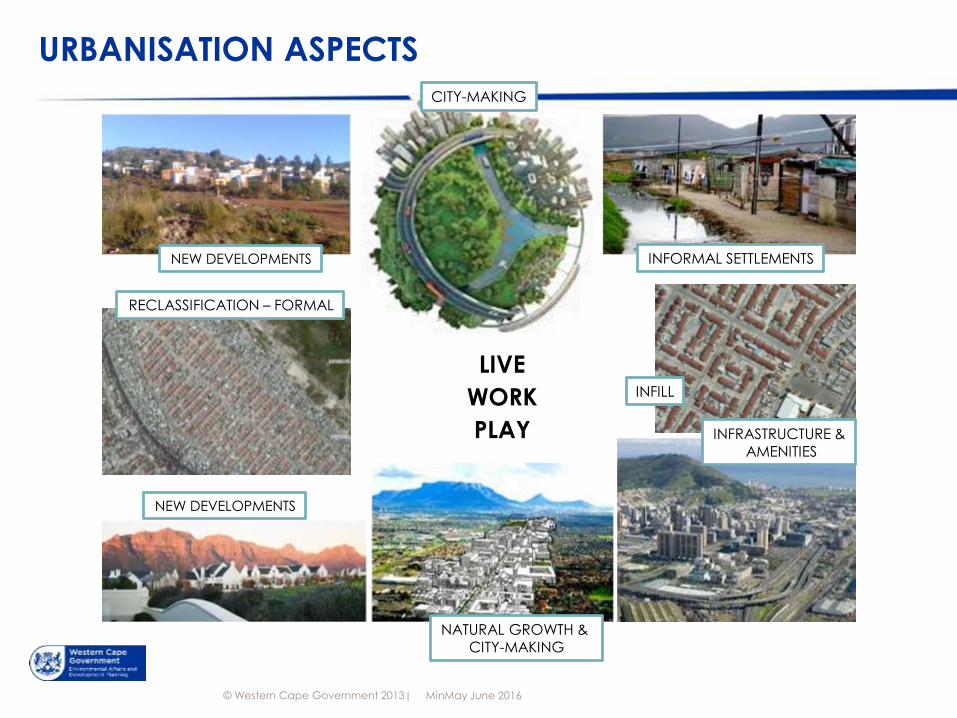
URBANISATION ASPECTS
LIVE
WORK
PLAY
NATURAL GROWTH & CITY-MAKING
INFORMAL SETTLEMENTS
NEW DEVELOPMENTS
INFILL
RECLASSIFICATION – FORMAL
NEW DEVELOPMENTS
CITY-MAKING
INFRASTRUCTURE &AMENITIES

© Western Cape Government 2013| MinMay June 2016
SOCIAL –ECOLOGICAL SYSTEM
(SES)
Built Env
Eco-System
HUMAN
Integrated system of ecosystems and human society
reciprocal feedback and interdependence
Integration silos
URBANISATION = SOCIAL-ECOLOGICAL SYSTEM

© Western Cape Government 2013| MinMay June 2016
SUSTAINABLE DEVELOPMENT
“Sustainable development, then, is about recognizing and
accepting our responsibilities not just for where we live, but more
widely for the environment at a global scale. In order to do this we
need to look beyond the environment itself, to the broader
economic, social, and political systems within which human
decisions are made. Fundamentally, sustainable development
requires not just altering behaviour patterns in relation to the
environment, but about changing the broader systems
that shape human behaviour.”
Haughton 1999: 234

© Western Cape Government 2013| MinMay June 2016
SOCIAL ECOLOGICAL SYSTEMS are COMPLEX ADAPTIVE SYSTEMS
SUSTAINABLE DEVELOPMENT:
normative (what we ought to do
to achieve desired outcomes)
No 1 size fits all – innovation response to urbanisation
Environment
Equity / social & procedural
justice
Economy/ livelihoods/ prosperity
COMPLEX ADAPTIVE SYSTEMS REQUIRE ADAPTIVE MANAGEMENT APPROACHES
Simple Rules : Complex Behaviour
Self-organising : Different times and geographic scales
Feedback loops requires constant adaptation
Non-linear
Cannot know it all

Spatial Manifestation of Growth
- Spatial Performance Monitoring & Management -
Problem Statement
- DPIM&R + Collective-
New SPLUM dispensation
Point of access to immense opportunities
How we use it will determine how history will view our
legacy
Never before has the need for delivery of empirical and
scientific evidence been more important!

© Western Cape Government 2013| MinMay June 2016
What is SPLUMA about?
A single Spatial Planning System for the country
PrinciplesPolicies and legislation
Spatial development planning & frameworks Land use management
through schemes
Land development (applications)
Some other provisions

© Western Cape Government 2013| MinMay June 2016
What is SPLUMA about?
Procedural compliance (the case historically).
Substantive compliance
A normative approach to spatial planning and land use management
Achieved through “giving effect to” the SPLUMA
principles
Depends Relationships

© Western Cape Government 2013| MinMay June 2016
SPLUMA PRINCIPLES
• The principle of spatial justice
• The principle of spatial sustainability
• The principle of efficiency
• The principle of spatial resilience
• The principle of good administration
[Encapsulates the entire system of government]

© Western Cape Government 2013| MinMay June 2016
MUNICIPAL FINANCIAL SUSTAINABILITY
OF SPATIAL GROWTH PATTERNS
Financial and economic evidence to support the spatial policies of
compaction, integration and densification
Comparing the up-front and on-going costs of dispersed vs compact
urban development
Comparing the non-financial costs associated with two growth models
(loss of productive, cultural, scenic and/or biodiversity landscapes)
18
R24 billion additional capital required
over the next 10 years with funding shortfalls
To break even some municipalities would
have to increase rates and tariffs by up to
4% above inflation every year to keep up
with rising costs
Low income households will have to spend up
to 18% more for transport
33% average increase in carbon emissions
from transport
NSDF Framework Presentation – 19
April 2016

© Western Cape Government 2013| MinMay June 2016
HOW DO COST VARY IN SPACE?
19
Public services
Land and housing
Internalinfrastructure
Connectorinfrastructure
Bulkinfrastructure
Transport
Infilldevelopment
Peripheraldevelopment VS
…spatial and resource inefficiencies have serious negative consequences
for the environment, but also for government finances (particular municipal
finances) and for household livelihoods

© Western Cape Government 2013| MinMay June 2016
Mossel Bay Growth Scenarios - Comparisons
20
Public services[R250m capex & R12m/annum opex]
Land and housing[361 ha vs 2743 ha]
Internalinfrastructure
GHG Emissions[72% difference]
Municipal Financial Impact[capex R330m/net operating position R274m)
Transport[32% improvement]
Compactdevelopment
Sprawldevelopment VS
…spatial and resource inefficiencies have serious negative consequences
for the environment, but also for government finances (particular municipal
finances) and for household livelihoods

SOUTH AFRICA
URBANISATION IN SPATIAL CONTEXT
- Global
- National
- Provincial

© Western Cape Government 2013| MinMay June 2016
GLOBAL GROWTH TRENDS:- BY REGION
22
1. 2015, world population reached 7.3 billion 11 billion In 2016, 83 million people+
2. Continued population growth until 2050 Rest of World and Africa
3. Africa population growth continues to experience very high rates 2015-2050 populations
of 28 African countries projected to more than double – vast majority of people on Continent will stay in settlements and medium sized cities.
4. 2015 - ‘PINCODE’ of the world = 1114 | 2050 - ‘PINCODE’ of the world = 1125
THEN 2100 – ‘PINCODE’ of the world = 1145
5. Growth will be in Sub-Sahara!1. * United Nations World Population Report 2015
South African Population Change 1980-2015 [50-100%] | 2015-2050 [10-50%]

© Western Cape Government 2013| MinMay June 2016
1
10
100
1000
10000
100000
1000000
10000000
Africa Sub-Sahara Southern Africa South Africa
Po
pu
latio
n (
‘00
0s)
[Lo
g S
ca
le]
2015
2050
2100
South(ern) African Context
South Africa in African Context*
23
2015 2050 2100
Africa 1 186 178 2 477 536 4 386 591
Sub-Sahara 962 287 2 123 232 3 934 828
Southern Africa 62 634 78 029 80 737
South Africa 54 490 65 540 65 696
2015 [%] 2050 [%] 2100 [%]
Africa
Sub-Sahara 81.1% 85.7% 89.7%
Southern Africa 6.5% 3.7% 2.1%
South Africa 87.0% 84.0% 81.4%
Density = 45 Persons/He
* Source information from: United Nations World Population Report 2015

© Western Cape Government 2013| MinMay June 2016
South African Cities’ Growth Prospects
24
Johannesburg South Africa 3.7 9.2 11.6 48 35 34 3.2 1.0 17.3 26.9
Cape Town South Africa 2.2 3.6 4.3 103 106 131 1.8 1.1 6.8 10.6
Durban South Africa 1.7 2.9 3.3 136 147 178 1.1 1.1 5.4 8.5
Pretoria South Africa 0.9 2.0 2.7 290 225 224 4.2 1.2 3.7 5.8
Port Elizabeth South Africa 0.8 1.2 1.4 311 396 438 1.3 1.3 2.2 3.4
Vereeniging South Africa 0.7 1.1 1.4 338 412 442 1.5 1.3 2.2 3.4
Size and Spatial Distribution of Urban Centres of Growth

© Western Cape Government 2013| MinMay June 2016
Cape Town is Expected to grow from 3,74 million
individuals in 2011 to 4,63 million individuals in
2040
PWC POPULATION PROJECTIONS: 2011-2040
32

© Western Cape Government 2013| MinMay June 2016 33
Big City Blow-Out
PWC Population Estimates
STEPSA – main trends
Change Detection – Hotspot Analysis
GPS2013• By 2030 CoCT population = 4.42mil
• By 2030 WC Province population = 6.9mil
• 3 Lead Growth Districts Account for 30% of future growth. CoCT account for 58% of future growth
• West Coast / Winelands and Overberg = 3 lead growth districts
• Keep close watch on Overstrand

© Western Cape Government 2013| MinMay June 2016
PWC POPULATION GROWTH & PROJECTIONS: 2011-2040
34
139,372 248,586 88,188 147,101 17,758 894,165 1,535,170
Absolute Growth: 2011-2040
Census 2011:
WCDM : 391,773CWDM : 787,486ODM: 258,178EDM: 574,266CKDM: 71,003CoCT: 3,740,037WCP: 5,822,742

© Western Cape Government 2013| MinMay June 2016
PWC POPULATION GROWTH & PROJECTIONS: 2011-2040
35
District
#1
[Actual Growth]
% Growth
#2
[Actual Growth]
% Growth
#3
[Actual Growth]
% Growth
WCDM Saldanha Bay
[48,449] 1.38%
Swartland[35,650] 0.94%
Bergrivier[23,429] 1.11%
CWDM Drakenstein
[85,650]0.98%
Stellenbosch
[69,123]1.23%
Witzenberg[38,876]0.97%
ODM Overstrand
[38,440]1.36%
Theewaterskloof[33,287]0.92%
Swellendam[9,390]0.80%
EDM[Note: Oudtshoorn
[-5538]
George
[62,616] 0.97%
Mosselbay[33,605] 1.11%
Bitou
[26,256] 1.49%
CKDM Beaufort West
[14,242]0.87%
Prince Albert
[3,509] 0.82%
Laingsburg
[7]0%
Highest Actual
Growth outside
CoCT:
Drakenstein
Stellenbosch
George
Highest % Growth
outside CoCT:
Bitou
Saldanha Bay
Overstrand

© Western Cape Government 2013| MinMay June 2016
POPULATION GROWTH & PROJECTIONS: 2011-2040
36
Source: PWC Population Projections 2011-2040
WCDM
[Actual Growth]
% Growth
Saldanha Bay [48,449]
1.38%
Swartland
[35,650]
0.94%
Bergrivier[23,429] 1.11%
CWDM
[Actual Growth]
% Growth
Drakenstein
[85,650]
0.98%
Stellenbosch
[69,123]
1.23%
Witzenberg[38,876]0.97%
ODM
[Actual Growth]
% Growth
Overstrand[38,440]1.36%
Theewaterskloof[33,287]0.92%
Swellendam[9,390]0.80%
EDM
[Actual Growth]
% Growth
George [62,616] 0.97%
Mosselbay[33,605] 1.11%
Bitou[26,256] 1.49%
CKDM
[Actual Growth]
% Growth
Beaufort West[14,242]0.87%
Prince Albert[3,509] 0.82%
Laingsburg[7]0%

© Western Cape Government 2013| MinMay June 2016
Change detection
Main aim
Detecting hot spots of building growth changes in development within the Western
Cape Province
Objectives
To detect areas of change and rate of change
To indicate spatial patterns of change versus high density unchanged areas
To indicate building growth trends

Trend analysis for City of Cape Town municipality
Y axis : North to South
-Direction: West to East
-Change: Low value buildings
on West and Higher to East
X axis : East to west
-Direction: North to South trend
-Change : Central Low values
buildings and high value on the South
Spot 5 building
count point
classification
Data fluctuation changes indicating years
of change and differenced amount of
change
Spatial classification of change
areas

Covariance modelling
Covariance parameters
-Input data : SBC –base year
-Surface output : prediction
-Kriging type : Simple
-Search direction : true
-Show all points : Binned and averaged
Search neighbourhood
-Maximum : 5 points
-Minimum : 2 points
-Sectors : 4 sectors
-Neighbourhood type : smooth factor= 0.2
Accuracy assessment of output results
- Root mean square observed : 1.03
Cross validation
Out put model map
Covariance
model

Building density
SBC point density
Density= number of buildings
area
Point density of a given area
over mapping scale in km²

© Western Cape Government 2013| MinMay June 2016 43
Hotspots
Emerging

© Western Cape Government 2013| MinMay June 2016
Spatial Distribution of SBC:- 2006 = green / 2007 = red
44
Change Detection Settlement
Patterns

© Western Cape Government 2013| MinMay June 2016
Spatial Distribution of SBC:- 2008 = green / 2009 = red
45
Change Detection Settlement
Patterns

© Western Cape Government 2013| MinMay June 2016
Change detection green = 2010 / red = 2011
46
Change Detection Settlement
Patterns

© Western Cape Government 2013| MinMay June 2016
Change detection green = 2012 / red = 2013
47
Change Detection Settlement
Patterns

© Western Cape Government 2013| MinMay June 2016 48
Change Detection Settlement
Density

© Western Cape Government 2013| MinMay June 2016 49
Change Detection Settlement
Density

© Western Cape Government 2013| MinMay June 2016 50
Change Detection Settlement
Density

© Western Cape Government 2013| MinMay June 2016 51
Change Detection Settlement
Density

BASIC SERVICES PROVISIONING
CURRENT TRUTH
ACCESS TO BASIC SERVICES
STATE OF SERVICES
CAPACITY / FUNDING GAP

© Western Cape Government 2012 |
Relative changes in dwelling type per Province
54
The period 2007 to 2011 saw a remarkable increase in the percentage of households living in informal type of dwellings in the Western Cape – and increased from 1996 base year. All other Provinces experienced a decline in percentage of households living in informal type dwellings (Northern Cape the exception with a 2.2% movement).
Source: Statistics SA, Census 2011 Provinces at a Glance. Report No. 03-01-43

© Western Cape Government 2012 |
Percentage of Households living in informal dwellings by services they accessed, 2014
Access to Services in Informal Dwellings by service type
55
[Source: Stats SA: Report 03-18-06 (2002-2014), Released 2016

© Western Cape Government 2012 |
Water Resource Management
Strategic Overview
56
Natural Resource - 4 Catchments ¾ Deficits – Breede System
Shortfall in 15 municipalities – including high growth municipalities
75% HH in WC have access to water inside dwelling this increased from 67% in 2001
Only 9.2% of HHs in informal settlements have access to water inside dwelling, and
a further 41.5% have access to water on site or in yard, 47% have access to a public
tap
WC 2nd position with Blue Drop Status, but quality is declining

© Western Cape Government 2012 |
Sanitation
Strategic Overview
58
WWTWs under capacity in 9 municipalities
Including high growth municipalities
86% HH in WC have access to flush toilet connected to a sewerage
system - this increased from 81% in 2001
Only 64% of HHs in informal settlements have flush toilet connected to a
sewerage system
WC Green Drop Status improved
84.5% Provincial Green Drop Score
84.2% of plants (133 of 158) in low and medium risk positions.
9 number of Wastewater Systems with <30% score
Significant shortfall – conventional service delivery [1:1 provisioning] for
infrastructure only @ R1.45 bn / and for approx. 174000 unserviced
dwellings [Relocation and operating budget deficits significant under this
scenario]

© Western Cape Government 2012 |
Refuse Removal / Solid Waste
Strategic Overview
60
Landfill sites under severe pressure – cost of compliance
R1 bn (excl CoCT)
Including high growth municipalities – crisis
89% HH in WC have access to refuse removal at least
once a week - this increased from 87% in 2001
Waste minimisation statistics fluctuations
Tariff structure deficits
No more landfill for sewerage sludge

© Western Cape Government 2012 |
OUTCOMES
Readiness for Growth = Complex
Brings with it the Opportunities relating to service delivery
62
• Innovation Capital = Need infrastructure plans, institutional, financial and human
capacity – How Urbanisation Happens Matters! We cannot continue to allocate
the same space, volume of water, KWh of dirty electricity and volume of landfill air
space per person/HH as we have in the past.
• Differentiated Approach = Infrastructure demands not just quantitative, also qualities, use-value and affordability of infrastructure, and for whom
• Improvement in the world must be highly contextualised & Fit for purpose = Demands change over time: changing economic, social and technical demands
and requirements.
• Whole of Society = Entire societal response to urbanisation required
• Unlikely that allocations to the Province will increase (immediate & short term)
• Liberate & coordinate data & link data to design at detailed level

© Western Cape Government 2012 |
Urbanisation = Key for Basic service delivery challenges
to be turned into significant opportunities!
1st next 5 years : Readiness for new IDP Cycle
- Partnership – Joint solutions
- Transversal Management & Joint Planning at different levels / Integrated
Management Systems
- Joint Prioritisation & Joint action plan
“Smart, enabling & responsive 4th Generation IDPs takes the Province forward
during the next five years”
Perceptions Driving Policy Decisions
Different Thinking – Applied Innovation
Socio-economic Transformation
Social – Ecological- Transformation
WE CAN DO IT ‘THE BEST’ - TOGETHER!
Mahalia Jackson, who shouted behind
him, "Tell them about the dream!"[

Thank You
88

Tel: Fax:
www.westerncape.gov.za
Contact Us
Helena Jacobs
Development Planning Intelligence Management & Research
+27 (0)21 483 5167 +27 (0)21 483 4527


