62
Boldly Know: York Region’s Enterprise GIS URISA ESIG Award Application Page 1 URISA ESIG APPLICATION 2015: BOLDLY KNOW YORK REGION’S ENTERPRISE GIS

Boldly Know: York Region’s Enterprise GIS URISA ESIG Award Application
Page 1
URISA ESIG APPLICATION 2015:
BOLDLY KNOW
YORK REGION’S ENTERPRISE GIS

Boldly Know: York Region’s Enterprise GIS URISA ESIG Award Application
Page 2
CONTENTS
A. System ....................................................................................................................................................................... 3 A.1. Name of system and ESIG™ category ................................................................................................................. 3 A.2. Letter from Executive Administrator (attached) ................................................................................................ 3 A.3. System Summary ................................................................................................................................................ 6 A.4. User Testimonials ............................................................................................................................................. 11
B. Jurisdiction ............................................................................................................................................................... 17 C. System Design .......................................................................................................................................................... 18
C.1. Motivation for System Development ........................................................................................................... 18 C.2. Services Intended to Be Improved By the System ........................................................................................ 18
C.2.1 2012 GISB Strategic Plan ................................................................................................................... 21 C.3. Unexpected Benefits .................................................................................................................................... 23 C.4. System Design Problems Encountered ......................................................................................................... 24
C.4.1. No Real Roadmap .............................................................................................................................. 24 C.4.2. Jenga GIS ........................................................................................................................................... 24 C.4.3. Capacity ............................................................................................................................................. 24 C.4.4. Information Policy ............................................................................................................................. 25
C.5. System’s Differentiation from Similar Systems ............................................................................................ 25 D. Implementation ....................................................................................................................................................... 29
D.1. Phases of the System’s Development .......................................................................................................... 29 D.1.1. Regional Leadership .......................................................................................................................... 29 D.1.2. Best Practices .................................................................................................................................... 29 D.1.3. GIS Maturity Model ........................................................................................................................... 30 D.1.4. Policy Framework .............................................................................................................................. 30 D.1.5. Development Approach .................................................................................................................... 31 D.1.6. Case Study 1. All Pipes ....................................................................................................................... 31 D.1.7. Case Study 2. York Region OrthoPhoto Sharing Project ............................................................... 34 D.1.8. Case Study 3. YorkInfo Partnership ................................................................................................... 35
D.2. Modifications to Original System Design ..................................................................................................... 36 D.2.1 Coming Soon: Property Management System .................................................................................. 36
E. Organizational Impact .............................................................................................................................................. 38 E.1. User Community Served by System .............................................................................................................. 38 E.2. Decisions/Operations/Services Affected ...................................................................................................... 39 E.3. Quantitative and Qualitative Impacts of System .......................................................................................... 45
E.3.1. Case Study 1. All Pipes ....................................................................................................................... 45 E.3.2. Case Study 2. York Region OrthoPhoto Sharing ............................................................................... 45 E.3.3. Case Study 3. YorkInfo Partnership ................................................................................................... 46 E.3.4. Other: YorkMaps Leveraged for York Regional Police ....................................................................... 47
E.4. Effect of System on Productivity ................................................................................................................... 47 E.5. Other Impacts ............................................................................................................................................... 48
E.5.1. Capacity Building - Data, GIS and Analytics “Muscle” ....................................................................... 48 E.5.2. Measurement Culture ....................................................................................................................... 50 E.5.3. Open Data = New Opportunity .......................................................................................................... 50 E.5.4. Awards and Recognition .................................................................................................................... 51
E.6. Changes to Business and/or Service Delivery ............................................................................................... 51 E.6.1. Change: Self serve ............................................................................................................................. 51 E.6.2. Change: Self Serve for Consultants ................................................................................................... 52 E.6.3. Change: “Explosion” of Public Facing Map-Based Services ............................................................... 52

Boldly Know: York Region’s Enterprise GIS URISA ESIG Award Application
Page 3
E.6.4. Change: Real time maintenance of data through business processes .............................................. 53 E.6.5. Change: Easy Access to Property Information and ReportinG .......................................................... 53 E.6.6. Change: the Rise of Analytics ............................................................................................................ 54
F. System Resources .................................................................................................................................................... 56 F.1. System’s Primary Hardware Components .................................................................................................... 56
F.1.1 High Level System Architecture ......................................................................................................... 56 F.2. System’s Primary Software Components ...................................................................................................... 57 F.3. Data the System Works With ........................................................................................................................ 60
F.3.1. Joint Purchase of Teranet Data with Six Local Municipalities ........................................................... 60 F.4. Staff Resources to Implement System .......................................................................................................... 61 F.5. Unusual Resourcing Facets of System’s Development ................................................................................. 62
F.5.1. Local Municipalities ........................................................................................................................... 62 F.5.2. Several Projects in One ...................................................................................................................... 62
A. SYSTEM
A.1. NAME OF SYSTEM AND ESIG™ CATEGORY
Name:
Boldly Know: York Region’s Enterprise GIS
Category:
Enterprise Systems
A.2. LETTER FROM EXECUTIVE ADMINISTRATOR

Boldly Know: York Region’s Enterprise GIS URISA ESIG Award Application
Page 4

Boldly Know: York Region’s Enterprise GIS URISA ESIG Award Application
Page 5

Boldly Know: York Region’s Enterprise GIS URISA ESIG Award Application
Page 6
A.3. SYSTEM SUMMARY
Boldly Know. It’s a good way to describe our region’s Enterprise GIS. Confidence in decision-making made possible
through having the right data, the right tools, and the know-how.
This award application will outline how we got there from a technical and management perspective, touch on the
many components of our enterprise solution, and provide a brief look at what the future holds. It has been a
journey to Enterprise GIS, and each time the reach expanded or the system criticality raised, a story was born with
lessons learned and strategic insight gained. We leverage from what we have done – so implementing new
solutions gets easier and faster.
First though, it’s important to describe how York Region “fits” in Ontario’s municipal landscape. Our region sits
immediately north of Toronto, the province’s economic and cultural engine. York Region is part of a two-tier
municipal system, meaning that it is comprised of nine local municipalities, each with its own elected governments
and set of service delivery responsibilities. Some services are delivered at the regional level (like emergency
medical services and police), some at the local level (like taxation and recreation), and some services are shared
(like water delivery and wastewater conveyance). From an Enterprise GIS perspective, you can probably see how
this provides great opportunity for innovation.
York Region is comprised of 1,776 square
kilometres, extending from the City of Toronto in
the south, Lake Simcoe in the north, Durham
Region in the east and Peel Region and Simcoe
County in the west. As of March 2015, York
Region had approximately 1,152,500 residents
and in 2014 there were an estimated, 31,408
businesses and 564,600 jobs.
York Region has a two-tier government structure
with services provided by the Region and local
municipal governments. The Region (York Region
and the Local Municipalities) collectively provide
services for residents and businesses that include
transportation infrastructure, public transit,
water, wastewater, solid waste management,
policing, emergency services, human services and
planning services.

Boldly Know: York Region’s Enterprise GIS URISA ESIG Award Application
Page 7
In several ways, we’re at level “five” (the top) of URISA’s GIS Maturity Model. Even so, we’re not slowing down in
pushing forward with new applications, data and the introduction of new technology and capability. The team is
driven by a professional calling to do whatever can be done. And we are being recognized for it beyond customer
feedback and appreciation - through awards, speaking engagements, and frequent delegations from other
municipalities.
The Regional Municipality of York’s GIS has become a ubiquitous part of the Region’s business planning and
delivery, a trusted source of information for staff and partners, and a vital tool at both the organization’s
operational and decision-making levels.
Along with “traditional” uses in planning, engineering and development, maps and map-based analysis are
becoming increasingly integrated within police work, public health policy and environmental stewardship. The
Region’s Enterprise GIS is helping staff boldly know. They review and decide with confidence, collaborate with
colleagues and partners, know more and do more. It’s encountered in a computer, but its effect is felt throughout
the programs and services being delivered by the Region and its partners through information, mapping and
analytics.
The Enterprise GIS consists of:
Data: Over 650 map layers plus associated business data and information.
Our data “challenge” grows, as it would in any organization. Currently York Region has: 1180 databases (480
production), 25 TB storage space, and 60 servers. In 2014, the Region had 229 Million records – 183 Electronic and
46 Million Physical, a 12% increase over 2012. Estimates indicate that by 2019 there will be approximately 538.0 M
electronic records or 163,437 records per staff person. We have over 19,000 scanned development plans, including
Registered Plans, Reference Plans and Draft Subdivision Plans.
Sensor data is contributing to a data explosion. Traffic cameras, GPS data from vehicles, weather stations, SCADA,
smart meters or others constantly add to our data repositories. York Region’s SCADA (Supervisory Control and
Data Acquisition system) produces more than 33 million records per day or roughly 12 billion records per year from
160 facilities.
It is estimated that 80% of all structured data collected by the municipal government is associated with a location.
York Region’s services: policing, transit, roads, traffic, water, waste water, health clinics, paramedic, recreation,
land development, garbage and recycling are all tied to an address or location. Much of this data is collected as
change happens; for example, receiving survey plans for a road widening or a subdivision application. In other
instances the data is collected for monitoring systems via sensors in the pavement, from equipment transmitting
locations and from sensors gathering real time data to control equipment associated with the water and
wastewater systems. This “data exhaust” – the product of business operations – is vital to the business, and can be
of significant value to other departments, partners, and the public.
Not everything is homemade. The Region also purchases or licenses location-based data to support program
planning and service delivery such as: geo-demographic and psychographic data, aerial photography, ownership
and property and assessment data.

Boldly Know: York Region’s Enterprise GIS URISA ESIG Award Application
Page 8
Applications:
YorkMaps.ca: (internal and external – see list)
Public Access
o Business Directory
o Community Services
o Cycling
o Land Information
o Recreation and Culture
o Source Water Protection
Secure Access
o All Pipes
o Common Operating Picture
o Community Information Project
o Development Infrastructure Planning
o Employment Survey
o Executive Viewer
o Fire Viewer
o Health Inspections
o Police Viewer
o Property Management
o Property Viewer
o Road Occupancy Permits
o Telecom
o Transportation Management
o Water Consumption
o Water/Wastewater
Common Viewer: (public)
Web mapping applications hosted on behalf of local municipalities E.g. The Town of East Gwillimbury
Open Data http://York.ca/opendata: (public)
York Region’s Open Data Portal
Data Discovery http://findit.york.ca/search/portal/#/search: (public)
York Region’s public metadata catalogue for spatial data listings
York Online Data Access (YODA): (internal)
York Region’s searchable registry (internal) of data holdings
ArcGIS Online: (public)
Centres and Corridors
Community Demonstration Gardens
Early Development Instrument
Food For Learning

Boldly Know: York Region’s Enterprise GIS URISA ESIG Award Application
Page 9
Lake to Lake Cycling Route and Walking Trail
Make Rental Happen
Regional Roads
Many other internal applications
York.ca Mashups (public):
40+ Google Map embedded throughout York.ca to provide location and driving directions to services the
Region provides. E.g. Solid Waste Drop off Depots
Beach water testing results
Clip, Zip and Ship (external, requires secure access):
24*7 access to data for partners and consultants
GIS Systems Integrations (internal):
CityWorks – computerized work management system for Roads operations
Maximo – computerized work management system for Water/wastewater operations
Street Tree application – street tree inventory and condition field application
Trapeze – fixed route bus scheduling and routing
INIT – Bus AVL operations control
RouteMatch – On-demand paratransit scheduling and routing application
IPACS – sewer use bylaw enforcement
InfoWater and InfoSewer – hydraulic modelling of water/wastewater systems
Police and Fire Dispatch:
Versaterm
Pending GIS integrations (internal)
Archibus – facility management system for regional owned and leased facilities
Salesforce – Constituent Relationship Management
Technology: Our technology platforms include much of the latest state-of-the-art software which supports mobile
devices and AODA (Accessibility for Ontarians with Disabilities Act) legislation from vendors like Esri, Safe Software,
Azteca Systems, Latitude Geographics, Voyager Search and more. The infrastructure is managed and maintained in
house (with the exception of the online web application and data services we consume such as ArcGIS Online,
Bing, Google, Teranet and others).
People and Policy: This submission will highlight more than the technology achievement, it will also include several
aspects of how the Enterprise GIS at York Region:
a) Is aligned with corporate strategy, and how the Region’s GIS takes its operational lead from the
organization’s 2015 to 2019 Strategic Plan: From Vision to Results.
b) Is having a positive influence on the private sector:
o Influencing product and services direction; investment; and growth.
o Enriching commercial data; and, leading to the Region being seen as a trusted source of the
truth.
c) Is the product of a core team of passionate and professional staff.

Boldly Know: York Region’s Enterprise GIS URISA ESIG Award Application
Page 10
d) Is built on collaboration and partnership with our local municipalities, other agencies, local business.
Our Enterprise GIS is enabling us to boldly know, helping create a municipal government that is engaged with its
community – anticipating program and service needs of its citizens.

Boldly Know: York Region’s Enterprise GIS URISA ESIG Award Application
Page 11
A.4. USER TESTIMONIALS

Boldly Know: York Region’s Enterprise GIS URISA ESIG Award Application
Page 12

Boldly Know: York Region’s Enterprise GIS URISA ESIG Award Application
Page 13

Boldly Know: York Region’s Enterprise GIS URISA ESIG Award Application
Page 14

Boldly Know: York Region’s Enterprise GIS URISA ESIG Award Application
Page 15

Boldly Know: York Region’s Enterprise GIS URISA ESIG Award Application
Page 16

Boldly Know: York Region’s Enterprise GIS URISA ESIG Award Application
Page 17
B. JURISDICTION
1. Name of jurisdiction:
The Regional Municipality of York
2. Population Served by the Organization:
1,152,500 residents. York Region is one of the fastest growing communities in Canada. Its population exceeded the
million person mark in 2011 and is expected to surpass 1.5 million by 2031.
3. Annual Total Budget for Jurisdiction:
Operating $1.9 billion
Capital $0.826 billion
Total $2.726 billion
4. Chief Elected Official:
Wayne Emmerson
York Region Chairman and Chief Executive Officer
The Regional Municipality of York
17250 Yonge Street, Newmarket, ON L3Y 6Z1
5. System Contact Information:
John Houweling
Director, Geographic Information Services
Geographic Information Services Branch | Corporate Services Department
The Regional Municipality of York
17250 Yonge Street, Newmarket, ON L3Y 6Z1
T: 905-830-4444 x 71529
Toll Free: 1-877-464-9675

Boldly Know: York Region’s Enterprise GIS URISA ESIG Award Application
Page 18
C. SYSTEM DESIGN
C.1. MOTIVATION FOR SYSTEM DEVELOPMENT
Internally, our motivation was and is service excellence. We’re passionate about staying in the forefront of GIS,
Data Management, Open Government and in trying to anticipate the business requirements of our regional
customers. We’ve embraced mobile computing, putting tools and capabilities into the hands of municipal workers
in the field, and supporting an increasingly mobile-dependent public. We’ve established open data policies and
then made sure they actually deliver meaningful data in a meaningful way so that more business can be supported
and new ones developed. We leverage partnerships with our local municipalities, school boards and conservation
authorities to establish common business processes and data standards so that data are collected once at the
source but then used to support a variety of needs.
Data drives decision-making. Maps bring data to life. Being able to access, use, integrate and manage data through
tools and solutions that incorporate GIS analytics and mapping leads to improved decisions and better business
processes. This is our Enterprise GIS paradigm that enables staff and customers to Boldly Know.
Externally, the motivation was managed growth. There was recognition from regional leadership that the rapid
growth of the region and its businesses and people into the cities and towns needed to be supported with expert
planning, programs and services. GIS was recognized as a key tool to support that.
Further, many local municipalities were investing in GIS and were at varying levels of GIS maturity. The gap was
only going to widen between those who had invested significantly and those who had not and could not. A GIS
partnership was formed to encourage everyone to work together to ensure that we wouldn’t end up with a
maturing and increasingly expensive patchwork of data standards, capabilities and supporting systems within the
region.
The Enterprise GIS applications we’ve built – such as All Pipes (which is discussed in more detail later) – have
specific motivators or business drivers.
C.2. SERVICES INTENDED TO BE IMPROVED BY THE SYSTEM
When users have better data, and better access to data; when we provide the tools to use the data; and, when our
customers and partners know how to use those tools and manipulate the data, everything improves.
Finding and accessing data is central to the delivery of virtually any regional service. Being able to separate the
noteworthy from the “not worthy” data makes the service that much more valuable.
Enabling the use and analysis of data and its clear presentation builds understanding and supports decision-
making.
Building GIS capacity through training, partnership and policy throughout the region builds confidence and
capability.

Boldly Know: York Region’s Enterprise GIS URISA ESIG Award Application
Page 19
Creating connections: Our organization has experienced sustained managed growth since its formation in 1971.
Each department was focused on service delivery to meet the demands of growth. This limited the time available
to manage information suitable for use for other programs. This also leads to the problems of not knowing what
data exists, not knowing what’s right (when data are being duplicated), and not experiencing the cost and time
savings associated with sharing.
The Region’s response has been to recognize it, through York Online Data Access program along with new policies
that support data sharing (like the Region’s recent Information Accountability and Sharing Policy); and, through an
increased awareness of the value of accessible data made “real” through the Enterprise GIS. Data is now regarded
as, and stated as being a corporate asset.
To illustrate the issue and why it was important to resolve, we did a staff survey about the data they needed and
used, and received over 400 responses. Some staff didn’t know what data the Region collected or purchased.
About one third of them are missing some data they need; more than half didn’t know who to contact to get the
data; and, 80 percent felt they have data that others would value.
If staff don’t know what data is available, they may use data that is not current, is inaccurate, or is at odds with the
“official” source. But staff who know what data exist make fewer errors; and, save time, money and potentially
embarrassment.
Figure 1. Infographic from our staff survey
By enabling staff to know what data is available and helping them access it, the Enterprise GIS makes a significant
impact on service delivery within all departments.

Boldly Know: York Region’s Enterprise GIS URISA ESIG Award Application
Page 20
HOW are staff finding and accessing data? That’s often being done through a new data registry application called
“YODA” (York’s Online Data Access) that we built. It is an online internal catalogue/inventory of the Region’s data
assets. YODA manages the information about each of our data holdings such as the name, description and contact
information. If a staff person searches and finds a data set they want access to, the tool creates an email to the
data steward which they can then edit and send. These are not just GIS datasets, but also non-spatial databases,
reports, spreadsheets and other analysis.

Boldly Know: York Region’s Enterprise GIS URISA ESIG Award Application
Page 21
Figure 2 Results page from a YODA Search
C.2.1 2012 GISB STRATEGIC PLAN
Although organic and opportunistic growth does happen, particularly now in the more “mature” state of the
Enterprise GIS, this isn’t typically how we work. Nor are we just an organization that responds to data, map and
analysis requests from customers. In early 2012, our Branch did a direction review. Taking our cues from the
recently completed Regional Strategic Plan (From Vision to Results: 2011 to 2015 Strategic Plan), we modeled an
approach that addressed the goals of the region from the perspective of data, spatial technology and capability.
We hired a consultant to detail our current state and strengths at that time, and we met with stakeholders,
partners and customers to formulate a way forward. The consultant’s review was very positive, indicating among
other things that at that time we were at the “centralized” and “integrated” levels (levels 3 and 4) of the URISA
maturity model with a hockey stick growth projected over the coming years.

Boldly Know: York Region’s Enterprise GIS URISA ESIG Award Application
Page 22
Figure 3 - Consultant's View of GISB in 2011
Our goal was to achieve the Enterprise level and its many benefits, like:
Integrated business information.
Less time / effort to access information.
Self-service and 24/7 on any device.
Cost savings through better data management and reduced duplication.
Aligns with regional strategic plan.
Improved: situational awareness and asset management.
Available anywhere.
Personalized and collaborative.
Data managed at source.
Operational Integration with IT.
Our completed strategy had seven broad goals that have formed the basis for
our work over the past three years and continue to do so:
1. Respond Strategically: not only do things right, but do the right
things, with an eye to the Region’s “From Vision to Results: 2011 to
2015 Strategic Plan”
2. Enterprise GIS: give all staff across the Region seamless use of and
access to geospatial data, tools and services supporting their
various workflows while making it easier for them to see
relationships in their data, produce information products, and
more confidently and quickly make decisions.
3. Partnerships: use and expand our relationships to go beyond data
sharing agreements to build capacity and share the Enterprise GIS
benefits. Do more with less, in a time of fiscal constraint.
4. Spatial Data: become the source of the truth; develop/promote
standards; enable access; and, eliminate duplication of effort in
business processes. (Easy!)

Boldly Know: York Region’s Enterprise GIS URISA ESIG Award Application
Page 23
5. GIS Capacity: put GIS tools into the hands of users; build capacity throughout the region.
6. Fiscal Sustainability: continue to meet customer needs while demonstrating broader corporate value.
7. Maintain Core Activities: remain the spatial data stewards and architects of the region’s GIS.
C.3. UNEXPECTED BENEFITS
One of the great “unexpected” benefits is that so many other new systems, ideas and business processes are now
more possible because they can leverage the data, tools, infrastructure of the Enterprise GIS. Without the
Enterprise GIS, new corporate applications like All Pipes would have been prohibitively expensive and time-
consuming to build. Our YorkMaps web maps service continues to spawn new applications for different customers.
New corporate applications are much more feasible because they can leverage the underlying data, data
management architecture, technology architecture, analytics and reporting.
Emergency Management. Emergency planners use a common operating picture system that we deployed to
enable the coordination of emergency response and recovery actions across jurisdictions and organizations. The
common operating picture provides situational awareness allowing for a stronger geographic understanding of
incidents and event associated with an emergency. The system uses the YorkMaps web mapping platform so that
in an emergency staff interact with the familiar map interface that they use in their daily business.
Leadership. We’ve had significant interest from other jurisdictions in our solution and how we’ve accomplished
what we have. Several “delegations” from municipalities in Ontario have visited York Region over the past year.
Data Quality. Making data searchable and available tends to compel program managers to look more seriously at
their data and ensure it is current, accurate and useable to others.
Trusted Source. Having trusted data of quality creates opportunities. For example, our roads, addresses and
parcels data are provided to commercial data suppliers such as TomTom, and the data is used in consumer
mapping products such as Google Maps. For the majority of people that use Google Maps to find and navigate to
places in York Region, we help assure their success. The roads, addresses and parcel data is updated weekly. And,
we’ve become a “trusted source”.
For a government organization like ours, the “intangible” benefits, are quite important. These include:
Increased goodwill and satisfaction in the information products and services being provided.
Increased convenience through improved access to information and related services.
Increased transparency leading to greater trust in the process and decisions.
Increased situational awareness and better understanding of who’s doing what where.
Improved public health and safety through better communications, and information access.
Increased accountability and clarity in decision-making.
Improved compliance through data standards, improved processes, and
Increased trust through partnership.

Boldly Know: York Region’s Enterprise GIS URISA ESIG Award Application
Page 24
C.4. SYSTEM DESIGN PROBLEMS ENCOUNTERED
C.4.1. KEEPING THE BACKPLANE OUT FRONT
One of the principles quietly engrained in every annual work plan was to complete projects that kept the
‘backplane out front’. Whether this be data, technology infrastructure or applications, we knew that if we stayed
at least one step ahead of business needs, we would be able to exceed expectations. Why? Because the
foundation for the solutions was in-place. Examples include deploying an address validation service and hybrid
geocoding service for CRM. Another is implementing high-availability server architecture for 24x7
water/wastewater plant operations.
Another good example of being ‘one step ahead’ is that in two separate cases we worked directly with private
sector companies (Voyager Search and Latitude Geographics’ Geocortex Essentials ) to help them update their
software to better meet our anticipated needs – and, by extension, the needs of their other customers – for data
access and publishing (the specifics are outlined below in the next section.)
C.4.2. JENGA GIS
The GIS Branch’s funding comes largely from the Regional operating departments (Environmental Services,
Transportation Services and Community and Health Services) and their programs (our primary customers). Their
needs are usually more immediate, like a map for Council, or an analysis for a report. So the branch, which had
corporate / enterprise GIS aspirations, had to constantly deal with what one of our team called Jenga GIS –
balancing the creation of a corporate GIS while meeting the departments’ operational needs. Although we were
transparent and even occasionally had to negotiate a later start date with good reason, all supported the balance
we were achieving through projects that benefitted all, and projects that benefitted a specific program.
C.4.3. CAPACITY
Not all our local municipal partners are equally invested in GIS. Some have the GIS capability characteristics typical
of a small tax base and rural environment, while others have the GIS capability characteristics supported by more
an urban/suburban populous. Our YorkInfo Partnership supports every partner in different ways to build internal
capability and local capacity to support and use the GIS. As part of the information supply chain, many regional
programs, such as community planning, rely on the quality supply of information. Information management
strength at the local municipal level and regional level is the target of our capacity building efforts.
Our YorkMaps application (www.yorkmaps.ca) is a great example of this. After building YorkMaps, we offered to
host other “YorkMaps” sites that we’ve named “common viewer” for any of our partner municipalities who didn’t
have the capacity for web mapping.
Those who accepted the offer now have a pretty sophisticated web GIS with their city / town name on the header
and their data in the map, with very little investment in time / effort or money. This East Gwillimbury application is
one such example: http://ww4.yorkmaps.ca/CommonViewer/CommunityServices_EG/index.html The software is
run, managed and maintained by York Region, and the data “toppings” are the Town’s , but the interface looks like
it’s part of the Town’s web site. Similarly, those with the know-how and GIS infrastructure were offered the
YorkMaps code to host within their own environment.

Boldly Know: York Region’s Enterprise GIS URISA ESIG Award Application
Page 25
C.4.4. INFORMATION POLICY
Like many organizations (public or otherwise), the Region did not have a data
sharing policy framework in place to convey the principle that data is a corporate
asset. Such a policy is needed to reduce duplication and help ensure the
organization uses trusted data in business operations. Some departments had
barriers to accessing the data. While these barriers were usually unintended,
without the access policy there was little incentive or recognition of the priority to
open things up.
The Enterprise GIS demonstrated the value of how integrated data is more
meaningful. This has led to a positive sharing and access environment for GIS data
that has been extended to our Open Data initiative and the York’s Online Data
Access service. Corporate coordination is a strength of ours that has been critical to
Enterprise GIS, Open Data, and the York’s Online Data Access program.
C.5. SYSTEM’S DIFFERENTIATION FROM SIMILAR SYSTEMS
Scale. The York Enterprise GIS is massively integrated with access into business systems and databases and a
spatial database consisting of over 650 maintained data layers including parcels, addresses, roads, water network,
road network, and complete historical imagery from 2014 all the way back to 1970 (the year before the Region was
formed!) The solution touches every business line in the Region as shown in the word cloud below.
Figure 4. Word cloud generated by the data registry system that documents the region’s data holdings.

Boldly Know: York Region’s Enterprise GIS URISA ESIG Award Application
Page 26
Partnership. The YorkInfo Partnership has supported the Enterprise GIS by enabling us to build capacity in public
sector organizations across the region, put in place data standards for key business processes, and generate a
culture of data openness and sharing. Over 90 spatial data layers in our geodatabase are provided to partners,
eliminating the need for them to invest their resources to create and maintain base data. In turn, partners provide
the Region with data collected through local business processes.
Figure 5. A graphic showing our YorkInfo Partnership partners. Several of these partners would not otherwise have been able to invest in
their own GIS programs and technology.
The partnership builds capacity – dozens of training seminars and courses have been offered, for free, throughout
the partnership.
The partnership shares applications – several examples of which are outlined in this document.
The partnership gets pretty technical too, with some members sharing code (Flex applications, Geocortex
Essentials, Google Maps API mashups). We also have setup technical sessions to talk “geek” around things such as
web mapping; and we host an ArcGIS Online users group to share code, tips and tricks and best practices.
Data as a Corporate Asset. As noted above, because of our new policy, the Open Data direction, and an Enterprise
GIS that makes access easy, data silos have now virtually disappeared and data are treated as a corporate asset.
Analytics. Many of our applications’ information products are dashboard-like and infinitely variable – so the user
can quickly tailor the end product to meet their analysis requirement. Many of these are available on the web and
work well on a mobile device – enabling access to data anywhere, any time.

Boldly Know: York Region’s Enterprise GIS URISA ESIG Award Application
Page 27
Figure 6 Public-facing dashboard example from our “InvestInYork.com” web site.
Our analytics are also extending well beyond maps because of the internal capacity we’ve built. We have a data
scientist on staff who is an expert at performing location-based data analysis and discovering spatial patterns and
correlations. For example, one surprising analysis was of water billing within the region. We expected to find that
houses with more people used more water. What instead we found was that two bigger factors are the age of the
house and total number of rooms. As a result of this information, we then used geo-demographics data to
determine where these houses were and better target water conservation marketing campaign.
Enhancements of Private Sector Software
We believe that internal business solutions are more likely to be a success if they embrace the user experience that
we experience in our personal lives. From Google Search to shopping on Amazon, the emphasis is on ease of use
for the user. GISB staff have worked directly with two software vendors - Voyager Search and Latitude
Geographics – to improve the user experience and build out functional capability into the core of their technology.
In other words, York Region’s GIS has driven change within these two highly popular commercial technologies.
Voyager Search is used in several Enterprise GIS applications including YODA; Open Data; Clip, Zip and Ship; and,
Data Discovery. We worked with Voyager to design their new shopping cart functionality that we use with both
Open Data and with Clip, Zip and Ship. Voyager saw our functional requirements as beneficial to their solution so
rather than doing a custom build we worked with them to incorporate it into their core. With the functionality now

Boldly Know: York Region’s Enterprise GIS URISA ESIG Award Application
Page 28
part of a core technology solution, it’s one less system for our staff to maintain and upgrade as technology
changes.
We worked with Latitude Geographics to enhance their highly popular GeoCortex Essentials and the HTML5
viewer for Essentials. We worked closely with Latitude on improvements to the core software (over 20
improvements to core functionality made) with a focus on the end user. Emphasis and efforts were placed on the
overall usability and user interface for both desktop and mobile. All current YorkMaps functionality is now part of
Latitude Geocortex and the HTML5 viewer. This will allow us to migrate our custom-built Flex app (Flex is no longer
supported by browsers) to a COTS (Commercial-off-the-Shelf) solution.
Another major component of our work with Latitude was building in support for the Accessibility for Ontarians
with Disabilities Act (AODA) legislation (WCAG 2.0 compliance). Based on a 2014 assessment of the marketplace,
no other commercial web mapping application supports AODA compliance. York Region worked directly with an
accessibility focus group comprised of people with various levels of ability to test and provide feedback to Latitude.
The feedback was used by Latitude and incorporated into the final product. This is now part of Latitude’s core
solution and as a result, customers in Ontario and any customer requiring WCAG 2.0 compliance can benefit by
having this capability available if they use the Latitude Geographics software.

Boldly Know: York Region’s Enterprise GIS URISA ESIG Award Application
Page 29
D. IMPLEMENTATION
D.1. PHASES OF THE SYSTEM ’S DEVELOPMENT
The Enterprise GIS has been an evolving presence in the Region. It began with Internet mapping in the late 1990’s,
serving maps to early web browsers from the Region’s home page. These early implementations were supported
by the federal government’s “GeoConnections” program, which helped fund some of the software and
applications development. The region was growing rapidly, several of the local municipalities were investing in and
implementing GIS solutions, and it was clear that the Region – with its broad responsibilities in areas like
infrastructure and planning – would need to work with the local municipalities’ GIS groups and data, or find itself
with a patchwork of regional GIS and expensive or technically challenging integration requirements, or significant
duplication of effort between governments.
Some of the region’s local municipalities like Markham in particular, were also investing in web-based GIS, long
before it was commonplace. Google Maps wouldn’t even exist for another six or seven years.
“Belief” in the Power of Maps. These early web-mapping solutions were as much map demonstrations as they
were business applications. Not everyone had figured out how maps could be used or why they might be
important to anything more than their “traditional” uses and the GIS team wanted to help people understand the
power of geography in communicating concepts and integrating information. The Region’s web-mapping system
created many converts both within the region and beyond, making the path forward much easier.
D.1.1. REGIONAL LEADERSHIP
Twenty years ago, the Regional created the Geomatics Branch (now Geographic Information Services Branch), with
a mandate to manage the spatial data infrastructure for the Region. Their leadership and foresight has led directly
to the Enterprise GIS of today.
The system continues to be strongly supported by Regional council and is being developed based on the priorities
set out in the GISB Multi-Year Action Plan 2012-15. That work plan is aligned with York Region’s corporate strategic
plan From Vision to Results: 2011 to 2015 Strategic Plan. The Branch’s plan sets out what we need to do to ensure
the data, technologies and services are there to help fulfill the Region’s vision. GIS data and technical capacity are
essential to supporting a wide and growing variety of enterprise initiatives.
The GIS team worked closely with Regional IT to design and deliver the supporting technology and network
architectures.
D.1.2. BEST PRACTICES
We make a point of looking for and adopting best practices. For example, when nearby municipalities like the City
of Toronto started to aggressively pursue Open Data, and put a lot of data up on the web for download and use,
we looked at their solution, took what worked well, and added to it. As an example, our Open Data solution
extracts data for the user in real-time automatically. This offloads the burden of manually pushing updates to the
Open Data site and avoids the situation where stale data is downloaded by users.
Boldly Know: York Region’s Enterprise GIS URISA ESIG Award Application
Page 30
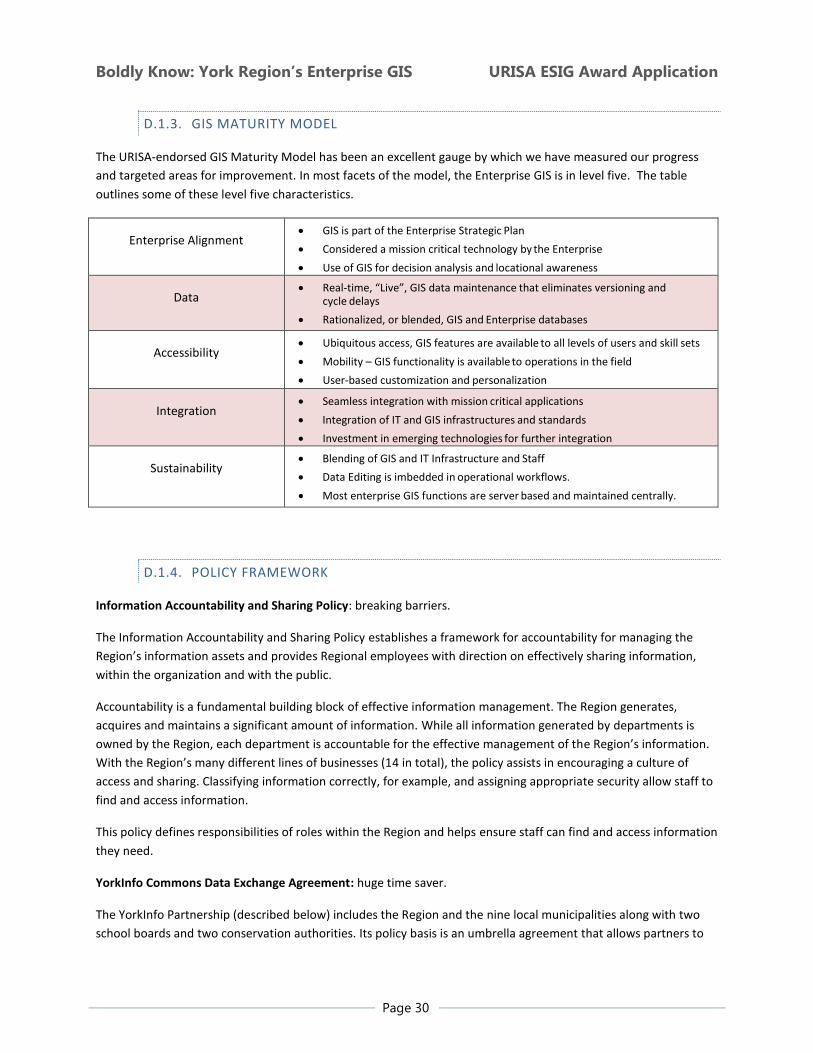
D.1.3. GIS MATURITY MODEL
The URISA-endorsed GIS Maturity Model has been an excellent gauge by which we have measured our progress
and targeted areas for improvement. In most facets of the model, the Enterprise GIS is in level five. The table
outlines some of these level five characteristics.
Enterprise Alignment GIS is part of the Enterprise Strategic Plan
Considered a mission critical technology by the Enterprise
Use of GIS for decision analysis and locational awareness
Data Real-time, “Live”, GIS data maintenance that eliminates versioning and
cycle delays
Rationalized, or blended, GIS and Enterprise databases
Virtual databases with live external and internal data. Accessibility
Ubiquitous access, GIS features are available to all levels of users and skill sets
Mobility – GIS functionality is available to operations in the field
User-based customization and personalization
Integration Seamless integration with mission critical applications
Integration of IT and GIS infrastructures and standards
Investment in emerging technologies for further integration
Sustainability Blending of GIS and IT Infrastructure and Staff
Data Editing is imbedded in operational workflows.
Most enterprise GIS functions are server based and maintained centrally.
D.1.4. POLICY FRAMEWORK
Information Accountability and Sharing Policy: breaking barriers.
The Information Accountability and Sharing Policy establishes a framework for accountability for managing the
Region’s information assets and provides Regional employees with direction on effectively sharing information,
within the organization and with the public.
Accountability is a fundamental building block of effective information management. The Region generates,
acquires and maintains a significant amount of information. While all information generated by departments is
owned by the Region, each department is accountable for the effective management of the Region’s information.
With the Region’s many different lines of businesses (14 in total), the policy assists in encouraging a culture of
access and sharing. Classifying information correctly, for example, and assigning appropriate security allow staff to
find and access information.
This policy defines responsibilities of roles within the Region and helps ensure staff can find and access information
they need.
YorkInfo Commons Data Exchange Agreement: huge time saver.
The YorkInfo Partnership (described below) includes the Region and the nine local municipalities along with two
school boards and two conservation authorities. Its policy basis is an umbrella agreement that allows partners to

Boldly Know: York Region’s Enterprise GIS URISA ESIG Award Application
Page 31
share data with one another. The agreement greatly reduces the hassle of having to sign a separate agreement
each time one partner wanted data from another – which used to be the case.
Not just GIS-related information, the agreement gives any member organization the rights to share their data with
others. Special circumstances for any particular dataset are addressed in a simple addendum.
D.1.5. DEVELOPMENT APPROACH
Although the Enterprise GIS has grown up somewhat organically based on strategic needs and leveraging
opportunities, many of the business systems that are part of it, follow a more structured and phased approach in
their development.
Phase 1. Involves establishing a thorough understanding and definition of the user needs. The data that are going
to be used, what aspects of the Enterprise GIS can be leveraged (e.g. YorkMaps, geocoding, etc.), and what outputs
are required. The end of Phase 1 is a sign-off by the customer for the system / project scope.
Phase 2. Our design phase is punctuated by prototypes. Showing the customer what the system will look like and
engages them and gives them something tangible to respond to quickly without too much investment. This phase
also involves the development of the data model and identification of any new data and potentially technology
requirements.
Phase 3. The development and testing phase will often use examples from real business needs to ensure the
system is responding as it should.
The final step is implementation and maintenance, in which the system goes live. This is followed by user training,
promotion, and post implementation meetings to ensure the solution meets expectations.
Each new application that we add has the potential of also providing more to the Enterprise GIS as a whole. And
everything starts to build on each other.
We’re building solutions much faster and with more confidence. With the key information policies in place
supporting access, openness, privacy and sharing, and most of the core tools developed to permit easy access and
publishing of data, the Enterprise GIS is in a period of mature growth, in which its data, information management,
and technology architectures can be leveraged to support new business-specific solutions requirements.
The following is a look at a few Enterprise GIS components that have made a significant contribution to the overall
success...
D.1.6. CASE STUDY 1. ALL PIPES
Issue: Management of the region’s water and wastewater infrastructure is a shared responsibility between the
local municipalities and York Region. So it’s imperative that each organization knows what’s underground, who
owns it, and what it does. Typically, the major arterial pipes entering, leaving and connecting the region are the
responsibility of York Region, while all the secondary system pipes are managed by each local municipality.
All the region’s residents and businesses rely on it daily. The management of a safe, effective water and
wastewater infrastructure is one of any municipal government’s most important roles.

Boldly Know: York Region’s Enterprise GIS URISA ESIG Award Application
Page 32
Because of our growth, significant investment in the infrastructure is expected to be required. A 2009 estimate
concluded water-wastewater projects would cost $4.8 billion to 2031 and $6.6 billion to 2051.
Prior to the All Pipes project, water and wastewater infrastructure (“all pipes”) data across the region had many
formats and standards. Data about the pipes’ position (spatially integrity) and their related information
(ownership, material type, etc.) varied in quality and completeness.
No common system or database existed. This meant operations / maintenance decision-making was often slow;
ownership and responsibility was sometimes at question; planning and modeling were more difficult; legislative
requirements were often negatively impacted; and, the entire system cost more.
Solution: The “All Pipes” database is a shared, common and maintained spatial database of the region’s water and
wastewater systems. The database is stored and hosted centrally and contains a core, common set of features and
attributes describing the water and wastewater network. Like transit and hydro, water/wastewater is a network
that transcends municipal boundaries. The All Pipes solution has resulted in an integrated database that reflects
the physical integration of the pipes and makes it easier for all the participants to plan, manage and maintain a
core municipal service.
The database provides all users a contiguous water and wastewater layer with a “minimal” set of attributes. It does
not replace the more comprehensive data captured and maintained locally. Specifically, the database contains
enough detail to support planning, emergency management and many other business and operational needs; and,
the establishment of “meet points” where regional and local pipes join to enable, among other things, easier
identification of asset ownership, and supports modeling, analysis and reporting.
Figure 7. All Pipes solution architecture
Essentially it:
a) Defines a core set of attributes (spatial and tabular) that appropriately describe the water / wastewater
pipe infrastructure.

Boldly Know: York Region’s Enterprise GIS URISA ESIG Award Application
Page 33
b) Incorporates an automated ETL (data manipulation – extract, transform, load) process for each local
municipality that enables the regional GIS team to accept local municipal data and automatically integrate
within a common regional “All Pipes” database.
c) Supports several business needs through easy access to the data for a variety of partners and regional
staff.
d) Continually evolves and improves as partners collect and make available more and more attributes.
Figure 8. All Pipes screen capture on mobile device
All Pipes is available to field staff on mobile devices, so staff are able to query and update the data from their job site. (The cover photo of the report shows a field worker with his tablet using the All Pipes system)
Benefits:
Enables Inflow and Infiltration reporting and analysis. Supports / enables a $25 million regional Inflow
and Infiltration project requiring a coordinated effort between local municipalities and the region.
Enables staff and contractors to quickly identify who owns what pipe when an unplanned repair situation
arises.
Improves regional hydraulic modeling and the ability to visualize and plan in pressure zones and across
boundaries.
Enables capital asset reporting.
Improves and helps clarify data and asset management accountability.
Improves water and wastewater GIS data quality and completeness.
Enables improved business efficiencies and decision support – e.g. water/wastewater flow monitoring;
quality assurance; mobile visualization; regional support.
Enables contractors to work more effectively with the region and local governments.
Improves water / wastewater GIS data access.
Eliminates asset data redundancy.

Boldly Know: York Region’s Enterprise GIS URISA ESIG Award Application
Page 34
Enables agreement on connection points from local to regional systems.
Provides pressure zone visualization / query capability.
Creates an agreed upon common data model for water / wastewater core attributes.
Creates a positive foundation for similar future initiatives - e.g., storm water data sharing; CCTV
integration; CAD standards; SCADA alerts.
From a Health and Safety perspective, the All Pipes database supports: emergency management planning and
response; downstream tracing and the identification of affected residents and businesses; upstream tracing for
point discharge and valve / main isolation; and well-head protection planning and visualization support.
D.1.7. CASE STUDY 2. YORK REGION ORTHOPHOTO SHARING PROJECT
Orthophotography (aerial imagery) is important, needs to be updated annually in a rapidly growing / changing
municipality, and is used in a variety of ways. Imagery supports almost all land use and program planning, and it
ensures the digital road network is sound and up-to-date.
Issue: One issue is cost. Annual or bi-annual renewals of orthophotography can be expensive. It would be too
expensive for York Region to acquire the data, and certainly too expensive for many of our local municipal
partners.
Another issue is technology. Maintaining and serving up a seamless, multi-year orthophoto imagery database takes
some specialized server technology and skilled staff. Local municipalities were able to use the seamless mosaic
produced by the Region for its Enterprise GIS program.
Solution: All YorkInfo Partners, including the nine local municipalities, two school boards and two conservation
authorities are cost sharing in the program. The Region then provides access to the imagery through the
Enterprise GIS tools and infrastructure. Costs for the orthophotography program are much more manageable
through a collaborative funding approach. Further financial returns become apparent once the data itself is
distributed.
Time, money and effort is saved because of the reduction in the number of required site inspections or field visits.
Regional and municipal employees have the opportunity to work in-house, doing pre-site visit inspections using
current orthophotography in conjunction with GIS-based software or on the public viewer on www.yorkmaps.ca.
The imagery now dates from 1970. Such a resource is an invaluable asset that can be used for monitoring growth
and sustainably planning for the future of York Region. For instance, historical imagery that shows whether or not
a structure is on a property at a specific time has helped police re-open cold cases and helped residents answer tax
claims.

Boldly Know: York Region’s Enterprise GIS URISA ESIG Award Application
Page 35
Figure 9. An area under development in 2002.
Figure 10. The same area in 2013. These images and image viewer are freely available at YorkMaps.ca
D.1.8. CASE STUDY 3. YORKINFO PARTNERSHIP
Twenty years ago, acquiring a GIS meant getting new skills, powerful computers and specialized software –
something a small municipality could not easily afford. Spatial (map) data in particular can be expensive to collect,
manage and maintain. The YorkInfo Partnership enabled the smaller municipalities (Town of Aurora, Town of East
Gwillimbury, Town of Georgina, Township of King, Town of Newmarket and Town of Whitchurch-Stouffville) to
build GIS capacity internally. Larger ones already using GIS (City of Markham, Town of Richmond Hill and City of
Vaughan) shared data and knowledge.

Boldly Know: York Region’s Enterprise GIS URISA ESIG Award Application
Page 36
Local school boards (York Catholic District and York Region District) were eager early participants. Students had to
be bussed throughout the rapidly growing region, and the boards needed data and mapping to do it. Conservation
Authorities joined to use the imagery, roads and parcel data as a reference framework for their environmental
information which they, in turn, gave the partnership for municipal planners to use.
Over the years, the partnership has created a culture of collaboration and has built “GIS muscle” across York
Region with each partner benefiting from easily accessible, common and accepted data; as well as training
sessions. It also reduces duplication through shared efforts and pooled resources, and improves information
management and technical capacity through the partnership’s training programs and by simply working together.
D.2. MODIFICATIONS TO ORIGINAL SYSTEM DESIGN
Our Enterprise GIS is the product of significant change, and change will continue. We deliberately took and
continue to take an incremental and opportunistic approach.
Much of the earlier system components that make up the enterprise, like transit routing, were standalone and less
integrated. Technologies such as FME (by Safe Software) made it possible to do more with the same number of
staff because, they made it possible to serve, access and use significantly more data.
To give an indication of the project scale, we are getting ready to launch our 5th
generation web map viewer.
Our next technical frontier is the cloud, to benefit from the inherent reliability and scalability that the cloud offers,
and potentially to save money / effort in our hardware and network infrastructure.
Our next applications challenge will be with our analytics – shifting from just providing business intelligence to
including predictive analysis so the user will be able to see what happened in the past, what is currently happening,
and soon, what’s going to happen as well. Being able to use data to predict, assumes that you really know the
business at an expert level and that some “predictions” are possible. We are looking at models and algorithms. The
focus of analytics has been more of a traditional BI approach – showing what our data are telling us. Our analytics
dashboard powered by Tableau are very effective, often with maps, charts, graphs, word cloud and other visuals
that enable the user to really probe multiple aspects of the data and visualize relationships.
We are also incorporating our locators and mapping capabilities into the Region’s CRM (customer resources
management) systems. The impact of mapping customers in relation to the services they receive will have broad-
reaching impact on service delivery effectiveness, reporting, and potentially cost savings.
D.2.1 COMING SOON: LAND TRANSACTION MANAGEMENT SYSTEM
The Land Transaction Management System is a good example of what’s ahead and made possible because of the
Enterprise GIS. The Region acquires properties on a regular basis as part of its infrastructure improvements in
transit, roads, delivery of water and wastewater, facilities, and others. Currently, each of the Region’s departments
or business processes captures new property information in separate documents or databases. Each has their own
business perspective and data requirement. For example,
Infrastructure Delivery deals with construction design, status and issues

Boldly Know: York Region’s Enterprise GIS URISA ESIG Award Application
Page 37
Property deals with real property inventory, ownership, leases, easements (temporary and permanent),
expropriation (including costs at various stages of the process) potential business claims and losses,
tenants, and other interests
Legal deals with claims and legal positions, associated litigation costs
Risk deals with known and unknown liabilities
Environmental deals with remediation position
Realty deals with financial transaction information, book and market values
Customer Service deals with complaints, comments, incidents, contact information
GIS deals with property ownership, relationship to property assessment data, addressing and location
analytics
Diligence deals with appraisals, geotechnical, historical, archaeological, zoning, official and site plans
(including amendments/variances), surveys, reference plans.
It is a challenge to assess the total financial position of a property or when the land acquisition process has
completed its legal, financial or environmental positions that relate to properties or a series of properties.
The land transaction management system will define a standard for land transaction data. The project will result in
a clear understanding of land assets as well as any liabilities with respect to land acquisition and disposition
transactions required to support infrastructure projects. Key characteristics include:
The system will provide data input tools for transactions, and reports on how much has been spent on a
property, its status, etc.
The system will support predictive analytics related to business loss claims on properties that have been
expropriated.
The system will support management reporting on the status of properties - what is owned by the Region
and which properties are being acquired for what projects, include easements to see where the Region
has the right of way.
The system will take the user through the whole process for property transactions and data management.
The Enterprise GIS infrastructure (data, system, and policy) has made this project possible to pursue.

Boldly Know: York Region’s Enterprise GIS URISA ESIG Award Application
Page 38
E. ORGANIZATIONAL IMPACT
E.1. USER COMMUNITY SERVED BY SYSTEM
The Enterprise GIS is multiple systems serving a diverse user community. Our diverse user community includes:
Regional (Internal). These are the multiple internal departments handling planning, social services and
more. They have experienced the most impact from the Enterprise GIS and continue to do so on a daily
basis in the course of their everyday work.
Local Municipalities. Share data and support the management of core (foundation) data; participate in
our GIS training / seminars; and, do much more (as indicated throughout the document).
Broader Public Sector (BPS). The BPS are partners, data contributors and users. Many participate in our
GIS training / seminars. Many use our data – without which they’d need to create on their own. By making
data available in formats that are readily usable, we help ensure the Enterprise GIS is the one source of
trusted data.
Academia. Teachers at several levels use our data for projects and they reference our web mapping
applications as examples in their classes. Our open data portal provides data to students for studies.
Non-Government Organizations. Many charities and NGOs use our online data to better understand their
communities and customer needs. For example, the United Way is a partner in the Community
Information Project, which will provide community information and demographic information through
our web mapping application.
Business / Investment Community. There are many ways that our Enterprise GIS serves this community.
The results that we publish from the annual business survey that we conduct using a mobile application
on tablets and devices helps local and non-local business identify investment opportunities, where
customers are, and where employment is.
Application Developers. Mobile app developers in particular use our data for smart phone applications.
This helps the Region as well because many of these apps would be too “niche” for us to develop, yet they
provide helpful information. For instance, a developer used our data to develop a “beaches” app –
providing data on beach openings / closings and water quality (in York Region and beyond).
Development Community. The Enterprise GIS makes it easy for us to support the development
community by providing almost all the land related data they need (except, of course, their site specific
studies). We’re currently building a five step process and data model to enable consultants to submit land
use and engineering related plans to automate their extraction into the GIS speeding up the review
process.
Commercial Data Suppliers.
o Data providers that are in the location business, like Nokia, TomTom, Esri rely on our data for
their database updates / road maps.
o Ontario One Call. The Region feeds the “call before you dig” service with some of the
infrastructure data that they need to be able to give the “all clear” with confidence.
Consumer-oriented mapping services
o Leveraging our Open Data program, companies like Apple, Google and Microsoft are notified of
the opportunity to improve their mapping products using our current and trusted data.
Public. Through open data and web mapping, the citizens of York Region and its visitors have a wealth of
usable information at their fingertips to help them make numerous decisions, for example beach water

Boldly Know: York Region’s Enterprise GIS URISA ESIG Award Application
Page 39
quality results; food establishment inspection information; and more. It’s supporting our goal of
government transparency.
E.2. DECISIONS/OPERATIONS/SERVICES AFFECTED
The following reflect only some of the many ways the Enterprise GIS is supporting decision-making in the region.
Public Transit
This map illustrated the difference in the GO Train (the Ontario commuter train system) capacity between York Region and Toronto when compared to GO’s east/west capacity. York Region is the white area to the north of Toronto. People from York Region aren’t getting into Toronto as easily as people from municipalities to the east or west of the city.
This means more cars on all the major north / south roads, more traffic congestion in Toronto, more time for people away from family, and all the other associated negative impacts on our economy and environment.
The map was used in a presentation to Metrolinx – the macro-regional transit agency – to help show the need for additional train services for the north-south corridor to improve transit for Markham and Whitchurch-Stouffville residents.
Employment Surveys
The region’s businesses were surveyed and the data brought together in the GIS and published through an interactive front-end on the web.
Now businesses within and outside the region have core employment and business support information at their fingertips, making business logistics decisions easier, and potentially much more informed.

Boldly Know: York Region’s Enterprise GIS URISA ESIG Award Application
Page 40
The business survey was completed using a mobile data capture device (e.g. tablets) as shown...
Data is collected and then validated in the system before being used in the analysis and visualization as shown above.
Crime Analysis and Response
This is an example of predictive analysis and how police can use the Enterprise GIS to generate maps of crime locations, and even start to predict where crimes might occur based on the hotspots and patterns visible.
The police have used this analysis to adjust their areas of focus and resourcing.

Boldly Know: York Region’s Enterprise GIS URISA ESIG Award Application
Page 41
Crime Reporting
Online mapping of publicly available crime statistics on the York Regional Police website (www.yrp.ca), to help empower people, enable them to easily provide anonymous tips, and help them feel safe.
“Knowledge is power”. So making the information available builds understanding of the neighbourhood, its dynamics and its relative safety.
Access to Health Services
Online listings and maps for health services to show proximity and how to access, along with program registration.

Boldly Know: York Region’s Enterprise GIS URISA ESIG Award Application
Page 42
Emergency Services
The operation centre of emergency services dispatch has routing and real-time location capabilities along with access to virtually all the information the staff need.
Infrastructure Asset Management
Our infrastructure management software – Cityworks – is able to leverage the extensive data available and provide engineers and planners unprecedented detail.

Boldly Know: York Region’s Enterprise GIS URISA ESIG Award Application
Page 43
Public Consultation
The GIS is supporting public consultations and public access to detailed information for broad multi-jurisdictional planning and decision-making as illustrated in this map of where our water comes from.
It illustrates nicely that even though there a big lake to the north, our water comes from groundwater sources or Lake Ontario to the south (other than a small part of our northern area) because of restrictions associated with moving water across watersheds.
Data Access – Open Data Portal
Our online, self-serve data portal gives the public fast access to a broad range of data in a variety of formats.

Boldly Know: York Region’s Enterprise GIS URISA ESIG Award Application
Page 44
External, but to partners only at this time, our data store mimics common user online shopping experiences with familiar “Add to Cart” buttons and product placements, making it easy to understand and use.
Upcoming phases will allow
consultants working on the Region’s
behalf to download project data.
Source Water Protection
The Source Water Protection viewer is a public facing tool to help landowners, real estate agents and developers see if their property is in a vulnerable area.
The viewer provides the user with a PDF report that they can provide with their development application to the Region or Municipality.
Real estate agents have saved customers time and money by being able to advise them to not purchase a property located in a vulnerable area since the land use the customer wants for the site would be prohibited.
Local municipalities use it as a screening tool to determine if there will be source protection implications for development applications.

Boldly Know: York Region’s Enterprise GIS URISA ESIG Award Application
Page 45
E.3. QUANTITATIVE AND QUALITATIVE IMPACTS OF SYSTEM
The ability to boldly know has both qualitative and quantitative benefits in every system we have introduced.
Perhaps the most profound benefit is that the Enterprise GIS has advanced the business of regional government.
The GIS Branch went from “doing” to “enabling.” Information sharing improved collaboration between programs
and among partners to improve outcomes. The transformation continues.
Below are some of the benefits from the Case Studies described above:
E.3.1. CASE STUDY 1. ALL PIPES
Qualitative Benefits
Helps the Region and local municipalities meet water- wastewater needs of the community.
Eliminates redundant efforts for merging regional content.
Provides an authoritative tool for visualizing assets across boundaries.
Minimizes redundant data requests to / from locals and the Region.
Helps to clearly identify the asset owner.
Improves reporting.
Helps protect health and human safety.
Supports capacity planning and the $billions to be spent over the next couple of decades on WW
infrastructure.
Quantitative Benefits
The All Pipes report “Connecting and Sharing the Region’s “All Pipes” Data – A Technical Proposal to Integrate
Local and Regional Pipes Data” anticipated the payback period to be 1.3 years from when the All Pipes first
became operational. The cost to implement was estimated at $750,000. Potential future costs savings / avoidance
was estimated to be $1.47 million by reducing duplication of tool development (Region and Local) such as a mobile
web application to view local and regional pipes data in the field.
Other savings not included in this analysis are the multiple consulting reports that would no longer be needed, but
in the past would have been generated for new pipe and infrastructure implementations – at an average cost of
$50,000 each.
E.3.2. CASE STUDY 2. YORK REGION ORTHOPHOTO SHARING
Qualitative Benefits
Up-to-date orthophotography is an essential tool to the Region, to the YorkInfo Partners, and to the York Regional
Police. It helps staff to make informed decisions in our rapidly changing region and is a useful aid in visualizing the
Region’s changing landscape.
Orthophotography is used to support operational decisions by reducing the need for site visits – confirmation of
encroachment complaints or zoning infractions, identification of rooftop equipment and being able to calculate the
area of a site.

Boldly Know: York Region’s Enterprise GIS URISA ESIG Award Application
Page 46
Orthophotography integrated directly into applications is becoming more frequent. York Regional Police uses the
orthophotography in their helicopter navigation system; identifying buildings and accurate addresses to guide the
ground patrol to the scene with little confusion.
It is accessible on a daily basis to the public through the Internet, enabling potentially countless applications.
There is also significant administration and contract management savings since the negotiation and delivery (legal
contract) is handled by one organization and one lawyer on behalf of 14 organizations.
Quantitative Benefits
As a result of the Region acquiring the orthophotography and digital elevation models under one contract for all
parties in the region, each of the partner’s cost for the orthophotography and the digital elevation model averaged
50% less than if they purchased the information independently from the vendor. The five year cost to the Region is
about $500K, so the savings to the partners would total about $250K.
E.3.3. CASE STUDY 3. YORKINFO PARTNERSHIP
Qualitative Benefits
Shared aerial imagery acquisition distributes costs across agencies. The partnership’s cost for aerial
imagery is half the cost of each partner acquiring it independently. Imagery provides a rich geographic
context for infrastructure, community and long range planning activities, emergency planning and
response, and public communication.
The partnership facilitates access to and sharing of data such as roads, parcels, and address points that
are core to several systems, service delivery, and business decision making.
It saves time, effort, and money by acquiring and providing aerial imagery used by planners, engineers,
local business and others.
Sharing core and thematic geographic information is a primary goal and benefit. Virtually all local and
regional services benefit from school bus routing, to health and social services delivery, to flood regulation
and much more.
Sharing data supports operations, projects and compliance. The partners share land use information to
enable official plan updates and amendments, facilitate appeals, and support local official plan conformity
exercises. Shared bike path data enables cyclists to plan routes and promote sustainable transportation.
Emergency management and response. Maps are essential to emergency events. In a cross-jurisdictional
emergency, IM professionals share information, analysis and maps between emergency operations
centres and emergency responders.
Figure 11. a 3D visualization example for density planning

Boldly Know: York Region’s Enterprise GIS URISA ESIG Award Application
Page 47
3D visualizations. 3D modeling of high density locations throughout the region being done by York Region
helps effectively communicate options to staff, council, consultants and the public. The partnership has
been sharing the know-how and components for 3D modeling and video production.
Quantitative
Through the workshops and training provided, in eight years, 375 program, planning and engineering staff from
the partner organizations have taken 72 courses, conservatively saving more than $130,000. These GISB-hosted
workshops and software training help partners to build technical capacity while exchanging insight and ideas with
their counterparts. They are provided at no cost.
E.3.4. OTHER: YORKMAPS LEVERAGED FOR YORK REGIONAL POLICE
York Region’s GISB assists York Regional Police Services with requests for mapping and analysis, and supports the
Police in the implementation of their GIS infrastructure. GISB recently collaborated closely with Police in order to
help support their Data Driven Approaches to Crime and Traffic Safety (DDACTS) program. York Regional Police and
GIS realized that many of the requirements for DDACTS could be met by YorkMaps.
We worked with the Police Service to install YorkMaps in their IT environment and to skin the application with the
Police banner and logo. We then pointed the application at crime and traffic data and configured several of the
out-of-the-box tools (heat maps and clustering) that weren’t currently being used within the YorkMaps
applications but available as core capabilities within the underlying software. The application was further
configured to make use of caches and map services that are already published and maintained by York Region. This
ensured we weren’t duplicating effort.
The resulting DDACTS YorkMaps system is used on a regular basis throughout the force to help bring the crime and
policing data to life.
E.4. EFFECT OF SYSTEM ON PRODUCTIVITY
Information drives and enhances decisions. The Region is responsible for providing our residents with high quality
services meeting current and future needs in areas such as transit and transportation infrastructure, community
and health services, policing, and water and wastewater.
Almost every regional service and program uses location, whether it is an address or coordinates of a feature. By
leveraging the geography in business data, regional planning, decision-making and operational efficiency have
been enhanced. Knowing “where” can help explain “how” and “why”. Showing “where” helps communicate
effectiveness, decisions, and plans.
Our Enterprise GIS provides the quality data, access and analysis that are core to supporting business processes,
service delivery and decision making. Using our experience and knowledge built from creating an Enterprise GIS,
we have taken the lead to make non-spatial business information that was previously held within departments,
corporately accessible through York’s Online Data Access (YODA) program. With an increasing amount of regional
data now available to staff, their analysis and decision-making can be much more efficient and confident as they
boldly know.

Boldly Know: York Region’s Enterprise GIS URISA ESIG Award Application
Page 48
E.5. OTHER IMPACTS
E.5.1. CAPACITY BUILDING - DATA, GIS AND ANALYTICS “MUSCLE”
A significant component of the process has been to build capacity within the branch, the region, and within the
partnership as a whole.
Data and GIS training is widely available and utilized by both GIS and program staff as shown below.
Figure 12. Training game plan
Figure 13. Descriptions of the available courses

Boldly Know: York Region’s Enterprise GIS URISA ESIG Award Application
Page 49
Figure 14. "How to" support.
Figure 15. Webinars on a range of relevant topics are online and easy to access.
Figure 16. Information days are held to help introduce staff to what’s new.
Figure 17. Seminars are routinely scheduled, such as this one on building a knowledge-based organization through information, analytics and technology.
The Data Management Course
With broader data access and improved sharing within the Region, we realized there was a gap in basic data
management skills throughout the corporation. In response to that gap, a Data Management Course is being
designed to provide York Region staff with a stronger foundation of everyday data management skills including:
Understanding their responsibilities for data management (including York Region policies)
Best practices to ensure data is created of high quality, is well documented and shared appropriately.
The course will essentially explain why we believe: Data is a corporate asset that must be managed responsibly
and to a high quality to retain its value to the Region. It is all staff’s responsibility.

Boldly Know: York Region’s Enterprise GIS URISA ESIG Award Application
Page 50
Partnership Primer
Our Guide for Data Collaboration, developed together with the YorkInfo Partnership, facilitates the building of
accurate, current, and relevant datasets that meet business needs in a way that is thoughtful, responsive and
produces useful technical designs to support applications and decisions. The guide outlines best practices and
suggests steps with defined deliverables at each step. It provides a series of questions at each of the seven
checkpoints to define the expected deliverables/outcomes and keep the design on the right track.
Analytics Muscle
Our Enterprise GIS has enabled us to democratize tools / technologies that enable staff to access, analyze and
manipulate data. Visualization and analysis software and tools bring data to life by being compelling, interactive,
and informative, helping users gain new insights and make new discoveries. By getting GIS and visual analytics
capability into the hands of people throughout the organization we are building analytics muscle. GISB leads the
corporate coordination of Geodemographic Advisory Group; the Visual Analytics Advisory Group and the GIS
Knowledge Community supporting all corporate GIS users of which 50 are power users with the balance of the 300
desktop GIS deployments used selectively by other professional staff.
E.5.2. MEASUREMENT CULTURE
The Enterprise GIS, by making data available has helped Regional leadership put in place a measurement culture -
in which measures matter. Measuring also helps direct the collection of the right and meaningful data.
Our Region’s participation in OMBI (Ontario Municipal Benchmarking Initiative) is supported through the
Enterprise GIS and our ability to access and use data. The Region’s GIS was featured at the OMBI Spring Forum in
Ottawa, as the topic of the morning’s keynote.
E.5.3. OPEN DATA = NEW OPPORTUNITY
Many of York Region’s GIS data are also released to the public through the Region’s Open Data program. The data
can be used for any purpose, without restriction as part of the public domain. The information can be used, reused
and redistributed, as long as it meets York Region’s license agreement. As Open Data expands, more data sets will
be available.

Boldly Know: York Region’s Enterprise GIS URISA ESIG Award Application
Page 51
E.5.4. AWARDS AND RECOGNITION
Figure 18. Alex Miller (Esri Canada), Jack Dangermond (Esri), John Houweling (GISB) – Esri Special Achievement in GIS Award 2014
Last year, the Regional GIS won the Esri Special Achievement in GIS award. The award is given to organizations that
have used GIS to improve our world—and set new precedents throughout the GIS community. York Region was the
only organization in Canada selected to receive this award from over 10,000 agencies and businesses.
The March 2015 edition of “Municipal World” magazine featured an article about the York Region Enterprise GIS
sharing the key ingredients on how it was accomplished: leadership, team work, partnership, information
accuracy, nifty tech, and transformation.
E.6. CHANGES TO BUSINESS AND/OR SERVICE DELIVERY
E.6.1. CHANGE: SELF SERVE
Of the 650 map layers we manage in the geodatabase, a significant number of these are shared and regularly
updated across the region with our regional partners. The process of sharing quarterly updates to our geodatabase
used to be a manual one, in which a “cut” of the new data was prepared, and then sent electronically to each of
the recipient organizations. Each recipient organization then had to manually unbundle the packages and
determine what data were being provided and whether or not they even needed it all. It was a lot of time and
effort for everyone, and often the public had access to more current data through YorkMaps than partners did
through their scheduled deliveries.

Boldly Know: York Region’s Enterprise GIS URISA ESIG Award Application
Page 52
The Clip, Zip and Ship application changed that manual and time-consuming process completely. Now, the
Region’s geodatabase is the single source of the truth, and any of the partners can log into the site, add the data
layers that they want into a shopping cart, define the clip (geographic) area, projection, and format they need; and
get up-to-date data 24/7. No longer are Regional staff involved in a manual service. And, local municipalities can
now automate the whole process to get the data they need when they need it.
E.6.2. CHANGE: SELF SERVE FOR CONSULTANTS
The Region contracts dozens of projects to consultants. We require that they use our data (if it already exists)
rather than spend time and money to re-create the data. Therefore they need access to our spatial data to
complete the project. GISB staff and others in the Region spend hundreds of hours putting together and providing
these manual data deliveries. Often a consultant will make several requests over the course of the project.
Like the Clip, Zip and Ship application for local municipalities we are extending the Voyager software to let
consultants select and download what they need on their own (at any time they need it) and from their computer.
This might sound easy, but it’s a lot trickier because we’ve had to factor in new security, workflow and other
complicating factors that our partners don’t require.
When complete, consultants will login to Voyager and select the project they are working on. The system will
determine the spatial geography of the project. The consultant will select the data layers they need, and place
them in a shopping cart for download. A Clip, Zip and Ship process then runs. If the consultant needs the same
download again they can automate it by calling a unique URL. Once the project term is expired the consultant can
no longer access the data for that project area.
Streamlining the data delivery process will save internal GIS staff significant time and effort executing manual
deliveries; and, consultants will get data they need when they need it.
E.6.3. CHANGE: “EXPLOSION” OF PUBLIC FACING MAP-BASED SERVICES
More and more our Enterprise GIS is enabling data to be published both directly as data, or in meaningful ways as
information and analysis in numerous web map applications and some are listed below.
YorkMaps.ca
Business Directory
Community Services
Cycling
Land Information
Recreation and Culture
Source Water Protection
Common Viewer: applications hosted on behalf of local municipalities E.g. East Gwillimbury
Open Data http://York.ca/opendata
Data Discovery http://findit.york.ca/search/portal/#/search

Boldly Know: York Region’s Enterprise GIS URISA ESIG Award Application
Page 53
ArcGIS Online
Centres and Corridors
Community Demonstration Gardens
Early Development Instrument
Food For Learning
Lake to Lake Cycling Route and Walking Trail
Make Rental Happen
Regional Roads
York.ca Mashups
40+ Google Map embedded throughout York.ca to provide location and driving directions to services the
Region provides. E.g. Solid Waste Drop off Depots
Beach water testing results
investinyork.ca/directory-tableau/
Not included in the list are those services that we rebrand and publish for our partners – such as the York Regional
Police; the Town of East Gwillimbury; and, others.
E.6.4. CHANGE: REAL TIME MAINTENANCE OF DATA THROUGH BUSINESS PROCESSES
One of the primary goals of the data management component of the Enterprise GIS is to have data captured once
– as a result of a business process – and then used many times. This eliminates duplication and reduces data errors
through the transformation. These are three examples of systems that support direct updating and maintenance of
data:
Street Tree Inventory. Staff uses the Street Tree Inventory application on mobile devices in the field to enable
them to geo-locate and count the trees while describing their characteristics such as the type, health, year planted,
and any maintenance that might be required.
Transportation infrastructure Inventory. The staff in the field monitor the state of the roads, catch basins, and
related features and report any repair / maintenance requirements using Collector for ArcGIS Online.
Employment Data Survey. An annual survey of employers in the region with data collected by summer students
hired specifically for this work. The application is a custom built form and interface using GeoCortex Essentials, and
enables the capture of business information, products / services, # employees, and more.
E.6.5. CHANGE: EASY ACCESS TO PROPERTY INFORMATION AND REPORTING
A wide variety of business processes within the region rely on having access to property information – ownership,
legal title, address, value, size, last date sold, etc. In Ontario, two separate organizations manage private land
ownership: Teranet manages all the legal title, cadastre and related information; while MPAC manages the
taxation and value information.

Boldly Know: York Region’s Enterprise GIS URISA ESIG Award Application
Page 54
Without easy access to this information and the underlying data about the property, a large number of business
processes in the region would be delayed. The Region’s “Property Viewer” makes the search for this information
from these two separate organizations possible in one click.
The application allows staff to zoom to a property and click to get more detailed information on the property from
data that York Region maintains along with Teranet and MPAC data. We’ve built two versions of the application:
one that omits ownership information (much of which is typically considered private); and, one that includes
ownership information. In this way, only staff that require the ownership information have access. This insures
compliance with privacy legislation. Users can generate a report for each property.
For those business areas that need property information, this application saves a lot of time and effort, and helps
reduce errors.
E.6.6. CHANGE: THE RISE OF ANALYTICS
Many of the new analytical tools have been described above. This rise in analytical capability has given a real boost
to the value of the GIS and the recognition of the importance of good data.
Through the acquisition of geo-demographic data from Environics Analytics, several new business analysis
opportunities became available for staff throughout the region. Staff are able to use this data in a number of ways
including service planning, program marketing, determining optimal service locations, etc. Everyone from
epidemiologists to engineering staff benefit.
Health Inspection is another area in which the analytical capabilities of the GIS are supporting business decisions.
It’s difficult to balance the workload of health inspectors because they all must travel to different food
establishments with various characteristics (no two are the same). They also have to travel a lot, from one food
establishment to another across our large region. GIS creates efficiencies by defining territories based on
comparable effort characteristics resulting in more equitable workload.
The analysis created in GIS using a variety of data inputs:
the location of food establishments.
the rate at which these establishments need to be inspected.
the time to conduct an inspection – which varies based on type of establishment.
the inspector’s home office location.
the hours they work – either full or part time.
The tool compiled and computed these data to create optimized districts, as shown on the map, which was made
available through the GIS to support their work and planning.

Boldly Know: York Region’s Enterprise GIS URISA ESIG Award Application
Page 55
Figure 19. Optimized districts for health inspectors.

Boldly Know: York Region’s Enterprise GIS URISA ESIG Award Application
Page 56
F. SYSTEM RESOURCES
F.1. SYSTEM’S PRIMARY HARDWARE COMPONENTS
F.1.1 HIGH LEVEL SYSTEM ARCHITECTURE
Figure 20. High level system architecture
York Region’s Enterprise GIS is also presented as ‘wiring diagram’ that depicts the connectivity between
applications and servers.

Boldly Know: York Region’s Enterprise GIS URISA ESIG Award Application
Page 57
Figure 21: Services / Applications/ Servers Connectivity Diagram
YORK-#5492748-v1-G
eo_Services_Applications_Servers_Integration.VSD
F.2. SYSTEM’S PRIMARY SOFTWARE COMPONENTS
Adoption of GIS technology has enabled York Region to capture, store, manage, manipulate, analyze, and present
spatial information. While many of our foundational technologies are Esri-based, we implement whatever
technologies best meet our business requirements, and are most cost-effective and easiest for us to support and
maintain.
A couple of non-Esri related software applications stand out:
Tableau Desktop Professional 9 is increasingly used to provide meaningful, fast and easy-to-build dashboards for
business support, analysis and reporting. Tableau integrates data from multiple sources so that you can present
relationships in charts, graphs (and maps) between data that would not have been easily achieved with any single
database report.
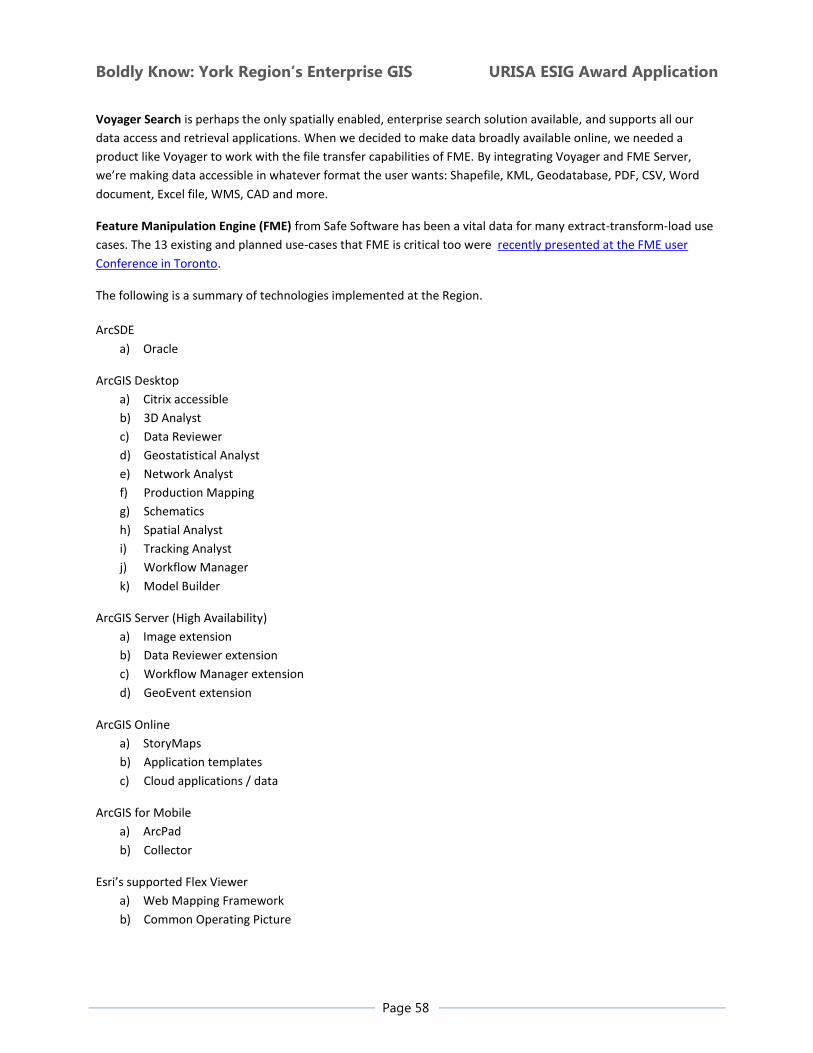
Boldly Know: York Region’s Enterprise GIS URISA ESIG Award Application
Page 58
Voyager Search is perhaps the only spatially enabled, enterprise search solution available, and supports all our
data access and retrieval applications. When we decided to make data broadly available online, we needed a
product like Voyager to work with the file transfer capabilities of FME. By integrating Voyager and FME Server,
we’re making data accessible in whatever format the user wants: Shapefile, KML, Geodatabase, PDF, CSV, Word
document, Excel file, WMS, CAD and more.
Feature Manipulation Engine (FME) from Safe Software has been a vital data for many extract-transform-load use
cases. The 13 existing and planned use-cases that FME is critical too were recently presented at the FME user
Conference in Toronto.
The following is a summary of technologies implemented at the Region.
ArcSDE
a) Oracle
ArcGIS Desktop
a) Citrix accessible
b) 3D Analyst
c) Data Reviewer
d) Geostatistical Analyst
e) Network Analyst
f) Production Mapping
g) Schematics
h) Spatial Analyst
i) Tracking Analyst
j) Workflow Manager
k) Model Builder
ArcGIS Server (High Availability)
a) Image extension
b) Data Reviewer extension
c) Workflow Manager extension
d) GeoEvent extension
ArcGIS Online
a) StoryMaps
b) Application templates
c) Cloud applications / data
ArcGIS for Mobile
a) ArcPad
b) Collector
Esri’s supported Flex Viewer
a) Web Mapping Framework
b) Common Operating Picture

Boldly Know: York Region’s Enterprise GIS URISA ESIG Award Application
Page 59
Esri Maps for Sharepoint
a) Microsoft BI
CityWorks
IBM Maximo
a) GeoWorx for IBM Maximo
Safe Software FME (High Availability)
a) Desktop
b) Server
Latitude Geographics
a) Geocortex Essentials (Silverlight/HTML5)
b) Workflow
c) Optimizer
Voyager Search (Open Data; Clip, Zip and Ship; Centralized Access to Information; Data Discovery- High Availability)
a) Server Pro
b) Enterprise security
c) Geoprocessing
d) Database Connector
GeoXMF
a) Accelerator
b) Alerter
Go! Sync
Analytics
a) Tableau Desktop Pro
b) Environics Envision
c) R (for statistical computing)
Mashups
a) Google Maps API
b) Google Maps Embed API
c) Geolocation API
d) Google Places API
e) Bing Maps Basemap
f) Esri World Traffic Service
g) Esri World Locator Service

Boldly Know: York Region’s Enterprise GIS URISA ESIG Award Application
Page 60
F.3. DATA THE SYSTEM WORKS WITH
Figure 22. Graphic to illustrate the variety of data we work with
The GIS maintains the Region’s authoritative, trusted and core spatial data. These data include ortho-photography,
roads, land parcels, and address points. Data quality is promoted and managed through Production Mapping.
Our Spatial Data Warehouse provides a centrally accessible location for the storage and access of over 650
authoritative sources of data. The Enterprise GIS data story has been told in many ways throughout the document.
The Region’s Parcel, Address and Roads (PAR) model enables third party data to be integrated. There are two
versions: a simplified version is published in the Spatial Data Warehouse for common network and infrastructure
planning and reporting use; and, a complex version is also managed and maintained for the corporation’s
analytical needs.
F.3.1. JOINT PURCHASE OF TERANET DATA WITH SIX LOCAL MUNICIPALITIES
Teranet, a private sector company in Ontario, is the province’s authoritative source of property information. The
Teranet “fabric” provides an accurate parcel coverage for the province based on title. This parcel fabric is core to
many business applications and decision-making in the private and public sectors. Municipal governments use it to
support environmental assessments, expropriations, provide notification for service disruptions, and to organize
public consultations.

Boldly Know: York Region’s Enterprise GIS URISA ESIG Award Application
Page 61
The Region entered into an agreement with Teranet to acquire the parcel fabric for the region that allows local
municipalities to sub-license the data at a reduced cost. This co-operative purchase not only reduces the cost of
the data to the local municipality, but reduces the costs associated with the administration of the contracts as well.
F.4. STAFF RESOURCES TO IMPLEMENT SYSTEM
The Geographic Information Services Branch manages the Enterprise GIS and the Region's spatial data, and
provides corresponding analysis, products, services and technology. The Branch supports all Regional departments
plus York Regional Police and the York Region Rapid Transit Corporation. Additionally, we lead and coordinate the
YorkInfo Partnership, which includes municipal, educational and conservation authority organizations operating
within the Region. There are 22 staff in the Geographic Information Services Branch with additional embedded GIS
staff in the operating departments.
The Branch is organized into four sections: Information Management, Business Solutions, Analytics and Applied
Mapping and GIS Partnerships. Each section is led by a manager and comprised of various levels of staff including
project specialists, analysts, technologists and technicians and is led by John Houweling, Director, Geographic
Information Services. The Geographic Information Services Branch is organizational positioned in the Corporate
Services Department and works collaboratively with the Information Technology Services Branch in the Finance
Department and the Information Asset Management unit part of the Clerks Branch.
Information Management, led by Susan Chin Snelgrove, creates, manages, and distributes quality spatial data for
the corporation and external partners and stakeholders. This is done by procedures, standards, models and
documentation.
Business Solutions, is usually led by Andrew Satterthwaite, who is currently leading the Region’s forecasting
improvement initiative. During his secondment, Kerry Brazel and Rica Saporta are building their management
capacity. The section manages and leads project teams; GIS applications development and implementation; re-
engineers business processes to integrate geographic information and create efficiencies throughout the
corporation and with business partners; and manages the Region’s evolving geospatial technology infrastructure.
Analytics and Applied Mapping, led by Duncan Rowe, plans, develops, maintains and manages GIS projects,
applications, analysis, products, tools and templates for Regional departments, business partners and user groups;
develops standards, processes, methodologies, and policies related to GIS applications and product distribution;
ensures the GIS web and geospatial warehouse is maintained with regard to map products, views and tools specific
to the program area; coordinates Emergency Management GIS response and operations as well as development
and implementation of GIS courses, training and technology transfer to the corporation and partners.
GIS Partnerships and Special Projects, led by Debra Kelloway, focuses on building strong, collaborative
relationships. This involves developing strategies, based on best practices, to enhance and evolve the role of the
YorkInfo Partnership to make it more results oriented, collaborative and to achieve cost savings; developing annual
work plans; leading the development of standards, policies and guidelines; and coordinating and working with the
partners to develop and share common data, applications, training, and resources; and create a framework and
infrastructure that facilitates the sharing of information and spatial data.

Boldly Know: York Region’s Enterprise GIS URISA ESIG Award Application
Page 62
F.5. UNUSUAL RESOURCING FACETS OF SYSTEM’S DEVELOPMENT
F.5.1. LOCAL MUNICIPALITIES
As outlined above, the YorkInfo Partnership has been a significant support to all parties, and makes it possible for
York Region to maintain the foundational data for the region (imagery, infrastructure, planning and more). With
13% of the Region’s entire revenue base coming from development charges, this relationship becomes even more
critical to our capital and infrastructure planning, and the main driver behind building the Development Charges
and Population Forecast visualization tool.
F.5.2. SEVERAL PROJECTS IN ONE
Each individual project needs to be tackled with a vision to the whole enterprise. The important part is that we’ve
built a strong team with a diversity of strengths that allows us to adapt to the changing needs and resourcing
challenges of the enterprise.
In this rapidly changing time of disruptive technologies and economic uncertainty, the GIS team is poised to
embrace whatever the future may hold. The Enterprise GIS helps make the region flexible and responsive through
its YorkInfo Partnership, the trusted GIS database, the user-friendly YorkMaps and other foundational applications,
and the expanding experience and capacity across the Region which is enabling us to boldly know.


