1
Electronic Supplementary Material (ESI) for Materials Chemistry Frontiers.This journal is © the Partner Organisations 2018
Electronic supplementary information for the following manuscript:
Systematic Oligoaniline-based Derivatives: the ACQ-AIE Conversion with Tunable Insertion Effect and Quantitative Fluorescence "turn-on" Detection of BSA
Hao Lu, Kun Wang, Beibei Liu, Meng Wang, Mingming Huang, Yue Zhang, and Jiping Yang*
Key Laboratory of Aerospace Advanced Materials and Performance, Ministry of Education, School of Materials Science and Engineering, Beihang University, Beijing 100191, ChinaE-mail: [email protected]
Table of Contents
Chemicals and materials 2
Apparatus and analytical methods 2
Experimental procedures 3
Figures S1-S18 6
Table S1-S2 15
References 16
Electronic Supplementary Material (ESI) for Materials Chemistry Frontiers.This journal is © the Partner Organisations 2018
2
Chemicals and materials
Diphenylamine (A1, purity 98%), N,N’-diphenyl-1,4-phenylenediamine (A2, purity
98%), diphenylacetaldehyde (purity 95%), (±)-Camphor-10-sulfonic acid (purity 98%),
hydroquinone (purity 99%), 4-hydroxydiphenylamine (HDPA, purity 98%), sodium tert-
butoxide (purity 98%), 1,4-phenylenediamine (purity 98%), and tetrabutyl orthotitanate
(TBT) were purchased from TCI (Shanghai) development Co., Ltd. N-Pheny-1,4-
phenylenediamine (ADPA, purity 98%) was purchased from Alfa Aesar (China)
Chemical Co., Ltd. 4-Bromodiphenylamine (Br-A1, purity 99%) was purchased from
Adamas Reagent Shanghai Co., Ltd. Palladium(II) acetate (purity 99%), 2-(di-tert-
butylphosphino)biphenyl, bovine serum albumin (BSA, purity 99%), cholesterol (purity
99%), carbamide (purity 99%), L-arginine (purity 99%) and glucose (purity 99%) were
purchased from Innochem Chemical Reagent Beijing Co., Ltd. Phosphate buffer saline
powder (2L) and γ-globulin (purity 99%) were purchased from Beijing BioDee
Biotechnology Co., Ltd. 5Ǻ molecular sieves were purchased from Sinopharm Chemical
Reagent Beijing Co., Ltd, and activated for 4 h at 240 oC in a tube furnace prior to use.
Toluene and tetrahydrofuran (THF) were received from Beijing Chemical Works (Beijing,
China). Toluene was dried by calcium hydride over night, then refluxed and distilled for
use. All other raw materials were used without further purification.
Apparatus and analytical methods
Ultraviolet and visible (UV-vis) absorption spectra were recorded on a TU-1901 UV
spectrophotometer by using THF as the solvent. Proton nuclear magnetic resonance (1H-
NMR) spectra were measured on a Bruker AV 400M NMR spectrophotometer in
deuterated dimethyl sulfoxide, deuterated THF or deuterated chloroform using 0.05%
tetramethylsilane as an internal standard. Fourier transform infrared (FTIR) spectra were
obtained using a Nicolet iS50 FTIR spectrophotometer with KBr pellet technique at room
temperature. Single crystal X-ray structures were analyzed on a Rigaku CCD Saturn 724+
X-ray single crystal diffractometer using monochromatized Mo-Kα (λ=0.71073 Ǻ)
incident radiation. Mass spectra (MS) were carried out with an Autoflex III MALDI-TOF
3
mass spectrometer. Photoluminescence spectra (PL) were obtained using a F-5200
fluorescence spectrophotometer. All computational studies were performed using density
functional theory (DFT) method at a B3LYP/6-31G (d) level through Gaussian 09
package.[1]
Experimental procedures
Synthesis of B1-A1
A1 (0.642 g, 3.8 mmol), diphenyl acetaldehyde (0.745 g, 3.8 mmol), 5Ǻ molecular
sieves (1.011 g), toluene (8 ml) and THF (2 ml) were blended followed by mightily
stirring for 20 min. Then (±)-camphor-10-sulfonic acid (catalytic amount) was added and
the whole mixture refluxed at 70 oC for 8 h. Along with the system cooling to room
temperature, the resulting solution was filtered and the filtrate was evaporated under
reduced pressure. The crude product was dissolved in THF and recrystallized to afford
bright yellow powder (0.791 g, 57%).
1H-NMR (400 MHz, THF-d8), δ (ppm): 5.56-5.42 (m, 5H, Ar), 5.34 (t, 4H, J=8.0 Hz,
Ar), 5.27-5.16 (m, 9H, Ar), 5.11 (t, 2H, J=8.0 Hz, Ar), 4.99 (s, 1H,-N-CH=).
FTIR (KBr), cm-1: 3021 (C-H, Ar); 1583, 1586 (C=C); 1486, 1477 (C-C, Ar); 1342,
1315, 1251 (C-N); 754, 692 (C-H, Ar).
MALDI-TOF MS: m/z: calcd for C26H21N: 347.2; found: 347.2(M+H) +.
Synthesis of B1-A2, B2-A2
B1-A2 and B2-A2 were synthesized based on the previous literature with some
modifications. [2] A2 (0.880 g, 3.2 mmol), diphenyl acetaldehyde (1.393 g, 7.1 mmol) and
5Ǻ molecular sieves (1.023 g) were added into analytical THF (2 ml) and toluene (8 ml).
After stirring for 25 min, (±)-camphor-10-sulfonic acid (catalytic amount) was added.
Subsequently, the solution was step-heated to 70 oC and kept reaction for 48 h. After
cooling to environment temperature, filtered solvents were removed by reduced pressure
distillation and the mixture was separated by silica gel column chromatography using
petroleum ether/ethyl acetate (30:1 (v/v)) as the eluent. Ideal B1-A2 (Rf=0.43) and B2-A2
4
(Rf=0.61) were further purified by recrystallization in THF solvent. Yellow powder of
B2-A2 was acquired in a yield of 53% while B1-A2 with quantity of 27% exhibiting
bright yellow color was obtained.
B1-A2:1H-NMR (400 MHz, THF-d8), δ (ppm): 9.01 (s, 1H, NH), 5.44-4.79 (m, 25H, Ar and
-N-CH=).
FTIR (KBr), cm-1: 3047 (N-H); 3022 (C-H, Ar); 1595, 1569 (C=C); 1509, 1491 (C-C,
Ar); 1309, 1265 (C-N); 755, 693 (C-H, Ar).
MALDI-TOF MS: m/z: calcd for C32H26N2: 438.2; found: 438.3 (M+H) +.
B2-A2:1H-NMR (400 MHz, THF-d8), δ (ppm): 5.42-5.30 (m, 12H, Ar), 5.23 (t, 6H, J=2.0
Hz, Ar), 5.15-4.98 (m, 12H, Ar), 4.81 (s, 6H, Ar and -N-CH=).
FTIR (KBr), cm-1: 3022 (C-H, Ar); 1591, 1569 (C=C); 1502, 1490 (C-C, Ar); 1336,
1311, 1263 (C-N); 758, 696 (C-H, Ar).
MALDI-TOF MS: m/z: calcd for C36H36N2: 616.3; found: 616.2 (M+H) +.
Synthesis of aniline trimer (A3)
Aniline trimer was synthesized based on the previous literature with some
modifications. [3] ADPA (4.500 g, 24.0 mmol) was added to a 250 ml round-bottom flask
followed by dissolution with 75 ml dehydrated toluene. Afterwards, TBT (9.290 g, 80.0
mmol) was then added with a syringe all at once through the septum. The system was then
vacuumed and filled with argon gas atmosphere. Repeating this operation three times to
fully extirpate air, and then HDPA (4.501 g, 24.0 mmol) dissolved in 25 ml dehydrated
toluene was added to the reaction system with protection of an argon gas balloon. The
reaction system was step-heated to 100 oC to gain reflux condition and continued to stir
for 20 hours. After allowing cooling down to room temperature, the reaction solution was
filtered by sand core funnel and the resulting purple silver crystals were washed
repeatedly with 700 ml of toluene. Solid crude product was purified by recrystallization
5
using toluene/ethyl acetateas the solvent, followed by drying under reduced pressure to
obtain ideal A3 (6.307 g, 70%).
1H-NMR (400 MHz, DMSO-d6), δ (ppm): 7.78 (s, 2H, NH), 7.67 (s, 1H, NH), 7.15 (t,
4H, J=8.0 Hz, Ar), 7.04-6.84 (m, 12H, Ar), 6.69 (t, 2H, J=8.0 Hz, Ar).
FTIR (KBr), cm-1: 3388 (N-H); 3044, 3020 (C-H, Ar); 1529, 1494 (C-C, Ar); 1304,
1225 (C-N); 822,746, 694 (C-H, Ar).
MALDI-TOF MS: m/z: calcd for C24H21N3: 351.2; found: 351.1 (M+H) +.
Synthesis of B3-A3
Following the similar procedure as that of compound B2-A2, just replacing A2 by
A3, B3-A3 was successfully obtained. Yields of yellow B3-A3 was 17%.
B3-A3:1H-NMR (400 MHz, THF-d8), δ (ppm): 5.44-4.99 (m, 40H, Ar), 4.91-4.80 (m, 7H,
Ar and -N-CH=), 4.71 (t, 4H, J=8.0 Hz, Ar).
FTIR (KBr), cm-1: 3023, 2923 (C-H, Ar); 1590, 1569 (C=C); 1503 (C-C, Ar); 1312,
1260 (C-N); 752, 696 (C-H, Ar).
MALDI-TOF MS: m/z: calcd for C52H51N3: 885.4; found: 885.2 (M+H) +.
Synthesis of B2-A4Firstly, the enamine derivative (Br-B1-A1) was gained by the mixure of Br-A1
(1.736 g, 7.0 mmol) and diphenyl acetaldehyde (1.393 g, 7.1 mmol) follwing the
procedure of B1-A1. The product was light gray with a yeild of 79%. Next, Br-B1-A1
(2.125 g, 5.0 mmol) was added to a 50 ml round-bottom flask followed by dissolution
with 15 ml dehydrated toluene. Afterwards, the mixture solution of 1,4-phenylenediamine
(0.272 g, 2.5 mmol), sodium tert-butoxide (0.865 g, 9 mmol) and 2-(di-tert-
butylphosphino)biphenyl (0.700 g, 1.1 mmol ) in 15 ml dehydrated toluene was then
added with a syringe all at once through the septum. The system was then vacuumed and
filled with argon gas atmosphere. The reaction system was step-heated to 100 oC to gain
reflux condition and continued to stir for 16 hours. After allowing cooling down to room
temperature, the reaction solution was filtered by sand core funnel and the resulting
6
yellowish-green powder was washed repeatedly with 500 ml of toluene. Solid crude
product was purified by recrystallization using toluene/ethyl acetate as the solvent,
followed by drying under reduced pressure to obtain ideal B2-A4 (1.017 g, 42%).
1H NMR (400 MHz, DMSO-d6), δ (ppm): 7.26-6.90 (m, 34H, Ar and –NH-), 6.82 (t,
6H, J=8.0 Hz, Ar), 6.74 (t, 6H, J=8.0 Hz, Ar and -N-CH=).
FTIR (KBr), cm-1: 3419 (N-H); 3027 (C-H, Ar); 1590, 1568 (C=C); 1513, 1496 (C-C,
Ar); 1309, 1265 (C-N); 755, 695 (C-H, Ar).
MALDI-TOF MS: m/z: calcd for C58H46N4: 798.4; found: 798.2 (M+H) +.
Synthesis of B4-A4Following the similar procedure as that of compound A3, using new reaction
ingredients as 1,4-phenylenediamine and hydroquinone, the aniline tetramer (A4) was
successfully obtained. Then, as the same as the synthesis of B1-A1~B3-A3, just replacing
A3 by A4, B4-A4 was successfully obtained. Yield of yellow B4-A4 was 46%.
1H-NMR (400 MHz, CDCl3), δ (ppm): 7.41-7.32 (m, 8H, Ar), 7.30-7.16 (m, 28H,
Ar), 7.07 (d, 8H, J=4.0 Hz, Ar), 6.95 (t, 8H, J=8.0 Hz, Ar), 6.82 (d, 6H, J=8.0 Hz, Ar),
6.63 (d, 8H, Ar and -N-CH=).
FTIR (KBr), cm-1: 3026, 2917 (C-H, Ar); 1592, 1570 (C=C); 1500 (C-C, Ar); 1301,
1258 (C-N); 755, 696 (C-H, Ar).
MALDI-TOF MS: m/z: calcd for C86H66N4: 1154.5; found: 1154.3 (M+H) +.
B1-A1
348.
10
B1-A2
439.
30
438.
28
347.
09
B2-A2
617.
21
616.
21
799.
17
798.
17
B2-A4
B3-A3
886.
22885.
21
B4-A4
1155
.32
1154
.32
115611
5511
54886
885
79979
861
761
643
943
8348
347
Fig. S1 MALDI-TOF mass spectra of the synthesized oligoaniline derivatives.
7
5.6 5.4 5.2 5.0
Chemical shift (ppm)
(a)
4000 3000 2000 1000
50
100
692
754
1486,1477
15651583,
Wave number (cm-1)
Tran
smitt
ance
(%)
1342,1315,
1251
(b)
28462919,3021,
Fig. S2 1H-NMR (a) and FTIR (b) spectra of B1-A1.
10 9 8 7 6 5 4
5.4 5.2 5.0 4.8
Chemical shift (ppm)
(a)
4000 3000 2000 10000
50
100
28502917,
1595,12651309,1337,
755693
14911509,
1569
3407
Tran
smitt
ance
(%)
Wave number(cm-1)
3022,
(b)
Fig. S3 1H-NMR (a) and FTIR (b) spectra of B1-A2.
5.4 5.2 5.0 4.8
Chemical shift (ppm)
(a)
4000 3000 2000 10000
50
100
28472919,
12631311,
Wave number (cm-1)
Tran
smitt
ance
(%)
3022,
1591,1502,15691490
1336,
758696
(b)
Fig. S4 1H-NMR (a) and FTIR (b) spectra of B2-A2.
8
8.0 7.6 7.2 6.8 6.4 6.0Chemical shift (ppm)
(a)
200 400 6000
1000
2000
Inte
ns.[a
.u]
m/z
351.1
C24H21N3
351.17
(b)
4000 3000 2000 10000
50
100
694
746
1225
14941529,
3020
Wave number (cm-1)
Tran
smitt
ance
(%)
3388
3044,
1304
822
(c)
Fig. S5 1H-NMR (a), MS (b) and FTIR (c) spectra of aniline trimer A3.
5.4 5.2 5.0 4.8 4.6Chemical shift (ppm)
(a)
4000 3000 2000 10000
50
100
696
752
12601312,
1503
15691590,
2923
Wave number (cm-1)
Tran
smitt
ance
(%)
3023
(b)
Fig. S6 1H-NMR (a) and FTIR (b) spectra of B3-A3.
9
7.3 7.2 7.1 7.0 6.9 6.8 6.7
Chemical shift (ppm)
(a)
4000 3000 2000 1000
0
50
100
695
755
3419
Tran
smitt
ance
(%)
Wave number(cm-1)
28562926,3027,
1590,1568
14961513,
12651309,1337,
(b)
Fig. S7 1H-NMR (a) and FTIR (b) spectra of B2-A4.
7.6 7.4 7.2 7.0 6.8 6.6 6.4Chemical shift (ppm)
(a) Solvent peak
4000 3000 2000 1000
50
100
696
755
Wave number(cm-1)
Tran
smitt
ance
(%)
28502917,3026,
1592,1570
1500
12581301,1335,
(b)
Fig. S8 1H-NMR (a) and FTIR (b) spectra of B4-A4.
10
400 450 500 550 600 6500.0
0.4
0.8
1.2 B4-A4 B2-A4 B3-A3 B2-A2 B1-A2 B1-A1
Wavelength (nm)
Nor
mal
ized
PL
Fig. S9 Normalized emission spectra of B1-A1, B1-A2, B2-A2, B3-A3, B2-A4 and B4-A4 in solid powder states (excitation wavelengths: 344 nm for B1-A1, 329 nm for B1-A2, 335 nm for B2-A2, 338 nm for B2-A4, 340 nm for B3-A3 and 353 nm for B4-A4; EX slit: 2.5 nm; EM slit: 2.5 nm).
300 400 500 600
0.0
0.2
0.4
0.6
0.8
1.0
content of water 90% 70% 60% 50% 40%
Abs
Wavelength (nm)
(b)
Fig. S10 Tyndall test (a) and UV absorption curves (b) of B2-A2 at various proportions of THF and water (concentrations: 10 μM).
11
400 500 600
0
100
200
300
400
500B1-A1
Lum
ines
cenc
e in
tens
itycontent of water 90% 80% 70% 60% 50% 40% 30% 20% 10% 0%
Wavelength(nm)
(a)
400 500 6000
20
40
60
80
100B1-A2
Lum
ines
cenc
e in
tens
ity
content of water 90% 80% 70% 60% 50% 40% 30% 20% 10% 0%
Wavelength(nm)
(b)
400 500 6000
50
100
150content of water 90% 80% 70% 60% 50% 40% 30% 20% 10% 0
B2-A4
Lum
ines
cenc
e in
tens
ity
Wavelength(nm)
(c)
400 500 6000
300
600
900
1200 content of water: 90% 80% 70% 60% 50% 40% 30% 20% 10% 0%
Lum
ines
cenc
e in
tens
ity
Wavelength(nm)
(d) B3-A3
0 90%
400 500 6000
200
400
600
800
Lum
ines
cenc
e in
tens
ity
content of water: 90% 80% 70% 60% 50% 40% 30% 20% 10% 0%
0
Wavelength(nm)
0 90%
B4-A4(e)
Fig. S11 PL spectra of B1-A1 (a), B1-A2 (b), B2-A4 (c), B3-A3 (d) and B4-A4 (e) in THF-water mixtures (concentrations: 10 μM; excitation wavelengths: 344 nm for B1-A1, 329 nm for B1-A2, 338 nm for B2-A4, 340 nm for B3-A3 and 353 nm for B4-A4; EX slit: 5 nm; EM slit: 10 nm).
12
0 2 4 6 80
2000
4000
6000
8000
10000 B1-A2-L B1-A2-S
Cou
nts
Time/ns
(b)
0 2 4 6 80
2000
4000
6000
8000
10000 B1-A1-L B1-A1-S
Cou
nts
Time/ns
(a)
Fig. S12 Fluorescence-decay profiles for B1-A1, B1-A2, B2-A2, B2-A4, B3-A3 and B4-A4 (L: solution state; S: solid powder state).
0 2 4 6 80
2000
4000
6000
8000
10000 B2-A2-L B2-A2-S
Coun
ts
Time/ns
(c)
0 2 4 6 80
2000
4000
6000
8000
10000 B2-A4-L B2-A4-S
Cou
nts
Time/ns
(d)
0 2 4 6 80
2000
4000
6000
8000
10000 B3-A3-L B3-A3-S
Cou
nts
Time/ns
(e)
0 2 4 6 80
2000
4000
6000
8000
10000 B4-A4-L B4-A4-S
Cou
nts
Time/ns
(f)
13
3.68eV
-0.89eV
-4.57eV
3.52eV
-0.93eV
-4.45eV
3.53eV
-0.94eV
-4.47eV
4.02eV
-0.81eV
-4.83eV
3.78eV
-0.78eV
-4.56eV
3.62eV
-0.77eV
-4.39eV
LUMO
HOMO
LUMO
HOMO
B2-A2 B3-A3 B4-A4
B1-A1 B1-A2 B2-A4
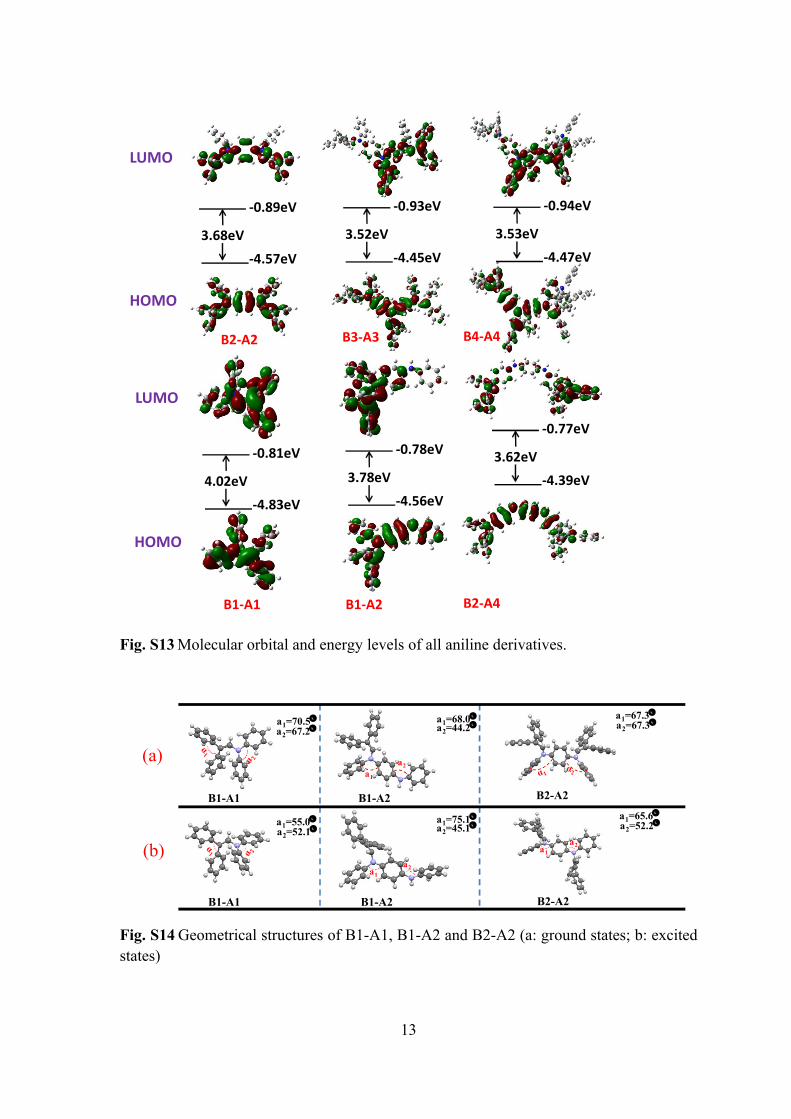
Fig. S13 Molecular orbital and energy levels of all aniline derivatives.
B1-A2
a1
a2
a1=68.0°a2=44.2°a1=70.5°
a2=67.2°
B1-A1 B1-A2
B1-A1
a1=55.0°a2=52.1°
B2-A2
B2-A2
a1=67.3°a2=67.3°
a1a2
a1=75.1°a2=45.1°
a1a2
a1=65.6°a2=52.2°
(a)
(b)
Fig. S14 Geometrical structures of B1-A1, B1-A2 and B2-A2 (a: ground states; b: excited states)
14
0 5 10 15 20 25
0
4
8
12
16
Concentration of BSA (mg/ml)
(b)
R2=0.962
I/I0-
1
400 500 6000
40
80
120
160
200VBAS (uL) 75 70 65 60 55 50 45 40 35 30 25 20 15 10 5 0
Wavelength (nm)
Lum
ines
cenc
e in
tens
ity
(a)B3-A3
0
25.1 mg/ml
Fig. S15 (a) Emission spectra of B3-A3 solution (10 μM; excitation wavelength: 340 nm; EX slit: 5 nm; EM slit: 10 nm) in various amount of BSA, (b) The fitted linear curve of luminescence intensity changes of B3-A3 solution in response to different amounts of BSA.
0 5 10 15
0.0
0.5
1.0
1.5
2.0
Concentration of BSA (mg/ml)
I/I0-
1
(a)
0 5 10 150
2
4
6
8
Concentration of BSA (mg/ml)
I/I0-
1
(b)
0 5 10 150
1
2
3
4
Concentration of BSA (mg/ml)
I/I0-
1
(c)
Fig. S16 Plot of (I/I0)-1 concerning B1-A1 (a), B1-A2 (b) and B2-A4 (c) in response to different amounts of BSA, where I0 is the luminescence intensity without the addition of BSA.
15
0 10 20 30 40 50
0
5
10
15
20
25
5.00mg/mL
3.75mg/mL
2.50mg/mL
1.25mg/mL
6.25mg/mL
(I-I
0)/I 0
Time (s)
(a)
0 10 20 30 40 50
0
5
10
15
20
25 18.75mg/mL
15.00mg/mL
11.25mg/mL
7.50mg/mL
3.75mg/mL
(I-I
0)/I 0
Time (s)
(b)
Fig. S17 (a) Fluorescence response of B2-A2 with different BSA concentrations (1.25-6.25 mg/ml) at the different time, (b) Fluorescence response of B3-A3 with different BSA concentrations (3.75-18.75 mg/ml) at the different time.
A B C D E F G H I J0.0
0.5
1.0
1.5
2.0
2.5
(I-
I 0)/I
0
(a)
A B C D E F G H I J0.00.51.01.52.02.53.03.5
(I-I 0
)/I0
(b)
Fig. S18 Dependence of the PL intensity of B2-A2 (a) ([B2-A2]=10 μM; [component] = 0.8mg/ml) and B3-A3 (b) ([B3-A3]=10 μM; [component] = 3 mg/ml) on different mixed components of blood serum in PBS buffer. (A) BSA; (B) γ-globulin; (C) cholesterol; (D) carbamide; (E) glucose; (F) L-arginine; (G), cholesterol, glucose, carbamide, L-arginine; (H) γ-globulin, cholesterol, glucose, carbamide, L-arginine; (I) BSA, cholesterol, glucose, carbamide, L-arginine; (J) BSA, γ-globulin, cholesterol, glucose, carbamide, L-arginine.
Table S1 Spectroscopic parameters of 6 aniline derivatives. (THF, 10μM)Compounds λmax abs/
nmλem/nm
Stokes shift/cm−1
B1-A1 312 408 7541B1-A2 330 467 8890B2-A2 332 451 7948B3-A3 342 464 7688B2-A4 339 488 9007B4-A4 353 479 7452
16
Table S2 Fluorescent lifetimes and quantum yields of 6 aniline derivatives in THF solutions and in solid powder states
Compounds State Fluorescent lifetime / ns Quantum yield / % B1-A1
In THF solution
2.51 0.01 B1-A2 1.41 0.02 B2-A4 1.14 0.05 B2-A2 0.07 0.07 B3-A3 0.05 0.09 B4-A4 0.19 0.22 B1-A1
In solid powder
1.41 0.02 B1-A2 0.25 0.05 B2-A4 0.83 0.14 B2-A2 0.32 0.55 B3-A3 0.51 0.63 B4-A4 0.39 1.56
Reference1 R. Misra, T. Jadhav, B. Dhokale and S. M. Mobin, Chemical Communications, 2014,
50, 9076.2 R. Paspirgelyte, J. V. Grazulevicius, S. Grigalevicius and V. Jankauskas, Designed
Monomers & Polymers, 2009, 12, 579.3 W. Wang and A. G. MacDiarmid, Synthetic Metals, 2002, 129, 199.