Giuseppe A. De Biase, Lucio Patern6, Mauro Pucillo, and Giorgio Sedmak
A twin-beam multiband photoelectric photometer has been constructed for ground based astronomical ob-
servations. The photometer is integrated to a computer to obtain a high degree of flexibility and efficiency.
The structure minimizes the atmospheric transmittance variations. It uses the photon-counting technique
to optimize the SNR. Constraints on the precision of astronomical photoelectric photometry are discussed.
The philosophy, structure, and possible extensions of the photometer are described. The results of a test
on the dynamic behavior of the whole system are also given. This photometer is more flexible, more reliable,
and simpler than other similar ones. Four of these machines have been constructed for the Catania, Milan,
Naples, and Trieste Observatories.
1. Introduction
The influence of the error sources on the precisionof ground based astronomical photoelectric photometryhas been thoroughly described by various authors.'-' 0
The atmosphere is the most important source of errorsin ground based astronomical photoelectric photome-try.7 The atmospheric transmittance shows randomvariations due to the atmospheric turbulence, super-imposed on the mean value. The random variations ofthe atmospheric transmittance can be separated intotwo physically different components. The first is dueto scintillation and shows a zero mean value. The sec-ond is due to unpredictable local variations in the at-mosphere and may show a nonzero mean value. Scin-tillation essentially depends on small scale turbulence,namely, up to the outer scale of turbulence.11-14 Thescintillation frequency spectrum ranges from a fewtenths Hz to a few hundreds Hz.'5-'7 The high fre-quency cutoff depends on the telescope aperture. 5 Thesecond component is essentially due to the large scaleinhomogeneities in the atmosphere not averaged bytelescope aperture during the measurement time. Thefrequency spectrum ranges from a few tenths Hz tonearly zero.'8 Besides these two temporal effects thereis also a spatial effect, seeing. The effect of seeing onpoint sources is to spread the luminous energy over anarea much larger than the diffraction pattern. There-
G. A. De Biase is with UniversitA di Roma, Istituto Osservatorio
Astronomico, 00136 Roma, Italy; L. Paternb is with UniversitA di
Catania, Osservatorio Astrofisico Citth universitaria, 95125 Catania,
Italy; the other authors are with Osservatorio Astronomico di Trieste,
fore a larger diaphragm, in the center of which the imageis formed, must be used, and so a sizable fraction of skybackground is also collected.7 8
It is relatively easy to minimize the errors due to theelectronics and mechanics of a photoelectric photometerthus optimizing the SNR.6 7 9 However, the optimi-zation of a system against the errors due to the atmo-spheric effects is quite difficult and requires the opti-mization of the operating mode.'0 It has been shownthat the optimum system for ground based astronomicalphotoelectric photometry is limited by photodetec-tion-noise, scintillation, and seeing.1
In view of these problems we designed an instrumentfor astronomical photoelectric photometry which ap-proximates the optimum one within the limitationsimposed by technical difficulties. This system is neg-ligibly limited by variations of the mean value of theatmospheric transmittance.
Photoelectric photometers which take into accountatmospheric transmittance variations have already beenconstructed by Warner'9 and Geyer and Hoffman.20
11. Precision of Measurement and Operating Modes
In this section, we compare the theoretical precisionsobtained by the different operating modes with whicha photoelectric measurement of astronomical sources,requiring an astronomical reference source, can betaken. That which follows concerns measurements ina single optical band, but it can easily be extended tomultiband measurements."' 0 In this analysis we con-sider only inherent physical error sources, namelyphotodetection-noise and atmospheric effects. Thetotal relative error RE of a photoelectric measurementis expressed as follows'0 :
where p represents the statistical photodetection andscintillation noise, and t2 is the systematic atmospherictransmittance variation error. The suffixes s and rindicate the source and reference source, respectively.The most important error source is represented by termasr, which is the relative variation of atmospherictransmittance AT/T between the measurements of thesource and reference source. Terms is and Or repre-sent the relative errors due to transmittance variationsbetween the measurements of the source or referencesource and the related backgrounds. These errors areproportional to Ar/r and inversely proportional to theSNR. The total relative error depends on the operatingmode used.
The single band modes use (a) four, (b) two, and (c)one-beam basic configurations. Mode (a) requires fourdetectors which simultaneously measure the source plusbackground (S + B), background (B), reference sourceplus background (Sr + Br), and background (Br). Thismode is the optimum one as it zeroes all the systematicerrors in Eq. (1). Mode (b) requires two detectorswhich simultaneously measure (S + B) and (Sr + Br)and successively (B) and (Br). This mode zeroes term0sr in Eq. (1). Mode (c) requires one detector whichsuccessively measures (S + B), (B), (Sr + Br) and (Br).None of the systematic errors of Eq. (1) is zeroed by thismode.
In Fig. 1 the relative error RE is plotted as a functionof the visual magnitude m (extra-atmosphere) of thesource for the operating modes (a) (curve 1), (b) curves
RE sigl ban ImI I IuIeI IeI10 tele cope a 1 (aea . 0.79 ) 5
maueettime 10 e/hnl//
efiny 109//
Fe erree source 10 difeopraictransmittance v .0.8
cuveltou bas/- 2 to tJ/ 0.15)
3 -0 .70) / / /4 oebeam .15 /
.1 L L--- / // ---
6 .8 10 12 14 16 18 20 m
Fig. 1. Relative error RE vs magnitude m of the source for differentoperating modes and atmospheric transmittance variations.
2,3), and (c) (curves 4,5). [A mu = 0 star produces a'luminous flux b1, = 2.65 X 10⁻⁶ lu/M2 outside the at-mosphere. The relationship between magnitudes andfluxes is ma = -2.5 logl (/ID)] All the curves referto a 1-m diam telescope with 2% scintillation, 0.8 at-mospheric transmittance, 10-sec measurement-time perchannel, and 0.1 efficiency. A reference source of m,= 10 has been used.' Curves 2 and 4 are computed forAr/r = 0.15, while curves 3 and 5 for Ar/i = 0.70. Fig-ure 1 shows that the precision advantage of the opti-mum system is not so spectacular with respect to thetwo-beam system.' At m = 17 the precision of the op-timum system is twice the two-beam figure for moderatetransmittance variations. It is about the same up to m,= 12 even for large transmittance variations. Theprecision advantage of the two-beam system with re-spect to the one-beam system is about 1 order of mag-nitude up to m = 14 both for moderate and largetransmittance variations. It is also significant in therange m0 = 14-17. With a 1-m aperture telescope andA/T = 0.15 it is possible to measure a star of m = 13.5with about 15% precision, using the one-beam system.Using the two-beam and optimum systems one canobtain the same precision at m, = 17.5 and m = 18.5,respectively.
The effect of using larger telescopes or longer mea-surement times is to lower curves 1, 2, and 3 by aboutthe same amount, leaving the left part of curves 4 and5 unalterated. The right part of these curves would belowered a little. Therefore, the precision loss of theone-beam system becomes very significant with respectto the other systems.
These considerations indicate that the best com-promise is a photometer which operates in the two-beam mode. The precision loss with respect to an op-timum system is negligible for a wide range of magni-tudes, and it is not dramatic for the faintest sources.On the other hand, the advantage with respect to aone-beam system is very high for a wide range of mag-nitudes and significant for the faintest sources especiallywhen large telescopes are used.
111. Philosophy of the InstrumentThe possibility of integrating a photoelectric pho-
tometer for astronomical purposes to a computer hasbeen pointed out by De Biase and Sedmak,2 ' Warner,'9and Warner and Nather.22 The characteristics ofpresent minicomputers permit the construction of
.measuring structures which do not need very complexhardware and interfacing. Therefore, it is possible togenerate most functions of the instrument by appro-priate software.2'
Our photoelectric photometer has been constructedtaking into account this possibility and the consider-ations of Sec. II. Thus we use two identical channelsto measure the star and reference star simultaneously.The backgrounds are also simultaneously measuredafter shifting the telescope. The separation betweenthe source and background measurements does notintroduce strong errors due to atmospheric transmit-tance variations, since this reflects on the total error
through the reciprocal of the SNR. This is importantonly for the faintest stars.
The structure of the photometer is shown in Fig. 2.The optical multiplexers (MUX) select the opticalbands to be used, and the transducers convert the lightflux into digital information. They consist of twophoton counters. Therefore, the system works in themultiband mode by multiplexing the optical bands inthe two beams, A and B, associated with the source andreference source, respectively. Appropriate measure-ment times are selected for each band depending on themeasured photon flux. The ratio between the mea-surement times assigned to the sources and back-grounds can be selected so as to achieve optimum pre-cision.10 The measurement time for each band can bereached either in a single step, later switching to thenext band, or by sampling all the bands at selected timeintervals until the total measurement time is reached.This sampling mode is important to avoid spectraldistortions. It may also be important for minimizingthe effect of scintillation when the star and referencestar are observed within the scintillation correlationradius.",8"10 The photon-counting technique permitsan improvement in precision with respect to othertechniques especially for the faintest signals.23 Thenonlinearity at high counting rates due to statisticalcounting losses can easily be taken into account by thecomputer up to about 50% of the limiting countingrate.2 4
As one can see from Fig. 2, this system can be used asa multipurpose photometer simply by using the ap-propriate software for the various kinds of researches.Eclipsing binaries (long and short periods), nonperiodicfast variables, and pulsars can be easily accommodatedby this photometer.
IV. Structure and Design or the Instrument
The basic design of the photometer is shown in Fig.3. A Digital Equipment PDP 11/10 computer is used.Two optical multiplexers (MUX) A and B, mounted onthe same optical system, provide the selection of theoptical bands and the irradiation of the two photo-multipliers (PM), one for each MUX. The chargepulses at the output of the PMs enter two EMR pad-631discriminators, and the pulses discriminated are thencounted by two KW11-P real-time clocks (RTC) and
Fig. 3. Configuration of the photometer. The optical multiplexers(MUX) are the only parts external to the computer.
B
II
I. �1�:1I. , I5 I
I II I
'CA
.Y _ .
B, 11 - B
-Z I
_ , .
I:: CONTROL
Us E~~~EPIECE
FILTER WHEEL
o, PI _ pad FL LStES
. | ~~~~~~~CONTROLS
X_ OFT CAL MUT
2 LARGE FIELDEYEPIECE
Fig. 4. Structure of the photometer optical parts.
started and stopped by the computer. The computerstores in its memory the counts collected for each opticalband and for each MUX. The output of the basicstructure is a teletype (TTY). The computer controlsthe MUX's through a DR11-C digital input-outputinterface (I/O). An analog ARi subsystem, includingtwo D/A converters, provides for analog two-channelmonitoring. This is accomplished by a two-channelstrip-chart recorder in the basic structure, but a videodisplay can easily be used as an alternative. A furtherKW11-P RTC provides for the timing of all the systemoperations. An external clock can also be used forparticular purposes needing high precision of timing.A schematic diagram of the optical parts of the pho-tometer is shown in Fig. 4. It is shown only in channelA, since channel B is identical to A. These are the onlyparts which are not integrated to the computer, ex-cepting the power supplies. The two optical heads, Aand B, can be rotated about the telescope axis andmoved back and forth on the focal plane. The largefield eyepiece, which moves independently on the twoheads, is used to point the two stars to be observedwithin the stellar field under consideration. The two
heads are then rotated and translated so as to interceptthe star and reference star with the two plane mirrors,a and b. These reflect the light beams as they passthrough the diaphragm holes which can be changed bya rotating wheel. The movable plane mirror c and thecontrol by a rotating wheel. The movable plane mirrorc and the control eyepiece check the correct position ofthe stars in the diaphragm. A set of neutral filters,which are used to observe bright stars, is mounted ona wheel, whose rotation provides either selection of theappropriate filter or a position without filters. A fieldlens, placed behind the neutral filter wheel, providescorrect irradiation of the photomultiplier. The MUXconsists of a light metal wheel on which twenty-fourequispaced optical filters are mounted. During therotation each filter intercepts the light beam after it haspassed through the field lens. The emerging parallellight beam then irradiates the photomultiplier. Thewheel is mounted on the shaft of a SIGMA 20-2223stepping motor (200 steps/revolution) which rotates thewheel itself. The stepping motor is activated by thecomputer through the I/O interface and a SIGMA29A20 power module. A specially built viscous frictionconnects the wheel to the motor shaft so as to damposcillations when the filter wheel stops. The positionof the filters is determined by a trimstep incrementalencoder (200 bit/revolution) integrated to the motor.The encoder has an absolute zero marker which is usedto control the correct sequence of the filters during anyrotation. This control is obtained by sending the en-coder pulses to the computer through the I/O interface.The computer compares the number of pulses receivedwith the control pulses sent to the stepping motor. Thecomputer enables the measurements in each band onlywhen the correct filter position is reached.
The great flexibility of the processor used and themodularity of the input-output electronics have per-mitted the construction of a simple and reliable struc-ture. Photon-counting has been obtained by two RTC'sused in the external frequency mode. All the com-mands and controls are executed through a single digitalI/O interface, while the measurement times and thesystem timing are given by a third RTC. The analogsubsystem provides for monitoring the measurements-in either two selected optical bands or one if a videodisplay is used. This subsystem may accept up to six-teen multiplexed analog input channels. Therefore, itis possible to use these inputs for analog photometry ofvery bright stars and possibly for monitoring skytransparency, scintillation, or other quantities of in-terest. An external clock can be connected to the RTCin the analog subsystem. The information exchangebetween the peripherals and the processor is imple-mented by a unique multichannel bus (UNIBUS) whichis integrated to the computer.
A summary of the main characteristics of the basicconfiguration of the photometer can be given as fol-lows:
(1) Input = two beams, two detectors, photoncounting.
(2) Output = teletype hard copy and punched papertape (10 characters/sec).
(3) Optical bands = up to 10, selected from thetwenty-four bands.
(4) Monitor = two analog channels (5 V) assignedto two selected optical bands.
(5) Measurement modes = (a) single cycle; (b)multiple cycle (by summing single cycles).
(6) Stepping motor switching time ~3 X 10⁻³ sec/step (1.80/step).
(7) Time base precision (internal mode) 10-6sec/day.
(8) Time insertion precision (manual mode) 10-'sec.
(9) Time base resolution 10-4 sec.(10) Single-cycle duration = (a) min = 1 sec; (b)
max = 30 sec.(11) Multiple cycle duration = (a) min = 1 sec; (b)
max = 32,767 sec.(12) Maximum time scale capability = 32,767 sec.(13) Overflow (hardware + software) = 231-1
counts.(14) Memory = 16-kwords total, 4 kwords are used
for the program and 12 kwords for data storage.(15) Control terminal = teletype keyboard.(16) Distance between star and reference star (in
the focal plane) = (a) min = 20 mm; (b) max = 150mm.
V. Software of the System
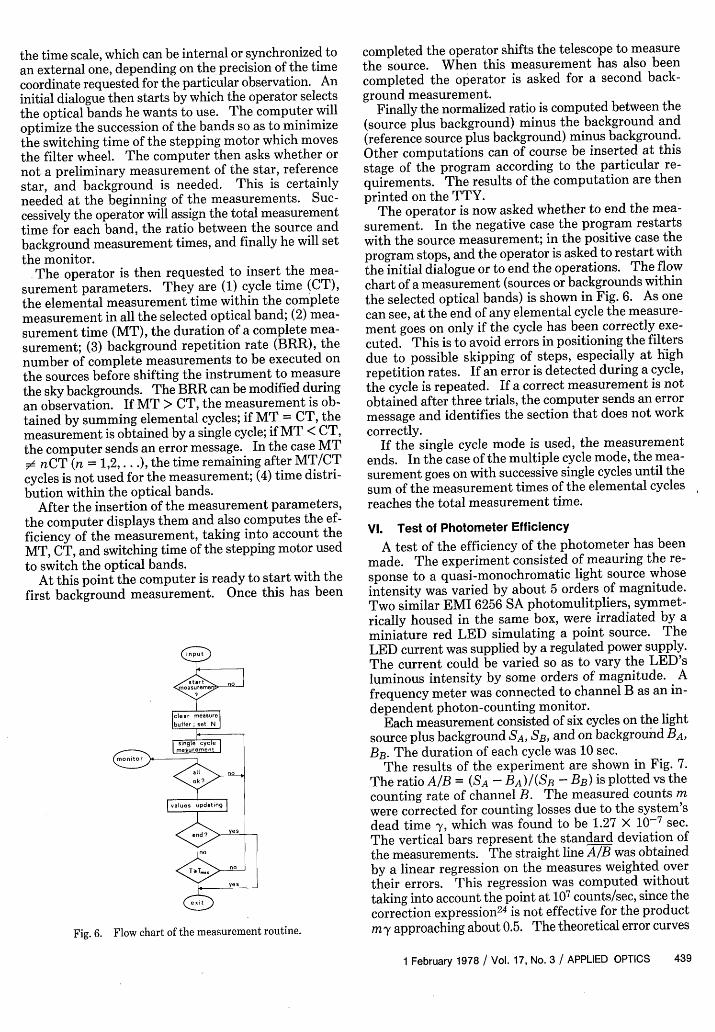
The general structure of the system program is shownin Fig. 5. After starting the program, one can initialize
the time scale, which can be internal or synchronized to
an external one, depending on the precision of the timecoordinate requested for the particular observation. Aninitial dialogue then starts by which the operator selectsthe optical bands he wants to use. The computer willoptimize the succession of the bands so as to minimizethe switching time of the stepping motor which movesthe filter wheel. The computer then asks whether ornot a preliminary measurement of the star, referencestar, and background is needed. This is certainlyneeded at the beginning of the measurements. Suc-cessively the operator will assign the total measurementtime for each band, the ratio between the source andbackground measurement times, and finally he will setthe monitor.
The operator is then requested to insert the mea-surement parameters. They are (1) cycle time (CT),the elemental measurement time within the completemeasurement in all the selected optical band; (2) mea-surement time (MT), the duration of a complete mea-surement; (3) background repetition rate (BRR), thenumber of complete measurements to be executed onthe sources before shifting the instrument to measurethe sky backgrounds. The BRR can be modified duringan observation. If MT > CT, the measurement is ob-tained by summing elemental cycles; if MT = CT, themeasurement is obtained by a single cycle; if MT < CT,
the computer sends an error message. In the case MTid nCT (n = 1,2,. . .), the time remaining after MT/CTcycles is not used for the measurement; (4) time distri-bution within the optical bands.
After the insertion of the measurement parameters,the computer displays them and also computes the ef-ficiency of the measurement, taking into account theMT, CT, and switching time of the stepping motor usedto switch the optical bands.
At this point the computer is ready to start with thefirst background measurement. Once this has been
Fig. 6. Flow chart of the measurement routine.
completed the operator shifts the telescope to measurethe source. When this measurement has also beencompleted the operator is asked for a second back-ground measurement.
Finally the normalized ratio is computed between the(source plus background) minus the background and(reference source plus background) minus background.Other computations can of course be inserted at thisstage of the program according to the particular re-quirements. The results of the computation are thenprinted on the TTY.
The operator is now asked whether to end the mea-surement. In the negative case the program restartswith the source measurement; in the positive case theprogram stops, and the operator is asked to restart withthe initial dialogue or to end the operations. The flowchart of a measurement (sources or backgrounds withinthe selected optical bands) is shown in Fig. 6. As onecan see, at the end of any elemental cycle the measure-ment goes on only if the cycle has been correctly exe-cuted. This is to avoid errors in positioning the filtersdue to possible skipping of steps, especially at highrepetition rates. If an error is detected during a cycle,the cycle is repeated. If a correct measurement is notobtained after three trials, the computer sends an errormessage and identifies the section that does not workcorrectly.
If the single cycle mode is used, the measurementends. In the case of the multiple cycle mode, the mea-surement goes on with successive single cycles until thesum of the measurement times of the elemental cyclesreaches the total measurement time.
VI. Test of Photometer Efficiency
A test of the efficiency of the photometer has beenmade. The experiment consisted of meauring the re-sponse to a quasi-monochromatic light source whoseintensity was varied by about 5 orders of magnitude.Two similar EMI 6256 SA photomulitpliers, symmet-rically housed in the same box, were irradiated by aminiature red LED simulating a point source. TheLED current was supplied by a regulated power supply.The current could be varied so as to vary the LED'sluminous intensity by some orders of magnitude. Afrequency meter was connected to channel B as an in-dependent photon-counting monitor.
Each measurement consisted of six cycles on the lightsource plus background SA, SB, and on background BA,
BB. The duration of each cycle was 10 sec.The results of the experiment are shown in Fig. 7.
The ratio A/B = (SA - BA)/(SB - BB) is plotted vs thecounting rate of channel B. The measured counts mwere corrected for counting losses due to the system'sdead time y, which was found to be 1.27 X 10⁻⁷ sec.The vertical bars represent the standard deviation ofthe measurements. The straight line A/B was obtainedby a linear regression on the measures weighted overtheir errors. This regression was computed withouttaking into account the point at 107 counts/sec, since thecorrection expression24 is not effective for the productmy approaching about 0.5. The theoretical error curves
(poissonian statistics at one standard deviation) are alsoshown in Fig. 7. The extra-atmospheric visual magni-tudes of the source corresponding to the counting ratesare also given for a 0.1 efficiency and a 1-iM2 collectingarea.
As one can see, the line A/B is practically parallel tothe abscissa. The computed slope is about 10-4. Thismeans that the ratio of the measurements of the samesource for the two channels is nearly constant over adynamic range of some 5 orders of magnitude for theconsidered measurement time.
VII. Discussion
From the considerations of the previous sections andthe test discussed in Sec. VI, we find that the basicmachine shows a high degree of performance in photo-electric photometry even with moderately large tele-scopes. It appears that the precision of such a systemmay be equivalent to that of a classical one-beam systemworking with a telescope twice as large for a few percentof atmospheric transmittance variations. As pointedout in Sec. IV, the distance between the star and refer-ence star images in the focal plane varies from a mini-mum of 20 mm to a maximum of 150 mm. This corre-sponds to a sky field varying from about 4' X 4' to about.30' X 30' which is of the same order of the useful fieldof telescopes normally used in photometry. Thereforeno severe constraints are imposed on the choice of thereference star, since it is highly probable to find a starof m = 10 in a 20' X 20' field. This magnitude ap-proximately corresponds to the crossover betweenscintillation and photon noise so that there is no ad-vantage in choosing brighter reference stars, which arevery difficult to be found in such a field.1 However, theminimum distance imposes constraints on the possi-
Fig. 7. Results of the test of the photometer. The ratio (A/B) of thesignals from the two channels is plotted vs the reference channel B.The vertical bars indicate the measured standard deviation. Thecounts are corrected for the system dead time. The magnitude scaleis computed extra-atmosphere for a 1-M2 collecting area and 10%
efficiency.
bility of observing the two stars within the scintillationcorrelation radius in order to minimize scintillationerrors. This radius seems to be smaller than 4 min of'arc even for large telescopes. The over-all efficiency ofthis system (source measurement time/total measure-ment time) is also higher than that of a classical one.Following the considerations on the optimum timing,"'10
it appears that the four-beam system has the maximumefficiency of 100% per band. The present two-beamsystem approaches the 100% figure for bright stars, andit cannot be smaller than 50% even for the faintest stars.The one-beam system has a maximum efficiency lessthan 50% for bright stars, and it may decrease to aminimum of 25% for the faintest stars if the referencestar is also faint. It must be pointed out that the timerequired to set up on two stars could slightly affect theefficiency of the two-beam mode of operation. Theefficiency should decrease as the number of the stars tobe observed during a night increases, and it should in-crease as the experience of the astronomer increases.
As shown in Fig. 7, this photometer is practicallyunaffected by atmospheric transmittance variationsoccurring during the simultaneous measurement of thestar and reference star. Furthermore it appears thatthe reference star may even be very different in mag-nitude from the star observed.
As already pointed out, the philosophy adoptedpermits a high degree of flexibility and optimization ofthe system, even in the basic configuration. Since thephotometer is implemented in practice by its software,it is easy to improve the degree of optimization. It hasbeen emphasized10,2' that an adaptive system reachesthe highest over-all efficiency. This is not too far fromthe possibilities of our system.
In the present structure, the memory not allocatedfor the program is used as a circulating buffer to storethe data to be printed by the teletype when the rate ofdata collection exceeds the printing capability. Usingthe minimum timing 1, sec/cycle, we estimate that thetime required to saturate the circulating buffer capacityis about lh/band.
On the other hand, shorter timings could be neededto observe pulsars or nonperiodic fast phenomena. Inthe case of pulsar observations one cannot use the op-tical multiplexer technique, since the time constraintsexceed the capabilities of the stepping motor used. Itis possible to work in a single optical band and to usevery short measurement times. An external clock isalso needed in this case for accurate results. In the caseof multiband photometry of nonperiodic fast phe-nomena, a recent analysis' has shown that the optimumtiming ranges from about 0.3 sec to 2 sec, which iscomparable to the capability of the photometer in thebasic structure. If the rate of data collection is high andthe observation time is long, one can either delete orcompact less important parts of the observations or usea high speed mass storage device.
It seems that this photometer has some advantageswith respect to other similar systems. Geyer andHoffmann's2 0 photometer has the same basic opticalstructure, but its efficiency and precision seem to be
intrinsically smaller than ours. The limits are due tothe current integration technique, which does not op-timize the SNR and to the switching time of the opticalmultiplexer, which affects the efficiency of the system.
No flexibility is allowed for this system. Warner's 2 0
photometer is very similar to our machine. The pre-cision and the efficiency should be comparable to our
figures. The differences are mainly in our philosophy,which has been possible due to the particular structure
of the computer used. The system presented hereseems essentially more flexible against the various ob-
servational constraints and more reliable and simplerthan Warner's photometer.
This instrument is the result of work done in recentyears by an Italian Technological Group (URSA). We
thank G. Godoli who was the first to organize a group
discussion on photometric systems; S. Cristaldi, A.
Piccioni, and G. Colla for their contributions duringearly developments of this program; the Staff of theLaboratories of the Trieste Observatory for the con-struction of the prototype.
Four machines have been built and will be mountedin the Catania, Milan, Naples, and Trieste Observa-tories. The whole program was supported under sev-eral contracts from the Consiglio Nazionale delle Ri-
cerche through the Settore di Fisica Stellare e dellaGalassia and the Settore di Tecnologie Astronomicheof the Gruppo Nazionale di Astronomia.
References1. G. Belvedere and L. Paternb, Astron. Astrophys. 51, 199
(1976).2. A. T. Young, Rev. Sci. Instrum. 36, 394 (1966).
3. A. T. Young, Astron. J. 72, 747 (1967).
4. A. T. Young, Observatory 88, 151 (1968).
5. A. T. Young, Appl. Opt. 8, 869 (1969).
6. A. T. Young, Appl. Opt. 8, 2431 (1969).
7. A. T. Young, in Methods of Experimental Physics, L. Marton,Ed. (Acqdemic, New York, 1974), Vol. 12, pp. 95-192.
8. A. T. Young, Astrophys. J. 189, 587 (1974).
9. G. Sedmak, Astron. Astrophys. 18, 232 (1972).
10. G. Sedmak, Astron. Astrophys. 25, 41 (1973).
11. V. 1. Tatarski, Wave Propagation in a Turbulent Medium (Dover,
New York, 1967).
12. R. E. Hufnagel, in Restoration of Atmospherically Degraded
Images (National Academy of Sciences, Washington, D.C., 1966),
Vol. 2, App. 3.13. D. L. Fried, J. Opt. Soc. Am. 55, 1427 (1965).
16. A. M. Mikesell, Publ. U.S. Naval Obs. Ser. 2 17, 141 (1955).
17. L. Patern6, Astron. Astrophys. 47, 437 (1976).
18. H. A. Panofsky, Radio Sci. 4, 1101 (1969).
19. B. Warner, in IAU Coll. 15, Veroeff. Bamberg 144 (1971).
20. E. H. Geyer and M. Hoffmann, Astron. Astrophys. 38, 359
(1975).21. G. A. De Biase and G. Sedmak, Astron. Astrophys. 33, 1
(1974).22. B. Warner and R. E. Nather, Mon. Not. R. Astron. Soc. 152, 209
(1971).23. R. R. Alfano and N. Ockman, J. Opt. Soc. Am. 58, 90 (1968).
24. J. D. Fernie, Publ. Astron. Soc. Pac. 88, 969 (1976).
INTERNATIONAL SYMPOSIUM
ON
OPHTHALMOLOGICAL OPTICS
(I. S. O. 0.)
May 7th (Sun.) - 9th (Tue.), 1978
Tokyo, Japan
Announcement of the Society
of Ophthalmological Optics of Japan
The Society of Ophthalmological Optics of Japanis a unique organization with members representing
such diverse fields as applied physics, engineering,electronics, optics and ophthalmology.At present the Society has about 200 members,many of whom have contributed significantly to thefields of visual physiology and physiological optics.
Historically, the Society began as an informal
group of ophthalmologists and optical engineers led
by Prof. M. Kajiura of Fukushima Medical College,
Fukushima, Japan.In time, the group attracted more members, who,
in November 1 964, decided to change the informal
meetings into open sessions where papers could be
read.
In November 1 965, the First Japanese Congress
of Ophthalmological Optics was organized, and since
then, the Society has received official national re-cognition as "the Society of Ophthalmological Op-tics of Japan".The Congress is now regularly opened once a year,
and currently, from November 21 to 22 1976, theCongress convened in Tokyo.
Now, it is the Society's concern that this Con-
gress be opened on the international level to the
ophthalmologists and allied personnels working in
cooperating fields of science.With this in mind, the Society wishes to invite in-terested persons to attend the First InternationalSymposium on Ophthalmological Optics (I.S.O.O.) to
be held from May 8 (Mon) to 9 (Tue), 1978, in
Tokyo, to coincide with the 23rd International Con-gress of Ophthalmology, which will convene inKyoto.
All correspondence should be addressed to:
Secretariat
International Symposium onOphthalmological Optics (I.S.O.O.)
c/o Dept. of Ophthalmology,Fukushima Medical College,4-45, Sugitsuma-cho, Fukushima, 960 Japan