43
US and Global Economic Outlook: The Consumer View Chris G. Christopher, Jr., Ph.D. Director, US Macro & Global Consumer IHS Global Insight Program Sponsor
| Date post: | 29-Jan-2018 |
| Category: |
Technology |
| Upload: | vivastream |
| View: | 721 times |
| Download: | 3 times |

US and Global Economic Outlook:The Consumer View
Chris G. Christopher, Jr., Ph.D.
Director, US Macro & Global Consumer
IHS Global Insight
Program Sponsor

Global Consumer Market Dynamics
Global consumer market dynamics
• Global consumption growth will hang with global GDP growth.
• consumer spending growth.
• Emerging market consumer spending growth far outpaces US.
• Eurozone (especially southern-tier) hurting.
• Global and regional consumer price inflation modest ; weak global demand; high unemployment rates in US and Eurozone; weak wage gains.
• Global consumer spending as percentage GDP is likely to fall.
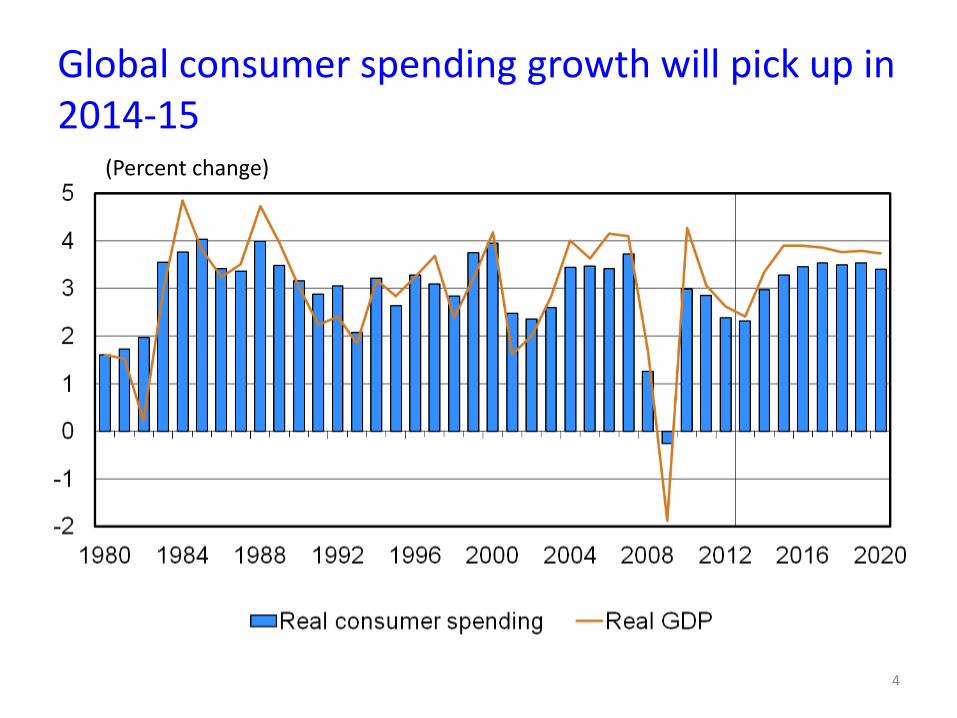
(Percent change)
Global consumer spending growth will pick up in 2014-15
4
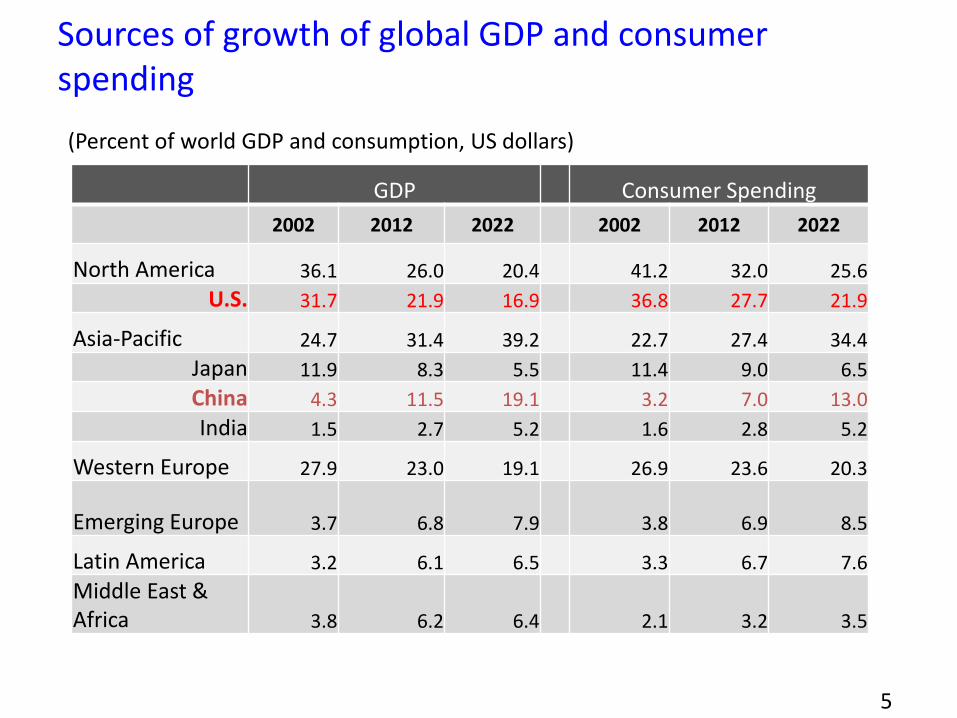
Sources of growth of global GDP and consumer spending
GDP Consumer Spending
2002 2012 2022 2002 2012 2022
North America 36.1 26.0 20.4 41.2 32.0 25.6
U.S. 31.7 21.9 16.9 36.8 27.7 21.9
Asia-Pacific 24.7 31.4 39.2 22.7 27.4 34.4
Japan 11.9 8.3 5.5 11.4 9.0 6.5
China 4.3 11.5 19.1 3.2 7.0 13.0
India 1.5 2.7 5.2 1.6 2.8 5.2
Western Europe 27.9 23.0 19.1 26.9 23.6 20.3
Emerging Europe 3.7 6.8 7.9 3.8 6.9 8.5
Latin America 3.2 6.1 6.5 3.3 6.7 7.6
Middle East & Africa 3.8 6.2 6.4 2.1 3.2 3.5
(Percent of world GDP and consumption, US dollars)
5

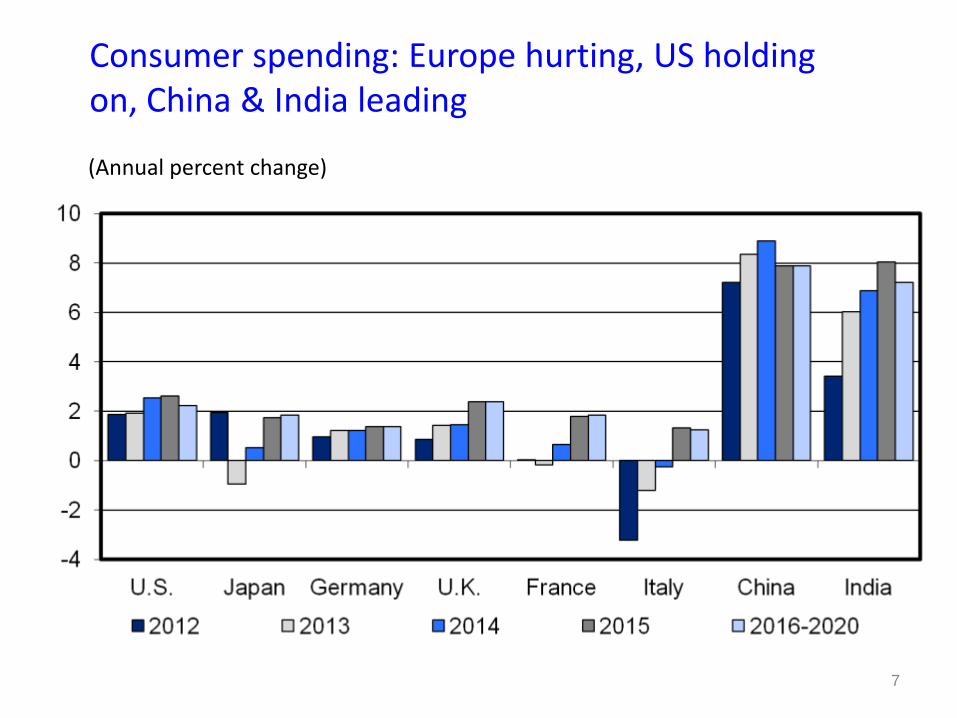
(Annual percent change)
6
Real consumer spending growth will be led by emerging regions
(Annual percent change)
7
Consumer spending: Europe hurting, US holding on, China & India leading
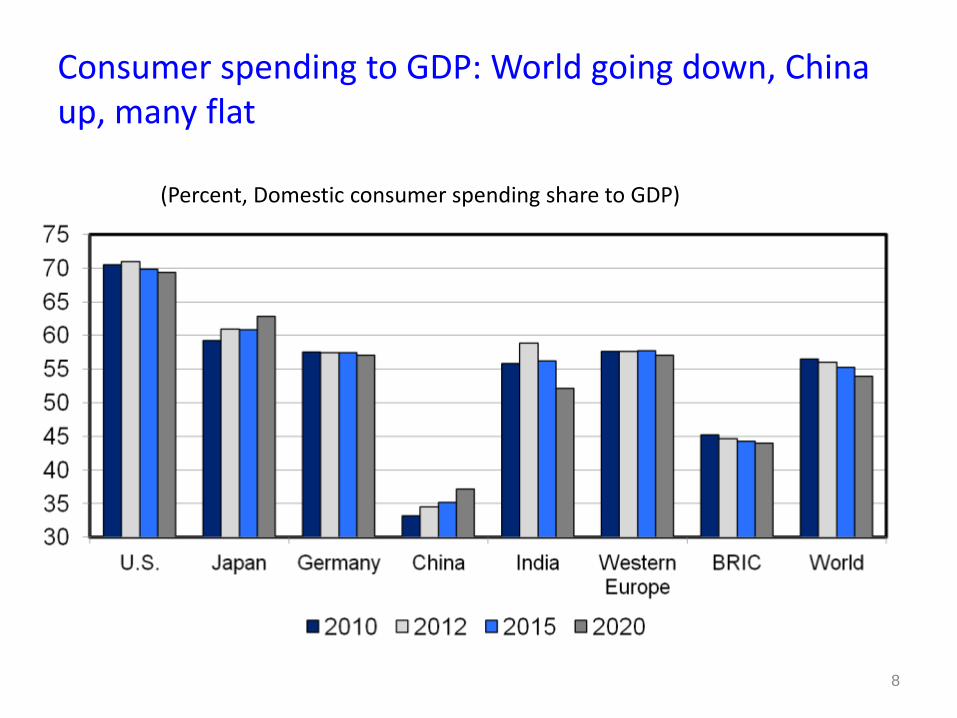
Consumer spending to GDP: World going down, China up, many flat
8
(Percent, Domestic consumer spending share to GDP)

Consumer markets ranking
9
* Consumer spending: billions of US$; Consumption per capita: US$
2012 Consumer
spending*
Consumption
per capita
1 United States 11,119 35,347
2 Japan 3,631 28,467
3 China 2,837 2,095
4 Germany 1,953 23,845
5 United Kingdom 1,602 25,332
6 Brazil 1,512 7,623
7 France 1,503 23,639
8 Italy 1,217 19,959
9 India 1,124 893
10 Canada 990 28,415
2022 Consumer
spending*
Consumption
per capita
1 United States 16,376 48,234
2 China 10,180 7,311
3 Japan 4,911 39,741
4 India 3,918 2,766
5 Germany 3,055 37,029
6 Brazil 2,950 13,855
7 United Kingdom 2,850 41,850
8 France 2,451 36,823
9 Russia 2,034 14,498
10 Italy 1,885 30,789
Emerging market consumers: new drivers of global growth
• US consumer spending growth is being eclipsed by emerging markets. Pay check cycle more relevant, middle tier losing ground, median household income falling.
• Western European consumer hurting, and BRIC consumer gaining ground.
• US and Western Europe retail is a battle for market share.
• Global GDP growth is depending more on emerging market consumers.
• Emerging market consumers are viewed as “low-hanging fruit.”
• Recently, emerging market consumers getting “first dibs.”

11
The rise of the emerging market consumer
(Percent, Domestic consumption to World GDP)
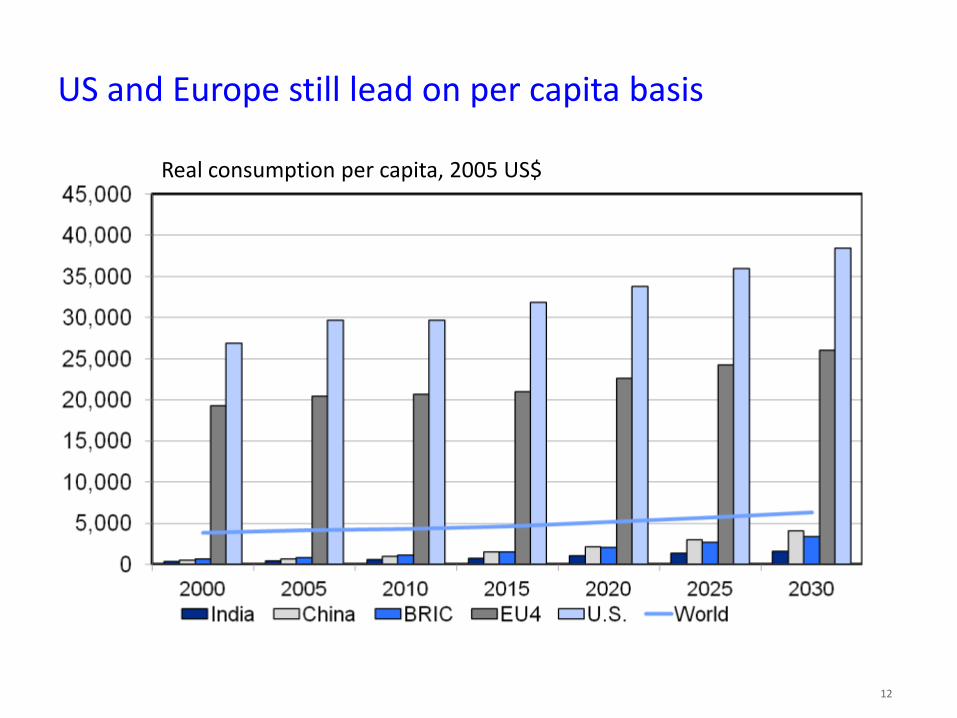
US and Europe still lead on per capita basis
Real consumption per capita, 2005 US$
12
13
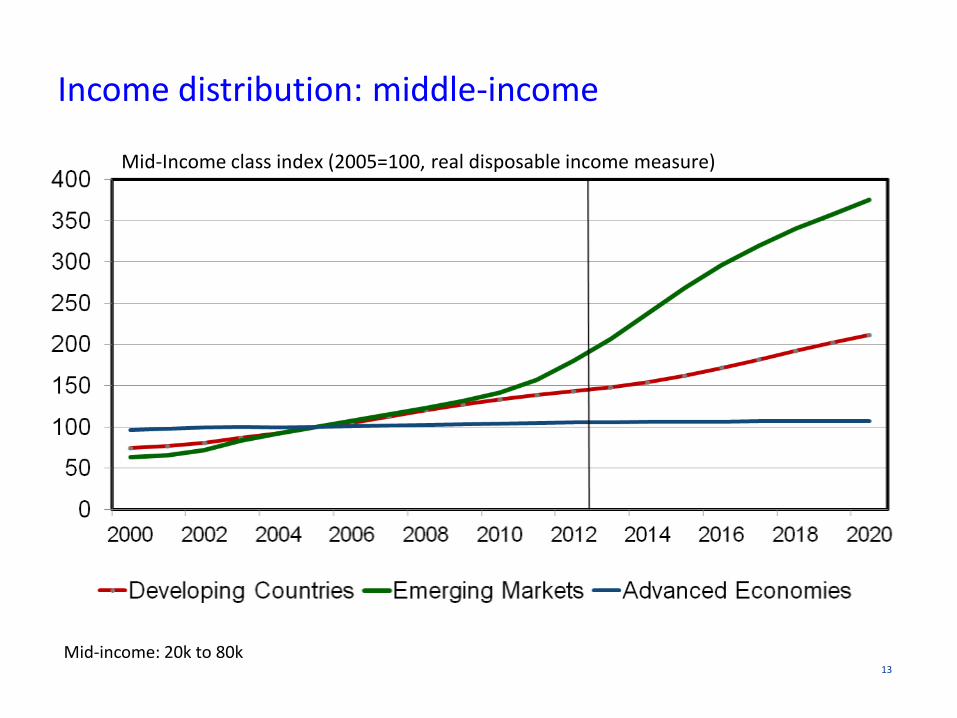
Income distribution: middle-income
Mid-Income class index (2005=100, real disposable income measure)
Mid-income: 20k to 80k

14
Income distribution: wealthy
Wealthy class index (2005=100, real disposable income measure)
Wealthy: >80k
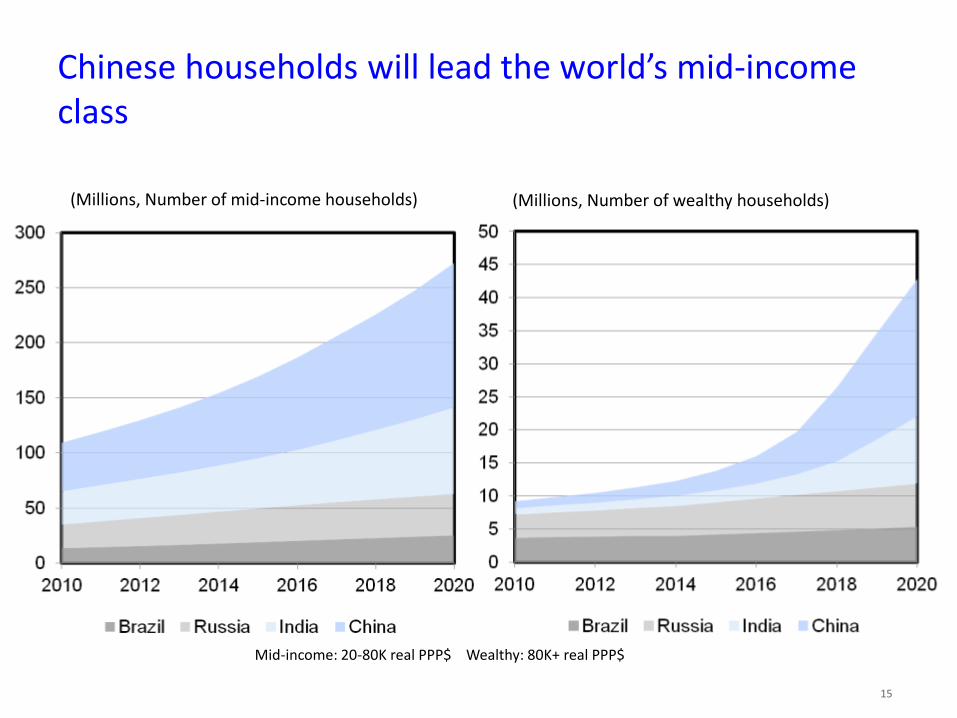
Chinese households will lead the world’s mid-income class
15
(Millions, Number of mid-income households) (Millions, Number of wealthy households)
Mid-income: 20-80K real PPP$ Wealthy: 80K+ real PPP$
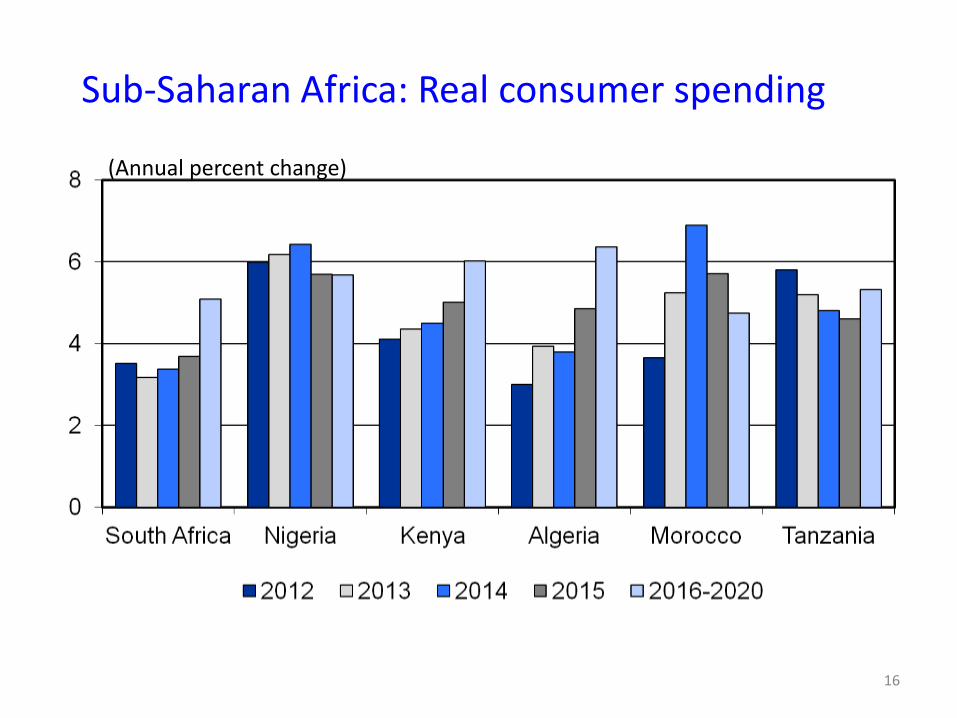
(Annual percent change)
Sub-Saharan Africa: Real consumer spending
16

Food for thought: Engel’s law in action
(Food spending in total consumption)
Income per capita(Thousand of US$)
(Entertainment spending in total consumption)
Income per capita(Thousand of US$)
2010 data for 25 countries: Austria Azerbaijan Belgium Brazil Canada China Germany Denmark Spain Finland France United Kingdom Ireland Italy Japan Netherlands Portugal Russia Sweden Turkmenistan United States Uzbekistan Venezuela South Africa

Food still a large share of household budgets in emerging markets
18
US Consumer Expenditure Share by CategoryChina Consumer Expenditure Share by Category
US Consumer Markets
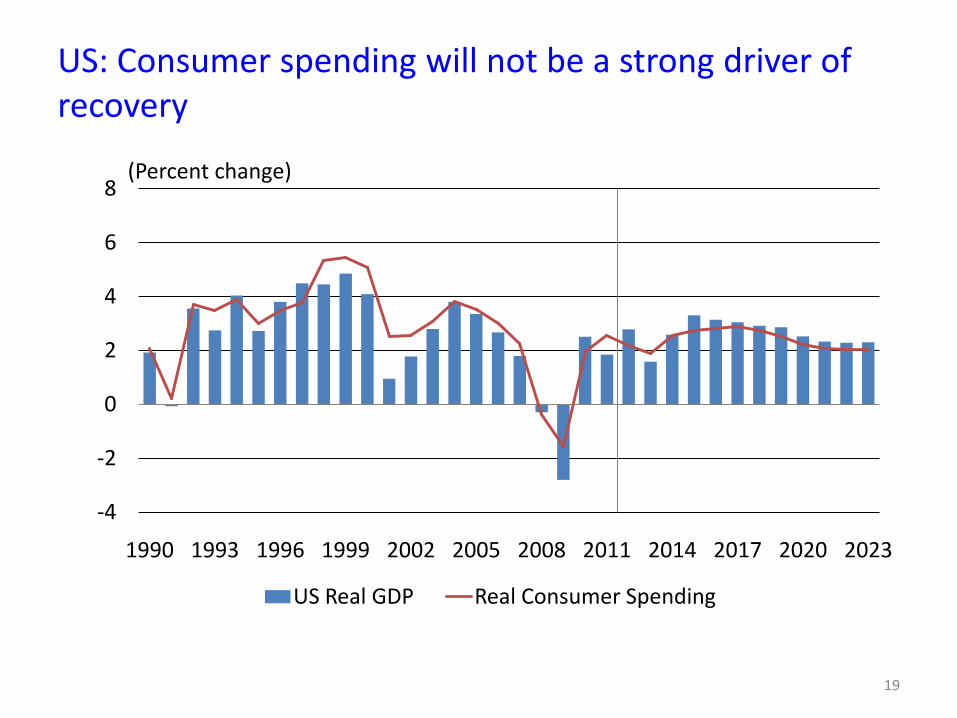
(Percent change)
US: Consumer spending will not be a strong driver of recovery
19
-4
-2
0
2
4
6
8
1990 1993 1996 1999 2002 2005 2008 2011 2014 2017 2020 2023
US Real GDP Real Consumer Spending

2012 2013 2014 2015
Real Consumption 2.2 1.9 2.5 2.7
Real Disposable Income 2.0 0.3 3.7 3.4
Real Household Net Worth 8.0 8.8 3.4 1.3
Payroll Employment 1.7 1.6 1.6 1.8
Real Wage Rate 0.0 0.8 0.8 0.7
Consumption Price Deflator 1.8 1.2 1.4 1.5
Light-Vehicle Sales (Millions) 14.4 15.5 15.9 16.3
Home Sales* (Millions) 4.50 5.01 5.61 6.1
(Percent change unless noted)
* Single-family new and existing homes
US: Consumer markets environment
20
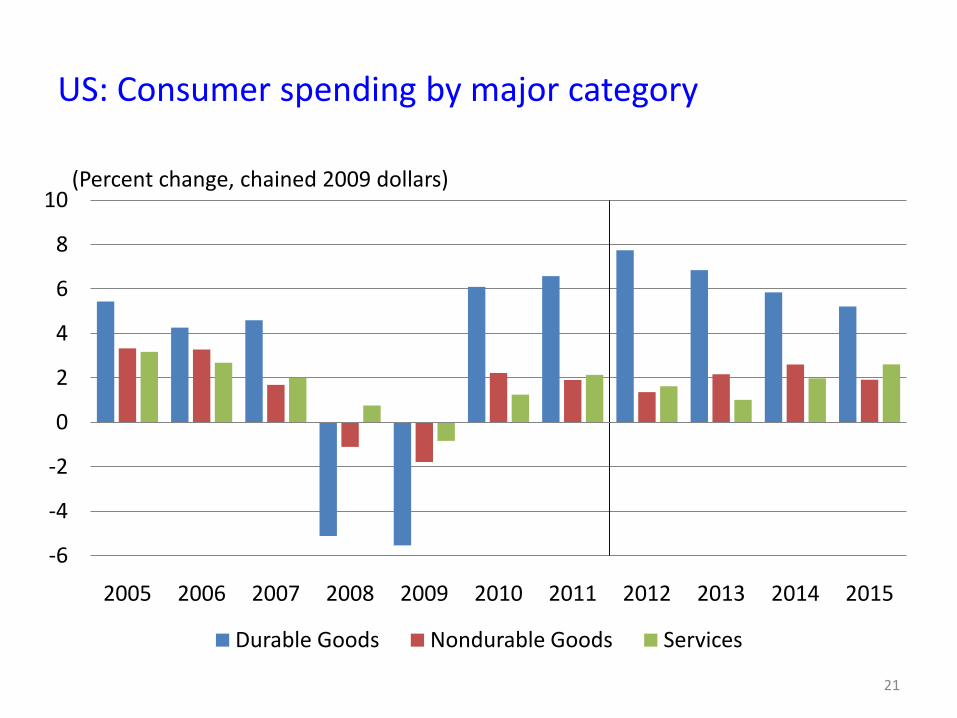
(Percent change, chained 2009 dollars)
US: Consumer spending by major category
21
-6
-4
-2
0
2
4
6
8
10
2005 2006 2007 2008 2009 2010 2011 2012 2013 2014 2015
Durable Goods Nondurable Goods Services

US consumer sentiment rebounding, but households still cautious
22
0
20
40
60
80
100
120
140
160
Aug-81 Aug-85 Aug-89 Aug-93 Aug-97 Aug-01 Aug-05 Aug-09 Aug-13
Reuters/University of Michigan Index, 1966=100 Conference Board Consumer Confidence Index, 1985=100
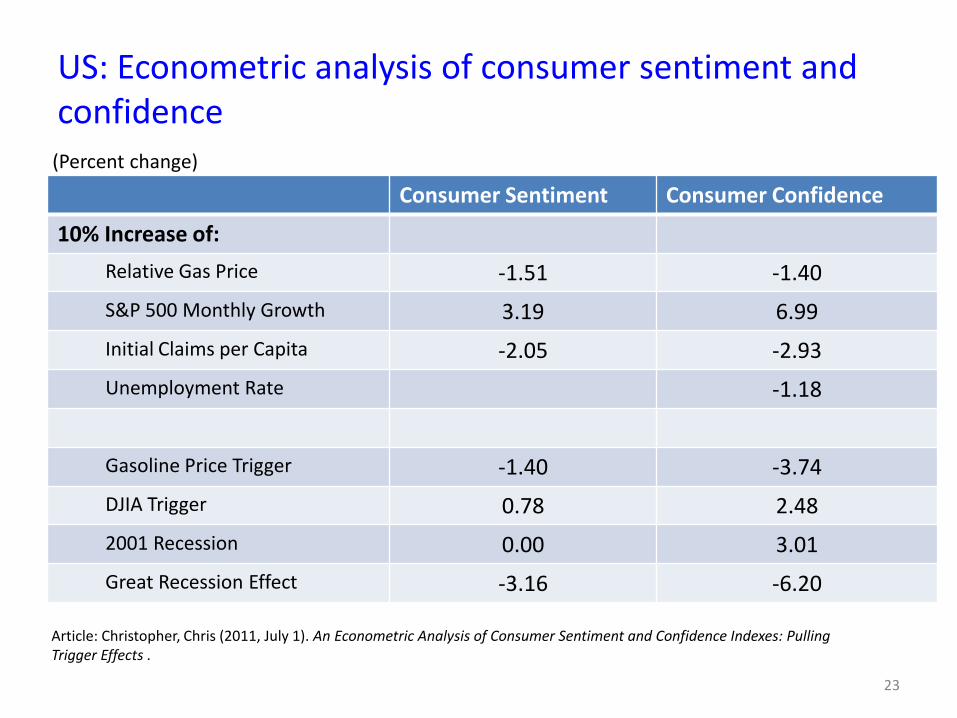
US: Econometric analysis of consumer sentiment and confidence
23
Consumer Sentiment Consumer Confidence
10% Increase of:
Relative Gas Price -1.51 -1.40
S&P 500 Monthly Growth 3.19 6.99
Initial Claims per Capita -2.05 -2.93
Unemployment Rate -1.18
Gasoline Price Trigger -1.40 -3.74
DJIA Trigger 0.78 2.48
2001 Recession 0.00 3.01
Great Recession Effect -3.16 -6.20
(Percent change)
Article: Christopher, Chris (2011, July 1). An Econometric Analysis of Consumer Sentiment and Confidence Indexes: Pulling Trigger Effects .
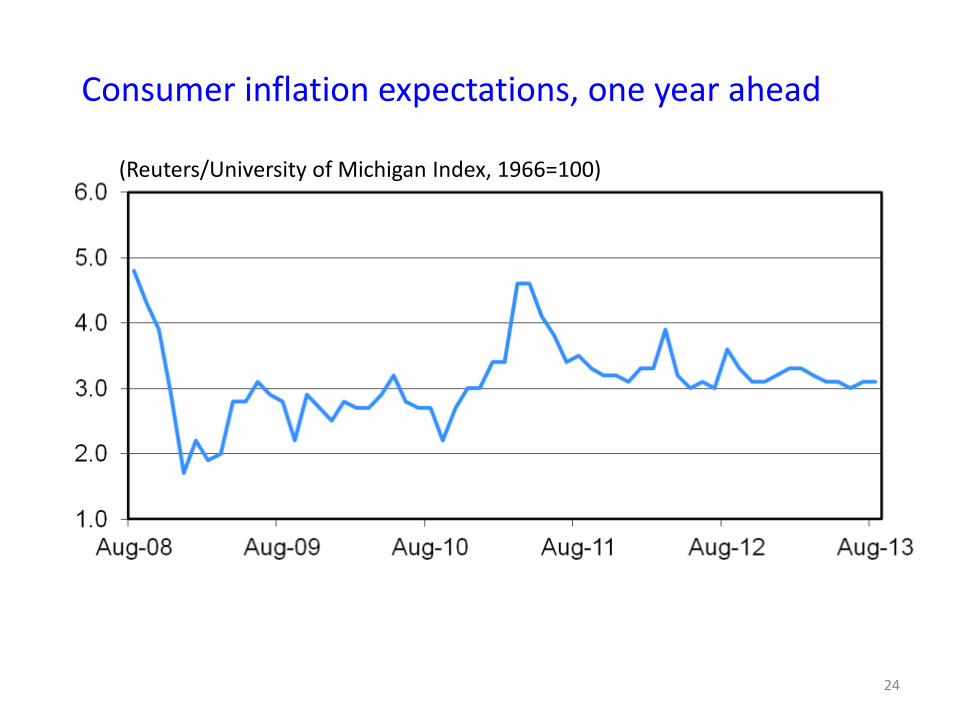
(Reuters/University of Michigan Index, 1966=100)
Consumer inflation expectations, one year ahead
24
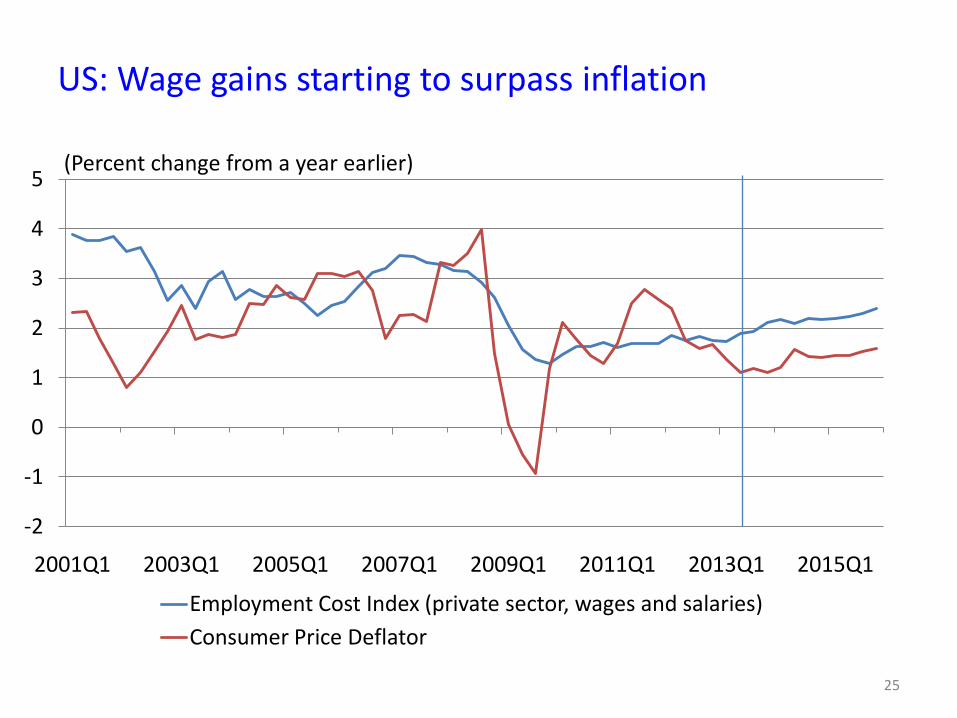
(Percent change from a year earlier)
US: Wage gains starting to surpass inflation
25
-2
-1
0
1
2
3
4
5
2001Q1 2003Q1 2005Q1 2007Q1 2009Q1 2011Q1 2013Q1 2015Q1
Employment Cost Index (private sector, wages and salaries)
Consumer Price Deflator

(Billions of US dollars, SAAR)
Revolving debt (mainly credit cards) anemic gains
26
800
850
900
950
1000
1050
Jul-08 Jul-09 Jul-10 Jul-11 Jul-12 Jul-13
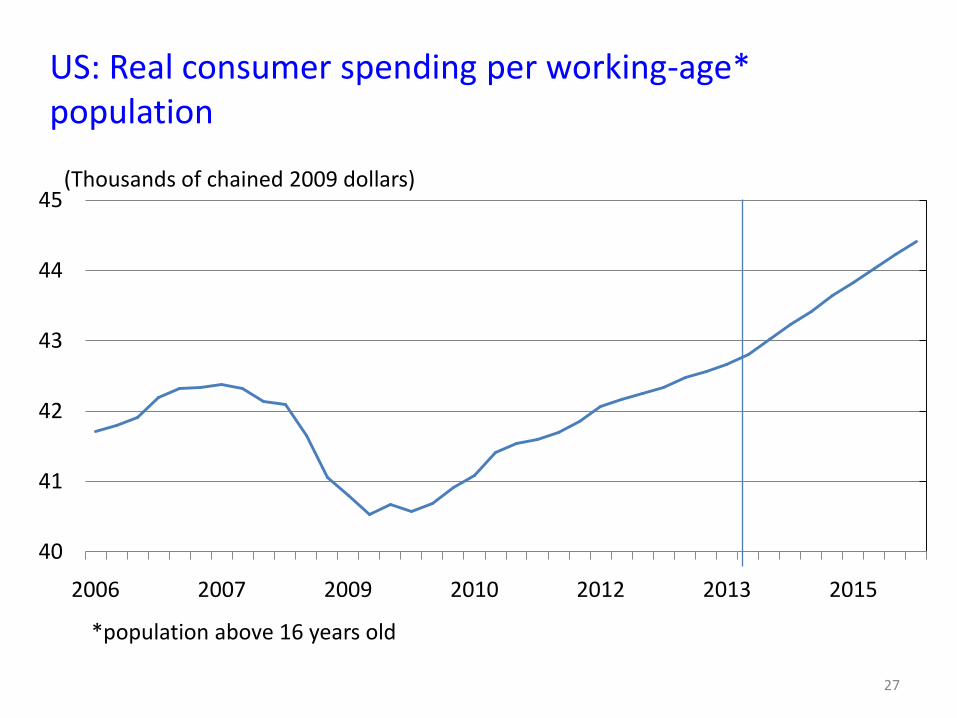
(Thousands of chained 2009 dollars)
US: Real consumer spending per working-age* population
27
*population above 16 years old
40
41
42
43
44
45
2006 2007 2009 2010 2012 2013 2015

American’s Time Spent Shopping
28
Source: Bureau of Labor Statistics: American Time Use Survey
10
15
20
25
30
35
40
45
2006 2007 2008 2009 2010 2011
Total Men Women
Time Spent Shopping during Weekdays
Average Minutes per Day
10
15
20
25
30
35
40
45
2006 2007 2008 2009 2010 2011
Total Men Women
Time Spent Shopping during Weekends & Holidays
Average Minutes per Day
The Demographic Effect

Demography & generational issues
• Population growth still increasing but slowing down.
• Urbanization growing. US: low birth rates, population growth rates slow.
• Asian population challenge (Japan, China).
• India’s population should exceed China’s in late 2020s.
• Sr. Population increases in many countries.
• Considerable generational differences in US & Europe.
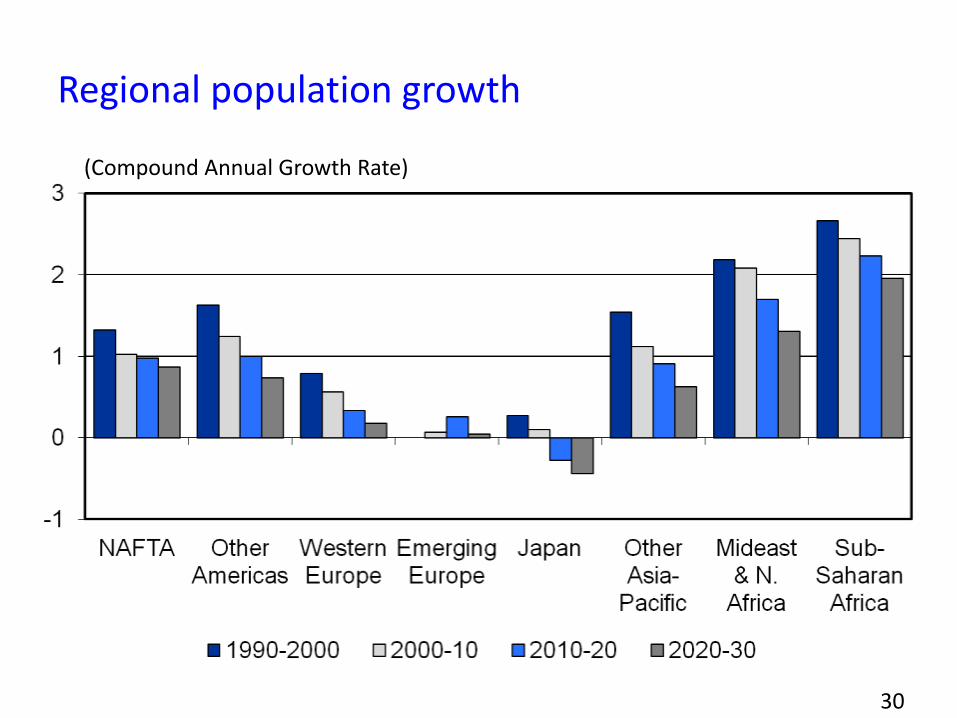
(Compound Annual Growth Rate)
Regional population growth
30

(Urbanization Rate)
Urbanization population and rate
(Millions, Urban population)
31

(Percent, population share by age groups, EU-27)
European aging population dynamics
32
Source: Eurostat

(Percent, population share by age groups, Germany)
Germany’s shrinking population
33
Source: Eurostat

(Proportion of total population)
US aging population poses a challenge to economic growth
34
0
0.2
0.4
0.6
0.8
1960 1970 1980 1990 2000 2010 2020
Under 5 5 to 15 16 to 55 55 to 64 Over 65

(Men: average age of first marriage)
Men waiting longer to marry
35
Source: Eurostat
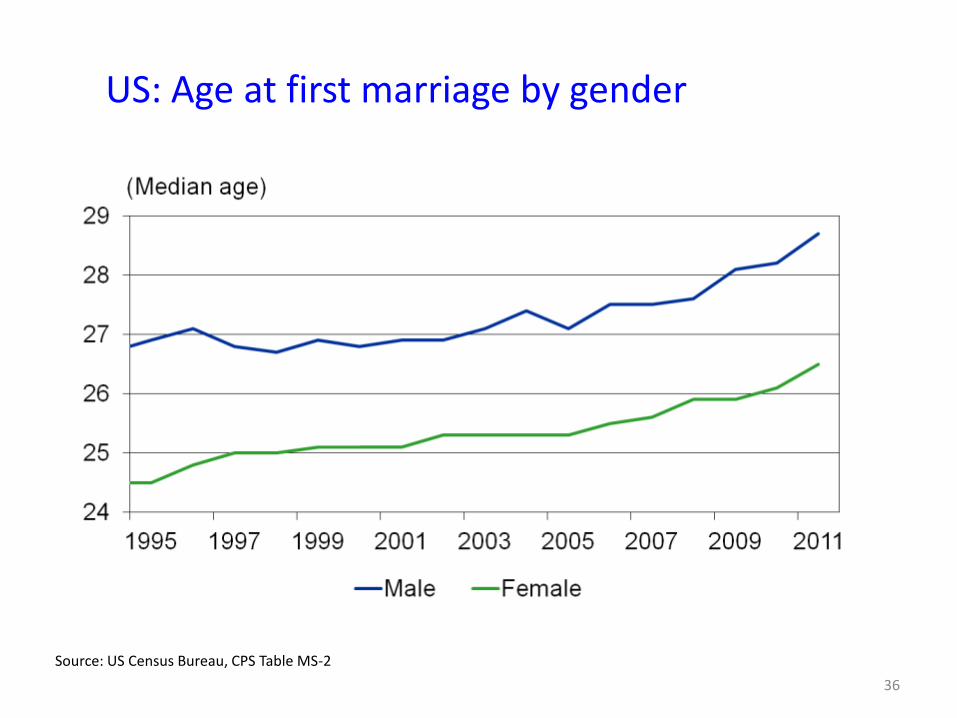
US: Age at first marriage by gender
36
Source: US Census Bureau, CPS Table MS-2

US student loan debt expansion
37
0.3
0.4
0.6
0.7
0.9
1.0
7.7
7.9
8.0
8.2
8.3
8.5
12Q2 12Q3 12Q4 13Q1 13Q2
Mortgage (Right)
HE Revolving (Left)
Auto Loan (Left)
Credit Card (Left)
Student Loan (Left)
Other (Left)
Composition of household debt balance
(Trillions of dollars)

Food still a large share of household budgets in emerging markets
38
US Consumer Expenditure Share by CategoryChina Consumer Expenditure Share by Category
E-commerce Retail Outlook: US & Europe

Clicks outpacing bricks
• Younger age cohorts higher propensity to buy online.
• All age cohorts increase online spending.
• Europe: Northern tier countries ahead of Southern tier.
• Clicks are outpacing bricks across the board.
• US e-commerce retail sales 2013-Q2 standing at 5.8% retail trade.
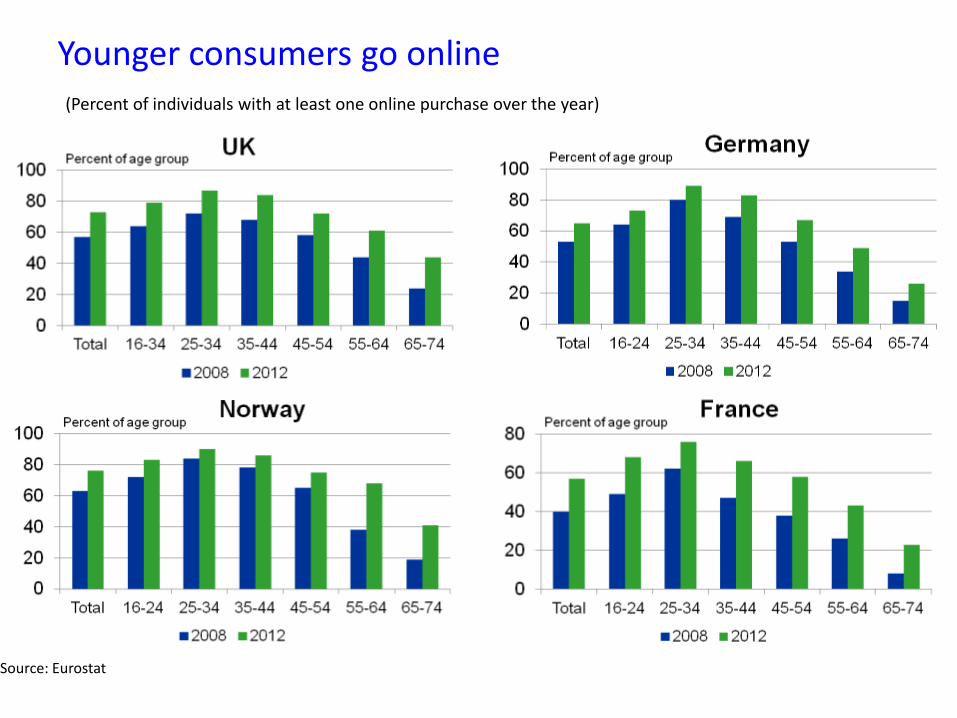
Younger consumers go online
Source: Eurostat
(Percent of individuals with at least one online purchase over the year)

Poland showing growth, Italy lagging
Source: Eurostat
(Percent of individuals with at least one online purchase over the year)

E-commerce retail sales show dramatic growth
Retail Sales 2008 to 2012
Total E-commerce
UK -4.3 63.3
Germany -9.3 37.4
France -5.2 125.4
Sweden 6.4 54.9
Netherlands -15.8 55.6
(Nominal sales in local currency, percent change)
42

E-commerce retail share of total retail sales excluding food service (retail trade)
43
(Percent, seasonally adjusted)


