319
NASA/TM–2000-209597 USAAMCOM-TR-00-A-006 U.S. Civil Rotorcraft Accidents, 1963 Through 1997 Franklin D. Harris, Eugene F. Kasper, and Laura E. Iseler December 2000

NASA/TM–2000-209597USAAMCOM-TR-00-A-006
U.S. Civil Rotorcraft Accidents,1963 Through 1997
Franklin D. Harris, Eugene F. Kasper, and Laura E. Iseler
December 2000

Since its founding, NASA has been dedicated to theadvancement of aeronautics and space science. TheNASA Scientific and Technical Information (STI)Program Office plays a key part in helping NASAmaintain this important role.
The NASA STI Program Office is operated byLangley Research Center, the Lead Center forNASA’s scientific and technical information. TheNASA STI Program Office provides access to theNASA STI Database, the largest collection ofaeronautical and space science STI in the world.The Program Office is also NASA’s institutionalmechanism for disseminating the results of itsresearch and development activities. These resultsare published by NASA in the NASA STI ReportSeries, which includes the following report types:
• TECHNICAL PUBLICATION. Reports ofcompleted research or a major significant phaseof research that present the results of NASAprograms and include extensive data or theoreti-cal analysis. Includes compilations of significantscientific and technical data and informationdeemed to be of continuing reference value.NASA’s counterpart of peer-reviewed formalprofessional papers but has less stringentlimitations on manuscript length and extentof graphic presentations.
• TECHNICAL MEMORANDUM. Scientific andtechnical findings that are preliminary or ofspecialized interest, e.g., quick release reports,working papers, and bibliographies that containminimal annotation. Does not contain extensiveanalysis.
• CONTRACTOR REPORT. Scientific andtechnical findings by NASA-sponsoredcontractors and grantees.
The NASA STI Program Office . . . in Profile
• CONFERENCE PUBLICATION. Collectedpapers from scientific and technical confer-ences, symposia, seminars, or other meetingssponsored or cosponsored by NASA.
• SPECIAL PUBLICATION. Scientific, technical,or historical information from NASA programs,projects, and missions, often concerned withsubjects having substantial public interest.
• TECHNICAL TRANSLATION. English-language translations of foreign scientific andtechnical material pertinent to NASA’s mission.
Specialized services that complement the STIProgram Office’s diverse offerings include creatingcustom thesauri, building customized databases,organizing and publishing research results . . . evenproviding videos.
For more information about the NASA STIProgram Office, see the following:
• Access the NASA STI Program Home Page athttp://www.sti.nasa.gov
• E-mail your question via the Internet [email protected]
• Fax your question to the NASA Access HelpDesk at (301) 621-0134
• Telephone the NASA Access Help Desk at(301) 621-0390
• Write to:NASA Access Help DeskNASA Center for AeroSpace Information7121 Standard DriveHanover, MD 21076-1320

NASA/TM–2000-209597USAAMCOM-TR-00-A-006
U.S. Civil Rotorcraft Accidents,1963 Through 1997
Franklin D. HarrisF. D. Harris & Associates,Fountain Hills, Arizona 85264
Eugene F. KasperArmy/NASA Rotorcraft Division, Aeroflightdynamics Directorate (AMRDEC)U.S. Army Aviation and Missile CommandAmes Research Center, Moffett Field, California 94035
Laura E. IselerAmes Research CenterMoffett Field, California 94035
December 2000
National Aeronautics andSpace Administration
Ames Research CenterMoffett Field, California 94035-1000

Available from:
NASA Center for AeroSpace Information National Technical Information Service7121 Standard Drive 5285 Port Royal RoadHanover, MD 21076-1320 Springfield, VA 22161(301) 621-0390 (703) 487-4650
AcknowledgmentsThe authors wish to express their appreciation to all those who reviewed and commented on this report,
in manuscript or during oral presentations. We especially acknowledge and thank Sandra G. Hart ofNASA Ames Research Center for her detailed review, editing, and suggestions, without which this report
would be of far poorer quality.

iii
CONTENTS
Section/Paragraph Page
CONTENTS......................................................................................................................................... iii
LIST OF TABLES............................................................................................................................... vii
SUMMARY .......................................................................................................................................... 1
1. EXECUTIVE OVERVIEW........................................................................................................... 3
2. INTRODUCTION......................................................................................................................... 72.1 Early History ....................................................................................................................... 72.2 Recent Developments.......................................................................................................... 82.3 Present Study....................................................................................................................... 8
3. ACCIDENT CATEGORIZATION.............................................................................................. 11
4. OVERVIEW OF RESULTS........................................................................................................ 154.1 Major Trends ..................................................................................................................... 164.2 Accident Statistics............................................................................................................. 16
5. COMMERCIAL SINGLE-PISTON ENGINE HELICOPTERS................................................ 195.1 Fleet History and Growth.................................................................................................. 195.2 Accident Analysis ............................................................................................................. 205.3 Detailed Analysis by Accident Category........................................................................... 24
5.3.1 Loss of Engine Power (1,554 Accidents) .............................................................. 245.3.1.1 Overall Accident Trends........................................................................ 245.3.1.2 Loss of Engine Power by Category....................................................... 245.3.1.3 Loss of Engine Power by Activity......................................................... 255.3.1.4 Loss of Engine Power by Phase of Operation....................................... 255.3.1.5 Power-Off Landing................................................................................ 255.3.1.6 Conclusions About Loss of Engine Power Accidents. .......................... 27
5.3.2 In Flight Collision with Object (953 Accidents)................................................... 275.3.2.1 Overall Accident Trends........................................................................ 275.3.2.2 Collision with Object by Object Hit ..................................................... 285.3.2.3 Collision with Object by Cause ............................................................ 285.3.2.4 Collision with Object by Phase of Operation........................................ 285.3.2.5 Collision with Object by Activity ......................................................... 285.3.2.6 Collision with Object by Part Hit.......................................................... 295.3.2.7 Conclusions About In Flight Collision with Object Accidents ............. 29
5.3.3 Loss of Control (625 Accidents) ........................................................................... 295.3.3.1 Overall Accident.................................................................................... 305.3.3.2 Loss of Control by Phase of Operation................................................. 305.3.3.3 Loss of Control by Activity................................................................... 305.3.3.4 Loss of Control by Cause...................................................................... 315.3.3.5 Loss of Control by Axis ........................................................................ 31

iv
CONTENTS (Continued)
Section/Paragraph Page
5.3.3.6 Loss of Control by Pilot-in-Command Certification Level .................. 325.3.3.7 Conclusions About Loss of Control Accidents ..................................... 32
5.3.4 Airframe/Component/System Failure or Malfunction (639 Accidents) ............... 335.3.4.1 Overall Accident Trends........................................................................ 335.3.4.2 Airframe Failures by Phase of Operation ............................................. 335.3.4.3 Airframe Failures by Activity ............................................................... 335.3.4.4 Airframe Failures by System/Component............................................. 34
5.3.4.4.1 Drive train failures by subsystem........................................ 345.3.4.4.2 Rotor failures by subsystem................................................ 375.3.4.4.3 Control system failures by subsystem................................. 385.3.4.4.4 Airframe failures by components........................................ 38
5.3.4.5 Conclusions About Airframe Failure or Malfunction Accidents .......... 405.4 Summary Remarks, Conclusions, and Recommended Actions ........................................ 41
6. COMMERCIAL SINGLE-TURBINE ENGINE HELICOPTERS ............................................ 456.1 Fleet History and Growth.................................................................................................. 456.2 Single-Turbine vs. Single-Piston ...................................................................................... 456.3 Accident Analysis ............................................................................................................. 466.4 Detailed Analysis by Accident Category........................................................................... 48
6.4.1 Loss of Engine Power (704 Accidents) ................................................................. 486.4.1.1 Overall Accident Trends........................................................................ 486.4.1.2 Loss of Engine Power by Category....................................................... 496.4.1.3 Loss of Engine Power by Activity......................................................... 496.4.1.4 Loss of Engine Power by Phase of Operation....................................... 496.4.1.5 Conclusions About Loss of Engine Power Accidents ........................... 50
6.4.2 In Flight Collision with Object (298 Accidents)................................................... 506.4.2.1 Overall Accident Trends........................................................................ 506.4.2.2 Collision with Object by Object Hit ..................................................... 506.4.2.3 Collision with Object by Cause ............................................................ 506.4.2.4 Collision with Object by Phase of Operation........................................ 516.4.2.5 Collision with Object by Activity.......................................................... 516.4.2.6 Collision with Object by Part Hit.......................................................... 516.4.2.7 Conclusions About In Flight Collision with Object Accidents ............. 51
6.4.3 Loss of Control (284 Accidents) ........................................................................... 516.4.3.1 Overall Accident Trends........................................................................ 516.4.3.2 Loss of Control by Axis ........................................................................ 526.4.3.3 Loss of Control by Cause...................................................................... 526.4.3.4 Loss of Control by Phase of Operation................................................. 536.4.3.5 Loss of Control by Activity................................................................... 536.4.3.6 Loss of Control by PIC Certification Level .......................................... 536.4.3.7 Conclusions About Loss of Control Accidents ..................................... 54

v
CONTENTS (Continued)
Section/Paragraph Page
6.4.4 Airframe/Component/System Failure or Malfunction (282 Accidents) ............... 546.4.4.1 Overall Accident Trends........................................................................ 546.4.4.2 Airframe Failures by Phase of Operation ............................................. 556.4.4.3 Airframe Failures by Activity ............................................................... 556.4.4.4 Airframe Failures by System/Component............................................. 55
6.4.4.4.1 Drive train failures by subsystem........................................ 566.4.4.4.2 Rotor failures by subsystem................................................ 586.4.4.4.3 Control system failures by subsystem................................. 606.4.4.4.4 Airframe failures by components........................................ 606.4.4.4.5. Conclusions about airframe failure or malfunction
accidents ............................................................................. 616.5 Summary Remarks, Conclusions, and Recommended Actions ........................................ 62
7. COMMERCIAL TWIN-TURBINE ENGINE HELICOPTERS ................................................ 677.1 Fleet History and Growth.................................................................................................. 677.2 Twin turbine vs. Single turbine ......................................................................................... 677.3 Accident Analysis ............................................................................................................. 687.4. Detailed Analysis by Accident Type ................................................................................. 69
7.4.1 Loss of Engine Power (39 Accidents) ................................................................... 697.4.1.1 Overall Accident Trends........................................................................ 707.4.1.2 Loss of Engine Power by Category....................................................... 707.4.1.3 Loss of Engine Power by Activity......................................................... 707.4.1.4 Loss of Engine Power by Phase of Operation....................................... 717.4.1.5 Conclusions About Loss of Engine Power Accidents ........................... 71
7.4.2 In Flight Collision with Object (43 Accidents)..................................................... 717.4.2.1 Overall Accident Trends........................................................................ 717.4.2.2 Collision with Object by Object Hit ..................................................... 717.4.2.3 Collision with Object by Cause ............................................................ 717.4.2.4 Collision with Object by Activity ......................................................... 727.4.2.5 Collision with Object by Phase of Operation........................................ 727.4.2.6 Collision with Object by Part Hit.......................................................... 727.4.2.7 Conclusions About In flight Collision with Object Accidents.............. 72
7.4.3 Loss of Control (40 Accidents) ............................................................................. 727.4.3.1 Overall Accident Trends........................................................................ 727.4.3.2 Loss of Control by Axis ........................................................................ 727.4.3.3 Loss of Control by Cause...................................................................... 737.4.3.4 Loss of Control by Phase of Operation................................................. 737.4.3.5 Loss of Control by Activity. .................................................................. 737.4.3.6 Loss of Control by PIC Certification Level. ......................................... 747.4.3.7 Conclusions About Loss of Control Accidents ..................................... 74

vi
CONTENTS (Continued)
Section/Paragraph Page
7.4.4 Airframe/Component/System Failure or Malfunction (89 Accidents) ................. 747.4.4.1 Overall Accident Trends........................................................................ 747.4.4.2 Airframe Failures by Phase of Operation ............................................. 757.4.4.3 Airframe Failures by Activity ............................................................... 757.4.4.4 Airframe Failures by System/Component............................................. 75
7.4.4.4.1 Drive train failures by subsystem........................................ 767.4.4.4.2 Rotor failures by subsystem................................................ 777.4.4.4.3 Control system failures by .................................................. 797.4.4.4.4 Airframe specific failures by components. ......................... 797.4.4.4.5 Conclusions about airframe failure or malfunction
accidents ............................................................................. 797.5 Summary Remarks, Conclusions and Recommended Actions ......................................... 80
8. ALL OTHER ROTORCRAFT TYPES....................................................................................... 858.1 Fleet History and Growth.................................................................................................. 858.2 Accident Analysis ............................................................................................................. 858.3 Detailed Analysis by Accident Category........................................................................... 868.4 Summary Remarks, Conclusions, and Recommended Actions ........................................ 87
9. FINAL REMARKS, CONCLUSIONS, AND RECOMMENDATIONS.................................... 89
REFERENCES.................................................................................................................................... 97
LIST OF FIGURES............................................................................................................................. 99
Appendix A NTSB DEFINITIONS............................................................................................ 213
Appendix B ESTIMATION OF ROTORCRAFT FLEET SIZE AND HOURS FLOWN ......... 229
Appendix C AUTOROTATION-RELATED ACCIDENTS........................................................ 253
Appendix D OTHER STATISTICAL DATA TABLES............................................................... 265

vii
TABLES
Table Page
1. SUMMARY ACCIDENT COUNT AND DISTRIBUTION, 1963–1997.................................... 42. DATA ELEMENTS IN NTSB MINI-BRIEFS, 1963–1997 ...................................................... 133. ACCIDENT DISTRIBUTION BY ROTORCRAFT TYPE, 1963–1997 .................................. 154. ACCIDENT COUNT AND DISTRIBUTION, 1963–1997....................................................... 165. CAA HELICOPTER CENSUS AT END OF 1957.................................................................... 196. SINGLE-PISTON ACCIDENT COUNT AND DISTRIBUTION, 1963–1997 ........................ 217. SINGLE-PISTON ACCIDENT DISTRIBUTION, LAST 8 YEARS VS. 1963–1997 .............. 228. NTSB FAILURE MODE/SYSTEM MATRIX—SINGLE-PISTON HELICOPTERS ............. 359. DRIVE TRAIN FAILURES BY COMPONENTS—SINGLE-PISTON HELICOPTERS....... 3510. DRIVE TRAIN MAJOR COMPONENT FAILURES—SINGLE-PISTON
HELICOPTERS ......................................................................................................................... 3611. ROTOR SYSTEM FAILURES BY COMPONENTS—SINGLE-PISTON
HELICOPTERS ......................................................................................................................... 3712. ROTOR SYSTEM COMPONENTS FAILURE MODE—SINGLE-PISTON
HELICOPTERS ......................................................................................................................... 3713. CONTROL SYSTEM FAILURES BY COMPONENTS—SINGLE-PISTON
HELICOPTERS ......................................................................................................................... 3814. AIRFRAME FAILURES BY COMPONENTS—SINGLE-PISTON HELICOPTERS............ 3915. AIRFRAME COMPONENTS FAILURE MODE—SINGLE-PISTON HELICOPTERS........ 3916. ACCIDENTS BY ACTIVITY AND PHASE OF OPERATION—SINGLE-PISTON
HELICOPTERS ......................................................................................................................... 4117. FAA ROTORCRAFT ACTIVITY SURVEY OF 1989 .............................................................. 4518. SINGLE-TURBINE VS. SINGLE-PISTON ACCIDENT COMPARISON, 1963–1997 .......... 4719. SINGLE-TURBINE ACCIDENT DISTRIBUTION, LAST 11 YEARS VS. 1963–1997......... 4820. SINGLE-ENGINE-HELICOPTER AIRFRAME FAILURE COMPARISON, 1963–1997...... 5621. NTSB FAILURE MODE/SYSTEM MATRIX—SINGLE-TURBINE
HELICOPTERS ......................................................................................................................... 5722. DRIVE TRAIN FAILURES BY COMPONENTS—SINGLE-TURBINE HELICOPTERS.... 5723. DRIVE TRAIN MAJOR COMPONENT FAILURES—SINGLE-TURBINE
HELICOPTERS ......................................................................................................................... 5824. ROTOR SYSTEM FAILURES BY COMPONENTS—SINGLE-TURBINE
HELICOPTERS ......................................................................................................................... 5825. ROTOR SYSTEM COMPONENTS FAILURE MODE—SINGLE-TURBINE HELICOPTERS5926. CONTROL SYSTEM FAILURES BY COMPONENTS—SINGLE-TURBINE
HELICOPTERS ......................................................................................................................... 6027. AIRFRAME-SPECIFIC FAILURES BY COMPONENTS—SINGLE-TURBINE
HELICOPTERS ......................................................................................................................... 6128. AIRFRAME COMPONENTS FAILURE MODE— SINGLE-TURBINE HELICOPTERS ... 6229. ACCIDENTS BY ACTIVITY AND PHASE OF OPERATION—SINGLE-TURBINE
HELICOPTERS ......................................................................................................................... 63

viii
TABLES
Table Page
30. SINGLE-TURBINE VS. TWIN-TURBINE ACCIDENT DISTRIBUTION COMPARISON,1963–1997.................................................................................................................................. 68
31. TWIN-TURBINE ACCIDENT DISTRIBUTION, LAST 5 YEARS VS. 1963–1997 .............. 6932. FATALITIES PER 100 ACCIDENTS BY TYPE OF ENGINE, 1963–1997............................. 7033. HELICOPTER AIRFRAME FAILURE COMPARISON, 1963–1997...................................... 7534. NTSB FAILURE MODE/SYSTEM MATRIX—TWIN-TURBINE
HELICOPTERS ......................................................................................................................... 7635. DRIVE-TRAIN FAILURES BY COMPONENTS—TWIN-TURBINE HELICOPTERS....... 7736. DRIVE-TRAIN MAJOR COMPONENT FAILURES—TWIN-TURBINE
HELICOPTERS ......................................................................................................................... 7737. ROTOR SYSTEM FAILURES BY COMPONENTS—TWIN-TURBINE
HELICOPTERS ......................................................................................................................... 7838. ROTOR SYSTEM COMPONENTS FAILURE MODE—TWIN-TURBINE
HELICOPTERS ......................................................................................................................... 7839. CONTROL SYSTEM FAILURES BY COMPONENTS—TWIN-TURBINE
HELICOPTERS ......................................................................................................................... 7940. AIRFRAME SPECIFIC FAILURES BY COMPONENTS—TWIN-TURBINE
HELICOPTERS ......................................................................................................................... 8041. ACCIDENTS BY ACTIVITY AND PHASE OF OPERATION—TWIN-TURBINE
HELICOPTERS ......................................................................................................................... 8142. ACCIDENT DISTRIBUTION BY ALL OTHER ROTORCRAFT TYPES,
1963–1997.................................................................................................................................. 8643. AMATEUR VS. COMMERCIAL ACCIDENT DISTRIBUTION, 1963–1997........................ 8644. ACCIDENTS BY ACTIVITY AND PHASE OF OPERATION—ALL OTHER TYPES ........ 8745. SUMMARY OF ROTORCRAFT ACCIDENTS FROM MID-1963 TO THE END
OF 1997...................................................................................................................................... 90

1
U.S. Civil Rotorcraft Accidents, 1963 Through 1997
Franklin D. Harris,1 Eugene F. Kasper2 and Laura E. Iseler3
Ames Research Center
SUMMARY
The narrative summary data produced by the U.S. National Transportation Safety Board (NTSB)were obtained and analyzed for all 8,436 rotorcraft accidents that occurred from mid-1963 through1997. This analysis was based on the NTSB’s assignment of each accident into one of 21 “firstevent” categories. The number of U.S. civil registered rotorcraft as recorded by the Federal AviationAdministration (FAA) for the same period were obtained as well. Taken together, these data indicatethe civil rotorcraft accident rate (on a per 1,000 registered rotorcraft basis) decreased by almost afactor of 10 over the 34-year study period (i.e., from 118 accidents per 1,000 rotorcraft in 1964 to13.6 per 1,000 in 1997).
Analysis of the accident data indicated that the first event in over 70% of the 8,436 rotorcraftaccidents fell into four categories:
2,408 loss of engine power (28.5%)1,322 in flight collision with objects (15.7%)1,114 loss of control (13.2%)1,083 airframe/component/system failure or malfunction (12.8%).
Because the vast majority of rotorcraft registered over the study period had a single engine (piston orturbine), these aircraft dominated the accident statistics. Over 985 loss of engine power accidentswere caused by improper fuel/air mixture. Fuel exhaustion was a major, common event in bothpiston and turbine helicopter accidents. In-flight collisions with wires and poles accounted for over700 accidents. Pilots of the commercial fleet lost control of their helicopters regardless of theircertified skill level. Airframe related failures left the commercial helicopter pilot without antitorqueand directional control in 470 accidents. Without significantly increased safety efforts in theimmediate future, the authors project that in the year 2010 there will be about 6 accidents per1,000 registered rotorcraft. If the fleet doubles in size by 2010, then this accident rate corresponds to150 accidents per year—about 3 accidents per week.
1 F. D. Harris & Associates, Fountain Hills, Arizona 852642 Army/NASA Rotorcraft Division, Aeroflightdynamics Directorate (AMRDEC), Moffett Field, California3 Ames Research Center, Moffett Field, California

2
THIS PAGE INTENTIONALLY BLANK

3
1. EXECUTIVE OVERVIEW
The U.S. civil rotorcraft fleet grew from fewer than 10 in 1946 to 2,196 at the end of 1964 and to12,911 at the end of December 1997. Throughout this period, the commercially manufactured,single-engine helicopter dominated the registered fleet. Although the single-piston engineconfiguration still sold in quantity, the rotorcraft industry introduced the single-turbine engineconfiguration in the mid-1960s. In 1997, nearly equal numbers of single-piston and single-turbinehelicopters were registered (about 5,000 each). The commercially manufactured, twin-turbinehelicopter began selling in quantity in the late 1970s—slightly over 1,200 were registered at the endof 1997. A growing fleet of registered amateur-built rotorcraft included close to 1,000 helicoptersand 2,000 autogyros in 1997.
During the 34-year period from mid-1963 through the end of 1997, the National TransportationSafety Board (NTSB) recorded a total of 8,436 rotorcraft accidents. However, because of continuingemphasis on safety, the rotorcraft industry was able to reduce accidents per year, even though theregistered fleet grew in size. Specifically, annual U.S. civil rotorcraft accidents decreased from260 in 1964 to 175 in 1997. In broad terms then, the industry succeeded in reducing annualaccidents per 1,000 registered rotorcraft by nearly a factor of 10 over the 34-year period (i.e., from118 accidents per 1,000 registered rotorcraft in 1964 to 13.6 per 1,000 in 1997). Nevertheless,accidents over this 34-year period took a heavy toll. The 8,436 accidents directly affected16,825 people: 2,135 were killed and 1,760 were seriously injured, but 12,930 survived with minoror no injury. Rotorcraft damage during this period was significant. Of the 8,436 rotorcraft involved,2,363 (i.e., nearly 20% of today’s registered fleet) were listed as destroyed by the NTSB. Another5,909 rotorcraft were substantially damaged; 164 received little or no damage.
Analysis of each accident (table 1) showed that accident similarities far outnumbered dissimilarities,despite obvious differences in the helicopter classes. The major observations are as follows:
1. Single-engine, commercially manufactured helicopters, whether piston- or turbine-powered, experienced the most accidents because of a partial or total loss of engine power. Theprimary reason for loss of engine power was directly traced by the NTSB to fuel/air mixtureproblems, which accounted for no less than 985 accidents. Fuel exhaustion, fuel starvation, fuelcontamination, and, for the piston engine, carburetor heat were key words repeatedly used by theNTSB accident investigators. Apparently, many pilots disregarded the need by both engine types forclean fuel and air in proper proportions—to say nothing about the FAA regulations for fuel reserves.Engine structural failure accounted for 452 accidents. The power-loss cause was not established in578 single-engine helicopter accidents. Power-off landing proficiency is not required by the FAA inorder to obtain a helicopter pilot’s certification. This standard appears inconsistent with the numberof accidents caused by loss of engine power. However, it also appears that helicopters—currently inthe civil fleet—provide marginal to inadequate autorotational capability for the average pilot tosuccessfully complete the final flare and touchdown to a generally unsuitable landing site.

4
TABLE 1. SUMMARY ACCIDENT COUNT AND DISTRIBUTION, 1963–1997
Commercially manufactured
Singlepiston
Singleturbine
Twinturbine
Amateurtypes
NTSB first event accident category Count (%) Count (%) Count (%) Count (%)
Loss of engine power 1,554 (28.9) 704 (31.3) 39 (12.9) 111 (21.5)
In flight collision with object 953 (17.7) 298 (13.2) 43 (14.2) 28 (5.43)
Loss of control 625 (11.6) 284 (12.6) 40 (13.2) 165 (32.0)
Airframe/component/system failure/malfunction 639 (11.9) 282 (12.5) 89 (29.5) 73 (14.1)
Hard landing 483 (8.99) 140 (6.23) 8 (2.65) 25 (4.89)
In flight collision with terrain/water 443 (8.25) 143 (6.36) 16 (5.23) 40 (7.75)
Rollover/nose over 290 (5.40) 119 (5.29) 4 (1.32) 20 (3.88)
Weather 57 (1.06) 85 (3.78) 12 (3.97) 5 (0.97)
Other 327 (6.09) 192 (8.54) 51 (16.9) 49 (9.49)
Total 5,371 2,247 302 516
2. Twin-turbine helicopters significantly reduced loss of engine power accidents (on apercentage basis). However, 23 of the 39 accidents began with a total loss of power in both engines.Most discouragingly, 17 of the 39 accidents were caused by fuel/air mixture problems, a findingsimilar to that for single-engine helicopter accidents.
3. Introducing twin-turbine helicopters reduced loss of engine power accidents, but a verydisturbing trend began with the larger helicopters capable of carrying more people. In the single-piston helicopter fleet, there were 5,371 accidents, and 683 people were killed. Because of the2,247 accidents involving single-turbine helicopters, 951 people died. Now, in just 302 twin-turbinehelicopter accidents, there were 321 fatalities.
4. The commercially manufactured helicopter fleet collectively had 1,294 accidents becauseof in-flight collisions with objects. Collisions with wires and poles accounted for 720 accidents.Collisions with trees added another 205 accidents. The major contributor to these in flight collisionswas the single-piston helicopter fleet, most frequently during crop dusting. This helicopter type hadabout equal numbers of main- and tail-rotor strikes. The single-turbine helicopter class, which doesrelatively little crop dusting, experienced four tail rotor strikes for every three main rotor strikes.Twin-turbine helicopters had more than twice as many tail rotor strikes than main-rotor strikes.
5. Pilots of commercially manufactured helicopters lost control regardless of their certifiedskill level, and this precipitated 12% of the commercial fleets’ 7,920 accidents. Pilots of amateurbuilt rotorcraft lost control nearly three times as often. The requirement to adequately control

5
antitorque in all flight phases appears as a root problem with the single main rotor helicopterconfiguration. Single-piston helicopters (and turbine-powered helicopters to a somewhat lesserextent) appear to be inordinately difficult to fly; particularly when the average pilot must devotesome attention to any other task or is experiencing a real or imagined emergency. Cross-couplingbetween the vertical, power/RPM, and yaw axes is excessive. The handling qualities designstandards applicable to the current helicopter fleet date back to the 1950s. Although generallytolerated, the resulting helicopter stability and control characteristics now appear quiteunsatisfactory. Equipping some single-turbine and virtually all twin-turbine helicopters with anelectro-hydraulic, automatic stability and control system improved the overall loss of controlsituation.
6. Airframe system, subsystem, and component failures or malfunctions were one of theleading causes of helicopter accidents over the 34-year study period. Pilots of commerciallymanufactured helicopters were left without antitorque and directional control in 470 accidents,virtually 50% of the 1,010 accidents NTSB charged to the airframe category. The tail rotordriveshaft, which includes the shaft couplings and bearings, failed in 122 accidents. Failure of thetail rotor control system led to 56 accidents, and blade/hub failures accounted for 186 accidents. Thecorresponding main rotor system dynamic components also failed or malfunctioned, which led to404 additional accidents. Specifically, engine to main rotor gearbox failures caused 137 accidents,control system failures caused 103, and blade/hub failures caused 112. The commercial helicopterairframe failure rate strongly suggests that past design standards are inadequate relative to the manynew and varied activities in which this aircraft class is engaged. Pilots did exceed design limits,required and timely maintenance was skipped, and less than thorough inspections were performed,but still the current fleet appears, broadly speaking, to be underdesigned in view of today’scommercial usage.
7. The favorable, downward trend in rotorcraft accidents per year enumerated above wasnot linear. During a 15-year period, beginning in 1972 and ending in 1987, the industry experienceda rash of accidents that drove the annual rate to 327 accidents in 1980 before dropping to196 accidents in 1987. We believe that the increased accidents per year during this period wasinitiated by the 10-year period during which commercial helicopter yearly sales increased by over50%. The relatively abrupt increase of new helicopters in the U.S. civil fleet was accompanied by ajump in accidents caused by loss of engine power and failure of airframe systems and components.
8. Single-turbine helicopter accidents per year increased slightly over the last decade of theperiod studied. There were 62 accidents in 1987, 65 accidents in 1993 and 73 accidents in 1997,during which time the registered fleet increased only modestly in size. Most recently, new, single-turbine helicopters were being registered at a rate comparable to that of the 1970s. There is concern,therefore, that a rapid fleet expansion will prompt an increase in accidents just as it did two decadesago. We recommend that more intensive safety improvement efforts be quickly initiated by theindustry.
9. The amateur-built helicopter and autogyro fleet experienced approximately the sameaccident distribution, based on percentage, as the commercially manufactured helicopter fleet. Theprimary exceptions were that loss of control was nearly three times as prevalent and loss of enginepower occurred with two-thirds the frequency. Because the amateur fleet is growing so fast, we

6
believe that major manufacturers, operators, and trade associations must provide considerably morehelp to this segment of their industry to lower the risks being taken.
10. There is little doubt that single- or twin-turbine-engine-powered helicopters are safer thanthe single-piston-engine helicopter. How much safer can not, in our opinion, be quantified. Therotorcraft industry is being misguided by accident rate trends that use FAA data for active fleet size,hours flown, takeoffs made, etc. In fact, we believe it quite likely that the rotorcraft industry willmiss significant safety trends if the currently used methods of computing accident rates remain asthe measure of progress. Unquestionably, the true aviation goal is no fatalities or injuries, in whichcase safety rates become meaningless.
This report provides detailed analysis, specific conclusions, and challenging recommendationsrelative to each helicopter class. Section 9 provides a concise group of final remarks, conclusions,and detailed recommendations. Without significantly increased safety efforts in the immediatefuture, including implementing the submitted recommendations, it is projected that in the year 2010there will be about 6 accidents per 1,000 registered rotorcraft. If the fleet doubles in size by 2010,then this accident rate corresponds to 150 accidents per year—about 3 accidents per week. It isdoubtful that the public will perceive this projection as an indication that pilots and their rotorcraftare, in fact, becoming safer.

7
2. INTRODUCTION
The gathering, analyzing, and reporting of aviation accident data has played an important part inmaking air transportation safer. One of the earliest examples of this safety improvement activity tookplace in November 1921, at the Premier Congrés International de la Navigation Aérienne, held inParis. During this conference, Albert Tete presented a review of the status of aerial transportation inFrance (ref. 1). Additionally, Mayo presented a paper entitled “Aviation and Insurance,” (ref. 2), inwhich he discussed the “causes of the many accidents which account for the high insurance rates.”Specifically, he stated:
The frequent accidents to airplanes employed on air routes havebeen due to widely divergent causes. Probably 90% of them were due tocarelessness and could have been avoided, had the necessary precautionsbeen taken. The principal causes of accidents may be enumerated asfollows:
1. Poor piloting;
2. Engine trouble;
3. Lack of system [organization of personnel];
4. Poorly adapted airplanes;
5. Poor airdromes;
6. Unfavorable meteorological conditions.
With only minor changes, Mayo’s paper could be presented at any “aerial transportation” safetyconference today.
2.1 Early History
In the United States, following World War I, the National Advisory Committee on Aeronautics(NACA), by request of the Assistant Secretaries for Aeronautics in the Departments of War, Navy,and Commerce, established a special commission “to prepare a basis for the classification andcomparison of aircraft accidents, both civil and military.” In NACA Technical Report TR-308(ref. 3), 13 classes of accidents, 4 classes of injuries, and 6 classes of damage to material weredefined. Categories of immediate and underlying accident causes were established and an accidentform was adopted (fig. 1). This approach was used to analyze 1,432 military and 1,400 civilianaccidents that occurred before January 1929 (ref. 4). In June 1936, a further refinement to definitionsand methods of analysis was established in NACA TR-576 (ref. 5). That report, entitled “AircraftAccidents, Method of Analysis,” became the standard United States reference on the subject andformed the foundation for current NTSB aviation accident reporting.
There was an immediate payoff for the efforts of the NACA-led committee. Analysis of the datarevealed major shortcomings in aircraft design and pilot training (e.g., deficiencies in aircraftstability and control and spin recognition and recovery) for which corrective actions were developed

8
and implemented. It should be noted that solving these problems did not require computingaccidents per flight hour or other ratios that are considered important measures of transportationsafety today. The priority then, as now, was to put an end to accidents.
In October 1944, the U.S. Civil Aeronautics Administration (CAA), the predecessor to the FederalAviation Administration (FAA), published the first “Statistical Handbook of Civil Aviation” (ref. 6).This first of many CAA handbooks pointed out that reported accident statistics were based ondefinitions and classifications established by NACA TR-576 (although the Statistical Handbookincorrectly referenced the NACA TR as “TR-567”). This document summarized aviation statisticsdating back to 1926, including air carrier and private flying accident statistics compiled by the U.S.Civil Aeronautics Board (CAB), the predecessor to the NTSB. In the introduction, the CAAacknowledged that, “There are some gaps in the early statistics because fact-gathering machineryhad not been fully organized and it also was extremely difficult to obtain reliable figures from anindustry still inchoate.” With respect to private flying, the CAA noted that, “Because of thedislocation caused by the War, statistics on the amount of private flying during the war years areincomplete.” Despite these reservations, the 1944 CAA handbook provided early examples ofdetailed tables regarding such aircraft operating statistics as the number of hours flown, milescovered, and passengers carried. Many of the safety measures using these statistics are still usedtoday.
2.2 Recent Developments
Today, the NTSB investigates civil aviation accidents and has amassed a database of coded, as wellas narrative, information. Over 32,000 aviation accidents that have occurred since 1982 aresummarized at the NTSB web site (www.ntsb.gov) and at the FAA Office of System Safety(http://nasdac.faa.gov./asp/asy_ntsb.asp). The FAA Statistics and Forecast Branch publishes a yearly“Census Of U.S. Civil Aircraft.” The census provides details about the number and types of aircraftcurrently operating in the U.S. civil aviation fleet, along with other relevant data. Fleet-size data areobtained by extrapolating data from a survey questionnaire mailed to a sample of registered owners.The validity of this extrapolation has been questioned occasionally. Today, there are approximately350,000 U.S. civil registered aircraft, which makes updating and correcting the census andregistration records a daunting task. Nevertheless, by combining data from the FAA and NTSB, suchstatistics as accidents per 100,000 operating hours for each civil aircraft grouping are prepared andgiven wide distribution.
2.3 Present Study
The objective of this report is to present and analyze rotorcraft accident trends with the expectationthat areas requiring improvement in rotorcraft design and operation will be identified, and that long-and short-term actions will be developed and implemented to reduce the number of accidents. Incontrast to many studies (e.g., ref. 7) that provide snapshots of safety trends over short periods oftime, this study covers a 34-year span from mid-1963 to the end of 1997. This includes the period ofwidespread use of matured single-piston-engine helicopters, as well as the introduction andmaturation of single- and twin-turbine powered helicopters. This report also includes a review ofaccident trends within the growing amateur rotorcraft (i.e., autogyros and helicopters) fleet. We have

9
chosen not to include extensive statistics on accidents per flight hour, preferring a more in-depthstudy of the accidents themselves.
The basic data gathered for this report were compiled from NTSB and FAA records. Although theCAA/FAA census separated rotorcraft fleet size from fixed wing aviation as early as 1951,CAB/NTSB accident reports for rotorcraft were only obtained from mid-1963 on.
Regarding the structure of this report, please note the following:
There are 109 figures accompanying this report. A list of these figuresbegins on page 99 and figure 1 is placed on page 103. The page number forany subsequent figure is simply the figure number plus 102.
Tables 1–45 appear at or near the points in the text at which they are cited.There are 31 supplemental tables enclosed in Appendix D. A supplementaltable is identified by D- as a prefix.

10
THIS PAGE INTENTIONALLY BLANK

11
3. ACCIDENT CATEGORIZATION
The NTSB defines and categorizes the terms they use in investigating and reporting on accidents.The key definitions are set down in Part 830 of the Federal Aviation Regulations (FAR). The NTSBdefines an aircraft accident as
An occurrence incident to flight in which “as a result of the operation of an aircraft,any person (occupant or non-occupant) receives fatal or serious injury or any aircraftreceives substantial damage.”
Fatal, serious, and minor injuries are defined as follows:
“A fatal injury is one that results in death within 30 days of theaccident.”
“A serious injury is one that
1. Requires hospitalization for more than 48 hours,commencing within 7 days from the date the injury was received,
2. Results in a fracture of any bone (except simplefractures of the fingers, toes, or nose),
3. Involves lacerations that cause severe hemorrhages,nerve, muscle, or tendon damage,
4. Involves injury to any internal organ; or
5. Involves second- or third-degree burns, or any burnsaffecting more than 5% of body surface.”
“A minor injury is one that does not qualify as fatal or serious.”
Aircraft damage ranges from destroyed to minor; “destroyed means that an aircraft was demolishedbeyond economical repair, that is, substantially damaged to the extent that it would be impractical torebuild it and return it to an airworthy condition.”
The NTSB notes that this definition of destroyed “may not coincide with the definition of total lossfor insurance purposes. Because of the variability of insurance limits carried and such additionalfactors as time on engines and propellers and aircraft condition before the accident, an aircraft maybe totaled even though it is not considered destroyed for accident investigation purposes.”
With respect to substantial damage, the FAR Part 830 states:
1. Except as provided below, substantial damage meansdamage or structural failure that adversely affects the structural strength,performance, or flight characteristics of the aircraft, and that wouldnormally require major repair or replacement of the affected part.
2. Engine failure, damage limited to an engine, bentfairings or cowling, dented skin, small puncture holes in the skin or fabric,ground damage to rotor or propeller blades, damage to landing gear,

12
wheels, tires, flaps, engine accessories, brakes, or wing tips are notconsidered “substantial damage.”
The NTSB carefully points out that “As with destroyed above, the definition of substantial foraccident investigation purposes does not necessarily correlate with substantial in terms of financialloss. Contrary to popular misconception, there is no dollar value that defines substantial damage.Because of the high cost of many repairs, large sums may be spent to repair damage resulting fromincidents that do not meet the FAR Part 830 definition of substantial damage.” Finally, the NTSBstates that “minor damage is damage that does not qualify as substantial, such as that undersubstantial damage above.”
Today, the NTSB uses a number of other definitions, categories, and computer code numbers toprovide a detailed accident report. A sample of this information from the NTSB manual is providedin appendix A.
In contrast to current NTSB investigation reports, the early NACA aircraft accident analysis form(fig. 1) categorized accidents in one of four groups: personal, material, miscellaneous, andundetermined. As time went on, the CAB or NTSB added detail so that today a “mini-brief” of eachcomplete accident report is available which summarizes the sequence of events leading to theaccident outcome. For purposes of this report, the accidents were categorized based on the first eventin the sequence of events that led to the accident (i.e., the first physical event that adversely affectedthe rotorcraft or unusual occurrence the aircrew became aware of). The NTSB has established thefollowing 21 categories (here presented in order of number of accidents across the entire rotorcraftfleet):
Loss of engine powerIn-flight collision with objectLoss of controlAirframe/component/system failure/malfunctionHard landingIn-flight collision with terrain/waterRollover/nose overWeatherMiscellaneous/otherPropeller/rotor contact to personStall/settling with powerMid-air collisionOn ground/water collision with objectFire/explosionAbrupt maneuverGear collapsedUndershoot/overshootDragged wing, rotor, pod, float, or tail/skidUndeterminedOn ground/water encounter with terrain/waterMissing aircraft.

13
It is clear from the names of these categories, and by review of accident narrative summaries, thatthere is significant overlap among them. This gives the accident investigator leeway for personaljudgment at the cost of possible inconsistency in the assignment of accidents to specific categories.We noted that different accidents with very similar narratives were assigned to different categories.Examples include some engine failures being categorized as airframe failures, some in-flightcollisions with terrain being counted as dragged rotors, and other similar cases. It should be noted,however, that the analysis in this report is based only on the accident narratives provided by theNTSB and not on the full accident report when it exists.
The amount and character of information contained in the NTSB mini-briefs changed substantiallyover the period covered by this report. Four distinct mini-brief forms were used from 1963 to 1971,1972 to 1981, 1982, and 1983 to 1997. Despite the format differences, the basic data given in table 2were generally available for each accident studied by the authors.
TABLE 2. DATA ELEMENTS IN NTSB MINI-BRIEFS, 1963–1997
Data element
FAA report reference number
Date and local time of accident
Location of accident
Aircraft make, model, and FAA registration number
Fatalities, serious injuries, minor/no injuries (CX-crew, PX-passengers, OT-others)
Mission type
Pilot-in-command qualification and experience
Aircraft damage
Accident category (i.e., NTSB first event)
Phase of operation during which first event occurred
Probable cause (legal)
Contributing factor(s)
Special weather factors (not included when accident was not weather-related)
Special agricultural operational data (not included when accident was not during agriculturaloperations)
Remarks

14
The depth of data in the mini-briefs improved across the 34-year period. As an example of dataavailable during the period 1963 to 1971, figure 2 shows a mini-brief for an accident in agriculturaloperations that involved weather. From 1972 through 1981, the mini-briefs contained essentially thesame information as for 1963 through 1971. The most significant change in 1972 was the addition ofinformation on the departure point, intended destination, and last en route stop. Figure 3 provides amini-brief example for this period.
A major change in the format and data content of the mini-brief took place in 1982. In addition tomore detailed information about the aircraft, engine, environment, and pilot qualification, thisformat specifically included a brief narrative of the accident sequence, findings, and the declarationof which findings constituted the probable cause. This summary format probably contained the mostinformation of any of the formats encountered during this study. Figure 4 provides a mini-briefexample for this period.
For accidents that occurred after 1982, mini-briefs in two formats are now available through onlineresources. At the NTSB web site (www.ntsb.gov/aviation/aviation.htm), the mini-brief format waschanged to emphasize the narrative. This change eliminated information about pilot experience,weather, and special agricultural data (see fig. 5). The second form of mini-briefs, which can beobtained through the FAA Office of System Safety web site, has essentially the same information asthe NTSB mini-briefs of 1982 shown in figure 4.
As a final example of available data, figure 6 presents a typical entry as presented on the NTSB website. In this format, only identification information and a narrative are included; the user is referredto the NTSB off-line imaging system for the more complete report. The purpose of these entriesappears to be the rapid dissemination of factual accident information. As accident investigationprogresses from the preliminary through the factual to the final, the entry is modified with additionaldata. The example above is for a factual report that does not present formal findings or causes.Because of the time necessary to investigate an accident and file the final report, we relied on theinformation contained in these summaries for many accidents that took place from late 1996 through1997.
Using these mini-briefs, it was found that the 21 categories paralleled the expanded groupings listedon the 1936 NACA form (fig. 1) under “Immediate Causes of Accident” and were reasonablyconsistent over the 34 years under study. Thus, today’s NTSB first event categories, not to beconfused with the ultimate accident cause, allowed a distribution of the 8,436 accidents within the21 first event categories. In fact, the bulk of rotorcraft accidents fell into 7 of the 21 NTSBcategories, with 70% in just 4 categories.

15
4. OVERVIEW OF RESULTS
Annual U.S. civil rotorcraft accidents decreased from 260 in 1964 to 175 in 1997 (fig. 7). Duringthis period, the U.S. registered rotorcraft fleet expanded from 2,196 to 12,911 aircraft (fig. 8). Inbroad terms, the industry succeeded in reducing accidents per rotorcraft by nearly a factor of 10 overthis period (i.e., from 118 accidents per 1,000 rotorcraft in 1964 to 13.6 per 1,000 in 1997). The8,436 accidents that occurred during this 34-year period took a large toll (fig. 9), directly affecting16,825 people: 2,135 killed, 1,760 seriously injured, and 12,930 with minor or no injuries.Rotorcraft damage during this period was significant (table D-3). Of the 8,436 rotorcraft involved,2,363 (i.e., nearly 20% of today’s registered fleet) were listed as destroyed by the NTSB. Another5,909 rotorcraft were substantially damaged, and only 164 received little or no damage. Of course,as is well known, helicopter crews and their aircraft have saved more than a million lives. However,without major safety improvements, the potential exists for an increasing number of rotorcraftaccidents with more people being affected. This could be especially true, as new rotorcraft types(e.g., civil tilt rotor) become operational.
The distribution of the 8,436 accidents by rotorcraft type for the 34-year period was as shown intable 3 (which is excerpted from table D-1).
TABLE 3. ACCIDENT DISTRIBUTION BY ROTORCRAFT TYPE, 1963–1997
Commercially manufactured helicopters 7,920
Single piston 5,371
Single turbine 2,247
Twin turbine 302
Other rotorcraft types 516
Commercially built autogyros 50
Amateur built helicopters 137
Amateur built autogyros 261
Unknown/others 68
There was improvement in the safety records of each of these rotorcraft types during the periodunder study. However, the improvements were not always uniform. As shown in figure 7, the periodfrom 1972 to 1987 showed an unfavorable “bubble” relative to the reference trend. There were“above normal” accidents per year for both matured single-piston helicopters and relatively newersingle-turbine models during this 15-year period. Single-piston helicopters had overly large numbersof accidents from 1971 to 1983 (fig. 10), whereas single-turbine helicopters showed a similarincrease from 1978 to 1987. Twin-turbine helicopter accidents were relatively rare and did notmarkedly influence the broad trend or the 15-year “bubble.” The other rotorcraft types listed abovecontributed relatively few accidents per year during the study period (table D-1). Since the single-engine helicopter, piston or turbine, dominates the U.S. civil helicopter fleet, it was not surprisingthat it was involved in more accidents per year.

16
4.1 Major Trends
The 21 first event categories used by the NTSB, which should not be confused with the ultimateaccident cause, establishes a reasonably consistent way to group accidents over the period understudy. The distribution of the 8,436 accidents within the 21 first event categories is summarized infigure 11. The bulk of rotorcraft accidents fell into 7 of the 21 NTSB categories, with 70%associated with 4 categories (table 4).
TABLE 4. ACCIDENT COUNT AND DISTRIBUTION, 1963–1997
Loss of engine power 2,408 (28.5%)
In-flight collision with object 1,322 (15.7%)
Loss of control 1,114 (13.2%)
Airframe/component/system failure or malfunction 1,083 (12.8%)
Other first event categories 2,509 (29.7%)
Total 8,436
The trend over the 34-year period for these four accident categories is illustrated in figures 12 and 13using data from table D-4. Figure 12 shows that the first events, loss of engine power andairframe/components/system failure or malfunction, were major contributors to the 15-year “bubble”shown in figure 7. In-flight collision with object accidents decreased over the period studied(fig. 13). However, the number of accidents in the loss of control category virtually doubled in thelast 15 years of the study period relative to the first 15 years.
Single-engine rotorcraft dominated the accident history because they constituted most of the fleetover the study period; for these aircraft, loss of engine power was the most prevalent first event. Thecauses of loss of engine power are shown in figure 14. More than one-half of the loss of enginepower accidents were related to fuel/air mixture. In fact, fuel exhaustion, followed by an inadequateor otherwise unsuccessful autorotative landing, was the major factor in single-engine rotorcraftaccidents, regardless of whether the rotorcraft was piston or turbine powered. Note that figure 14shows that there was no confirmed reason for loss of engine power in one-fourth of the 2,408accidents.
4.2 Accident Statistics
Before detailing accident trends for each rotorcraft type, the applicability of accident statistics needsto be discussed. Frequently, these statistics are presented as accidents per 100,000 flying hours,passenger miles, etc. These statistics are relatively accurate for air-carrier operations where there arestatutory requirements for the accurate recording and reporting of such data. The situation isdifferent for general aviation, which includes most rotorcraft operations. Appendix B and detailedrotorcraft-type discussions presented below describe the method the FAA uses to obtain data on thesize and composition of the civil aircraft fleet. The FAA yearly aircraft registration data are anestimate, based on voluntary returns by aircraft owners to an FAA mailing to a sample of recorded

17
owners. In turn, fleet flight hours are a further estimate based on voluntary reporting by therespondents to the FAA mailing. As a result, we believe that the FAA reported registered fleet size,despite its shortcomings, is a more reliable measure of annual aircraft use than reported flight hours.Therefore, we have elected to normalize yearly accident counts by reported registered fleet size andpresent accident rates per 1,000 registered aircraft (fig. 15). The accident trend data so normalizeddo not highlight the accident “bubble” of figure 7.
Extrapolating the annual accident rate data, it appears that without a substantial effort to improverotorcraft safety, the overall trend projects to 6 accidents per 1,000 registered rotorcraft in the year2010. If the rotorcraft fleet doubles over the next 15 years (i.e., to 25,000 aircraft), the industry willexperience 150 accidents a year—about 3 per week. In short, although the accident rate mightremain constant at 6 per 1,000 registered rotorcraft, the public would likely find the projectedfrequency of accidents unacceptable. It is doubtful that the public in the year 2010 would considerthis to be much of an improvement over today’s situation.

18
THIS PAGE INTENTIONALLY BLANK

19
5. COMMERCIAL SINGLE-PISTON ENGINE HELICOPTERS
5.1 Fleet History and Growth
The modern era of U.S. civil rotorcraft operations officially began on 8 March 1946 with the CAAcertification of the Bell Model 47. In that year, Bell began a first lot production run of 10 rotorcraft.The two-place Model 47 was followed by the four-place Sikorsky S-51, certificated 17 April 1947.The S-51 was developed from Sikorsky’s R-5 military helicopter and benefited from experiencegained with the smaller R-4 and R-6 military models. On 14 October 1948, the CAA certificated theHiller Model 360, the beginning of the UH-12 series. By the end of 1957, the CAA census reported540 registered helicopters in the civil fleet (table 5).
TABLE 5. CAA HELICOPTER CENSUS AT END OF 1957a
Manufacturer Model Activeb Inactive Total
Bell Aircraft Corp. 47 246 49 295
Hiller Helicopters UH-12 29 20 49
R-4, R-6, S-51, S-52 14 25 39
S-55 27 12 39
Sikorsky
S-58 21 0 21
All others Various 33 64 97
Total 370 170 540
aThe CAA “Statistical Study of U.S. Civil Aircraft” as of January 1, 1958 (i.e., the end of 1957) was theearliest the authors found that contained a breakdown by rotorcraft model.bThe CAA segregated aircraft by “active” and “inactive” based on the following definitions, which are fromthe Preface to the January 1964 census: “Active” aircraft, as defined by the FAA, are those which hold avalid certificate of airworthiness and which have had an approved inspection during the last 12 months andare eligible to fly. Aircraft classified as “inactive” need not necessarily be in unairworthy condition and mayhold a valid airworthiness certificate, but they have not met the periodic inspection requirement. In lateryears, “active” became “eligible” and “inactive” was replaced with “ineligible.” In 1970, the FAA returnedto using “active” and “inactive” descriptions; however, the definitions changed (see text). Regardless of thewords or definitions used, no consistent count of the number of aircraft actually flying appears available.
The size of the single-piston helicopter fleet grew substantially after the type was first introduced(fig. 16). This growth continued until the early 1980s when the market for new rotorcraft virtuallycollapsed.
To obtain the fleet size, FAA census data (ref. 12) were edited by the principal author to correct suchobvious errors as incorrect coding of engine types. Many models were (and still are today) listed asturbine-powered but are well known in the industry to be piston-powered (refs. 13 and 14). These

20
coding errors, which originated at the FAA’s Mike Monroney Aeronautical Center in OklahomaCity, illustrate the daunting task of maintaining an accurate, up-to-date database of 350,000 aircraft.
Figure 16 shows a drop of about 350 in the number of single-piston helicopters from 1969 to 1970.This drop “resulted from changes introduced by a new and improved aircraft data system which willproduce more reliable data pertaining to the nation’s civil aircraft fleet,” according to the Census ofU.S. Civil Aircraft for calendar years 1971/1970 (ref. 12). Approximately 24,000 aircraft in the civilaircraft fleet of 190,000 were “deregistered” as reported in this 1971/1970 census. Additionally, thiscensus stated the following:
“Beginning in 1970, the aircraft universe was divided into two major categories:
1. Active—All legally registered civil aircraft for which flight hours were reported orimputed. (Refer to “Method of Imputation.”)
2. Inactive—All legally registered civil aircraft that do not meet the above-mentionedcriteria.”
This 1971/1970 census report established the FAA’s statistical method for estimating the number ofactive and inactive aircraft and the hours flown by the active aircraft. The method was requiredbecause “so many owners failed to furnish aircraft activity on their revalidation forms.” Thisstatistical process (i.e., the “Method of Imputation” established in 1970) is still used today.Unfortunately for data collectors and analyzers, the FAA survey questionnaires are mailed to onlyabout one-tenth of all aircraft owners of record and only about one-half of those respond.
Figure 16 shows that the single-piston helicopter fleet had four distinct growth periods since 1955.Between 1955 and 1970, the fleet grew, on average, by 127 rotorcraft per year. From 1970 to 1980,the growth rate increased to 193 per year, a 52% increase. During the 1980’s, the boom collapsedand the fleet size declined from 1980 to 1989. The fourth period, 1989 through 1997, showed onlymodest growth.
Figure 16 also shows single-piston fleet size data published in Air Track’s Rotor Roster (ref. 15), arecognized source for information about the world’s helicopter fleet. Their records differ from FAArecords because Air Track follows transactions and other detailed data, and “uses multiple sources toarrive at a conclusion of who and where.” The 1997 listings from the FAA and Air Track werecompared and it was found that about 90% of the data they contained were in agreement. However,neither the FAA nor Air Track knew how many rotorcraft were actually flying (i.e., active) in anygiven year.
5.2 Accident Analysis
The number of reported accidents investigated by the NTSB is not in doubt, however. Despite thegrowing number of aircraft in the fleet (fig. 16), the number of single-piston rotorcraft accidents peryear dropped over the 34 years, as figure 10 shows. The accident rate, in accidents per 1,000registered rotorcraft, generally decreased from 1964 to 1985 (fig. 17). However, a period of no

21
improvement in the rate occurred between 1985 and 1990. This was followed by a return to afavorable trend from 1990 through 1997.
These accident trends (figs. 10 and 17) for commercially manufactured, single-piston helicoptersraise two questions. First, what caused the increased number of accidents between 1971 and 1983?Second, what caused the 5-year period of no improvement in accident rates between 1985 and 1990?To answer these two questions requires more details about how the number of accidents in each firstevent category varied with time.
To reiterate, approximately 90% of the 5,371 single-piston helicopter accidents fell into 7 of the 21NTSB first event categories, as shown in table 6 (see also fig. 18).
TABLE 6. SINGLE-PISTON ACCIDENT COUNT AND DISTRIBUTION,1963–1997
29% Loss of engine power (1,554 accidents)
18% In-flight collision with object (953)
11% Loss of control (625)
12% Airframe/component/system failure or malfunction (639)
9% Hard landing (483)
8% In flight collision with terrain/water (443)
5% Rollover/nose over (290)
7% Other (384)
100% Total (5,371)
The trends in the number of accidents per year for the top four first event categories are shown infigures 19 and 20. The “bubble” in total accidents between 1971 and 1983 began with an increase inloss of engine power and airframe failure accidents (fig. 19). During this period, in-flight collisionswith objects and loss of control accidents remained essentially constant (fig. 20). As a result, thetotal number of accidents each year was higher than the long-term trend line. The “bubble” endedwhen the trends in loss of engine power, airframe failure, and in-flight collision with objectaccidents turned downward. The drop in accidents at the end of the “bubble” would have beengreater had there not been an increase in loss of control accidents starting in 1982 (fig. 20).
Another interpretation of both the “bubble” and the no-improvement periods can be made. Considerfirst the “bubble” period. Looking back at the single-piston helicopter fleet growth, shown infigure 16, the “bubble” between 1971 and 1983 nearly coincides with a boom period in helicopterfleet size. We suggest that the 52% increase in new helicopters sold to a new and expanding group ofusers was the principal cause of the increase in accidents during this period. This interpretation gainssome validity by reexamining the accident rate per 1,000 registered aircraft trend (fig. 21). Theoverall trend is reexamined in three periods using exponential regression curve fitting. Using the first6 years of accident rate data, the regression analysis predicts, when extrapolated 16 years, the mostlikely accident rate during the “bubble” period. This extrapolation is shown in figure 21 as the light,

22
solid line. The regression analysis applied to just the “ bubble” period is shown as a dashed line infigure 21. Comparing these first two trends suggests that had the industry continued its pre-1970trend, the 1985 accident rate of 30 per 1,000 aircraft could have been nearly halved. The conclusionto be drawn offers the following cautionary note for the future: When the next rapid expansion of thefleet occurs, the industry must increase its efforts to improve safety to an extent that is more thanproportional to the fleet growth rate.
Now consider the plateau or “ no improvement period” from 1985 to 1990 shown in figures 10, 17,and 21. During this period the fleet size remained virtually constant (fig. 16). This apparent plateauwas caused by increased numbers of loss of control accidents coupled with no further reduction inin-flight collision with object accidents.
From 1990 through 1997, the most commonly occurring first events were again showing a collectivedecline in accident rate per 1,000 registered aircraft, as the heavy solid line in figure 21 suggests.However, over this period, the relative frequencies of first events changed. The distribution of thetop seven accident categories from the past 8 years, in contrast to the past 34-year history, is shownin table 7.
The positive aspect when comparing the 1990– 1997 distribution to the data over the entire 34 yearsis that in-flight collision with object accidents dropped substantially (i.e., from 18% to 12%). Thealarming aspect is that the loss of control category doubled (i.e., 11% to 22%). Furthermore, littleimprovement was made in the airframe/component/ system failure or malfunction category and lossof engine power remained the number one first event.
TABLE 7. SINGLE-PISTON ACCIDENT DISTRIBUTION, LAST 8 YEARS VS. 1963– 1997
Last 8 years Last 34 years
First event category Percent Number Percent Number
Loss of engine power 27 (207) 29 (1,554)
In-flight collision with object 12 (91) 18 (953)
Loss of control 22 (166) 11 (625)
Airframe/component/system failure ormalfunction
10 (80) 12 (639)
Hard Landing 7 (56) 9 (483)
In flight collision with terrain/water 8 (63) 8 (443)
Rollover/nose over 4 (340) 5 (290)
Other 9 (69) 7 (384)
Total 100 (766) 100 (5,371)

23
Most discouraging is the fact that fuel exhaustion (i.e., simply running out of gas) was still thenumber one factor in losing engine power. The FARs are quite clear about fuel reserves. Forexample, FAR Parts 91.151 and 91.167 state the following:
Sec. 91.151 Fuel requirements for flight in VFR conditions.
(a) No person may begin a flight in an airplane under VFR conditions unless(considering wind and forecast weather conditions) there is enough fuel to fly to thefirst point of intended landing and, assuming normal cruising speed
(1) During the day, to fly after that for at least 30 minutes; or
(2) At night, to fly after that for at least 45 minutes.
(b) No person may begin a flight in a rotorcraft under VFR conditions unless(considering wind and forecast weather conditions) there is enough fuel to fly to thefirst point of intended landing and, assuming normal cruising speed, to fly after thatfor at least 20 minutes.
Sec. 91.167 Fuel requirements for flight in IFR conditions.
(a) Except as provided in paragraph (b) of this section, no person mayoperate a civil aircraft in IFR conditions unless it carries enough fuel (consideringweather reports and forecasts and weather conditions) to—
(1) Complete the flight to the first airport of intended landing;
(2) Fly from that airport to the alternate airport; and
(3) Fly after that for 45 minutes at normal cruising speed or, forhelicopters, fly after that for 30 minutes at normal cruising speed.
(b) Paragraph (a)(2) of this section does not apply if—
(1) Part 97 of this chapter prescribes a standard instrument approachprocedure for the first airport of intended landing; and
(2) For at least 1 hour before and 1 hour after the estimated time ofarrival at the airport, the weather reports or forecasts or anycombination of them indicate—
(i) The ceiling will be at least 2,000 feet above the airportelevation; and
(ii) Visibility will be at least 3 statute miles.

24
On this issue of loss of engine power due to fuel exhaustion, Mayo’s November 1921 statement that“ probably 90% of them [i.e., accidents] were due to carelessness and could have been avoided, hadthe necessary precautions been taken” is quite applicable today (ref. 2).
Based on the data from 1990 through 1997 and on analysis that shows that the rotorcraft accidentnumber and rate histories are examples of statistically stable systems, it is projected that by the year2010, the annual accident rate for commercially manufactured, single-piston helicopters may still beabove 5 accidents per 1,000 registered aircraft. This projection (fig. 22) assumes “ a business-as-usual” approach by the rotorcraft industry and no major changes in the system (e.g., major newaircraft categories such as tilt rotor or missions). It appears that without the “ bubble” and the “ no-improvement” periods, the industry would already be at this rate.
5.3 Detailed Analysis by Accident Category
Of the 8,436 rotorcraft accidents, single-piston helicopters that were commercially manufacturedhad 5,371 accidents. Of these, 3,771 (about 70%) were associated with just four first eventcategories. Therefore, an in-depth analysis of these four top categories provides considerable insightinto nearly one-half of all rotorcraft accidents during the 34-year period under study. The nextseveral paragraphs and associated figures and tables provide detailed analyses gleaned from themini-briefs of the four categories (loss of engine power, in-flight collision with objects, loss ofcontrol, and airframe failures).
5.3.1 Loss of Engine Power (1,554 Accidents)
The pilot of any type of single-engine, heavier-than-air aircraft experiences a true emergencyfollowing loss of engine power. However, helicopters provide some safety margin over their fixed-wing counterparts because of their inherent ability to glide with a turning rotor (i.e., theirautorotation capability) and their generally slower power-off landing speed. These relative safetyadvantages are often negated, however, because helicopter pilots routinely operate their rotorcraftmuch closer to the ground where time to react is minimal.
5.3.1.1 Overall Accident Trends. From 1963 through 1997, loss of engine power was implicatedby the NTSB in 1,554 accidents involving commercially manufactured, single-piston helicopters.Accidents that occurred during this 34-year period took a large toll (table D-24). The 1,554accidents directly affected 2,621 people: 106 were killed and 234 were seriously injured; 2,281survived with minor or no injuries. Of the 1,554 helicopters involved, 265 were listed as destroyedby the NTSB. Another 1,286 helicopters were substantially damaged, and only 3 received little or nodamage. Figure 19 shows that the overall trend in accidents per year for this first event categorydecreased over the last 17 years. As a rate of accidents per 1,000 registered single-piston helicopters,accidents initiated by the loss of engine power showed steady improvement, as seen in figure 23.However, loss of engine power constantly accounted for approximately 30% of the accidents overthe 34-year period (fig. 23).
5.3.1.2 Loss of Engine Power by Category. The NTSB cited the reason for loss of engine powerin 1,157 of the 1,554 accidents they investigated. Table D-12 shows that 18 primary reasons laybehind the 1,157 accidents. When the 18 reasons are grouped by major subsystems, fuel/air mixture

25
problems caused 686 of the 1,157 accidents (fig. 24). A closer inspection of figure 24 and theassociated mini-briefs reveals that fuel exhaustion, fuel starvation, fuel contamination, etc., wererepetitive examples of the “ poor piloting” discussed by Mayo (ref. 2). In fact, simply running out ofgas was the number one reason for loss of engine power throughout the 34-year period under study.
Both figure 24 and table D-12 indicate that over 100 accidents were incorrectly charged to loss ofengine power. For example, when the final determination was made, 53 accidents attributed to lossof engine power were actually rotor drive system component failures, more correctly charged to theairframe/component/system failure or malfunction first event category. Other subcategories, whichaccounted for 54 accidents, were more generally found in the loss of control first event category. Onthe other hand, several accidents attributed to airframe failure, for example, were actually enginefailures.
5.3.1.3 Loss of Engine Power by Activity. The commercially manufactured helicopter, poweredby a single-piston engine, has been the breadwinner in the rotorcraft industry, as recounted inreference 16. The most intensive activity as a “ breadwinner” has been aerial application(i.e., agricultural operations). This activity has always been high-risk and led to the most accidentsin the loss of engine power first event category, as figure 25 shows.
Aerial application operations are conducted at extremely low heights above the ground (on the orderof 100 feet or less). This frequently requires flight in the "avoid" regions of the helicopters'height/velocity diagram and offers little time and height for the pilot to perform a successfulautorotation. Other activities in which single-piston helicopters engage are generally conductedbetween 500 and 1,500 feet above ground level (AGL). Loss of engine power in this height rangeshould allow the practiced pilot time to enter autorotation and perform a safe power-off landing.Unfortunately, as will be discussed shortly, the average pilot proficiency in accomplishing this taskappears insufficient in view of the number of destroyed and substantially damaged helicopters.
5.3.1.4 Loss of Engine Power by Phase of Operation. Loss of engine power was experienced inevery phase of operation in which the single-piston helicopter operated, as figure 26 shows. Notunexpectedly, the overwhelming loss of engine power situations occurred in cruise flight, whichreflects the general aviation character of helicopter use. The high power required in takeoff andclimb evidently accounted for this subcategory being the second most common phase of flight inwhich accidents occurred. The helicopter inherently allows low-speed, low-altitude maneuvering,which generally requires operation at high power. Therefore, it is reasonable that the 328 accidentsin this flight phase could be combined with the 280 accidents in takeoff and the 53 accidents inhover. This suggests a total of 661 accidents during high-power operations vs. 607 accidents duringcruise. Since the helicopter has been designed and marketed for hovering and for slow, low-altitudeflight, the ratio of 661 to 607 or 108% does not appear unreasonably high for this type of aircraft.
5.3.1.5 Power-Off Landing. Apparently, the power-off landing that follows a loss of engine poweris considered “ successful” by the industry today if (1) there is no serious injury and (2) the mainrotor blades are destroyed while severing the tailboom or when the helicopter rolls over. In otherwords, “ If you can walk away from it, it’s successful.” This conclusion was arrived at after severalinformal conversations with members of the insurance industry, instructional and high-time pilots(both civil and military), and operations personnel from one firm primarily engaged in helicopterpilot training. Today’s initial or recurring training of helicopter pilots rarely includes completion of

26
the simulated power-off landing to touchdown. Rather, the average pilot is well schooled in thetransition from powered to unpowered autorotational flight, proper gliding techniques, and the flaremaneuver required just prior to touchdown. At this point, the pilot under instruction (perhaps withinstructor assistance) generally increases power to end up in a hover. The industry premise appearsto be that if the average pilot can successfully accomplish the maneuver to the flare point, the oddsare that the final outcome in a real emergency will be “ successful,” albeit with the possible level ofdamage listed above.
This standard for power-off landing training was initially adopted by U.S. Army Aviation during theVietnam War. That war’s requirement for many new helicopter pilots led to a high accident ratewhen training military students to complete the power-off autorotational landing to touchdown. Thecost of these training accidents was deemed greater than the benefit during emergency experiencesin the field and the training syllabus was changed accordingly. Today, the FAA Practical TestStandards* (pp. 2– 13, par. 4 C, Task— Power Plant Failure, Single engine helicopter) also reflect thisproficiency standard associated with a pilot’s certification.
The NTSB’s mini-briefs provide any number of narratives describing the recurring events followingloss of engine power. For example, the narrative for a loss of engine power accident that occurred3 February 1982 (NTSB File No. 0059) states:
“ THE ENGINE LOST POWER DURING A NIGHT FLIGHT WHILE ENROUTETO OBTAIN FUEL. THE LOW RPM AUDIO AND WARNING LIGHT WERENOTED WHEN THE LOSS OF POWER OCCURRED. THE PILOT ENTEREDAN AUTOROTATIVE DESCENT AND TURNED TO LAND ON ANINTERSTATE HIGHWAY. AS HE STARTED TO DECELERATE FOR LANDING,POWER LINES BECAME VISIBLE IN HIS FLIGHT PATH. HE DUMPED THENOSE AND DOVE UNDER THE POWER LINES, THEN FLARED ANDTOUCHED DOWN AT ABOUT 25 TO 30 MPH. DURING THE LAST PART OF AGROUND SLIDE, THE MAIN ROTOR STRUCK A POLE FOR AN OVERHEADSIGN AND A SPEED LIMIT SIGN. NO PRE-ACCIDENT ENGINE FAILURESWERE FOUND.” [Note: The pilot was not injured and the damage to the helicopterwas substantial.]
The recurring theme from the 1,554 loss of engine power narratives was that if the engine quit, thepilot was most probably over the most unsatisfactory terrain for an emergency landing. The mini-brief narratives continually suggested that even near-perfect pilot technique would most likely onlyminimize damage. The subsequent autorotative landing by the average pilot was almost invariably ahard one. The rate of decent and/or forward speed were rarely zeroed out prior to touchdown. Thehelicopter frequently was flared too high above the ground, causing the tail skid to hit the groundfirst. This caused the helicopter to rock forward as the main skids touched down and the main rotortip path plane to tilt aft, severing the tailboom. In many other cases, if the emergency landing areawas soft, the helicopter slid, dug a skid into soft ground, and rolled over. In other cases, the pilotcaused the main rotor to tilt aft and sever the tailboom in attempting to brake the slide with full aftcyclic stick. The preceding sequences reflect our analyses of the 1,554 mini-brief narratives thatwere read in the course of this work. *This document can be found at www.mmac.jccbi.gov/afs/afs600/akt.html#pts.

27
Taken in total, it appears that helicopters in the current civil fleet have insufficient stored energy forthe average pilot to successfully complete the final autorotational flare and touchdown, in mostcases. To be sure, skilled pilots frequently demonstrate the helicopter’s inherent autorotationcapability following loss of engine power by softly landing on a paved surface with near zeroforward motion. However, this is not a good measure of what the average pilot, under emergencyconditions, can do in day-to-day operations in the field.
Appendix C provides additional discussion concerning accidents involving autorotations.
5.3.1.6 Conclusions About Loss of Engine Power Accidents. Of the 8,436 rotorcraft accidentsrecorded by the NTSB during the 34-year period from mid-1963 through the end of 1997, 5,371accidents involved commercially manufactured, single-piston helicopters. Of these, 1,554, orroughly 30%, were attributed to loss of engine power. No fewer than 686 accidents were directlytraced to fuel/air mixture problems. Virtually every one of the 686 accidents was caused by humanerror. Fuel exhaustion, fuel starvation, and fuel contamination accounted for over 400 of the 686accidents. Apparently, many pilots disregarded the engine’s need for clean fuel and air in properproportions— to say nothing about the FAA regulations for fuel reserves.
Structural failure of the single-piston engine caused 263 accidents, and the reason for the loss ofengine power was not established in 397 accidents.
Virtually every one of the 1,554 loss of engine power accidents resulted in a substantially damagedor destroyed helicopter. Therefore, the fact that power-off landing proficiency is not required by theFAA to obtain a helicopter pilot’s certification appears inconsistent with the number of accidents. Italso appears that helicopters currently in the civil fleet provide marginal to inadequate autorotationalcapability for the average pilot to successfully complete the final flare and touchdown to a generallyunsuitable landing site. Clearly, training in full autorotation landings— even to a prepared landingsite— is avoided because of both real and perceived risks.
5.3.2 In Flight Collision with Object (953 Accidents)
One of the most widely known advantages that helicopters have over fixed-wing aircraft is theircapability to hover, fly slow and low, and operate in confined areas. Thus, they are routinely used injust this manner and therefore encounter a more hostile environment that is full of objects such aswires and towers that are hard to see. Hence, it is not unexpected that accidents involving in-flightcollision with objects constitute a large portion of rotorcraft accidents. Depending on the severity ofthe collision, a pilot may or may not be able to recover. If the helicopter’s main rotor control is lostfrom a blade strike, or if the altitude is insufficient for autorotation, recovery, and safe landing maynot be possible. If directional control is lost following a tail rotor strike, any recovery at all becomesextremely difficult.
5.3.2.1 Overall Accident Trends. The NTSB cited in-flight collision with object as the first eventin 953 single-piston helicopter accidents from mid-1963 through 1997. These collision with objectaccidents affected 1,416 people: 166 were killed and 205 suffered serious injuries;1,045 survived with minor injuries or no injuries at all. Of the 953 helicopters involved, 327 werelisted as destroyed by the NTSB. Another 620 helicopters were substantially damaged; only 6received little or no damage. Figure 20 shows that the overall trend in accidents per year for this first

28
event category decreased substantially during the first 17 years of the 34-year study period.However, as figure 27 shows, in-flight collision with object accidents leveled off at about 12% of theannual single-piston helicopter accidents. In terms of annual accidents per 1,000 registered single-engine helicopters, the trend in the later years shows no substantial reduction (fig. 27).
5.3.2.2 Collision with Object by Object Hit. Figure 28 lists the type of objects that were hit in thefirst event category, referred to as in-flight collision with object. Unquestionably, wires and thecombination of wire/pole were the most prevalent objects hit. Together, these two objects accountfor 507 (53%) of the 953 accidents. With respect to collisions with trees, the mini-briefs frequentlywere unclear whether the pilot descended into a forest of trees (and would have hit whatever wasbetween the aircraft and the ground) or clipped a branch of one tree from the side. The latter mighthave been a result of misjudging distance or not correcting for drift. Most of the other objects wereman-made. Of the 32 accidents associated with the airport/helipad facility objects, most of thesefacilities were oil rigs. Conventional heliport design, therefore, did not appear to be an issue.
5.3.2.3 Collision with Object by Cause. The accidents were further subdivided by the conditionthat resulted in an object strike. We chose the 12 categories shown in figure 29. It is evident that animproper decision, which includes poor planning, inadequate training and misjudging clearances,was the most common cause, followed by the two least descriptive categories; Failure to see andavoid and undetermined. Failure to see and avoid was used as a “ catchall” category for accidents inwhich more specific detail was not available in the mini-brief. For the agricultural application orcrop dusting activity, failure to see and avoid was the most frequently reported cause. Since mostaccidents in agricultural operations do not result in fatalities, reports were often sketchy. Quite often,however, “ crop dusters” appeared to know where the obstacles were relative to a field, but for somereason (e.g., fatigue, sun glare, misjudging distance, etc.) still collided with them.
Degraded visibility encompassed fog, instrument meteorological conditions, snow, rotorwashbrownout and whiteout darkness, and sun glare; most of these accidents involved sun glare, however.
Not surprisingly, the most frequent condition found for external load and proximity to obstacle workwas precisely the nature of the task: proximity to obstacles. This was followed by improper decisionand performance or RPM issues. For emergency operations, the most frequent cause of collisionwith objects was inadequate RPM, followed by wind drift and diverted attention.
5.3.2.4 Collision with Object by Phase of Operation. The phase of operation during whichcollision with object accidents occurred is shown in figure 30. As might be expected, collisionsoccurred most frequently during maneuvering, a typical phase of flight for aerial applicationoperations. Aerial application involves extensive maneuvering to ensure complete coverage of thefield being treated. Takeoff, cruise, and landing (taken to together) accounted for 335 of the953 collision with object accidents. Cruise in a helicopter generally occurs at low altitude and atrelatively high speed, which makes it more difficult to avoid wires that are difficult to see in the firstplace.
5.3.2.5 Collision with Object by Activity. The mini-briefs were analyzed to determine the activityin which a pilot was engaged when a collision with object accident occurred. The activities wereextracted from the narratives based on FAR paragraph numbers and the verbal description of the

29
activity. The accidents were placed into 10 activity groups, 7 of which accounted for over 95% ofthe total. The distribution by activity is shown in figure 31.
This activity analysis overlapped the phase of operation analysis in revealing that accidents occurredmost frequently during aerial application and general utility operations, which includes, forexample, aerial surveying, herding, and hunting. The activities involving passenger service,personal, and business use accounted for 237 of the 953 collision with object accidents. Thefrequency of accidents that occurred during instruction clearly showed that student pilots, bynecessity, focused their attention more on learning to operate the aircraft than on avoiding obstacles.Student pilots were also relatively inexperienced in judging distances, maintaining RPM andavoiding drift. The pilots flying personal flights may have also been inexperienced in these areas andmay have suffered from lack of regular practice.
5.3.2.6 Collision with Object by Part Hit. The part of the helicopter involved in a collision wasrarely mentioned in NTSB summary reports. The statistics available on this subject are shown infigure 32. For the 228 (23.9%) of the 953 single-piston helicopter collision with object accidents inwhich such data were reported, the most frequent rotorcraft components involved in collisions werethe tail and main rotor blades. The main rotor collisions differed from tail rotor collisions: therotorcraft were, more often, in forward flight when a main rotor strike occurred. In contrast, tailrotor strikes occurred, most often, when the pilot “ dragged the tail” or was backing up. Thesecomponents together accounted for 170 (75%) of the 228 accidents in which the part hit wasreported, but it is not clear whether this statistic can be extrapolated to the total of 953 accidents.
5.3.2.7 Conclusions About In-Flight Collision with Object Accidents. Of the 8,436 rotorcraftaccidents recorded by the NTSB during the 34-year period from mid-1963 through the end of 1997,5,371 involved commercially manufactured, single-piston helicopters. Of these, 953, or roughly18%, were attributed to in-flight collisions with objects. Nearly one-half (471) of the 953 accidentsoccurred during aerial application (i.e., crop spraying) activities. Wire, wire/pole and treesaccounted for 655 of the accidents. Wire strikes, agricultural operations, and main and tail rotorstrikes were the dominant characteristics of collision with object accidents. The uniquecharacteristics of rotorcraft and the missions flown (e.g., proximity to obstacles, frequent low-altitude flight) were reflected in the types of objects with which helicopters collided.
To adequately address and reduce the number of collision with object accidents, systematic changesmust be implemented in the human (e.g., improved training and ongoing pilot development), theaircraft (e.g., less sensitivity to environmental conditions, more robust controllability), andassociated equipment (e.g., proximity sensors, enhanced visibility devices).
5.3.3 Loss of Control (625 Accidents)
Helicopters (particularly the small, single main rotor with antitorque tail rotor configuration) aregenerally perceived to be difficult to fly. Unlike pilots of their fixed-wing counterparts, thehelicopter pilot must constantly maintain control of four primary axes that are frequently tightlycoupled. The control of vertical position requires a collective pitch control stick. Roll and pitch arecontrolled with a cyclic stick, which is comparable to the fixed-wing stick or yoke. Left and rightpedals control antitorque and directional heading. Finally, constant control of engine RPM with amotorcycle-like twist-grip throttle attached to the end of the collective stick is required. A pilot

30
must, therefore, use both feet and both hands, as well as a left-wrist twist motion to fly most piston-powered helicopters successfully.
In and near hover, the helicopter is inherently unstable in both roll and pitch. Constant movement ofthe cyclic stick in all directions is required to maintain an upright attitude above a desired point.Early helicopters, such as those manufactured by Hiller and Bell, incorporated mechanical devicesto reduce roll and pitch instability. Those devices became known as the “ Hiller servo paddle” andthe “ Bell bar.” The primary control coupling that increases pilot workload involves balancingantitorque so the aircraft generally maintains the desired heading. The antitorque balance is alteredwhenever collective pitch or engine RPM is altered.
At typical cruise speeds, the helicopter’s positive stability is quite similar to that of a fixed-wingaircraft. Little attention to the collective stick and the twist-grip throttle is required. The pilot isrequired to coordinate only cyclic stick and pedals to maintain trim and comfortable control of theaircraft.
To date, no commercially manufactured helicopter, powered by a single-piston engine, is availablewith stability augmentation or an autopilot, either of which could reduce pilot workload and enhancesafety.
5.3.3.1 Overall Accident Trends. From 1963 through 1997, the NTSB cited loss of control in625 accidents involving commercially manufactured, single-piston helicopters. Accidents thatoccurred during this 34-year period took a large toll (table D-24). The 625 accidents directlyaffected 1,048 people: 92 were killed, 105 were seriously injured, and 851 survived with minor orno injuries. Of the 625 helicopters involved, 194 were listed as destroyed by the NTSB. Another428 helicopters were substantially damaged; only 3 received little or no damage. Figure 20 showsthat loss of control accidents per year decreased over the first 17 years of the study period. However,this type of accident showed a rapid increase in 1982, remained at a relatively high level until 1991,and then dropped. Figure 33 shows that loss of control accounted for a growing percentage ofsingle-piston helicopter accidents from 1980 through 1997. When expressed as the number ofaccidents per 1,000 registered single-piston helicopters, accidents initiated by loss of control showedlittle improvement during the last 17 years (fig. 33).
5.3.3.2 Loss of Control by Phase of Operation. Considering the phase of operation in which lossof control occurred, the accidents fell into the 11 categories shown in figure 34. As might beexpected, loss of control occurred most frequently during the hover and takeoff phases of a flight.The control input precision required for hovering, combined with a lack of time and altitude to reactto abnormal conditions and aircraft sensitivity to environmental inputs (e.g., winds, density altitude)combined to put the greatest demands on a pilot. Most rotorcraft powered by a piston engine requireconsiderable throttle manipulation, which adds additional workload, particularly duringmaneuvering.
5.3.3.3 Loss of Control by Activity. The accident records were analyzed to determine thefrequency distribution of loss of control accidents by flight activity. The activity was extracted fromthe narrative based on FAR paragraph numbers and verbal description in the NTSB mini-brief.Eleven activities dominated, as shown in figure 35. Single-piston helicopters had the most loss ofcontrol accidents during instructional, agricultural, and personal-use operations. It appears that the

31
lower cost of purchasing and operating single-piston helicopters made them more attractive for theindividual and agricultural operator. Furthermore, most basic civilian rotorcraft pilot training takesplace in single-piston helicopters.
Instructional flights were the most prevalent activity in which loss of control occurred. Consideringinstructional flights that resulted in accidents, approximately 43% occurred during dual flights andabout 28% during solo flights. The remainder occurred during general instruction (17%), practice(11%), or check rides. These statistics illustrate the difficulty of piloting rotorcraft and the extremedemands placed on both student and instructor during training activity. This, in turn, emphasizes theimportance of proper training, evaluation, and professional development of the rotorcraft instructorcorps. Not only does the quality of instruction and instructor directly affect the quality of the newlytrained helicopter pilot, but also the demands of instruction itself require the highest professionalstandards.
The second largest number of loss of control accidents occurred during agricultural flying. Theseoperations require constant low-altitude maneuvering in close proximity to obstacles, frequent low-speed and downwind flight, service from unprepared areas (e.g., fields, landing trailers), flight atnight (especially in hot climate areas), and extensive travel from job site to job site. These factors,among many others, resulted in a higher risk of control problems occurring in flight with little or notime for the pilot to recover.
Personal-use flights were the third most frequent type of activity when vehicle loss of controloccurred. However, the specific flying tasks ranged from point-to-point transportation to high-riskmaneuver practice. The range of aircraft and maintenance characteristics varied from owner-maintained to rentals from a commercial aircraft enterprise.
5.3.3.4 Loss of Control by Cause. The accident mini-briefs were further analyzed in an effort tounderstand the conditions that were associated with the control loss. We consolidated reasons thatappeared to precipitate the control loss into 12 categories, as shown in figure 36.
Improper operation of the flight controls was the single factor most frequently implicated in loss ofcontrol accidents. Although it is tempting to assert that “ pilot error” must, therefore, be the biggestsingle problem, this conclusion is not fully supported. Since aircraft control is the result of bothpilot capability and aircraft design, any effort to address the “ improper operation of controls”problem must address both factors. Human-centered actions (e.g., improved training, strictercurrency/proficiency requirements) will be relatively ineffective if airframes are designed andcertificated with known adverse flying characteristics (e.g., an unusual tendency toward loss of tailrotor effectiveness or extreme control sensitivity in one or more axes). Conversely, even inherentlysafe designs may fail if pilots are inadequately trained or lack safety consciousness.
5.3.3.5 Loss of Control by Axis. In an attempt to determine which control axis might be the mostdifficult for the pilot, it was noted that only 338 of the 625 single-piston helicopter accidents weredescribed in sufficient detail to permit such a distinction. The distribution that did emerge is shownby figure 37. In many cases, loss of control appeared to begin with a loss of rotor RPM, whichoccurred for a variety of reasons. Therefore, figure 37 provides the noted problems in each axis(pitch, roll, yaw, and vertical) where low rotor RPM was not involved. Many mini-briefs stated theaxis and also noted that low rotor RPM was a factor. Thus, to interpret figure 37’s total loss of yaw

32
control count, one adds the 21 accidents with low rotor RPM to the 95 accidents without low rotorRPM for a total of 116 yaw axis-related accidents.
Figure 37 indicates that pilots experienced the most loss of control accidents in the yaw axis andvertical axes, most frequently during the hover and takeoff phases of a flight. Of the 338 accidents,235 involved loss of yaw and/or vertical control. Because the yaw and vertical axes are quite coupledin today’s single-piston helicopter fleet, this is not an unexpected result. There were 103 main rotorcyclic-related (i.e., pitch and roll) loss of control accidents. Thus, loss of directional control andvertical position accounted for nearly 70% of the loss of control accidents in single-pistonhelicopters.
5.3.3.6 Loss of Control by Pilot-in-Command Certification Level. The last characteristic of lossof control accidents analyzed in detail was the reported certification level of the pilot in command(PIC). The authors examined only mini-briefs from 1963 through 1982 in detail for the PIC data.Cross-checking was made against data from 1993, 1994, and 1995 that was available at the NTSBweb site.* Therefore, only 461 of the 625 single-piston helicopter mini-briefs were examined. Thedata reviewed yielded the distribution provided in figure 38. The most striking finding was that thePIC held at least a commercial rating in well over 60% of loss of control accidents. It should also benoted that loss of control accidents involved student pilots (55), private pilots (77), and pilots withno certificates (12). Since we do not know how many pilots there were at each certification level, wecannot draw any conclusions about the relationship between certification and accidents. However, itis clear that loss of control accidents involved pilots of all certification and experience levels.
5.3.3.7 Conclusions About Loss of Control Accidents. Of the 8,436 rotorcraft accidents recordedby the NTSB during the 34-year period from mid-1963 through the end of 1997, 5,371 accidentsinvolved commercially manufactured, single-piston helicopters. Of these, 625, or roughly 12%, wereattributed to loss of control. In the 338 accidents for which the control axis loss was specified, 235involved loss of yaw and/or vertical control. Current single-piston helicopters appear to have ahighly coupled vertical/yaw/power/RPM flight characteristics that, potentially, led to as many astwo-thirds of the loss of control accidents.
Loss of control accidents occurred most frequently during instructional and training activities (152).However, aerial application, general utility, and personal-use activities together accounted for347 accidents. This suggests that no activity was immune to a loss of control accident. Loss ofcontrol accidents occurred with pilots of all certification and experience levels at the controls.
The overall impression from the large number of loss of control accidents is that the single-pistonhelicopters currently in the registered fleet are inordinately difficult to fly, particularly when thepilot must devote some attention to any other task. Clearly, given today’s technology, the handlingqualities of this helicopter type could be substantially improved.
*The information can be found on the web at http://nasbac.faa.gov/asp/asy_ntsb.asp. Access to this site allows a searchby each specific NTSB accident document number.

33
5.3.4 Airframe/Component/System Failure or Malfunction (639 Accidents)
In the United States, the single main rotor with antitorque tail rotor configuration has dominated thecivil fleet. Since 1946, this configuration’s field experience has been the basis for the industry’sengineering and manufacturing experience. The many lessons learned have allowed the industry toslowly improve its product.
The helicopter requires a number of airframe systems and components not found on fixed-wingaircraft. For example, comparably sized airplanes connect the propeller directly to the engine. Inhelicopters, a much more complicated drive train is required to transmit power to the main rotor.This drive train includes a coupling from the engine to a speed-reducing gearbox that outputs powerto a main rotor mast to which the main rotor is attached. The helicopter’s main rotor has two ormore blades that are quite flexible compared to an airplane propeller and continually flex as theyturn. In fact, many helicopter systems and components are subjected to continuous vibration andflexing, which has forced the industry to become a leader in understanding failure of materials infatigue. Put simply, many airframe failures deal with this kind of question: How many times can youbend and unbend a paper clip before it breaks?
The helicopter’s overall complexity, the different materials used, and the several different ways inwhich these materials can fail (i.e., failure modes) are important factors in accidents related to theNTSB first event category of Airframe/component/system Failure or Malfunction.
5.3.4.1 Overall Accident Trends. The NTSB cited airframe/component/system failure ormalfunction (referred to from here on as simply airframe failure) as the first event in639 accidents experienced by the single-piston helicopter fleet during the study period. Accidentsthat occurred during this 34-year period took a large toll (table D-24). The 639 accidents directlyaffected 1,051 people: 153 were killed, 109 were seriously injured, and 789 survived with minorinjuries or no injuries at all. Of the 639 helicopters involved, 212 were listed as destroyed by theNTSB, and 422 helicopters were substantially damaged; only 5 received little or no damage.Figure 19 shows that the overall trend in accidents per year for this first event category remainedrelatively constant for the first 17 years of the study period. However, airframe failure accidentsshowed a rapid decrease in 1982 and remained at a relatively low level through 1997. Figure 39shows that airframe failure from 1980 through 1997 accounted for a nearly constant percentage ofsingle-piston helicopter accidents. As a rate of annual accidents per 1,000 registered single-pistonhelicopters, accidents initiated by airframe failures showed further reduction during the last 10 yearsof the study period (fig. 39).
5.3.4.2 Airframe Failures by Phase of Operation. Considering the phase of operation duringwhich airframe failures occurred, the accidents fell into 11 categories, as figure 40 shows. Airframefailures occurred most frequently during the cruise phase of a flight. The large number of airframefailure accidents associated with maneuvering occurred primarily during aerial application activity.
5.3.4.3 Airframe Failures by Activity. The accident records were analyzed to determine thefrequency distribution of airframe failure accidents by flight activity. The activity was extractedfrom the narrative based on FAR paragraph numbers and verbal description in the NTSB mini-brief.Ten activities dominated, as figure 41 shows.

34
Figure 41 shows that single-piston helicopters had the most airframe failure accidents duringagricultural operations and general utility use. These activities require (1) constant low-altitudemaneuvering in proximity to obstacles, (2) frequent low-speed and downwind flight, (3) servicefrom unprepared areas (e.g., fields, landing trailers), (4) flight at night (especially in hot climateareas), and (5) extensive travel from job site to job site. These five factors alone suggest thatmaintenance may suffer.
5.3.4.4 Airframe Failures by System/Component. For the 639 accidents involving commerciallymanufactured, single-piston helicopters, failures in over 70 systems/components resulted inaccidents. These 70 specific failures are combined into the 10 major categories shown in figure 42.
It is evident from figure 42 that the rotor drive system (both main and tail rotors combined) was themost significant airframe failure for this aircraft class. Over 38% of the 639 accidents caused byairframe failures involved problems in transmissions, drive shafts, couplings, clutches, and othercomponents of the rotor drive trains. Since drive train failure usually required an autorotativelanding (frequently with degraded control when the failure occurred in the tail rotor drive), theconsequences were often very serious. When the tail rotor (i.e., blades and hub), its drive train, andits control system are considered as one category, then over 40% of the 639 airframe failureaccidents led to loss of directional control.
The accident count is matrixed by major airframe system and failure mode terminology in table 8.The failure mode terminology used by NTSB accident investigators may lack a certain preciseengineering statement from which redesign might be initiated; however, the meaning implied byeach mode becomes clearer when related to a specific system that failed. For example, failures ofrotor system components owing to fatigue loads are hardly unexpected in the rotorcraft world.Slippage, when associated with drive systems, suggests a belt, clutch or freewheeling unitmalfunction. Material failure and failed are, of course, less informative and could be taken as thesame. On the other hand, overload could imply under-designed components or improper flighttechniques that exceeded aircraft limits flown. Foreign object damage (FOD) and rotor system areclear enough. Lack of lubrication and drive system suggest gearbox problems.
Figure 42 offers a convenient outline from which more detail about each system, subsystem,component or part failure or malfunction can be examined.
5.3.4.4.1 Drive train failures by subsystem: Figure 42 shows that the drive train from theengine to the main and tail rotors was implicated in a total of 246 (i.e., 38% of the 639) accidentsinvolving single-piston helicopters during the study period. These accidents, caused by drive-trainfailures, are distributed to a lower subsystem level, as shown in table 9.
Failure to transmit power from the engine to the main rotor gearbox accounted for 96 of the127 main rotor drive train accidents (table 9). Failure to transmit power along the tail rotor driveshaft caused 73 of the 119 tail rotor drive train-related accidents. Taken together, component failuresin these two subsystems caused 169 accidents.

35
TABLE 8. NTSB FAILURE MODE/SYSTEM MATRIX— SINGLE-PISTON HELICOPTERS
Failure modeDrive
systemRotorsystem
Controlsystem
AirframeLG All other Total
Fatigue 28 74 21 23 0 146
Improper assembly, installation,maintenance 50 20 33 26 0 129
Material failure 60 19 12 9 0 100
Undetermined/not reported 16 7 5 7 15 50
Failed 26 1 9 10 1 47
Separated 6 13 8 5 0 32
Foreign object damage 4 18 1 0 0 23
Overload 8 6 5 2 1 22
Pilot action/operational issue 2 4 0 5 6 17
Lack of lubrication 16 0 0 0 0 16
Slippage 16 0 0 0 0 16
Disconnected 8 1 5 0 0 14
Blade-airframe strike 0 9 1 0 0 10
Delaminated/debonded 0 7 0 0 0 7
Bearing failure 5 2 0 0 0 7
Bent/binding/jammed 1 0 1 1 0 3
Hydraulic leak/lock 0 0 0 0 0 0
Total 246 181 101 88 23 639
TABLE 9. DRIVE TRAIN FAILURES BY COMPONENTS—SINGLE-PISTON HELICOPTERS
Drive train— main 127
Engine to transmission drive 96
Main rotor gearbox 20
Main rotor mast 11
Drive train— tail 119
Tail rotor drive shaft 73
Tail rotor gearbox 46

36
The main rotor gearbox was cited in 20 accidents (table 9). Of these 20 accidents, gear failuresdominated. Four of the 11 main rotor mast failures were traced to the thrust bearing. In all, materialfailure was cited in 10 cases, and fatigue was implicated in 5 others; one case of a “ bogus”— ratherthan manufacture approved part— was identified. Failure within the 46 tail rotor gearboxes wastraced to bearings and gears in about equal numbers.
Table 10 lists the number of accidents caused by components that failed to transmit power betweenthe engine and the main rotor gearbox or to transmit power from the main rotor gearbox to the tailrotor gearbox. The clutch assembly accounted for a large number of accidents. In many cases, thespecific part within the assembly that failed was listed by the investigator. Furthermore, theinvestigators characterized the failure as “ slippage” or “ disconnect.” They frequently pointed tomaterial failure, wear, and fatigue as the cause of clutch failure. Clearly, the point of power transferbetween the engine and the rotor drive system— the clutch— is a critical component. Possibly, healthand usage monitoring systems (HUMS) and better aircraft inspection techniques/tools could spotand prevent a potential failure in these component failures.
TABLE 10. DRIVE TRAIN MAJOR COMPONENT FAILURES—SINGLE-PISTON HELICOPTERS
Engine to transmission drive 96
Clutch assembly 59
Freewheeling unit 16
Torsion coupling 8
Belt 6
Bearing 5
Shaft 2
Tail rotor drive shaft 73
Drive shaft 37
Coupling 28
Hangar bearing 8
Tail rotor drive shaft failures accounted for 73 of the 119 single-piston helicopter accidents(table 9). Table 10 shows that one or more shaft segments failed in 37 cases, couplings failed in 28cases, and the investigator specifically identified hanger bearings in 8 accidents. Material factorsaccounted for 46 of the tail rotor drive shaft failures (all parts and subsystems). Fourteen wererelated to maintenance or manufacture, 8 to operations, and the rest miscellaneous or unreported.Bogus parts were implicated in two failures. It appears that efforts to reduce tail rotor drive shaftsystem problems should concentrate on the design of and materials used for the components of thissystem, along with HUMS to detect fatigue, wear, and deterioration.

37
5.3.4.4.2 Rotor failures by subsystem: Figure 42 shows that the main and tail rotor systemswere implicated in a total of 181 of the 639 accidents (i.e., 28%) in single-piston helicopters duringthe study period. Table 11 provides the distribution of rotor system failures by accident count to alower subsystem and component level. Note that in both the main and tail rotor systems, bladefailures accounted for about 50% of the accidents. Fatigue fractures were the most prevalent failuremode for both the main and tail rotor systems (table 12).
TABLE 11. ROTOR SYSTEM FAILURES BY COMPONENTS—SINGLE-PISTON HELICOPTERS
Main rotor 57
Main rotor blade 28
Main rotor hub 16
Main rotor system 12
Other 1
Tail rotor 124
Tail rotor blades 56
Tail rotor hub 32
Tail rotor system 36
TABLE 12. ROTOR SYSTEM COMPONENTS FAILURE MODE—SINGLE-PISTON HELICOPTERS
Component failuremode
Mainrotorblade
Mainrotorhub
Mainrotor
system Other
Tailrotor
blade(s)
Tailrotorhub
Tailrotor
system Total
Fatigue fracture 9 8 0 0 34 25 1 77
Material failure 2 2 0 0 8 5 4 21
Separated 4 0 0 0 6 0 9 19
Foreign object damage 0 0 3 0 0 0 15 18
Overload 3 3 0 1 4 1 1 13
Improper assembly 4 2 0 0 2 1 0 9
Not reported 1 1 0 0 1 0 6 9
Blade– airframe strike 0 0 9 0 0 0 0 9
Delamination 5 0 0 0 1 0 0 6
Total 28 16 12 1 56 32 36 181

38
5.3.4.4.3 Control system failures by subsystem: Failure or malfunction of flight controlsystems precipitated 101 accidents (fig. 42). Failures in the lower controls (i.e., the nonrotatingcomponents) far outnumbered those in the upper controls (i.e., primarily rotating components) asshown in table 13. Of the 12 stabilizer bar/paddle failures, 9 were the “ Bell bar” and 3 were the“ Hiller servo paddle.”
The failure mode in the lower controls of the main rotor was characterized by the accidentinvestigators in terms such as disconnected/separated, loose or missing bolt, improper assembly,material failure, overload, and worn. Only eight examples of fatigue failure were noted. The21 accidents attributed to the tail rotor control cables described the cables as chafed, worn, frayed,loose, disengaged from pulley, separated, improperly assembled, and crossed.
5.3.4.4.4 Airframe failures by components: Figure 42 shows that failures of the fuselagestructure, landing gear, and other airframe-associated components accounted for 88 of the639 accidents (i.e., 14%). Table 14 presents the accidents caused by failures at the lower subsystemand component level. The failure modes of these airframe components is summarized by accidentcount in table 15. Ground resonance was the key factor in at least 20 of the 24 landing gear-relatedaccidents. Lack of maintenance of the landing gear struts was identified as the primary cause ofthese accidents. In fact, as table 15 shows, improper assembly, installation, or maintenancespecifically accounted for 16 of the 26 total accidents counted in this grouping. Tailboom failurecaused 26 accidents; one-half of these came about because of a fatigue fracture. NTSB investigatorsnoted corrosion as a factor in very few fuselage component failures. The six fatigue failuresassociated with support assembly led to separation of the main rotor gearbox and rotor system.
TABLE 13. CONTROL SYSTEM FAILURES BY COMPONENTS—SINGLE-PISTON HELICOPTERS
Main rotor controls 63
Lower controls— cyclic 27
Lower controls— collective 10
Upper controls— swashplate assembly 9
Upper controls— pitch link 3
Upper controls— other 2
Upper controls— stabilizer bar/paddle 12
Tail rotor controls 38
Lower controls— cable 21
Lower controls— other 3
Upper controls— swashplate assembly 2
Upper controls— pitch link 4
Upper controls— other 3
Controls— other 5

39
TABLE 14. AIRFRAME FAILURES BY COMPONENTS—SINGLE-PISTON HELICOPTERS
Airframe and landing gear 88
Landing gear 24
Tailboom 26
Other systems 8
Support assembly 10
Other systems (engine) 3
Stabilizer— horizontal 9
Miscellaneous equipment 7
Stabilizer— vertical 1
TABLE 15. AIRFRAME COMPONENTS FAILURE MODE—SINGLE-PISTON HELICOPTERS
Component failuremode
Landinggear
Tailboom
Othersystems
Supportassy
Othersystems(engine)
Stabilizer(horizontal)
Miscequip
Stabilizer(vertical) Total
Fatigue 0 13 0 6 0 4 0 0 23
Improper assembly,installation,maintenance
16 0 4 0 1 2 2 1 26
Failed 0 4 2 1 1 0 2 0 10
Undetermined/notreported
3 0 1 1 1 0 1 0 7
Material failure 0 3 0 2 0 2 2 0 9
Pilot action andoperational issues
4 0 1 0 0 0 0 0 5
Disconnected/separated 0 4 0 0 0 1 0 0 5
Overload 1 1 0 0 0 0 0 0 2
Bent/binding/jammed 0 1 0 0 0 0 0 0 1
Total 24 26 8 10 3 9 7 1 88

40
5.3.4.5 Conclusions About Airframe Failure or Malfunction Accidents. Of the 8,436 rotorcraftaccidents recorded by the NTSB during the 34-year period from mid-1963 through the end of 1997,5,371 accidents involved commercially manufactured, single-piston helicopters. Of the 5,371accidents, 639, or roughly 12% of these accidents, were attributed to failure or malfunction of theairframe or of some system or component associated with the airframe. Drive and rotor systemfailures, primarily in the cruise and maneuvering flight phases, accounted for 427 of the 639accidents. The clutch from the engine to the main rotor gearbox and the tail rotor drive shaftdominated drive train component failures. Together, these two components accounted for 96 of the639 accidents. Main and tail rotor blade fatigue failures led to an additional 94 accidents. The pilotwas left without antitorque and directional control in over 300 of the 639 accidents because offailures or malfunctions of a tail rotor drive train, a tail rotor system, a tail rotor control, or atailboom.
Fatigue resulted in more airframe failure accidents in commercially manufactured, single-pistonhelicopters than any other cause. Following fatigue failures, material failures, failures withoutspecific mode stated, and improper assembly, installation, and maintenance contributed the largestnumbers to the accident record. The manufacture and maintenance problem manifested itself by awide range of errors: improper servicing, unapproved modifications, missing parts, or installation ofincorrect or unapproved parts, to name several. As discussed above in the context of flight controlproblems, improving the quality of design, manufacturing, and maintenance processes is animportant area on which to concentrate industry efforts.
In 60% of the accidents in which there was contact of the rotor blades with other parts of the aircraftstructure, the aircraft was destroyed. This is not surprising because blade-aircraft contact almostalways resulted in loss of part of the main rotor and control systems components. Conversely,component fatigue, material failure, and improper assembly/installation/maintenance tended toresult in less severe aircraft damage, although it caused more accidents.
In summary, this analysis of airframe failure accidents indicates the following:
1. Airframe failure accidents for commercially manufactured, single-piston-engine-poweredhelicopters showed a decreasing trend in accidents per year and in accidents per 1,000 registeredaircraft.
2. Material and assembly/installation/maintenance factors dominated the identified causesof airframe failure accidents. The large number of system or components identified to have failedand the large number of failure modes indicate many opportunities for improvement. However, nosmall set of problem areas appeared such that, if corrected, accident rates would decrease adequatelyto meet national goals.
3. The clutch from the engine to the main rotor gearbox and the tail rotor drive shaftdominated drive train component failures and led to approximately one-sixth of the airframe-relatedaccidents.
4. The pilot was left without antitorque and directional control in over 300 of the639 airframe-related accidents.

41
5.4 Summary Remarks, Conclusions, and Recommended Actions
The number of registered commercially manufactured, single-piston helicopters grew from about540 at the end of 1957 to over 4,200 at the end of 1997. During the period from mid-1963 through1997, this growing fleet accounted for 5,371 accidents. The NTSB grouped these accidents into21 categories; however, as figure 43 shows, 93% of the accidents fell into 7 categories and, in fact,4 categories accounted for 70% of the accidents.
The summary of accidents by activity and phase of operation, table 16, shows that the overwhelmingnumber of single-piston helicopter accidents occurred during aerial application. Since crop dustingrequires considerable maneuvering, it is almost a corollary that the most accidents occurred duringsome maneuvering operation.
Within the four top accident categories, the following are noted.
1. Loss of engine power because of improper fuel/air mixture caused 686 accidents, ofwhich 400 were caused by fuel exhaustion, fuel starvation, or fuel contamination.
2. Loss of engine power because of engine structural failure caused 263 accidents.
3. Loss of engine power for undetermined reasons was recorded in 397 accidents.
4. In flight collision with man-made objects accounted for 696 of 953 accidents.
TABLE 16. ACCIDENTS BY ACTIVITY AND PHASE OF OPERATION—SINGLE-PISTON HELICOPTERS
Activity Phase of operation
Aerial application 1,494 Maneuvering 1,149
Instructional/training 976 Cruise 1,047
General utility 875 Landing 949
Personal use 787 Takeoff 889
Passenger service 421 Hover 450
Business use 338 Approach 241
Ferry/reposition 205 Descent 168
Flight/maintenance test 113 Taxi 164
Public/military use 78 Standing/static 126
Executive/corporate 75 Unknown/other 124
Unknown/not reported 9 Climb 64
Total 5,371 Total 5,371

42
5. In flight collisions with wires and wire/poles accounted for 507 accidents; only 148accidents involved collisions with trees.
6. Loss-of-control in the vertical/yaw axes contributed to at least 235 accidents and perhapsto as many as 400 accidents.
7. Loss of control was experienced, regardless of the certification level of the PIC.
8. Drive-train failures caused 246 accidents, of which engine to transmission and tail rotordrive shaft failures contributed 169 airframe-related accidents.
9. Rotor system failures caused 181 accidents, of which the tail rotor system accounted for124 accidents.
10. Control system failures caused 101 airframe-related accidents.
11. The pilot was left without antitorque and directional control in 307 of the 639 airframe-related accidents.
12. An autorotation took place in approximately 2,000 of the 5,371 accidents.
The top four— or seven— most common accident categories were not the accident types that causedthe highest fatality rates (i.e., fatalities per 100 accidents). The worst accident severity using thatmeasure in the single-piston helicopter fleet was midair collisions, of which there were 17 that killed22 people. Following midair collisions, figure 44 shows, in descending order, fatalities per100 accidents by other NTSB first event categories. Within this grouping, airframe failure, in flightcollision with object, and loss of control clearly led to a high fatality rate. Note that loss of enginepower, the greatest cause of accidents, had a relatively low fatality rate. Twelve of the5,371 accidents fell in the undetermined category in which 18 people lost their lives. When orderedin terms of total fatalities as tabulated in figure 44, in flight collision with object and airframe failureaccidents were the leading causes of fatalities with the single-piston helicopter fleet.
Before discussing single-turbine helicopter accidents, some observations and recommendations arein order relative to the single-piston helicopter fleet. To begin with, this class of helicopter is sold onthe basis of its unique capability to hover and fly low and slow. This helicopter class has,historically, provided a cost-effective way to spray crops, to instruct students, and to generally attractfirst-time helicopter buyers who have found any number of new personal and utility uses for theaircraft. In the vast majority of uses, helicopter pilots operate their aircraft in a comparatively hostileenvironment when viewed by fixed-wing pilot standards. This environment includes many man-made obstacles.
Helicopters appear to provide some safety margin over fixed-wing aircraft because of their inherentautorotation capability (i.e., the ability to glide with turning rotor) and their generally slower power-off landing speed. These relative safety advantages are often negated, however, because helicopterpilots routinely operate their rotorcraft much closer to the ground where reaction times are minimaland emergency landing sites are generally unsuitable.

43
In 1997, the commercially manufactured, single-piston helicopter fleet experienced 17 accidents per1,000 registered rotorcraft. It is projected that, by the year 2010, the annual accident rate for single-piston helicopters may still be above 5 accidents per 1,000 registered type (fig. 22). This projectionassumes “a business-as-usual” approach by the rotorcraft industry. However, several steps can betaken now and in the short-term to significantly reduce this projected rate of single-piston enginehelicopter accidents:
1. There is an apparent disregard by many pilots of an engine’s need for clean fuel and airin proper proportions—to say nothing about the FAA regulations for fuel reserves. The fact thatpower-off landing proficiency is not required by the FAA in order to obtain helicopter pilotcertification appears inconsistent with the number of accidents caused by loss of engine power.However, it also appears that helicopters—currently in the civil fleet—provide marginal toinadequate autorotational capability to permit the average pilot to successfully complete the finalflare and touchdown to a generally unsuitable landing site. We specifically recommend thefollowing:
a. Reinforcement of fuel management and mission planning according to current FAAregulations be immediately initiated.
b. Currently installed fuel quantity measurement and display systems be reexaminedfor accuracy and applicability to helicopter applications.
c. Student and recurrent pilot training in full power-off autorotation to touchdown bereinstated as a pilot certification requirement.
d. Commercial helicopter manufacturers reexamine their current and future product’sautorotational capabilities with the objective of reducing height-velocity restrictions to a levelconsistent with average piloting skills and more representative emergency landing sites.
e. A detailed examination of the 263 accidents caused by piston-engine structuralfailure be made with the intent of initiating an engine improvement program.
2. The average pilot’s situational awareness of man-made objects that must be avoided issignificantly impaired because most of the objects are not readily visible. Wires, in particular, are thebest known threat to low flying rotorcraft. It is specifically recommend that:
a. Flying below 750 feet (above ground level) be discouraged by the industry andregulatory agencies.
b. All man-made objects higher than 500 feet be prominently marked and mapped, toinclude electronic databases such as used in Global Positioning System equipment.
c. A low-price proximity spherical sensor be developed and certified. A sensor sphereof some large radius should, in effect, cocoon the helicopter and provide the pilot with sufficientwarning to avoid obstacles.

44
3. Single-piston helicopters now in the registered fleet appear inordinately difficult to fly,particularly when the average pilot has to devote some attention to other tasks or is experiencing animagined or real emergency. Cross-coupling between the vertical/power/RPM and yaw axes isexcessive. The handling qualities design standards applicable to the current-helicopter fleet dateback to the 1950s. Although generally tolerated, the resulting stability and control characteristicsappear unsatisfactory. Therefore, it is recommended that:
a. Engine RPM management be more fully automated; preferably to the level offeredwith turbine engines.
b. A low-price stability augmentation system (in the yaw axis as a minimum) havingat least 10% authority be developed and certified.
c. Handling quality standards for all future helicopters be raised to levels consistentwith what modern technology can provide.
4. The single-piston helicopter fleet has shown that the design standards of the 1950s do notadequately address the many new and varied activities in which this aircraft class is engaged. This isparticularly true because pilots do exceed design limits, required maintenance is skipped, and lessthan thorough inspections are performed. The current fleet appears to be under-designed relative totoday’s use. It is recommended that the industry:
a. Reevaluate design and certification criteria of all components involved intransmitting power from the engine to the main rotor gearbox with particular attention to clutch andfreewheeling units.
b. Reevaluate design and certification criteria of all components that transmit power tothe tail rotor, with particular attention to the drive shaft and couplings typical of currentconfigurations.
c. Adopt more conservative fatigue design criteria, particularly for tail rotor blades.
On a final note about the single-piston helicopter fleet, the number of accidents per year decreasedin nearly a linear manner. A representative approximation of this decrease would be from 221accidents in 1967 to 73 in 1997. However, a significant departure from this favorable trend occurredbetween 1971 and 1983 when a rash of accidents created a “bubble” above the generally lineartrend. It is suspected that this bubble was caused by the increase from 127 per year to 193 per yearin newly registered, single-piston helicopters. The conclusion drawn offers the following cautionarynote for the future: When the next rapid expansion of the fleet occurs, the industry must increase allaspects of its safety improvement efforts, and this increase must be more than proportional to thefleet growth rate.

45
6. COMMERCIAL SINGLE-TURBINE ENGINE HELICOPTERS
6.1 Fleet History and Growth
The single-turbine helicopter civil fleet began serious growth as the war in Vietnam was coming toan end. The U.S. military services were the first to demand that gas turbine technology be applied totheir helicopters. With this development support, manufacturers were soon able to offer the turbine-powered helicopter to the civil marketplace. Following the single-piston helicopter trend, the single-turbine helicopter market also experienced a very real collapse in the mid-1980s. A decade later,growth in the market began again. Today the number of registered single-turbine helicopters isapproximately equal to that of the single-piston fleet (fig. 45 and table D-2). Note that the FAAcensus (as edited by the principal author) and the count Air Track, Inc. published in their "RotorRoster" are in reasonable agreement.
6.2 Single-Turbine vs. Single-Piston
Contrasts between single-piston and single-turbine helicopters are frequently made, with improvedperformance from turbine power being particularly noteworthy. With respect to accident trends,however, there are more similarities than differences between the two helicopter types. Figure 46shows that the single-turbine helicopter reduced the single-engine helicopter accident rate per 1,000registered aircraft relative to the single-piston helicopter. However, the trend shown in figure 46understates the very real safety improvement obtained with single-turbine helicopters, because it isbased on fleet size as the ratio’s denominator. The relative safety improvement can be examined inmore detail using data from the Rotorcraft Activity Survey of 1989 (ref. 17), which included thefollowing summary taken from table 2.1 of that survey:
TABLE 17. FAA ROTORCRAFT ACTIVITY SURVEY OF 1989 (From Ref. 17)
Rotorcraft TypePopulation
Size
Estimateof
NumberActive
Estimate of TotalHours Flown[in 1989 by
Active Aircraft]
Estimate of Avg.Hrs. Flown [per Yr.by Active Aircraft]
Manufacturer BuiltPiston Total (1) 3,994 2,684 728,125 277.8
Single Turbine 3,616 3,248 1,532,270 480.5Twin Turbine 1,069 984 546,471 551.8Turbine Total 4,685 4,232 2,078,741 496.5
Manufacturer Total 8,679 6,916 2,806,866 417.3Amateur Built Total 1,790 572 21,830 38.2
Total − All Rotorcraft 10,469 7,488 2,828,697 390.2
The FAA concluded from these published data that the registered fleets of single-piston and single-turbine rotorcraft were comparable in size. However, the active fleet size of single-turbinehelicopters outnumbered single-piston helicopters by over 20%. The survey estimated that thesingle-turbine helicopter fleet flew twice as many hours as the single-piston helicopter fleet

46
(i.e., 1,532,270 vs. 728,125 hours). These differences are very important when accident rates arecomputed as ratios of accidents to fleet size, active fleet size, 100,000 hours flown, or departures,etc. In contrast, the number of reported accidents recorded by the NTSB is reliable for use in thenumerator of any proposed ratio. It is the ratio’s denominator that can be quite misleading orunreliable. This leads to considerable misgivings about accident statistics in general by the authors;this issue is discussed in appendix B.
The improved safety of single-turbine relative to single-piston is not exactly clear. The NTSBrecorded during 1989 (tables D-5 and D-6) that the single-piston registered fleet of 3,920 helicoptersexperienced 106 accidents and the single-turbine fleet of 3,574 helicopters experienced72 accidents.* An immediate conclusion might be that the relative safety for the two rotorcraft typesin 1989 was as follows:
Single piston = 106 accidents per 3,920 registered aircraft = 27 per 1,000 aircraft
Single-turbine = 72 accidents per 3,574 registered aircraft = 20 per 1,000 aircraft.
These ratios suggest that the single-turbine helicopter was 1.34 times as safe as the single-pistonhelicopter in 1989. When the comparison is made using active aircraft, as estimated by the FAA intable 17 above, the comparison changes as follows:
Active single piston = 106 accidents per 2,684 active aircraft = 39.5 per 1,000 aircraft
Active single-turbine = 72 accidents per 3,248 active aircraft = 22.2 per 1,000 aircraft.
The relative safety margin of the single-turbine helicopter, in 1989, now becomes 1.78. A lastcomparison based on the FAA estimated hours flown in 1989 by the active rotorcraft shows thefollowing:
Active single piston = 106 per 728,125 hours = 14.5 accidents per 100,000 hours flown
Active single turbine = 72 per 1,532,270 hours = 4.7 accidents per 100,000 hours flown.
Based on accidents per estimated 100,000 hours flown, perhaps the most common safety statistic,single-turbine helicopters appeared to be about three times safer than single-piston helicopters. Atleast this was the case in 1989, if the FAA data can be considered adequately reliable.
We do not suggest extrapolating this conclusion to any other year, because reliable FAA data used inthe denominator do not appear to exist, as explained in appendix B.
6.3 Accident Analysis
That rotorcraft safety improved when the single-turbine-powered helicopter was introduced is hardlydisputable. However, loss of engine power was still the leading NTSB first event category of the2,247 accidents involving single-turbine helicopters recorded over 34 years, as figure 47 shows. In
*The FAA count in their reference 17, table 2.1 is 3,994 and 3,616 respectively; but it was found that many piston-powered helicopters were listed as turbine-powered and vice versa.

47
fact, as the comparison in table 18 summarizes, the percentage distribution of single-turbinehelicopter accidents virtually parallels that for single-piston helicopters. Reduction of in flightcollision with object accidents from 18% to 13% appears as the one difference that stands out intable 18.
TABLE 18. SINGLE-TURBINE VS. SINGLE-PISTON ACCIDENT COMPARISON,1963–1997
Single turbine Single piston
NTSB category Count % Count %
Loss of engine power 704 31 1,554 29
In flight collision with object 298 13 953 18
Loss of control 284 12 625 11
Airframe/component/system failure or malfunction 282 12 639 12
Hard landing 140 6 483 9
In flight collision with terrain/water 143 6 443 8
Rollover/nose over 119 5 290 5
Other 227 10 384 7
Total 2,247 100 5,371 100
The trend of single-turbine helicopter accidents per year for the most frequent first event categoriesis shown in figures 48 and 49. This rotorcraft type experienced a severe rash of loss of engine poweraccidents beginning in 1978 (fig. 48). Apparently, it took 10 years to find and correct a number ofproblems. The sum of in flight collision with object and loss of control accidents began to rise in thesame period as engine related accidents, which is shown by the heavy, solid line in figure 49. Theoverall picture suggests that it was not until the late 1980s that the single-turbine helicopter fleetmatured, nearly 20 years after this rotorcraft type was introduced into the fleet.
The number of accidents per 1,000 registered single-turbine helicopters decreased until 1986 andthen remained virtually unchanged after 1986 (fig. 46). We suspect that a plateau occurred with thesingle-turbine helicopter fleet. Figure 50 projects that, by the year 2010, accidents with single-turbine helicopters may only decrease to about 15 per 1,000 aircraft. The single-turbine helicopterfleet began to expand after 1993 (fig. 45). This expansion, clearly evident over the last 4 years of thestudy period, reflects an abrupt fleet growth of the type experienced by the single-piston helicopterfleet, as discussed earlier. Therefore, it may be that insufficient emphasis—relative to increasedsales, use, and new missions—is being placed on single-turbine helicopter safety. Without a renewedemphasis on safety, the projection shown in figure 50 is quite likely to come true.
Over the last 11 years of the study, the distribution of the 841 accidents changed when comparedwith the distribution of the 2,247 accidents that occurred over the 34-year period. The comparativedistributions are summarized in table 19. Loss of control and airframe/component/system failure ormalfunction first event categories increased slightly, while loss of engine power and in flight

48
collision with objects decreased. Although the distributions are similar, certain changes occurredwhich will be discussed in the detailed analyses below.
TABLE 19. SINGLE-TURBINE ACCIDENT DISTRIBUTION,LAST 11 YEARS VS. 1963–1997
First event category 1987–1997 1963–1997
Loss of engine power 29% (244) 31% (704)
In flight collision with object 11% (94) 13% (298)
Loss of control 16% (132) 12% (284)
Airframe/component/system failure or malfunction 15% (124) 12% (282)
Hard landing 5% (43) 6% (140)
In flight collision with terrain/water 6% (47) 6% (143)
Rollover/nose over 3% (26) 5% (119)
Other 9% (131) 12% (277)
Total 100% (841) 100% (2,247)
6.4 Detailed Analysis by Accident Category
Of the 8,436 rotorcraft accidents, 2,247 accidents were incurred by single-turbine helicopters thatwere commercially manufactured. Of these, 1,568 (about 70%) fell into the top four first eventcategories. Therefore, a more in-depth analysis of the four top categories provides considerableinsight into most of the single-turbine helicopter accidents during the 34-year period under study.The following several paragraphs and associated figures and tables provide further analysis of thesetop four categories.
6.4.1 Loss of Engine Power (704 Accidents)
As table 18 shows, the single-turbine helicopter and the single-piston helicopter incurred virtuallythe same percentage of accidents in the loss of engine power first event category during the 34-yearperiod studied. The explanation for this (perhaps surprising) fact is that both engine types need cleanfuel and air in the correct proportions to operate and that fuel problems, especially fuel exhaustionand starvation, is as prevalent in the single-turbine as in the single-piston helicopter. It appearsmany of the poor practices of pilots flying single-piston-engine-powered helicopters appears to havecarried over to the operation of turbine-powered helicopters that cost over five times as much.Single-turbine helicopters have, in general, more seats than single-piston helicopters. Thus, astable D-19 enumerates, somewhat fewer numbers of people (1,846 in single-turbine vs. 2,621 insingle-piston) were affected by considerably fewer accidents (704 in single-turbine vs. 1,554 insingle-piston) following loss of engine power.
6.4.1.1 Overall Accident Trends. From mid-1963 through 31 December 1997, the NTSB citedloss of engine power in 704 accidents involving commercially manufactured, single-turbinehelicopters. The 704 accidents directly affected 1,846 people: 129 were killed, 237 were seriously

49
injured, and 1,480 survived with minor or no injuries (table D-25). Of the 704 helicopters involved,139 were listed as destroyed by the NTSB, 546 were substantially damaged, and 9 received little orno damage. Figure 48 shows that the trend in loss of engine power accidents per year improved overthe last 10 years of the study period. Furthermore, as an accident rate in terms of 1,000 registeredaircraft, figure 51 shows that accidents initiated by the loss of engine power steadily decreased.However, as figure 51 shows, loss of engine power accidents also grew as the fleet grew, resulting innearly a constant 30% of the accidents in the 1970s and 1980s. Since 1990, it appears that aconcerted effort was made to correct poor-piloting-related accidents in this first event category.
6.4.1.2 Loss of Engine Power by Category. The NTSB cited the reason for loss of engine powerin 523 of the 704 accident reports. Table D-12 shows that 18 primary reasons lay behind the704 accidents. Figure 52 shows that when the 18 reasons are grouped by major subsystems, fuel/airmixture problems caused 299 of the 523 accidents. A closer inspection of figure 52 and theassociated mini-briefs reveals that fuel exhaustion, fuel starvation, fuel contamination, etc., repeatedsingle-piston helicopter experiences. Again, simply running out of gas was the primary reason forloss of engine power throughout the 34-year period under study.
Figure 52 and table D-12 indicate that relatively few accidents were incorrectly charged to loss ofengine power by NTSB investigators.
6.4.1.3 Loss of Engine Power by Activity. The commercially manufactured helicopter, poweredby a single-turbine engine, has become the backbone of the helicopter industry (ref. 16). As figure53 shows, the greatest number of loss of engine power accidents took place during passenger service(e.g., air taxi) flights.* Agricultural operations contributed proportionally fewer loss of engine poweraccidents than single-piston helicopters (see fig. 25). This may reflect the fact that modern, single-turbine helicopters cost so much more than the smaller, single-piston helicopter (ref. 18).
Power-off landings in single-turbine helicopters—currently in the civil fleet—generally were nomore successful than in single-piston helicopters. As table D-19 shows, there were 1,554 loss ofpower accidents with the single-piston helicopter; 265 (17%) were destroyed and 1,286 (83%) weresubstantially damaged. The corresponding statistics for the single-turbine helicopter were704 accidents, 139 (20%) destroyed, and 546 (78%) were substantially damaged. Thus, of2,258 single-engine (piston and turbine) loss of power accidents, all but 22 of the helicoptersinvolved were either destroyed or substantially damaged. It appears, therefore, that (1) the averagepilot proficiency in accomplishing a full power-off landing in a single-engine helicopter was quiteinadequate and (2) the helicopters themselves offered marginal autorotation capability.
6.4.1.4 Loss of Engine Power by Phase of Operation. Loss of engine power occurred in everyphase of operation in which the single-turbine helicopter operated, as figure 54 shows. Parallelingsingle-piston helicopter experience, most losses of power occurred in cruise flight, which reflects thepassenger service, general aviation character of turbine helicopter use. The high power required intakeoff and hover accounted for this sub-category being the second riskiest operational phase. Whenthe 104 accidents in takeoff are added to the 84 accidents in maneuvering and the 58 accidents inhover, 246 accidents occurred during high-power use (vs. 314 accidents during cruise). The ratio of
*This activity is still serving to expand the helicopter industry in much the same way that the public was introduced toairline transportation following World War I.

50
accidents that occurred during high-power flight phases to those in cruise (246/314 or 78%) is lower(78% vs. 108%), but quite comparable to that of single-piston helicopters discussed earlier.
6.4.1.5 Conclusions About Loss of Engine Power Accidents. Of the 8,436 rotorcraft accidentsrecorded by the NTSB from mid-1963 through the end of 1997, 2,247 were incurred by single-turbine-engine-powered helicopters that were commercially manufactured. Loss of engine powerwas the first event in 704, or roughly 30% of these accidents. No fewer than 299 accidents weredirectly traced to fuel/air mixture problems as a consequence of human error. Fuel exhaustion, fuelstarvation, and fuel contamination accounted for over 151 of the 299 accidents. Apparently, despitethe higher cost of single-turbine helicopters, many pilots continued to ignore the engine’s need forclean fuel and air in proper proportion. Since the single-turbine helicopter is used primarily forpassenger service, running out of fuel will provide the public with reasons to suspect rotorcraftsafety.
The need for training and practice in full touchdown autorotations is as great for pilots of single-turbine helicopters as for pilots of single-piston helicopters. It also appears that the single-turbinehelicopters that are currently in the civil fleet lack sufficient autorotational capability to permit theaverage pilot to successfully complete the final flare and touchdown to what is generallyunsatisfactory terrain.
6.4.2 In Flight Collision with Object (298 Accidents)
Single-turbine helicopters demonstrated a 5% reduction in in flight collision with objects accidentswhen compared with the single-piston helicopter fleet (table 18). However, many of the trendsobserved about single-piston helicopters were also found in the more expensive, single-turbinehelicopter fleet.
6.4.2.1 Overall Accident Trends. The NTSB implicated in flight collision with object in298 single-turbine helicopter accidents from 1963 through 1997. These accidents affected688 people: 140 were killed, 106 suffered serious injuries, and the remaining 442 survived withminor or no injuries. Of the 298 helicopters involved, 114 were listed as destroyed by the NTSB,182 were substantially damaged, and 2 received little or no damage. The number of accidents peryear for this first event category decreased over the last 17 years of the study period (fig. 49).However, as figure 55 shows, in flight collision with object accidents appeared to level off at a meanlevel of 12% of the total single-turbine helicopter accidents. In terms of annual accidents per 1,000of the registered single-turbine helicopter fleet, little reduction occurred in the later years (fig. 55).
6.4.2.2 Collision with Object by Object Hit. The objects hit by single-turbine helicopters while inflight are listed in figure 56, which shows that wires and objects categorized as wire/pole accountedfor 108 plus 24 (i.e., 132) or 45% of the 298 accidents. Pilots of single-turbine helicopters appearedmore successful in avoiding objects when compared to a 55% rate for single-piston helicopters (asderived from fig. 28).
6.4.2.3 Collision with Object by Cause. The NTSB summary narratives were studied to establisheach accident’s major causes or conditions. This study was somewhat subjective in that frequentlytwo or more factors were involved. This required that we proportion the cause of some accidents intoseveral parts; the results are provided in figure 57. Single-turbine helicopter pilots caused the

51
overwhelming number of collisions because of improper decisions, just as for single-pistonhelicopters (fig. 29). Improper decisions include poor planning, inadequate training, and misjudgingclearances. Thus, for passenger transport operations (when helicopter safety is most visible to thepublic), improper pilot decisions were the most frequent NTSB-reported cause, followed bydegraded visibility and winds.
6.4.2.4 Collision with Object by Phase of Operation. The single-turbine helicopter fleetexperienced nearly an equal number of collisions over all flight phases (fig. 58). This contrasts withthe single-piston helicopter fleet, which experienced an overwhelming number of collisions withobjects while maneuvering (fig. 30). The difference appears related to the different activities inwhich these two helicopter classes were engaged.
6.4.2.5 Collision with Object by Activity. The NTSB mini-briefs’ summary narratives wereanalyzed to identify the activities that resulted in accidents. The results are summarized in figure 59.Unlike single-piston helicopters (fig. 31), single-turbine helicopters were engaged in general utilityand passenger service when most of the objects were struck. Single-turbine helicopters did notappear to engage in significant aerial application activities or, if they did, agricultural operationswere conducted with much greater regard to safety.
6.4.2.6 Collision with Object by Part Hit. Another question regarding collision with objectaccidents concerns what part of the helicopter was involved in the collision. The statistics availableon this subject are shown in figure 60. Tail rotor strikes occurred in 43 of the 104 single-turbinehelicopter accidents in which the part hit was reported. Whether this dominates the statistics becauseit is noteworthy or because it is truly reflective of all of the collision with object accidents isunknown.
6.4.2.7 Conclusions About In Flight Collision with Object Accidents. Of the 8,436 rotorcraftaccidents that occurred between mid-1963 and the end of 1997, 2,247 accidents involved single-turbine helicopters that were commercially manufactured. Of these, 298 (or roughly 13%) wereattributed to in flight collision with objects. Even though agricultural activities constituted only asmall percentage of single-turbine helicopter use (compared to single-piston helicopters), threeobject struck categories—wire, wire/pole, and trees—accounted for 182 accidents. Main and tailrotor strikes dominated helicopter components in the collision with object accidents. The datastrongly suggest that pilots lack situational awareness of the tail rotor.
6.4.3 Loss of Control (284 Accidents)
The number of single-turbine helicopter loss of control accidents fluctuated year to year. There wasan improvement relative to the single-piston helicopter fleet, but many of the same problems werejust as evident.
6.4.3.1 Overall Accident Trends. Loss of control was cited by the NTSB in 284 accidentsinvolving commercially manufactured, single-turbine helicopters. These 284 accidents directlyaffected 754 people: 155 lost their lives, 123 were seriously injured, and 476 survived with minor orno injuries. Of the 284 helicopters involved, 125 were listed as destroyed by the NTSB and 159 weresubstantially damaged, while none went undamaged. Figure 49 shows that the trend in accidents peryear for this first event category steadily increased for the first 15 years of the study period. Then,

52
beginning in 1981, loss of control accidents showed a rapid increase, reaching a peak of 20 accidentsin 1984. After 1984, loss of control accidents per year dropped for nearly a decade. However, in1997, there were again 20 accidents per year attributed to loss of control.
Loss of control accidents accounted for an erratic percentage of single-turbine helicopter accidentsduring the 1981 through 1997 period (fig. 61). As a rate of accidents per 1,000 registered single-turbine helicopters, accidents initiated by loss of control showed little improvement over the latter17 years. The yearly variability in the number of accidents in this category makes statistical analysisdifficult.
The long-term rate of single-turbine helicopter loss of control accidents was 3.83 per 1,000 aircraft.The rate peaked sharply in the late 1960s, and exceeded its statistical upper control limit of 12.66 in1969. This implies some systematic change took place, perhaps related to the large-scaleintroduction of the single-turbine helicopter into the civil fleet which occurred during that period(see fig. 45). In addition, since the actual number of registered single-turbine helicopters was stillrelatively low during that time, a small change in the number of accidents resulted in a large changein the rate. However, after 1969, overall accidents per 1,000 aircraft generally decreased, with somespikes noted (fig. 61).
6.4.3.2 Loss of Control by Axis. Only 145 of the 284 mini-briefs for loss of control accidentsprovided information about which axis of control was lost. However, two aspects became clear whenthe remaining accidents were evaluated in descending order, as shown in figure 62. Two strikingdifferences between single-turbine helicopters (fig. 62) and single-piston helicopters (figure 37)were observed. Low rotor RPM was not a serious problem with the single-turbine helicopter, at leastas a contributing factor to loss of control accidents. This difference can be attributed to the betterengine speed governing provided by turbine engine fuel controls. On the other hand, the single-turbine helicopter fleet suffered more loss of yaw control accidents (i.e., 75 of the 145 for which theloss of control axis was reported, or 52%). In contrast, loss of yaw control accounted for only 95 of338 accidents (i.e., 28%) in the single-piston helicopter fleet (fig. 37). Thus, loss of yaw control wasnearly twice as prevalent with single-turbine helicopters as with single-piston helicopters.
This increased percentage may be attributable to the generally higher installed power and associatedhigher antitorque corrections required. Alternatively, the higher percentage may be related to “lossof tail rotor effectiveness” (LTE). Although LTE was directly cited in the accident mini-briefs inonly a few cases, a review of the narratives indicates that LTE was probably involved in many loss ofyaw control accidents. It appears that pilots were not fully aware of the conditions conducive to LTEor had difficulty interpreting in flight information to determine whether LTE might occur.
Single-turbine helicopters experienced proportionally fewer loss of control accidents in the verticalaxis than did single-piston helicopters. This may be a result of the better engine speed governingprovided by turbine engine fuel controls or the higher, power-to-weight ratios in turbine helicopters,which minimizes the potential for low rotor RPM and loss of altitude control.
6.4.3.3 Loss of Control by Cause. Loss of control accidents were subdivided into which of the 24categories brought on the control loss; figure 63 lists the top 12 categories (this information may becontrasted with single-piston helicopter experience given in fig. 36). As for piston rotorcraft,

53
improper operation of controls again was the most prevalent factor cited by the NTSB in loss ofcontrol accidents. However, the percentage of accidents attributed to this rather vague term wassomewhat lower for single-turbine helicopters (29%) than for single-piston helicopters (33%). Thisreduction may be attributed to the generally higher experience level of single-turbine helicopterpilots, especially since little high-risk civilian initial training was conducted in single-turbinehelicopters. Loss of control accidents involving low rotor RPM were considerably reduced in single-turbine helicopters, primarily for the same reasons given for axis of control lost.
Finally, accidents involving spatial disorientation or loss of visual reference were significantlyhigher for single-turbine (13%) than for single-piston (3%) helicopters. This may be a result of themore frequent operations in unprepared areas that are conducted in single-turbine helicopters and theconsequent higher risk for operations in degraded visual environments.
6.4.3.4 Loss of Control by Phase of Operation. Considering the phase of operation during whichloss of control occurred, the accidents were first subdivided into 18 categories and then condensedinto 11 key groups. As was noted for single-piston helicopters (fig. 34), loss of control occurredmore frequently in single-turbine helicopters during the takeoff and hover phases than during anyother single flight phase (fig. 64).
6.4.3.5 Loss of Control by Activity. The mini-briefs were reviewed to associate loss of controlaccidents with the activity in which single-turbine helicopters were engaged. The results areprovided in figure 65. Single-turbine helicopters showed a substantially different activity distributionthan did the single-piston helicopter (fig. 35). First, single-turbine helicopter accidents duringpassenger operations were two-and-a-half times those of single-piston helicopters. Conversely,accidents during personal use operations occurred less than half as frequently. This may beexplained by the relative costs (purchase and ownership) of turbine engine-powered helicopterscompared with the average purchase and ownership costs of piston-engine-powered helicopters;single-turbine helicopters being more frequently used in commercial operations than for personalpleasure or convenience. Second, figure 65 shows the far lower percentage of loss of controlaccidents during agricultural operations. This can be attributed to the fact that agricultural flying wasa more important role for single-piston helicopters than for single-turbine helicopters.
Finally, note that no accidents related to instructional flights appear in figure 65. Little civilian initialrotorcraft flight training was conducted in single-turbine helicopters. Thus, even pilots transitioninginto turbine types for the first time were, presumably, experienced in the principles and practices ofhelicopter flight.
6.4.3.6 Loss of Control by PIC Certification Level. The last characteristic of loss of controlaccidents analyzed was the reported certification level of the PIC. The results are shown in figure 66.For loss of control accidents involving single-turbine helicopters, an overwhelming majority ofaccidents involved PICs with commercial or higher certified ratings at the controls. This statisticsupports the analysis by activities, which concluded that the difference in mission-type distributionwas due to the greater use of single-turbine helicopters for commercial purposes than single-pistonhelicopters.
6.4.3.7 Conclusions About Loss of Control Accidents. Of the 8,436 rotorcraft accidents recordedby the NTSB from mid-1963 through the end of 1997, 2,247 involved single-turbine-engine-

54
powered helicopters that were commercially manufactured. Of these, 284 (or roughly 13%) wereattributed to loss of control.
There is little evidence that low rotor RPM was a serious problem with the single-turbine helicopter,at least as a contributing factor to loss of control accidents. This improvement, relative to the single-piston helicopter, is attributed to the better engine speed governing provided by turbine-engine fuelcontrols. However, loss of yaw control was nearly twice as prevalent with the single-turbinehelicopter fleet as it was with the single-piston helicopter fleet. On the positive side, single-turbinehelicopters experienced proportionally fewer loss of control accidents in the vertical axis than thesingle-piston helicopters.
There were significant differences in loss of control accidents involving single-turbine helicoptersand piston-engine helicopters. Single-turbines experienced proportionally more loss of controlaccidents during commercial operations and fewer in training or personal use operations.
The accident rate per 1,000 registered aircraft showed an extremely high peak during the time thishelicopter type was coming into wide civil aviation use. Since then, the rate shows an irregularlydecreasing trend. The raw numbers of loss of control accidents jumped in the early 1980s andremained high through 1997.
6.4.4 Airframe/Component/System Failure or Malfunction (282 Accidents)
The introduction of helicopters powered by a single-turbine engine required the rotorcraft industryto engineer and manufacture an aircraft with a much higher power-to-weight ratio. Virtually everycomponent found on the lower power, piston-engine helicopter required strengthening. Adequatelydesigning for fatigue loads became even more important. Increased system complexity, such asadding hydraulic boosted controls, became more prevalent.
The single-turbine helicopter allowed an expanded flight envelope in speed, altitude, andmaneuvering capability. Frequently, within this expanded flight envelope, operational experienceshowed the new aircraft to be under-designed, which required the industry to retrofit variouscomponents and parts. In addition, the industry saw that the user community had found newapplications for its helicopters, and many of these new applications had not been considered in thedesign of first-generation, single-turbine helicopters.
6.4.4.1 Overall Accident Trends. The NTSB cited airframe/component/system failure ormalfunction (again referred to from here on as airframe failure) in 282 accidents involving thesingle-turbine helicopter fleet during the 34-year study period. These accidents directly affected 705people: 157 were killed, 110 were seriously injured, and 438 survived with minor or no injuries. Ofthe 282 helicopters involved, 111 were listed as destroyed by the NTSB, 163 were substantiallydamaged, and 8 received little or no damage. Figure 48 shows that the number of airframe failureaccidents per year grew in a nearly linear manner during the first 17 years of the study period. Thistrend is a partial measure of the industry’s problems as the first-generation single-turbine helicoptersgrew to maturity. After a peak in 1982, airframe failure accidents began to drop and than leveled off.
Following the widespread introduction of single-turbine helicopters in the early 1970s, airframefailure accidents (as a percentage of all single-turbine helicopter accidents) grew from about 10% in

55
1971 to over 15% in 1997 (fig. 67). Accidents per 1,000 registered single-turbine helicopters showedcontinuous improvement from 1972 until 1991. After 1991, however, airframe failures remainedconstant at about 2.5 per year per 1,000 registered single-turbine helicopters (fig. 67). This isbelieved to be a reflection of the increased maturity of single-turbine engine helicopter designs andthe increasing familiarity of designers, manufacturers, and maintainers with this aircraft class.
6.4.4.2 Airframe Failures by Phase of Operation. The single-turbine helicopter fleet experiencedthe most airframe failures while in cruise (fig. 68). These 107 accidents accounted for 38% of the282 accidents, slightly more than the single-piston helicopter fleet's 33% (fig. 40). Accidents duringthe maneuvering flight phase were relatively infrequent for the single-turbine helicopter. Thiscontrasts with single-piston helicopters, which are used more extensively in aerial applicationactivities. There were 83 accidents in the hovering and takeoff flight phases of passenger service andgeneral utility activities (fig. 68).
6.4.4.3 Airframe Failures by Activity. Figure 69 shows that the single-turbine helicopter fleet hadthe most airframe failure accidents while engaged in general utility and passenger service activities.This was in sharp contrast to the single-piston helicopter fleet experience (fig. 41). As noted earlier,aerial application did not appear to be an activity for which modern single-turbine helicopters wereextensively used.
6.4.4.4 Airframe Failures by System/Component. For the 282 airframe failure accidentsinvolving commercially manufactured, single-turbine helicopters, the many detailed categories werecombined into the 10 major categories shown in figure 70. These 10 categories compare directly tothose for the single-piston helicopter fleet (fig. 42). When compared on a percentage basis, aspresented in table 20, it becomes clear that both single-engine helicopter types experienced virtuallythe same airframe failure problems. If anything, single-turbine helicopters had more main rotor,fuselage, and other subsystem failures than single-piston helicopters.
It is evident from figure 70 and table 20 that the drive system—to both main and tail rotorscombined—and the two rotor systems were the most significant problem areas in airframe failureaccidents with the single-turbine helicopter fleet. Over 67% of the 282 airframe failure accidentswere caused by transmissions, drive shafts, blades, and hub failures. As discussed earlier, the changefrom piston to turbine engine improved helicopter safety. It is not evident from table 20, however,that corresponding improvements to the remaining major airframe systems were achieved.
The failure mode terminology used by NTSB accident investigators is matrixed with the majorrotorcraft systems in table 21 to summarize the airframe accident count. (A comparable summaryfor the single-piston helicopter was provided in table 8.)

56
TABLE 20. SINGLE-ENGINE-HELICOPTER AIRFRAME FAILURE COMPARISON,1963–1997
Single piston Single turbine
Airframe major systems Count % Count %
Drive train—main 127 19.9 49 17.3
Drive train—tail 119 18.6 54 19.1
Main rotor 57 8.9 36 12.8
Tail rotor 124 19.4 52 18.4
Control system—main 63 9.9 29 10.3
Control system—tail 38 5.9 11 3.9
Airframe (fuselage, other subsystems) 64 10.0 41 14.5
Landing gear 24 3.8 2 0.7
Engine 7 1.1 3 1.1
Undetermined/other 16 2.5 5 1.8
Total 639 100 282 100
Following the earlier discussion format used to examine the single-piston helicopter airframefailures, figure 70 offers a convenient outline from which more detail about each system/subsystem/component/part failure or malfunction can be examined. Consider first the number ofaccidents caused by failures in the main and tail drive trains.
6.4.4.4.1 Drive train failures by subsystem: Figure 70 shows that the drive train from theengine to the main and tail rotors was implicated in a total of 103 (i.e., 36%) of the 282 accidentsinvolving single-turbine helicopters during the study period. Table 22 gives the number of accidentscaused by lower-level-subsystem failures within the drive train.
Failure to transmit power from the engine to the main rotor gearbox accounted for 35 of the 49 mainrotor drive train accidents (table 22). Failure to transmit power along the tail rotor drive shaft caused32 of the 54 tail rotor drive train accidents charged to this subsystem. Taken together, componentfailures in these two subsystems caused 67 accidents. This approximately parallels single-pistonhelicopter experience shown in table 9.
The components most frequently failing to (1) transmit power between the engine and the main rotorgearbox and (2) transmit power from the main rotor gearbox to the tail rotor gearbox caused thenumber of accidents shown in table 23.
It should be noted that the clutch assembly accounted for the largest number of single-pistonhelicopter accidents, as enumerated in table 10. Clearly, improvement in this component’s designand operation was achieved, as table 23 shows. In contrast, relatively little improvement (on apercentage basis) was achieved in the tail rotor drive shaft components.

57
TABLE 21. NTSB FAILURE MODE/SYSTEM MATRIX—SINGLE-TURBINEHELICOPTERS
Failure modeDrive
systemRotorsystem
Controlsystem
AirframeLG
Allother Total
Fatigue 26 21 5 17 1 70
Improper assembly, installation,maintenance 15 5 14 4 1 39
Material failure 0 30 0 0 0 30
Undetermined/not reported 6 6 5 7 2 26
Failed 15 3 1 5 0 24
Separated 13 3 4 1 1 22
Foreign object damage 8 11 0 2 0 21
Overload 9 0 2 0 0 11
Pilot action/operational issue 2 0 1 5 3 11
Lack of lubrication 0 6 0 0 0 6
Slippage 1 0 5 0 0 6
Disconnected 4 0 0 1 0 5
Blade-airframe strike 1 0 2 1 0 4
Delaminated/debonded 1 3 0 0 0 4
Bearing failure 2 0 0 0 0 2
Bent/binding/jammed 0 0 1 0 0 1
Hydraulic leak/lock 0 0 0 0 0 0
Total 103 88 40 43 8 282
TABLE 22. DRIVE TRAIN FAILURES BY COMPONENTS—SINGLE-TURBINE HELICOPTERS
Drive train—main 49
Engine to transmission drive 35
Main rotor gearbox 8
Main rotor mast 6
Drive train—tail 54
Tail rotor driveshaft 32
Tail rotor gearbox 22

58
TABLE 23. DRIVE TRAIN MAJOR COMPONENT FAILURES—SINGLE-TURBINE HELICOPTERS
Engine to transmission drive 35
Clutch assembly 8
Freewheeling unit 9
Torsion coupling 13
Shaft 5
Tail rotor drive shaft 32
Driveshaft 16
Coupling 13
Hang bearing 3
The tail rotor gearbox was the second largest contributor to tail rotor drive train failures for single-turbine helicopters (table 22). Failures occurred within the gear train and its rotating components.Failures in the gearbox case and aircraft mounting points were frequently noted. The primary failuremode of drive train components was fatigue.
The basic similarity in failure modes for the single-turbine and single-piston helicopter fleetsimplies that general improvements in materials and component design will be applicable to andbenefit both of these major rotorcraft types.
6.4.4.4.2 Rotor failures by subsystem: Figure 70 shows that the main and tail rotor systemswere implicated in a total of 88 single-turbine helicopter accidents (i.e., 31% of the 282) during theperiod studied. The accident count of rotor system failures at a lower subsystem/component level isprovided in table 24. Table 25 summarizes the accidents in relation to the prevalent failure mode forboth main and tail rotors.
TABLE 24. ROTOR SYSTEM FAILURES BY COMPONENTS—SINGLE-TURBINE HELICOPTERS
Main rotor 36
Main rotor blade 12
Main rotor hub 14
Main rotor system 10
Tail rotor 52
Tail rotor blades 12
Tail rotor hub 5
Tail rotor system 35

59
TABLE 25. ROTOR SYSTEM COMPONENTS FAILURE MODE—SINGLE-TURBINE HELICOPTERS
Subsystem/component failuremode
Mainrotorblade
Mainrotorhub
Mainrotor
system
Tailrotor
blades
Tailrotorhub
Tailrotor
system Total
Foreign object damage 0 0 4 0 0 26 30
Fatigue fracture 3 9 0 6 3 0 21
Separated 3 1 0 3 0 4 11
Not reported 1 1 0 1 0 4 7
Material failure 3 1 0 0 2 0 6
Blade-airframe strike 0 0 6 0 0 0 6
Delamination 2 1 0 2 0 0 5
Improper assembly 0 1 0 0 0 1 2
Overload 0 0 0 0 0 0 0
Total 12 14 10 12 5 35 88
The contrast between this single-turbine helicopter experience (tables 24 and 25) and single-pistonhelicopter experience is provided in tables 11 and 12. For example, where main rotor bladesaccounted for 49% of the 57 single-piston helicopter main rotor failures, only 33% of the 36 single-turbine accidents were attributable to this component. In fact, main rotor hub failures accounted formost of this subsystem’s failures for single-turbine helicopters.
Foreign object damage (FOD) to the tail rotor was a significant problem in the operation of single-turbine helicopters (table 25). In the 26 accidents, 6 involved external loads or associated equipment,6 involved unsecured items from the aircraft cabin, 1 involved the loss of an aircraft exit hatch, 1was caused by flight through the debris cloud of a planned motion picture production explosion, and12 were unspecified. Approximately the same number of accidents involved the main rotor head asthe main rotor blades. Fatigue, material failures, and delamination were the major blade problemsthat resulted in accidents, especially for the main rotor hub. This distribution is similar to that of thesingle-piston helicopters (table 12). However, improper assembly was a less significant problem forsingle-turbine helicopters. This may be the result of more stringent maintenance procedures andoversight for the more complex (and expensive) turbine fleet as opposed to that of the relativelysimpler piston aircraft. As was discussed for single-piston helicopter accidents, main rotor systemfailures associated with blade-to-airframe strikes tended to be very severe and generally resulted infatalities.
Finally, just as for single-piston helicopters, improvements in the design, construction, andmaintenance of main rotor system components represent an important opportunity for reduction ofserious helicopter accidents.

60
6.4.4.4.3 Control system failures by subsystem: Forty single-turbine helicopter accidentswere attributed to failures or malfunctions in the main and tail rotor flight control systems (fig. 70).A breakdown to lower level subsystems/components is provided by accident count in table 26.
TABLE 26. CONTROL SYSTEM FAILURES BY COMPONENTS—SINGLE-TURBINE HELICOPTERS
Main rotor controls 29
Lower controls—cyclic 9
Lower controls—collective 1
Upper controls—swashplate assembly 4
Upper controls—pitch link 2
Upper controls—other 3
Hydraulic 10
Tail rotor controls 11
Lower controls—cable 5
Lower controls—other 1
Upper controls—swashplate assembly 2
Upper controls—pitch link 3
Upper controls—other 0
Controls—other 0
No modern single-turbine helicopter was found that uses stabilizer bar/paddle such as the “Bell bar”or the “Hiller servo-paddle.” Instead, the rotorcraft industry moved to hydraulically boosted controlsystems. As table 13 summarizes, 12 stabilizer bar/paddle failures occurred out of 63 main rotorflight control accidents with the single-piston helicopter fleet. In a sense then, the 10 of 29 mainrotor flight control accidents with the single-turbine helicopter fleet represents a substantial stepbackward. Nevertheless, the lower pilot workload offered by boosted controls is considered by theindustry as a plus.
As was the case with single-piston helicopters, improper assembly or installation—primarily in thelower controls—was the most frequent factor identified for single-turbine helicopter flight controlsystem failure accidents. This issue was discussed in some detail for single-piston helicopter flightcontrol failures, and the conclusions and recommendations are equally applicable to single-turbinehelicopters.
6.4.4.4.4 Airframe failures by components: Figure 70 shows that failures of the fuselagestructure, landing gear, and other airframe-associated components accounted for 43 (i.e., 15%) of the282 single-turbine helicopter accidents during the 34-year study period. Table 27 shows thattailboom failures and subsystems that support operation of other major systems (i.e., engine, etc.)were major contributors to this category. Evidently, the increase in complexity of single-turbine

61
helicopters was accompanied by an increase in accidents. Although the percentage of airframefailures was comparable to that of single-piston helicopters’ experience (table 14), decreasednumbers of landing-gear-related accidents (from 24 to 2) was substantial; earlier ground resonanceaccidents (caused primarily by inadequate maintenance) were virtually eliminated.
TABLE 27. AIRFRAME-SPECIFIC FAILURES BY COMPONENTS—SINGLE-TURBINE HELICOPTERS
Airframe and landing gear 43
Landing gear 2
Tailboom 10
Other systems 6
Support assembly 6
Other systems (engine) 11
Stabilizer-horizontal 0
Miscellaneous equipment 3
Stabilizer-vertical 5
Tailboom failure caused 10 accidents, one-half of which were caused by fatigue fractures. NTSBinvestigators noted corrosion as a factor in very few of the fuselage component failures. The sixfatigue failures associated with main gearbox support assemblies led to complete separation of mainrotor gearbox and rotor system from the helicopter.
A substantial reduction in failures caused by improper assembly, installation, and maintenance wasachieved with the single-turbine-helicopter fleet, as the accident count shows (table 28). This can beseen when compared with similar failures in single-piston helicopters (table 15). With thatexception, fatigue failures were, on a percentage basis, quite comparable for the two helicoptertypes.
6.4.4.4.5. Conclusions about airframe failure or malfunction accidents: Of the 8,436rotorcraft accidents recorded by the NTSB from mid-1963 through the end of 1997, 2,247 accidentsinvolved commercially manufactured, single-turbine-engine-powered helicopters. Of these, 282, or12%, were attributed to failure or malfunction of the airframe, or some system or componentassociated with the airframe. Drive and rotor system failures, primarily in the hover, takeoff, andcruise flight phases, accounted for 191 of the 282 accidents.
Single-turbine and single-piston helicopters show quite comparable airframe failures on apercentage basis. The engine to transmission and the tail rotor drive systems (i.e., shaft and gearbox)accounted for 89 of the 103 drive system related accidents. Main and tail rotor system failures,primarily caused by fatigue, led to an additional 88 accidents. The pilot was left without antitorqueand directional control in over 125 of the 282 accidents, because a tail rotor drive train, rotor system,rotor control, or a tailboom failed or malfunctioned.

62
TABLE 28. AIRFRAME COMPONENTS FAILURE MODE—SINGLE-TURBINE HELICOPTERS
Subsystem/componentfailure mode
Landinggear
Tailboom
Othersystems
Supportassy
Othersystems(engine)
Stabilizer(horizontal)
Miscequip
Stabilizer(vertical) Total
Fatigue 2 4 2 3 1 0 0 5 17
Improper assembly,install, maintenance 0 1 0 0 3 0 0 0 4
Failed 0 1 0 1 1 0 2 0 5
Undetermined/notreported 0 0 1 0 5 0 1 0 7
Material failure 0 0 0 1 0 0 0 0 1
Pilot action andoperational issues 0 3 1 0 1 0 0 0 5
Disconnected/separated 0 0 2 1 0 0 0 0 3
Overload 0 1 0 0 0 0 0 0 1
Bent/binding/jammed 0 0 0 0 0 0 0 0 0
Total 2 10 6 6 11 0 3 5 43
Taking an overall look at the single-turbine helicopter accident history resulting fromairframe/component/system failure or malfunction, the conclusion appears to be that fatigue causedmore airframe failure accidents in single-turbine helicopters than any other single factor. Followingfatigue failures, several other factors contributed in more or less equal proportions to the overallairframe failure problem.
Lubrication failures in the rotor drive systems were, on a fatal accident percentage basis, the mostsevere. Loss of lubrication to the gearboxes, shafts, bearings, and control systems normally resultedin, at best, a marginally controllable situation and an immediate forced landing. However, thesefailures were fairly rare—only 10 over the study period. Again, component fatigue was a seriousproblem area. There is evidence that failures caused by operational errors (e.g., intentional repeatedoperation of the aircraft beyond its limits) tended to result in severe accidents, both from the aircraftdamage and fatality perspective. As in the case of lubrication failure, operational error accidentstended to be infrequent, but the toll was high.
6.5 Summary Remarks, Conclusions, and Recommended Actions
The registered fleet of commercially manufactured, single-turbine helicopters grew from fewer than100 at the end of 1963 to approximately 5,000 by the end of 1997. During this period, this growingfleet had 2,247 accidents. The NTSB grouped these accidents into 21 different categories. However,as figure 71 shows, 92% of the accidents fell into eight categories and, in fact, four categoriesaccounted for 70% of all the accidents.

63
A summary of these accidents by activity and phase of operation, table 29, shows that most single-turbine helicopter accidents occurred during passenger service and general utility activities. Takeoff,cruise, and landing constituted the primary operations of these activities, and that was when mostaccidents occurred.
TABLE 29. ACCIDENTS BY ACTIVITY AND PHASE OF OPERATION—SINGLE-TURBINE HELICOPTERS
Activity Phase of Operation
Passenger service 642 Cruise 633
General utility 520 Takeoff 353
Business use 209 Landing 301
Personal use 200 Maneuvering 270
Aerial application 150 Hover 247
Ferry/reposition 135 Approach 146
Instructional/training 127 Standing/static 97
Executive/corporate 97 Descent 73
Public/military use 93 Unknown/other 47
Flight/maintenance test 67 Taxi 40
Unknown/not reported 7 Climb 40
Total 2,247 Total 2,247
The following study findings are for the four top accident categories:
1. Loss of engine power because of improper fuel/air mixture caused 299 accidents ofwhich 151 were caused by fuel exhaustion, fuel starvation, or fuel contamination.
2. Loss of engine power because of engine structural failure caused 189 accidents.
3. Loss of engine power for undetermined reasons was recorded in 181 accidents.
4. In flight collision with man-made objects accounted for 213 of 298 accidents.
5. In flight collisions with wires and wire/poles accounted for 151 accidents; there wereonly 50 collisions with trees.
6. Loss of control in yaw contributed no fewer than 75 accidents and, on a percentage basis,as many as 140 accidents.
7. Loss of directional control was nearly twice as prevalent with single-turbine helicoptersas with single-piston helicopters, on a percentage basis.

64
8. Loss of control was experienced regardless of the PIC certification.
9. Drive train failures caused 103 accidents, of which engine to transmission and tail rotordrive shaft failures contributed 67 airframe failure accidents.
10. Rotor system failures caused 88 accidents, of which the tail rotor system accounted for52 accidents.
11. Control system failures caused 40 airframe failure accidents.
12. The pilot was left without antitorque and directional control in 127 of the 282 airframefailure accidents.
13. An autorotation took place in about 800 of the 2,247 accidents.
The most frequently occurring accident types were not the accident types that caused the highestfatality rate (i.e., fatalities per 100 accident). The greatest risk of fatality was in midair collisions, ofwhich 37 occurred killing 66 people. Figure 72 shows the number of fatalities per 100 accidents byNTSB first event category. Airframe failure, in flight collision with object, and loss of controlaccidents clearly had the highest fatality rate. Note that loss of engine power, the greatest cause ofaccidents, had a relatively low fatality rate. When ordered in terms of total fatalities, as tabulated infigure 72, airframe failures were the leading cause of fatalities with the single-turbine helicopterfleet.
Before discussing twin-turbine helicopter fleet accidents, several observations and recommendedactions relative to the single-turbine helicopter fleet can be set forth. Unquestionably, single-turbinehelicopters have an improved safety record over that of single-piston helicopters. The most reliableevidence, gathered in 1989, suggests that the improvement amounts to a reduction by a factor of 3 inaccidents per 100,000 fleet flight hours (i.e., 14.5 single-piston helicopter accidents per 100,000flight hours vs. 4.7 single-turbine helicopter accidents per 100,000 flight hours).
This safety improvement is impressive, but there is little evidence suggesting that single-turbine andsingle-piston helicopters differ in the distribution of first event accident cause. For example, loss ofengine power was the first event in approximately 30% of the accidents for both types of helicopters.Fuel exhaustion, fuel starvation, or fuel contamination were just as prevalent with each helicoptertype, on a percentage of total accidents basis. The apparent disregard by many pilots of the engine’sneed for clean fuel and air in proper proportions (to say nothing about the FAA regulations for fuelreserves) was just as characteristic of the single-turbine helicopter fleet as it was of the single-pistonhelicopter fleet. Despite the different types of activities in which the two single engine helicoptertypes engaged, loss of control in yaw was equally likely, on a percentage of total accidents basis.However, there were considerably fewer in flight collisions with man-made objects with the single-turbine helicopter, probably because single-turbine helicopters were less frequently used inagricultural operations.
In 1997, there were 15 accidents per 1,000 registered commercially manufactured, single-turbinehelicopters, a rate similar to that of the average of 18 accidents per 1,000 aircraft from 1986 through1996. However, the single-turbine helicopter experience virtually paralleled that of the single-piston

65
helicopter (on a percentage of total fleet basis). Therefore, it is projected that little improvement willoccur by the year 2010 if no more than “a-business-as-usual” effort is made by the rotorcraftindustry. Therefore, it is recommended that all but one of the several specific corrective actions forsingle-piston helicopters (sec. 5.4) be directly applied to the single-turbine helicopter fleet. The oneexception is automated RPM control already incorporated in turbine engine fuel control systems.
On a final note, single-turbine helicopter accidents per year increased slightly over the last decade ofthe period studied: there were 62 accidents in 1987, 65 in 1993, and 73 in 1997, during which timethe registered single-turbine helicopter fleet increased only modestly in size. Most recently, newsingle-turbine helicopters were being registered at a rate comparable to that of the 1970s. There isconcern, therefore, that a rapid fleet expansion will prompt an increase in accidents just as it didwith the single-piston helicopter fleet. For this reason, it is recommended that more intensive safetyimprovement efforts be quickly initiated by the industry.

66
THIS PAGE INTENTIONALLY BLANK

67
7. COMMERCIAL TWIN-TURBINE ENGINE HELICOPTERS
7.1 Fleet History and Growth
Helicopters powered by two turbine engines were introduced into the civil fleet in 1961. At thattime, several helicopter airlines operated scheduled mail and passenger service. Each hoped thatSikorsky S-61s, S-62s, or Vertol 107s would dramatically lower their operating costs from the levelexperienced using the piston-powered Bell 47s, Sikorsky S-51s, S-55s, S-58s, and Vertol V-44Bs.* Infact, the introduction of twin-turbine helicopters was not immediately followed by great demand andthe civil fleet grew relatively slowly (fig. 73). In the early 1970s, following a number of widelypublicized, high-fatality accidents, and the termination of government mail subsidies, the Part 121helicopter airlines ceased operations. In 1972, Bell began delivering its 212 series (based on themilitary UH-1N), followed shortly by Aerospatiale’s SA-330J Puma series and MBB’s BO-105series. Sikorsky’s S-76 series became available in 1977 and by 1980 Boeing Vertol offered its 40–45passenger Model 234, based on the U.S. Army’s CH-47 Chinook. This significant growth in thetwin-turbine helicopter fleet during the 1980s was fueled by primarily corporate and offshore oilcustomers. However, after almost 40 years and substantially improved twin-turbine-poweredhelicopters, a flourishing scheduled helicopter airline industry in the U.S. has yet to be established.
7.2 Twin turbine vs. Single turbine
Twin-turbine-engine helicopters were developed for two reasons. First, in many cases, no single-turbine engine of sufficient power was available to meet the payload requirements of largerhelicopters. Second, there was an industry-wide perception that two engines would improve safety.This perception is potentially misleading, if not even false, whenever the twin-engine helicopter isunable to continue flight with one engine inoperative. Fortunately, modern twin-engine helicoptersoffer adequate one-engine-inoperative performance.
Twin-turbine helicopters demonstrated further improvement in annual accidents per 1,000 registeredaircraft when compared with single-turbine helicopters (fig. 74). Although this statement may notapply to the first 15 years of its civil use, experience since 1990 seems indisputable. Twin-turbineaccidents plateaued during the 1990s suggesting that 10 accidents per 1,000 registered aircraft mightbe a minimum, given current technology and operations. This might, however, be an unfortunateconclusion based on figure 74.
The distribution, over the NTSB’s 21 first event categories, of the 302 twin-turbine accidents overthe 34-year period of this study is provided in figure 75. Loss of engine power ceased to be theleading accident factor for helicopters powered by two turbine engines. Rather, the 302 accidents inthis rotorcraft class were dominated by airframe and system failures. Twin-turbine helicopters alsoexperienced a significantly different accident first event category distribution than did the singleengine (piston or turbine) helicopter fleet. This point is illustrated in table 30.
*Reference 19 notes that this early experience with piston-powered helicopters operating in a mail, freight, andpassenger carrying mode was anything but profitable for Chicago Helicopter Airways, Los Angeles Airways, and NewYork Airways, and later San Francisco and Oakland Helicopter Airlines.

68
TABLE 30. SINGLE-TURBINE VS. TWIN-TURBINE ACCIDENT DISTRIBUTIONCOMPARISON, 1963–1997
Single turbine Twin Turbine
NTSB category Count % Count %
Loss of engine power 704 31 39 13
In flight collision with object 298 13 43 14
Loss of control 284 12 40 13
Airframe/component/system failure or malfunction 282 12 89 29
Hard landing 140 6 8 9
In flight collision with terrain/water 143 6 16 5
Rollover/nose over 119 5 4 1
Other 277 12 63 21
Total 2,247 100 302 100
The top four first event accident categories remained the same for the two helicopter classes, as table30 shows; but a different order appeared. Engine malfunctions and airframe failures reversedthemselves on a percentage basis. The top four categories accounted for 70% of the accidents foreach helicopter type, but the remaining categories were quite different. For example, “other”increased from 10% to 21% (with more detail provided by comparing figure 75 to figure 47). Amore meaningful comparison on a percentage basis (fig. 76) shows that in 17 first event categories,twin-turbine helicopter accidents exceeded single-turbine helicopter accidents. Although gearcollapsed might easily be reclassified as an airframe failure, the differences in on ground/watercollision with object, propeller/rotor contact to person, and fire/explosion are of concern.
7.3 Accident Analysis
Twin-turbine helicopter accident trends are shown in figure 77. Since 1992, a favorable trendoccurred in the top four categories as a group. Accidents in the other 17 categories were randomlydistributed, averaging 3 to 4 a year. Table 31 contrasts twin-turbine accident counts from 1992through 1997 with the entire 34-year study period. On a percentage basis, only minor changesappear evident.
The overall picture suggests that the twin-turbine helicopter demonstrated its maturity in civiloperations by the very early 1990s, approximately 15 years after second-generation models, such asBell 212s, Aerospatiale’s SA-330J Puma, and MBB’s BO-105 became operational. Based on the 12years from 1985 through 1997, it appears that yearly twin-turbine helicopter accidents per 1,000registered aircraft will drop below 5 per year by 2010 (fig. 78). The implication is that the 1991–1997 rates do not represent a minimum, as figure 74 might suggest, but rather a broad point in the12-year experience.

69
TABLE 31. TWIN-TURBINE ACCIDENT DISTRIBUTION, LAST 5 YEARS VS. 1963–1997
1992–1997 Last 34 years
NTSB category Count % Count %
Loss of engine power 14 10 39 13
In flight collision with object 19 13 43 14
Loss of control 21 15 40 13
Airframe/component/system failure or malfunction 39 27 89 29
Hard landing 3 2 8 3
In flight collision with terrain/water 11 8 16 5
Rollover/nose over 1 1 4 1
Other 35 25 63 21
Total 143 100 302 100
7.4. Detailed Analysis by Accident Type
Commercially manufactured, twin-turbine helicopters accounted for 302 of the 8,436 rotorcraftaccidents. Approximately 70% were associated with four first event categories, paralleling single-engine helicopter experience. Therefore, a more in-depth analysis of the four top categories providesconsiderable insight into the differences between single and twin configurations from 1963 through1997. The next several paragraphs analyze these top four categories in some depth, even though302 accidents is a relatively small sample of experience from which to infer trends.
7.4.1 Loss of Engine Power (39 Accidents)
As table 30 shows, introduction of twin-turbine helicopters to the civil fleet dramatically reduced thepercent of loss of engine power accidents from 31% to 13%. However, table 32 suggests that a verydisturbing trend began when larger helicopters capable of carrying more people were introduced:any serious accident affects more people and likely receives greater attention by the public. Thistrend exactly parallels the situation faced by the fixed-wing industry as they moved from the 1920sFord Tri-motor to modern day, large jet airliners, such as the Boeing 747.

70
TABLE 32. FATALITIES PER 100 ACCIDENTS BY TYPE OF ENGINE, 1963–1997
Engine typeLoss of engine power
accidents FatalitiesFatalities per100 accidents
Single piston 1,554 106 7
Single turbine 704 129 18
Twin turbine 39 16 41
7.4.1.1 Overall Accident Trends. From 1963 through 1997, loss of engine power was the firstevent in 39 of the 302 accidents involving twin-turbine helicopters. The 39 accidents directlyaffected 140 people; 16 were killed, 26 were seriously injured, and 98 survived with minor or noinjuries. Of the 39 helicopters involved, 13 were listed by the NTSB as destroyed, 21 weresubstantially damaged, and 5 received little or no damage. Twin-turbine helicopter yearly accidentsper 1,000 registered aircraft remained relatively constant from 1990 through 1997 (fig. 74). Acontributing factor to this apparent plateau was the increase in loss of engine power accidents, asshown in figure 79.
7.4.1.2 Loss of Engine Power by Category. The NTSB cited the reason for loss of engine powerin 33 of the 39 accidents. Table D-12 lists 18 primary reasons for the 39 accidents, and figure 80groups them by major subsystems. Fuel/air mixture problems caused 17 of the 33 accidents. Acloser inspection of figure 80 and the associated mini-briefs reveals that fuel exhaustion, fuelstarvation, fuel contamination, etc. were, on a percentage basis, just as prevalent with twin-turbinehelicopters as with single-piston and single-turbine helicopters.
Total or partial loss of engine power is a key issue for twin-engine-powered helicopters. Pilots oftwin-turbine helicopters, faced with performing a total power-off landing, appeared no moresuccessful at the task than pilots of single-engine helicopters. From 1963 through 1997, 23 of the39 accidents (i.e., nearly 60%) began with a total loss of power from both engines. In fact, even withpartial loss of power in 16 of the 39 accidents, 5 helicopters were destroyed, 10 received substantialdamage, and only 1 was landed with minor damage.
Pilot proficiency in accomplishing total or partial power-off landings appears insufficient. A possibleexplanation is that the chances of a dual-engine failure are perceived to be very low and, in manycases, the approved aircraft flight manual does not permit touchdown autorotations. If power-offlandings are practiced at all, they are practiced in simulators of questionable fidelity.
7.4.1.3 Loss of Engine Power by Activity. Most twin-turbine helicopter loss of power accidentsoccurred during passenger service and general utility activities (fig. 81). The twin-turbineconfiguration allowed the rotorcraft industry to expand passenger service beyond the capabilityprovided by single-turbine helicopters (ref. 16). This, in many ways, is how the public wasintroduced to airline transportation when single- and multi-engine airplanes from World War I wereconverted from military to civilian use.

71
7.4.1.4 Loss of Engine Power by Phase of Operation. Loss of engine power was experiencedduring every flight phase (fig. 82). Although most (13) occurred in cruise flight, high-poweroperations (low-speed/low-altitude maneuvering, takeoff, and hover), taken together, accounted for18 loss of engine power accidents. Neither single-piston (see fig. 26) nor single-turbine helicopters(see fig. 54) had the same pattern of loss of engine power accidents in high-power situations vs.cruise.
7.4.1.5 Conclusions About Loss of Engine Power Accidents. Of the 8,436 rotorcraft accidentsrecorded between mid-1963 and the end of 1997, 302 involved commercially manufactured, twin-turbine helicopters. Of the 302 accidents, 39, or roughly 13%, of these accidents were attributed topartial (16) or total (23) loss of engine power. No fewer than 17 accidents, roughly 44%, weredirectly traced to fuel/air mixture problems paralleling experiences of both single-piston and single-turbine helicopters. However, there have been relatively few loss of engine power accidents withtwin-turbine helicopters. Therefore, statistically meaningful trends remain open to question.
7.4.2 In Flight Collision with Object (43 Accidents)
The twin-turbine helicopter fleet demonstrated no reduction (on a percentage basis) of in flightcollision with objects accidents when compared with the single-turbine helicopter fleet (table 30).Furthermore, many of the trends observed about single-turbine helicopters were also found with themore expensive twin-turbine helicopters.
7.4.2.1 Overall Accident Trends. The NTSB implicated in flight collision with object in 43 twin-turbine helicopter accidents from 1963 through 1997. These accidents affected 175 people:35 received fatal injuries, 29 suffered serious injuries, and the remaining 111 survived with minor orno injuries. Of the 43 helicopters involved, 16 were listed by the NTSB as destroyed, 25 weresubstantially damaged, and 2 received little or no damage. As figure 83 shows, in flight collisionwith object accidents leveled off at about 12% of twin-turbine helicopter accidents, but withsignificant year-to-year variability. From 1987 through 1997, the trend was one to two accidents peryear per 1,000 registered aircraft.
7.4.2.2 Collision with Object by Object Hit. Figure 84 shows that pilots of twin-turbinehelicopters were—on a percentage basis—nearly as prone to hitting wires and trees as pilots ofsingle-engine helicopters (see figs. 28 and 56). What stands out in figure 84 are the 12 collisionsassociated with airport/helipad facilities. Upon reviewing the 12 mini-briefs listing these collisionwith object accidents, nine objects were protuberances around the heliport (six on offshore oil rigplatforms, one stairwell at a hospital, one crane at a building site, one jetway gate). A tail rotor wasswung into a hanger, a barge rising and falling was an inadequate heliport, and the object wasunspecified in the last mini-brief reviewed.
7.4.2.3 Collision with Object by Cause. Figure 85 shows that improper pilot decision-making wasthe cause of most collision with object accidents, although more than one factor was often involved.This required proportioning one accident into part causes. The corresponding interpretation of theresults for single-engine helicopters is provided in figures 57 and 29. Improper decision includespoor planning, inadequate training, and misjudging clearances.

72
7.4.2.4 Collision with Object by Activity. The twin-turbine helicopter fleet rapidly became thehelicopter of choice for passenger transport operations. Thus, it is not surprising that 44% of 43accidents occurred during passenger service activity (fig. 86). Note that ferry and repositioningaccounted for another 16% of the 43 accidents.
7.4.2.5 Collision with Object by Phase of Operation. Figure 87 shows that operation duringtakeoff and landing accounted for a total of 21 of the 43 accidents. Preparations prior to takeoff,such as taxi and hover, accounted for another 11 accidents. Actual cruise flight was a relatively low-risk phase of operation.
7.4.2.6 Collision with Object by Part Hit. The NTSB mini-briefs provided information about thepart of the helicopter that struck the object in only 14 cases. For those 14 examples, 75% were tailrotor strikes (fig. 88). Only four cases of main rotor strikes were noted.
7.4.2.7 Conclusions About In flight Collision with Object Accidents. Of the 8,436 rotorcraftaccidents recorded by the NTSB during the 34-year period from mid-1963 through the end of 1997,302 accidents involved commercially manufactured, twin-turbine helicopters. Of the 302 accidents,43, or roughly 14%, were attributed to in flight collision with object. This experience directlyparallels single-turbine helicopter experience when compared as a percentage of total accidents.
Most collisions occurred while the twin-turbine helicopter was engaged in passenger service to andfrom offshore oil rigs. There were 13 wire-strike accidents and 12 objects attached to theairport/helipad landing site were struck. Limited data suggest that twin-turbine helicopters were atleast twice as prone to tail rotor strikes as main rotor strikes.
7.4.3 Loss of Control (40 Accidents)
Twin-turbine helicopters constituted only about 10% of the total rotorcraft fleet in 1997. Thus, asmight be expected, the number of loss of control accidents involving twin-turbine helicopters was asmall fraction of the total number of loss of control accidents—a little over one per year. Thenumber of twin-turbine helicopter accidents in this first event category grew slowly and irregularlyas the twin-turbine fleet increased.
7.4.3.1 Overall Accident Trends. The NTSB cited loss of control as the first event in 40 twin-turbine helicopter accidents of the 302 total (13%) from 1963 through 1997. The number ofaccidents by year (fig. 89) appears nearly random, both as a percentage of total annual accidents andin annual accidents per 1,000 registered twin-turbine helicopters. Long term, there were 3.93accidents per 1,000 aircraft, quite similar to the single-turbine helicopter rate of 3.83 per 1,000aircraft. Although the twin-turbine helicopter rate showed considerable variation about its meansince the mid-1970s, the rate remained generally below the rate of the total rotorcraft fleet. Thishighlights the importance of increased safety efforts as new aircraft types are introduced.
7.4.3.2 Loss of Control by Axis Lost. Figure 90 shows that the axis about which control was lostwas not identified in 20 of the 40 accidents. The available data indicate that loss of control wasnearly equally distributed about all axes. Unlike single engine helicopters, yaw coupled with verticalwas not an obvious problem.

73
Because of the small number of twin-turbine helicopter loss of control accidents, the differencesbetween twin-turbine and single-turbine helicopters (see fig. 62) may not be significant. Theproportionally lower number of unknown/not reported accidents for the twin-turbine helicopter fleetmay be related to the more thorough accident investigations required for high-cost aircraft and thehigher proportion of fatalities in twins. Otherwise, it remains evident that loss of control accidentsinvolved all aircraft axes.
7.4.3.3 Loss of Control by Cause. As was done for single-piston and single-turbine helicopters(figs. 36 and 62, respectively), the loss of control accidents for twin-turbine helicopters weresubdivided by cause. The results are shown in figure 91.
Again, because of the small number of twin-turbine helicopter loss of control accidents, statisticalcomparison with overall rates or with the accident history of any other rotorcraft type is premature.However, some qualitative observations can be made. First, improper operation of controls was notthe clearly leading precipitating event in loss of control for twin-turbine helicopters as it was forsingle-piston or single-turbine helicopters. This may be a result of the higher experience level of thepilots involved, the preference for multi-pilot operations, or the more general use of stabilityaugmentation systems. The relatively increased importance of flight control failure may reflect theincreased dependence on control augmentation; if the control system malfunctions, the chance for anaccident increases. The proportionally greater incidence of accidents attributed to loss of visualreferences and/or spatial disorientation may be a result of more planned operations into instrumentmeteorological conditions or in other degraded visual conditions.
7.4.3.4 Loss of Control by Phase of Operation. The 40 accidents fell into 11 phase of operationcategories (fig. 92). The distribution of loss of control accidents for twin-turbine helicoptersappeared distinctively different from the distributions for single-engine helicopters (see figs. 34 and64). However, the small number of twin-turbine helicopter accidents makes direct statisticalcomparison problematical. The two most obvious differences were (1) the relatively low percentageof accidents that occurred in hover, 12.5% for twin-turbine helicopters and 23% for the single-engine helicopter fleet; and (2) the relatively higher percentage of accidents that occurred in thetraffic pattern or approach phases of flight, 24% for twins and 12% for singles. Improved hovercontrollability may be credited to the wider use of stability augmentation systems in the twin-turbinehelicopter class or, perhaps, better inherent stability with the generally greater size of these aircraft.With respect to the increased percentage of approach accidents, there was a broad range ofcontributory factors. For the seven traffic-pattern/approach accidents, two were attributed to FOD,two to downwind approaches, and one each to pilot impairment because of alcohol, a cyclic flightcontrol failure, and spatial disorientation.
7.4.3.5 Loss of Control by Activity. The frequency distribution of activities that resulted in loss ofcontrol accidents is shown in figure 93. For the twin-turbine helicopter, it was found that the generalutility activity was primarily emergency medical service (EMS) missions. Air passenger operations,along with ferry and reposition activities, showed accidents in similar proportions to single-turbinehelicopter experience (see fig. 65). These data point out the preferential use of turbine helicoptersfor commercial passenger transportation. The discussion presented regarding the relative use ofsingle-turbine and piston-powered helicopters for personal and instructional missions applies totwins as well.

74
7.4.3.6 Loss of Control by PIC Certification Level. All loss of control accidents involving twin-turbine helicopters, for which a PIC certification level was stated, involved pilots with commercialor higher ratings. Therefore, a figure comparable to that for the single engine helicopters (figs. 38and 66) is not included.
7.4.3.7 Conclusions About Loss of Control Accidents. Of the 8,436 rotorcraft accidents recordedby the NTSB during the 34-year period from mid-1963 through the end of 1997, 302 accidentsinvolved commercially manufactured twin-turbine helicopters. Of these, 40 (or roughly 13%) wereattributed to loss of control. This directly parallels single-turbine helicopter statistics as a percentageof total accidents.
Loss of control was relatively evenly distributed about all axes. Where pilots of single-enginehelicopters clearly experienced loss of yaw control, the electronic stability and control augmentationoffered with twin-turbine helicopters appears to have considerable benefit.
No single problem (nor small set of problems) can be identified, which, if solved, wouldimmediately reduce the accident rates in this first event category. However, the “spikes” in theannual accident numbers and rates (which occurred when second-generation, twin-turbinehelicopters were introduced into the civil fleet) reinforce the observations made for the single-turbine helicopter: it is absolutely necessary to understand the possible consequences of introducingnew aircraft types (e.g., civil tilt rotor) and ensure that the entire aviation system (design,manufacture, training, professional development, use, etc.) is prepared to address the resultingsystematic changes.
7.4.4 Airframe/Component/System Failure or Malfunction (89 Accidents)
With few exceptions, modern, twin-turbine helicopters evolved from successful, single-turbinedesigns. Manufacturers “simply” added an engine, redesigned associated components/systems andincorporated other product improvements derived from single-engine helicopter field experience. Nomajor configuration changes in drive train or rotor systems appear to have been made, althoughmore advanced materials were substituted in many cases. With a comparatively small fleet havingaccumulated relatively few flight hours, it is probably premature to assess the effects of all of thechanges made in progressing from the single- to the twin-turbine helicopter. Furthermore,89 airframe failure accidents is a small number from which to draw major conclusions.
7.4.4.1 Overall Accident Trends. The NTSB cited airframe/component/system failure ormalfunction (again referred to from here on as airframe failure) in 89 twin-turbine helicopteraccidents from 1965 through 1997. These relatively few accidents took a large toll however(table D-26). The accidents directly affected 452 people: 148 were killed in 27 accidents, 37 wereseriously injured, and 267 survived with minor or no injuries. Of the 89 helicopters involved34 were listed by the NTSB as destroyed, 40 were substantially damaged, and 15 received little orno damage.
Airframe failures accounted for a higher proportion of twin-turbine helicopter accidents (29.5% of302) than for accidents involving single-piston (12.8% of 2,247) or single-turbine (11.7% of 5,371)helicopters. This is primarily because of a lower proportion of loss of engine power accidents withthe twin-turbine helicopter fleet. Figure 94 suggests that accident rates in this first event category

75
decreased, both as a percentage of total accidents and per 1,000 registered aircraft. It is believed thatmany airframe failure accidents reflect the twin-turbine helicopter fleet’s relative immaturity.
7.4.4.2 Airframe Failures by Phase of Operation. Fifty-two percent of the airframe failuresexperienced by twin-turbine helicopters occurred in cruise (fig. 95). The accident distribution byphase appears consistent with twin-turbine helicopter passenger carrying service. However, takeoffand climb-out (when taken together) accounted for 24 accidents.
7.4.4.3 Airframe Failures by Activity. Figure 96 shows that most airframe failure accidentsinvolving twin-turbine helicopters occurred while those aircraft were engaged in passenger serviceactivities. Note that ferry and repositioning accident experience with the twin-turbine helicopterwas, percentage wise, similar to that of the single-engine helicopter fleet (see figs. 41 and 69). Twin-turbine helicopters do not appear to be engaged in significant aerial application operations a sharpcontrast to the single-engine helicopter fleet experience examined in figure 41.
7.4.4.4 Airframe Failures by System/Component. The 89 airframe failure accidents weregrouped into 10 major categories (fig. 97). These 10 categories compare directly with those used forthe single-piston and single-turbine helicopter fleets (see figs. 42 and 70, respectively). Whencompared on a percentage basis (table 33), it is clear that single-engine helicopter types and twin-turbine helicopters experienced virtually the same airframe failure problems. The significantreduction in tail rotor blade and hub failures was promising. It should be remembered that thesecomparative data are based on experience with a relatively small fleet of twin-turbine helicopters.
TABLE 33. HELICOPTER AIRFRAME FAILURE COMPARISON, 1963–1997
Single piston Single turbine Twin turbine
Airframe major systems Count % Count % Count %
Drive train—main 127 19.9 49 17.3 13 14.6
Drive train—tail 119 18.6 54 19.1 19 21.3
Main rotor 57 8.9 36 12.8 19 21.3
Tail rotor 124 19.4 52 18.4 10 11.2
Control system—main 63 9.9 29 10.3 11 12.3
Control system—tail 38 5.9 11 3.9 7 7.9
Airframe (fuselage, other subsystems) 64 10.0 41 14.5 8 9.0
Landing gear 24 3.8 2 0.7 2 2.2
Engine 7 1.1 3 1.1 0 0
Undetermined/other 16 2.5 5 1.8 0 0
Total 639 100 282 100 89 100
It is evident from figure 97 and table 33 that failures in the drive system (to both main and tail rotorscombined) and in the two rotor systems caused most of the airframe failure accidents with the twin-turbine helicopter fleet. Over 68% of these 89 airframe failure accidents were caused by problems

76
in transmissions, driveshafts, rotor blades, and hubs. This percentage virtually duplicates that of thesingle-turbine helicopter fleet. As discussed earlier, the change from single- to twin-turbine enginesapparently improved helicopter safety (for example, see fig. 74). It is not evident from table 33,however, that corresponding improvements in the remaining major airframe systems were achieved.
Accident counts by failure mode matrixed with the major rotorcraft systems are provided in table 34.(Comparable summaries for single-engine helicopters are shown in tables 8 and 21). Fatigue failuresin both drive and rotor systems were just as prevalent in the twin-turbine helicopter fleet as in thesingle-turbine fleet. Note also that accidents caused by damage inflicted by foreign objects werenearly as prevalent.
Figure 97 will be used as the outline from which more detail about each system/subsystem/component/part failure or malfunction is examined. This duplicates the summary data presentationfor single-piston (fig. 42) and single-turbine helicopter (fig. 70) airframe failures. Consider first themain and tail drive train failures.
TABLE 34. NTSB FAILURE MODE/SYSTEM MATRIX—TWIN-TURBINEHELICOPTERS
Failure modeDrive
systemRotorsystem
Controlsystem
AirframeLG Total
Fatigue 13 13 4 3 33
Improper assembly, installation, maintenance 3 1 7 3 14
Material failure 3 2 2 0 7
Undetermined/not reported 1 4 1 1 7
Failed 1 3 2 0 6
Separated 5 0 0 0 5
Foreign object damage 1 4 0 0 5
Overload 2 0 0 2 4
Pilot action/operational issue 1 1 0 1 3
Lack of lubrication 1 0 1 0 2
Slippage 0 1 0 0 1
Disconnected 0 0 1 0 1
Blade–airframe strike 1 0 0 0 1
Total 32 29 18 10 89
7.4.4.4.1 Drive train failures by subsystem: The drive train from the engine to the main andtail rotors was implicated in 32 (i.e., 36% of the 89) twin-turbine helicopter accidents during thestudy period (fig. 97). The distribution of accident count to a lower drive train subsystem level isprovided in table 35. Failure to transmit power from the engine to the main rotor gearbox accounted

77
for 6 of the 13 main rotor drive train accidents. Failure to transmit power along the tail rotor driveshaft caused 17 of the 19 tail rotor drive-train accidents. Taken together, the components in these twosubsystems caused 23 of the 32 drive-train-related accidents. The number of tail rotor drive shaftfailures was excessive when compared with that of the single-turbine helicopter fleet (refer totable 23).
Table 36 shows accidents caused by components that most frequently failed to (1) transmit powerbetween the engine and the main rotor gearbox, and (2) transmit power from the main rotor gearboxto the tail rotor gearbox. Apparently, clutch assembly and freewheeling unit design and operationimprovements were made. It also appears that, tail rotor drive shaft and associated componentsremain relatively unimproved. It should be noted, however, that many of the fleet’s twin-turbinehelicopters were, in fact, derived by simply “twinning” an earlier single-turbine model, anevolutionary process that attempted to modify the basic design as little as possible.
TABLE 35. DRIVE-TRAIN FAILURES BY COMPONENTS—TWIN-TURBINE HELICOPTERS
Drive train—main 13
Engine to transmission drive 6
Main rotor gearbox 4
Main rotor mast 3
Drive train—tail 19
Tail rotor drive shaft 17
Tail rotor gearbox 2
TABLE 36. DRIVE-TRAIN MAJOR COMPONENT FAILURES—TWIN-TURBINE HELICOPTERS
Engine to transmission drive 6
Clutch assembly 0
Freewheeling unit 0
Torsion coupling/input shaft 6
Tail rotor drive shaft 17
Drive shaft 8
Coupling 5
Hangar bearing 4
7.4.4.4.2 Rotor failures by subsystem. Figure 97 shows that the main and tail rotor systemswere implicated in 29 (or 33%) of the 89 twin-turbine helicopter accidents during the study period.Accidents caused by rotor system failures distributed to a lower subsystem/component level is

78
provided in table 37. Fatigue was the prevalent failure mode for both main and tail rotors (table 38).Foreign object damage to the tail rotor (a significant problem in the operation of single-turbinehelicopters, as table 25 shows) was not a major factor in twin-turbine helicopter accidents.
TABLE 37. ROTOR SYSTEM FAILURES BY COMPONENTS—TWIN-TURBINE HELICOPTERS
Main rotor 19
Main rotor blade 7
Main rotor hub 7
Main rotor system 5
Tail rotor 10
Tail rotor blades 7
Tail rotor hub 0
Tail rotor system 3
TABLE 38. ROTOR SYSTEM COMPONENTS FAILURE MODE—TWIN-TURBINE HELICOPTERS
Component failure mode
Mainrotorblade
Mainrotorhub
Mainrotor
system
Tailrotor
blade(s)
Tailrotorhub
Tailrotor
system Total
Fatigue fracture 4 4 0 4 0 0 12
Separated 1 0 1 2 0 0 4
Foreign object damage 0 0 3 0 0 1 4
Undetermined/not reported 0 1 0 0 0 2 3
Improper assembly 0 2 0 0 0 0 2
Material failure 1 0 0 1 0 0 2
Overload 1 0 0 0 0 0 1
Blade–airframe strike 0 0 1 0 0 0 1
Delamination 0 0 0 0 0 0 0
Total 7 7 5 7 0 3 29

79
7.4.4.4.3 Control system failures by subsystem: Eighteen twin-turbine helicopter accidentswere attributed to failures or malfunctions in the main and tail rotor flight control systems (fig. 97).A breakdown of the accident count to lower-level subsystems/components is provided in table 39.
As with single-engine helicopters, improper assembly or installation—primarily in the lowercontrols—was the most frequently identified factor in twin-turbine flight control system failureaccidents. This issue was discussed in some detail for single-piston helicopter flight control failures(refer to table 13) and the conclusions and recommendations are equally applicable to twin-turbinehelicopters.
7.4.4.4.4 Airframe specific failures by components: Figure 97 shows that failures of thefuselage structure, landing gear, and other airframe-associated components accounted for 10 of the89 twin-turbine helicopter accidents during the study period. Subsystems that support operation ofother major systems (e.g., engine), and the other systems themselves accounted for 6 of the10 accidents. The failure mode of the major subsystems listed in table 40 was improper assemblyand fatigue in 6 of the 10 accidents.
7.4.4.4.5 Conclusions about airframe failure or malfunction accidents: Twin-turbineengine powered helicopters accounted for 302 of the 8,436 rotorcraft accidents recorded by theNTSB from mid-1963 through 1997. Of these, 89, or roughly 29%, involved airframe/component/system failure or malfunction. This was nearly twice the accident rate of single-engine helicopterswhen compared as a percentage of total accidents.
TABLE 39. CONTROL SYSTEM FAILURES BY COMPONENTS—TWIN-TURBINE HELICOPTERS
Main rotor controls 11
Lower controls—cyclic 3
Lower controls—collective 0
Upper controls—swashplate assembly 2
Upper controls—pitch link 1
Upper controls—other 2
Hydraulic 3
Tail rotor controls 7
Lower controls—cable 2
Lower controls—other 3
Upper controls—swashplate assembly 0
Upper controls—pitch link 1
Upper controls—other 1
Controls—other 0

80
TABLE 40. AIRFRAME SPECIFIC FAILURES BY COMPONENTS—TWIN-TURBINE HELICOPTERS
Airframe and landing gear 10
Landing gear 2
Tailboom 0
Other systems 4
Support assembly 1
Other systems (engine) 2
Stabilizer—horizontal 1
Miscellaneous equipment 0
Stabilizer—vertical 0
Drive and rotor system failures, primarily in cruise flight, accounted for 61 of the 89 accidents. Thetail rotor drive system dominated drive train component failures and accounted for 19 of the61 accidents. Failure, primarily in fatigue, of 29 main and tail rotor systems (i.e., blades and hubs)occurred.
The pilot was left without antitorque and directional control in 36 of the 89 accidents because a tailrotor drive train, a tail rotor system, or a tail rotor control failed or malfunctioned. On a percentagebasis of total accidents, this experience directly parallels that of single-engine helicopters.
Taking an overall look at the history of twin-turbine helicopter accidents resulting fromairframe/component/system failure or malfunction, the conclusion appears to be that fatigue failurescause more airframe failure accidents in twin-turbine helicopters than any other single problem.
7.5 Summary Remarks, Conclusions and Recommended Actions
The registered fleet of commercially manufactured, twin-turbine helicopters grew from fewer than50 at the end of 1963 to approximately 1,200 by the end 1997. During this period, the fleet had 302accidents, 91% of which fell into the 10 categories shown in figure 98.
The summary of accidents by activity and phase of operation in table 41 shows that theoverwhelming number of twin-turbine helicopter accidents occurred during a passenger carrying orsimilar activity. Since point-to-point activities involve relatively long duration, high-speed flight, it isunderstandable that most twin-turbine helicopter accidents occurred during a cruise operation.

81
TABLE 41. ACCIDENTS BY ACTIVITY AND PHASE OF OPERATION—TWIN-TURBINE HELICOPTERS
Activity Phase of Operation
Passenger service 97 Cruise 84
General utility 49 Takeoff 36
Ferry/reposition 46 Landing 35
Executive/corporate 31 Hover 32
Business use 23 Maneuvering 30
Flight/maintenance test 16 Approach 26
Instructional/training 13 Standing/static 22
Public/military use 12 Taxi 15
Personal use 6 Climb 14
Unknown/not reported 5 Descent 6
Aerial application 4 Unknown/other 2
Total 302 Total 302
The following study findings relate to the four top accident categories.
1. Total loss of engine power occurred in 23 of the 39 (60%) loss of engine power accidentsexperienced by the twin-turbine helicopter fleet. The cause of 17 of these 23 accidents was attributedto improper fuel/air mixture. Fuel exhaustion, fuel starvation, or fuel contamination occurred in thetwin-turbine helicopter fleet, just as they did in single-engine helicopters.
2. Loss of engine power because of engine structural failure caused 15 accidents.
3. Loss of engine power for undetermined reasons was recorded in six accidents.
4. In flight collision with man-made objects accounted for 34 of 43 accidents.
5. In flight collisions with 13 wires occurred and 12 objects attached to the airport/helipadlanding site were struck.
6. Loss of control was relatively evenly distributed about all axes.
7. Airframe failures caused nearly 30% (89) of the 302 total twin-turbine helicopteraccidents.
8. Drive train failures caused 32 accidents, of which 19 were tail rotor drive shaft failures.
9. Rotor system failures caused 29 accidents, of which the tail rotor system accounted for10 accidents.

82
10. Control system failures caused 18 airframe failure accidents.
11. The pilot was left without antitorque and directional control in over 36 of the 89 airframefailure accidents.
12. An autorotation took place in approximately 50 of the 302 accidents.
The top 4—or 10—most common accident categories were not the accident types that caused thehighest fatality rate (i.e., fatalities per 100 accidents). The greatest risk of fatality in twin-turbinehelicopter accidents occurred in midair collisions; there were six midair collisions in which 13people were killed. Figure 99 shows, in descending order, fatalities per 100 accidents by NTSB firstevent category. On ground/water collision with object, airframe failure, weather, and in flightcollision with terrain/water led to the highest fatality rates. When ordered in terms of total fatalities,as tabulated on figure 99, airframe failures were the leading cause of fatalities with the twin-turbinehelicopter fleet.
Before discussing accidents that all other rotorcraft types had, several observations andrecommendations relative to the twin-turbine helicopter fleet are offered. From 1990 through 1997,the twin-turbine helicopter fleet demonstrated an improved safety record over that of the single-turbine helicopter fleet by nearly a factor of 2. Single-turbine helicopters had 17.2 accidents per1,000 registered aircraft and twin-turbine helicopters had 9.5. However, the improvements due tofewer loss of engine power accidents were offset by an increase in airframe failure accidents. Thereis little evidence to suggest that the twin-turbine helicopter significantly improved in any of the otherfirst event accident categories.
In 1997, the commercially manufactured, twin-turbine helicopter fleet experienced 8.2 accidents per1,000 registered rotorcraft. It is projected here that this accident rate will drop below 4 accidents per1,000 registered rotorcraft by the year 2010 (fig. 78). To ensure that this projection is achieved, it isrecommended that design and certification criteria and standards applicable to the airframe beraised. The tail rotor drive train and tail rotor system should receive immediate attention.
Most of the recommendations applicable to the single-engine helicopter fleet are also applicable totwin-turbine helicopters. However, these further suggestions are offered:
1. Begin a detailed review of the basic causes of loss of aircraft control for twin-turbinehelicopters. Review transition and refresher training, currency requirements, and evaluation criteriafor pilots of twin-turbine helicopters. In particular, address issues of aircraft handling, especially inmarginal weather conditions.
2. Incorporate into the fleet an alert system that effectively warns the pilot that aircraftoperational limits are being approached (e.g., maximum power available, conditions conducive toloss of tail rotor effectiveness, avoid areas of the aircraft height-velocity diagram). Control forcecueing or cockpit displays should be considered as a means of alerting the pilot.
3. Examine the information and flying task requirements for EMS and commercialpassenger transportation operations to improve crew selection and training. Ensure that requiredoperational information is provided clearly to the crew and properly acted upon.

83
4. Examine aircraft certification criteria to ensure that time/cycle part-change requirementsprovide adequate safety margins and are based on sound materials science and operationalexperience.
5. Develop requirements and standards for health and usage monitoring systems. Continueand intensify research and development efforts leading to widespread fielding of prototype HUMSand analysis of data obtained.

84
THIS PAGE INTENTIONALLY BLANK

85
8. ALL OTHER ROTORCRAFT TYPES
8.1 Fleet History and Growth
A large and growing number of registered rotorcraft are classified by the FAA as amateur built (i.e.,principally homebuilt from kits). This group began with small, single-place autogyros modeled afterlarger autogyros manufactured by de la Cierva, Pitcairn, and Kellett before World War II. IgorBensen pioneered the early amateur autogyros in the mid-1950s. Ten years later, Air & SpaceAmerica developed and began selling its M-18A series. Amateur single-place helicopters becameavailable from Rotorway in the early 1970s. In 1997, a large number of kit rotorcraft were offered tothe homebuilt market, as reference 20 notes. This fleet of amateur built rotorcraft grew at a steadypace (fig. 100). (Note, however, the substantial drop in fleet count from 1969 to 1970 when the FAAintroduced its revised aircraft data system.) Amateur built helicopters accounted for approximatelyone-third of the homebuilt rotorcraft fleet by the end of 1997. The amateur rotorcraft fleet, whetherautogyro or helicopter, is dominated by single-piston engine power plants. Although virtually all ofthese rotorcraft are single-seat, some kit manufacturers have recently begun to offer multi-placeversions.
8.2 Accident Analysis
The annual accidents per 1,000 registered amateur rotorcraft dropped steadily from 1963 through1997, as shown in figure 101. It might be argued that the amateur fleet was the safest group of allrotorcraft based solely on this figure. However, the Rotorcraft Activity Survey of 1989 (ref. 17),suggests that this would be an incorrect presumption. Out of a fleet of 1,790, only 572 were activeand this small group flew only 21,830 hours (table 17). The estimated average annual hours flownduring 1989 by active amateur rotorcraft was only 38.2. This was about 14% of the activity of thesingle-piston helicopters sold by manufacturers. Table D-1 indicates that the NTSB recorded 17 “AllOther Types” accidents in 1989. Therefore, a more realistic accident rate comparison betweencommercially built and amateur homebuilt single-piston rotorcraft for 1989 would be as follows:
Active commercially built = 106 per 728,125 hours = 14.5 accidents per 100,000 hours flown
Active amateur built = 17 per 21,830 hours = 77.9 accidents per 100,000 hours flown.
This sobering statistic suggests that amateur homebuilt rotorcraft were over five times as accidentprone as commercially built rotorcraft. The NTSB investigated 516 All Other Types accidents overthe study period (table 42).

86
TABLE 42. ACCIDENT DISTRIBUTION BY ALL OTHER ROTORCRAFT TYPES,1963–1997
All other types Count Reference
Manufacturer—autogyro 50 Table D-8
Amateur helicopter 137 Table D-9
Amateur autogyro 261 Table D-10
Unknown configuration 68 Table D-11
Total 516
8.3 Detailed Analysis by Accident Category
The 516 accidents are charted by first event category in figure 102. Approximately 90% of theaccidents fell into 7 of the 21 NTSB categories; a comparison summary to single-piston rotorcraftsold by manufacturers is provided in table 43. Loss of control was the leading cause of accidents inthe homebuilt fleet. Although this might be expected, given the “amateur” character assigned to thegroup, the homebuilt fleet was notably safer in almost all other first event accident categories. Inparticular, the loss of engine power category shows that the amateur fleet had a much better safetyrecord.
TABLE 43. AMATEUR VS. COMMERCIAL ACCIDENT DISTRIBUTION, 1963–1997
Single pistonamateur
Single pistonmanufacturer
NTSB category Count % Count %
Loss of engine power 111 21 1,554 29
In flight collision with object 28 5 953 18
Loss of control 165 32 625 11
Airframe/component/system failure or malfunction 73 14 639 12
Hard landing 25 5 483 9
In flight collision with terrain/water 40 8 443 8
Rollover/nose over 20 4 290 5
Other 54 10 384 7
Total 516 100 5,371 100
Figures 103 through 106 provide a review of the four top first event categories. From figure 103, it isquite evident that the amateur fleet was just as susceptible to fuel/air mixture problems that causedloss of engine power as the rest of the rotorcraft fleet; 40 of the 111 loss of engine power accidents.Pilots of amateur built rotorcraft were as prone to colliding with wires, poles, and trees as pilots of

87
commercially manufactured helicopters (fig. 104). Figure 105 suggests that, after construction, thepilots tried to teach themselves to fly with very little assistance and—too often—without success.Finally, every major subsystem associated with the main rotor was a potential problem for amateurs(fig. 106).
8.4 Summary Remarks, Conclusions, and Recommended Actions
There were approximately 3,000 homebuilt and a few experimental rotorcraft as of 31 December,1997. Nearly 1,000 of these rotorcraft were single-rotor helicopters, with the rest being autogyros.From mid-1963 through 1997, this fleet accumulated 516 accidents. The NTSB grouped theseaccidents into 21 different categories. However, 80% of the accidents fell into five categories (fig. 107).
The summary of accidents by activity and phase of operation in table 44 shows that theoverwhelming number of accidents occurred during personal use. Takeoff was the most criticalphase of flight for builders/pilots of amateur rotorcraft.
Observations from the most common first events:
1. Loss of control was the leading cause of amateur rotorcraft accidents. No fewer than 165of the 516 accidents were attributed to this cause by the NTSB.
2. Loss of engine power because of improper fuel/air mixture caused 40 of the 111 loss ofengine power accidents.
3. Loss of engine power because of engine structural failure caused 28 accidents.
TABLE 44. ACCIDENTS BY ACTIVITY AND PHASE OF OPERATION—ALL OTHER TYPES
Activity Phase of Operation
Personnel use 358 Takeoff 127
Instructional/training 82 Cruise 93
Flight/maintenance test 43 Landing 74
General Utility 13 Maneuvering 70
Business use 11 Approach 54
Aerial application 4 Hover 28
Ferry/reposition 3 Unknown/other 24
Passenger service 1 Taxi 19
Unknown/not reported 1 Descent 12
Executive/corporate 0 Climb 10
Public/military use 0 Standing/static 5
Total 516 Total 516
4. Loss of engine power for undetermined reasons was recorded in 25 accidents.

88
5. In flight collision with object (e.g., wires, wire/poles, and trees) accounted for relativelyfew accidents (i.e., 28 out of 516).
6. Drive train and rotor system failures caused 33 of the 73 airframe-related accidents.Control system failures caused an additional 11 airframe failure accidents.
As before, the most common first event accident categories were not the accident types that causedthe highest fatality rate (i.e., fatalities per 100 accidents). There was one midair collision that killedthe pilot. Beyond this one accident, figure 108 shows, in descending order, the high-risk accidentcategories for amateur rotorcraft.
There is considerable evidence that the amateur built fleet will continue to grow by approximately80 to 120 rotorcraft per year. The number of amateur built helicopters has been increasing at a rateof approximately 40 per year for the last 5 years, and interest appears very high considering therelatively low selling price. From the projection shown in figure 109, it is estimated that the amateurfleet will have two to three accidents per 1,000 registered aircraft by the year 2010 if concerns aboutsafety are not raised above today’s level.
The projection shown in figure 109 could easily be optimistic by a factor of 2, and perhaps even 3.Taking a pessimistic view, there could be as many as 35 amateur rotorcraft accidents per year by2010 (given the enthusiasm of the members of this segment of aviation, the likely increase in activeaircraft count and flying hours per active fleet). Thus, the situation now being experienced inEngland (ref. 9, Vol. 22, No. 4, pg. 102), could happen in the U.S. in 2010.

89
9. FINAL REMARKS, CONCLUSIONS, AND RECOMMENDATIONS
The civilian rotorcraft fleet registered in the United States by the FAA includes, principally,helicopters and autogyros. Commercially manufactured helicopters dominate the fleet, followed byamateur built autogyros and helicopters. Periodically, experimental rotorcraft of either type areadded to the FAA registry for a short time. The most common helicopter configuration follows theIgor Sikorsky arrangement (i.e., a large main rotor for lift and propulsion and a small, propeller-likerotor at the tail for antitorque and directional control). Since no scheduled airline-type (i.e., Part 121)operations are currently flown with rotorcraft, the FAA includes rotorcraft in its general aviationclass.
This civil rotorcraft fleet grew from fewer than 10 in 1946 to 2,196 in 1964 to 12,911 by the end of1997. Single-engine helicopters dominated the registered fleet throughout this period. While thesingle-piston-engine configuration still sold in quantity, the rotorcraft industry introduced the single-turbine-engine configuration in the mid-1960s. In 1997, nearly equal numbers of single-piston andsingle-turbine helicopters were registered (about 5,000 each). The commercially manufactured,twin-turbine helicopter began selling in quantity in the late 1970s and, by the end of 1997, slightlyover 1,200 were registered. A growing fleet of registered amateur built autogyros and helicoptersnumbered close to 3,000 at the end of 1997.
The NTSB recorded 8,436 rotorcraft accidents between mid-1963 and the end of 1997. Because ofcontinuing emphasis on safety, the industry reduced accidents per year from 260 in 1964 to 175 in1997, even as the registered fleet grew. Per 1,000 registered rotorcraft, accidents were reduced bynearly a factor of 10 over this period (i.e., from 118 in 1964 to 13.6 in 1997). Nevertheless, theseaccidents took a large toll, directly affecting 16,825 people: 2,135 were killed, 1,760 were seriouslyinjured, while 12,930 survived with minor or no injuries. Of the 8,436 rotorcraft involved, 2,363(i.e., nearly 20% of the 1997 registered fleet) were listed by the NTSB as destroyed, 5,909 weresubstantially damaged, and 164 received little or no damage.
The favorable downward trend in rotorcraft accidents per year enumerated above was not linear.During a 15-year period, beginning in 1972 and ending in 1987, the industry experienced a rash ofaccidents that drove the annual rate to 327 accidents in 1980 before dropping to 196 accidents in1987. We believe that the increase in accidents per year during this period was initiated by the10-year period during which commercial helicopter yearly sales increased by over 50%. Therelatively abrupt increase of new helicopters in the U.S. civil fleet was accompanied by a jump inaccidents caused by (1) loss of engine power and (2) failure of airframe systems and components. Itis clear, therefore, that when the next rapid expansion of the fleet occurs, the industry must increaseall aspects of its safety improvement efforts. This increase must be more than proportional to thefleet growth rate.
Table 45 summarizes rotorcraft accidents over the study period. Analysis of the 8,436 rotorcraftaccidents recorded by the NTSB showed that approximately 90% of the accidents were precipitatedby only 7 of the NTSB’s 21 first event accident categories.

90
TABLE 45. SUMMARY OF ROTORCRAFT ACCIDENTS FROM MID-1963 TO THE ENDOF 1997
Commercially manufactured
Singlepiston
Singleturbine
Twinturbine
Amateurtypes
NTSB first event accident category Count (%) Count (%) Count (%) Count (%)
Loss of engine power 1,554 (28.9) 704 (31.3) 39 (12.9) 111 (21.5)
In flight collision with object 953 (17.7) 298 (13.2) 43 (14.2) 28 (5.43)
Loss of control 625 (11.6) 284 (12.6) 40 (13.2) 165 (32.0)
Airframe/component/system failure/malfunction 639 (11.9) 282 (12.5) 89 (29.5) 73 (14.1)
Hard landing 483 (8.99) 140 (6.23) 8 (2.65) 25 (4.89)
In flight collision with terrain/water 443 (8.25) 143 (6.36) 16 (5.23) 40 (7.75)
Rollover/nose over 290 (5.40) 119 (5.29) 4 (1.32) 20 (3.88)
Weather 57 (1.06) 85 (3.78) 12 (3.97) 5 (0.97)
Miscellaneous/other 74 (1.38) 42 (1.87) 9 (2.98) 9 (1.74)
Stall/settling with power 67 (1.25) 2 (0.09) 1 (0.33) 13 (2.52)
Propeller/rotor contact to person 33 (0.61) 35 (1.56) 8 (2.65) 3 (0.58)
Midair collision 17 (0.32) 37 (1.65) 6 (1.99) 1 (0.19)
On ground/water collision with object 26 (0.49) 18 (0.80) 10 (3.31) 2 (0.39)
Fire/explosion 28 (0.52) 15 (0.67) 5 (1.66) 2 (0.39)
Abrupt maneuver 12 (0.22) 8 (0.36) 2 (0.66) 10 (1.94)
Undetermined 12 (0.22) 13 (0.58) 2 (0.66) 1 (0.19)
Gear collapsed 16 (0.23) 3 (0.13) 6 (1.99) 2 (0.39)
Dragged wing/rotor, pod, float, or tail/skid 20 (0.37) 2 (0.09) 1 (0.33) 1 (0.19)
Undershoot/overshoot 16 (0.23) 4 (0.18) 1 (0.33) 3 (0.58)
On ground/water encounter with terrain/water
5 (0.09) 12 (0.53) 0 (0) 2 (0.39)
Missing 1 (0.02) 1 (0.05) 0 (0) 0 (0)
Total 5,371 2,247 302 516

91
Detailed analyses of these accidents showed that similarities far outnumbered differences. The threecommercially manufactured helicopter types are viewed by the industry as quite different, but theyshared many common accident causes. The major similarities observed are discussed below:
1. Thirty percent of single-piston or single-turbine helicopter accidents were caused by apartial or total loss of engine power. The primary reason for the loss of power was not enginestructural failure, which only accounted for 452 accidents. Rather, the primary cause for the loss ofpower was directly traced by the NTSB to fuel/air-mixture problems, which accounted for no fewerthan 985 accidents. Virtually every one of the 985 accidents was caused by human error. Fuelexhaustion, fuel starvation, fuel contamination, and, for the piston-engine, improper use ofcarburetor heat were key words repeatedly used in the NTSB accident reports. Apparently, manypilots disregarded the need by both engine types for clean fuel and air in proper proportions—to saynothing about the FAA regulations for fuel reserves.
Power-off landing proficiency is not required by the FAA in order to obtain a helicopter pilot’scertificate. This standard appears inconsistent with the number of accidents caused by loss of enginepower (also see ref. 21). Virtually all of these accidents resulted in substantially damaged ordestroyed helicopters. It therefore appears that helicopters currently in the civil fleet providemarginal to inadequate autorotational capability for the average pilot to successfully complete thefinal flare and touchdown to what is usually an unsuitable landing site. Lastly, training in fullautorotation landings—even to a prepared landing site—is apparently avoided because of both realand perceived risks. Based on these findings, the following are recommended:
• Immediate reinforcement of fuel management and mission planning according tocurrent FAA regulations.
• Reexamination of currently installed fuel quantity measurement and display hardwarefor accuracy and applicability to rotorcraft operations.
• Reinstatement of full power-off autorotation to touchdown as an industry standard forstudents and recurrent pilot training as soon as possible.
• Reexamination by commercial helicopter manufacturers of their current and futureproduct’s autorotational capabilities with the objective of reducing height-velocityrestrictions to a level consistent with average piloting skills, and more representativeemergency landing sites.
• Reexamination in detail of the accidents caused by piston-engine structural failure forthe purpose of initiating an engine improvement program.
2. Although twin-turbine helicopters appear to have significantly reduced loss of enginepower accidents on a percentage basis, 23 of the 39 accidents were caused by a total loss of power inboth engines. The other 16 accidents followed a partial loss of power. Most discouragingly, 17 of the39 accidents were caused by fuel/air-mixture problems similar to those encountered in single-enginehelicopters. Clearly, the rotorcraft industry is dealing with a situation where approximately 50% ofloss of engine power accidents (regardless of the type of engine) are caused by improper fuel/airmixture. Approximately, 25% to 30% of the loss of engine power accidents are related to enginestructural failure.

92
3. In flight collision with object accidents were common with all types of helicopters.Commercially manufactured helicopters are sold primarily because they perform well flying low andslow. Unfortunately, this flight regime places the helicopter pilot in a very hostile environment,populated by many natural and man-made objects. The commercial helicopter fleet collectively had1,294 collision with object accidents. There were 720 accidents involving collisions with wires andpoles, and 205 involving trees. The major contributor to these in flight collisions was the single-piston helicopter fleet, which was most frequently involved in an agricultural operation (e.g., cropdusting). This helicopter type had about equal numbers of main and tail rotor strikes. The single-turbine helicopter class, used relatively less in aerial applications, experienced four tail rotor strikesfor every three main rotor strikes. Twin-turbine helicopters experienced more than twice as many tailrotor strikes as main rotor strikes. The average pilot’s situational awareness of objects that must beavoided was significantly impaired because most of the objects were not readily visible. Wires, inparticular, are well-known threats to low flying by all aircraft types. Based on these findings, theauthors recommend that:
• Flying below 750 feet (above ground level) be discouraged by the industry andregulatory agencies.
• All man-made objects higher than 500 feet be marked, mapped, and included inelectronic databases, such as used in Global Positioning System equipment.
• A low-price proximity spherical sensor be developed and certified; a sensor sphere ofsome large radius should, in effect, cocoon the helicopter and provide the pilot withsufficient warning to avoid obstacles.
4. Pilots of the commercial fleet lost control of their helicopters—regardless of theircertification level—causing 12% of the commercial fleet’s 7,920 accidents. Pilots of amateurrotorcraft lost control nearly three times as often. The requirement to adequately control antitorquein all flight phases appeared to be the root problem with the single main rotor helicopterconfiguration. This was particularly true with the single-piston helicopter, where fluctuations inengine RPM occurred because of the reciprocating engine’s governing system. The turbine engineRPM governing system virtually removed this cause of accidents. However, on a percentage basis,pilots of single-turbine helicopters lost directional control twice as often as pilots of single-pistonhelicopters, which suggests a design deficiency. Equipping some single-turbine and virtually alltwin-turbine helicopters with an automatic stability and control system generally improved theoverall loss of control situation.

93
Current single-piston helicopters (and turbine-powered helicopters to a somewhat lesser extent)appeared inordinately difficult to fly; particularly when the average pilot had to devote attention toanother task, or had a real or imagined emergency. Cross-coupling between the vertical/power/RPMand yaw axes appeared excessive. The handling qualities design standards applicable to the currenthelicopter fleet date back to the 1950s. Although generally tolerated, the resulting helicopterstability and control characteristics now appear quite unsatisfactory. Therefore, the authorsrecommend that:
• Piston-engine RPM management be more fully automated, to the level offered withturbine engines, if possible.
• A low-price stability augmentation system (in the yaw axis as a minimum), having atleast 10% authority, be developed and certified.
• Handling quality standards for all future helicopters be raised to levels consistentwith what modern technology can provide.
• A detailed review of the basic causes of loss of aircraft control for single- and twin-turbine helicopters be initiated.
• Transition and refresher training, currency requirements, and evaluation criteria forpilots of twin-turbine helicopters be reviewed, with particular emphasis on aircrafthandling issues, especially in marginal-weather conditions.
• Aircraft certification criteria be reviewed and modified to ensure that undesirableflying characteristics encountered in real-world operational use are included in pre-certification testing and corrected before final certification.
• Current certification and currency requirements for rotorcraft flight instructors bereviewed with the intent of improving selection and training of instructors, thusensuring ongoing professional development, while providing a higher level ofinstruction to future pilots.
5. Airframe system, subsystem, and component failures or malfunctions were one of theleading causes of helicopter accidents. With the commercial helicopter fleet, the pilot was leftwithout antitorque and directional control in 470 accidents related to airframe failure or malfunction(nearly 50% of 1,010 accidents). The failure or malfunction occurred in the tail rotor systemdynamic components (i.e., drive train, control system, and blades and hub). More specifically,failures in the tail rotor drive train (which includes the shafts, couplings, bearings, and gearboxes)caused 192 accidents. Failure of the tail rotor control system caused 56 accidents, and tail rotorblade/hub failures caused 186 accidents. Tailboom failures accounted for the remaining 36accidents. The corresponding main rotor system dynamic components also failed or malfunctioned,which led to 404 accidents. Specifically, engine to main rotor gearbox failures caused 137 accidents,control system failures caused 103, and blade/hub failures caused 112. Transmission and mastfailures caused 52 accidents.

94
The accident record of the commercial helicopter fleet shows that past design standards areinadequate relative to the many new and varied activities in which this aircraft class is engaged.Even considering that pilots did exceed design limits, that required and timely maintenance wasskipped, and that less than thorough inspections were performed, the current fleet appears, broadlyspeaking, to be under-designed when faced with its commercial use. Therefore, the authorsrecommend that the industry:
• Reevaluate design and certification criteria of all components involved in transmittingpower from the engine to the main rotor gearbox, with particular attention to clutchand freewheeling units.
• Reevaluate design and certification criteria of all components that transmit power tothe tail rotor with particular attention to the drive shaft and couplings typical ofcurrent configurations.
• Adopt more conservative fatigue design criteria (both loads and material allowables),particularly for tail rotor blades and hubs.
• Incorporate into the fleet an alert system that effectively tells the pilot when aircraftoperational limits (e.g., maximum power available, conditions conducive to loss oftail rotor effectiveness, “avoid” areas of the aircraft height-velocity diagram) arebeing approached, perhaps by control force cueing or cockpit displays.
• Develop a reliable, low-priced health and use monitoring system with the intent ofrequiring that such a system be installed on all future turbine-engine-poweredhelicopters.
• Review certification and currency requirements for helicopter manufacturing, andmaintenance workers with the intent of raising standards.
• Raise aircraft design and certification standards to permit reduced maintenance andincorporate additional system fail-safe modes.
• Continue research and development of better structural materials that are morepractical, more resistant to fatigue, and more affordable than the materials currentlyin use.
6. The amateur helicopter and autogyro fleet experienced an accident distribution similar tothat of the commercial fleet, based on percentage. The primary exceptions were that loss of controlwas nearly three times as prevalent and loss of engine power occurred one-third less often. Becausethe amateur fleet is growing so fast, major manufacturers, operators, and trade associations mustprovide considerably more help to this segment of their industry in an effort to lower the risks beingtaken.
7. Single-turbine helicopter accidents per year increased slightly over the last decade of theperiod studied. A measure of this unfavorable trend is that there were 62 accidents in 1987, 65 in1993, and 73 in 1997, while the registered fleet increased only modestly in size. Most recently, new,

95
single-turbine helicopters were being registered at a rate comparable to that of the 1970s. There isconcern, therefore, that a rapid fleet expansion will prompt an increase in accidents, just as it didwith the single-piston helicopter fleet. We recommend that more intensive safety improvementefforts be quickly initiated by the industry.
8. Introducing twin-turbine helicopters reduced loss of engine-power accidents, but a verydisturbing trend began with the larger helicopters capable of carrying more people. In the single-piston helicopter fleet, there were 5,371 accidents and 683 fatalities. In the 2,247 accidents involvingsingle-turbine helicopters, 951 people died. In 302 twin-turbine helicopter accidents, 321 peoplewere killed.
9. There is little doubt that helicopters powered by turbine engines are safer than thosepowered by a single-piston engine. How much safer can not, in the our opinion, be quantified. Therotorcraft industry is being misguided by accident rate trends that use FAA data for active fleet size,hours flown, takeoffs made, etc. In fact, it is quite likely that the rotorcraft industry will misssignificant safety trends if the currently used methods of computing accident rates remain as themeasure of progress. Unquestionably, the true goal of any aviation safety effort is no fatalities orinjuries.
10. Without significantly increased industry-wide safety efforts in the immediate future,including implementing the above recommendations, it is projected that in the year 2010 there willbe about 6 accidents per 1,000 registered rotorcraft. Should the rotorcraft fleet size double by 2010,there will be 150 accidents per year—about 3 accidents per week. It is not likely that the public willperceive this projection as an indication that pilots and their rotorcraft are, in fact, becoming safer.Rather, the perceived dangers of rotorcraft operations will make it more likely that rotorcraft will berestricted, if not prohibited, from many areas and, as a result, rotorcraft will not be allowed toperform a significant role in the U.S. air transportation system.

96
THIS PAGE INTENTIONALLY BLANK

97
REFERENCES
1. Tete, Albert: Organization and Exploitation of Regular Aerial Transportation Lines.NACA TM-83, 1922.
2. Mayo, R. H.: Aviation and Insurance. NACA TM-93, 1922.
3. Aircraft Accidents, Method of Analysis. NACA TR-308, 1928.
4. Aircraft Accidents, Method of Analysis. NACA TR-357, 1930.
5. Aircraft Accidents, Method of Analysis. NACA TR-576, 1936.
6. Statistical Handbook of Civil Aviation. Civil Aeronautics Administration, Washington, D.C.,1944.
7. Fox, Roy G.: Helicopter Accident Trends. AHS/FAA/HAI National Specialists Meeting onVertical Flight Training Needs and Solutions, Arlington, Texas, September 1987.
8. Persinos, John, ed.: Rotor & Wing (various monthly issues), Phillips Business Information,Inc., Potomac, Maryland.
9. Rees, Elfan, ed.: Helicopter International (various bimonthly issues), Avia Press Associates,Somerset, England.
10. McKinnis, Marilyn, ed.: Rotor (various quarterly issues), Helicopter AssociationInternational, Alexandria, Virginia.
11. Healey, Andrew, ed.: Helicopter World (various monthly issues), The Shephard Press,Burnham, Bucks, England.
12. Census of U.S. Civil Aircraft. Statistical Analysis Branch, Management Standards andStatistics Division of the CAA/FAA, Washington, D.C., 1957–1994.
13. Lambermont, Paul; and Pirie, Anthony: Helicopters and Autogyros of the World. Secondedition, A. S. Barnes and Company, Inc., Cranbury, New Jersey, 1970.
14. The Official Helicopter Blue Book (various calendar years), HeliValue$, Inc., Lincolnshire,Illinois.
15. Rotor Roster (various calendar years), Air Track, Hilliard, Florida.
16. McGuire, Francis G.: Helicopters, 1948–1998. Helicopter Association International,Alexandria, Virginia, 1998.
17. Rotorcraft Activity Survey Summary Report: 1989 Data. Executive Resource Associates, Inc.and Adsystech, Inc., Arlington, Virginia, 1989. (Also DTIC No. AD-A236698.)

98
18. Harris, Franklin D.; and Scully, Michael P.: Rotorcraft Cost Too Much. Journal of theAmerican Helicopter Society, vol. 43, no. 1, January 1998.
19. The Helicopter and Other V/STOL Aircraft in Commercial Transport Service: Growth toDate and Forecasted Growth to 1965 and 1970. Economics Branch, Office of Plans, FederalAviation Agency, Washington, D.C., November 1960.
20. Martin, Dave, ed.: Kitplanes, Annual Directory of Kit Aircraft. Primedia Publication,vol. 15, no. 12, 1998.
21. Prouty, Raymond W.: Unrealistic Practice Autorotations. Rotor & Wing, December 1999,p. 45.
22. Final Report of the Helicopter Accident Analysis Team. Army/NASA Rotorcraft Division,Ames Research Center, Moffett Field, California, July 1998.
23. Workshop on Near Term Gains in Rotorcraft Safety-Strategies for Investment. Army/NASARotorcraft Division, Ames Research Center, Moffett Field, California, July 1998.

99
LIST OF FIGURES
The 109 figures contained in this document are sequenced by the rotorcraft class. That is,after 15 figures that give a picture of the total rotorcraft fleet, 29 figures then deal with thecommercially manufactured single-piston engine powered helicopter. Next, 28 figures relate to thesingle-turbine, commercially manufactured helicopter followed by another 28 figures devoted to thecommercially manufactured twin-turbine helicopter. All other rotorcraft types are dealt with by 10figures. Figure 1 is found on page 103. In like manner, the page number for any figure which followsis simply the figure number + 102.
Total Rotorcraft Fleet
Figure 1. NACA accident form, ca 1936Figure 2. Accident mini-brief, 1963–1971Figure 3. Accident mini-brief, 1972–1981Figure 4. Accident mini-brief, 1982Figure 5. Accident mini-brief, 1983–1997Figure 6. Accident mini-brief, NTSB web site summaryFigure 7. Rotorcraft accidents per Year: 1964–1997 (total registered rotorcraft fleet)Figure 8. FAA registered rotorcraft count: 1951–1997 (total registered rotorcraft fleet)Figure 9. Injuries and fatalities caused by rotorcraft accidents: 1963–1997 (total registered rotorcraft fleet)Figure 10. Rotorcraft accidents per year: 1964–1997 (total registered rotorcraft fleet)Figure 11. Rotorcraft accident count by first event category (total registered rotorcraft fleet)Figure 12. Loss of engine power and airframe/component/system failure or malfunction accidents (total registered
rotorcraft fleet)Figure 13. In flight collision with object and loss of control accidents (total registered rotorcraft fleet)Figure 14. Factors related to loss of engine power accidents (total registered rotorcraft fleet)Figure 15. Rotorcraft accidents per 1,000 registered aircraft: (total registered rotorcraft fleet)
Commercial, Single-Piston Engine Helicopters
Figure 16. Single-piston helicopter fleet size (commercially manufactured))Figure 17. Accidents per 1,000 registered aircraft: single-piston helicopters (commercially manufactured)Figure 18. Accident count by first event category: single-piston helicopters (commercially manufacturedFigure 19. Loss of engine power and airframe failure or malfunction accidents: single-piston helicopters
(commercially manufactured)Figure 20. In flight collision with object and loss of control accidents: single-piston helicopters (commercially
manufactured)Figure 21. Accidents per 1,000 registered aircraft: 1964–1997: single-piston helicopters (commercially
manufactured)Figure 22. Accidents per 1,000 registered aircraft projected to 2010: single-piston helicopters (commercially
manufactured)Figure 23. Loss of engine power yearly accident standards: single-piston helicopters (commercially manufactured)Figure 24. Loss of engine power by category: single-piston helicopters (commercially manufactured)Figure 25. Loss of engine power by activity: single-piston helicopters (commercially manufactured)Figure 26. Loss of engine power by phase of operation: single-piston helicopters (commercially manufactured)Figure 27. In flight collision with object yearly accident statistics: single-piston helicopters (commercially
manufactured)Figure 28. In flight collision with object by object hit: single-piston helicopters (commercially manufactured)Figure 29. In flight collision with object by cause: single-piston helicopters (commercially manufactured)Figure 30. In flight collision with object by phase of operation: single-piston helicopters (commercially
manufactured)Figure 31. In flight collision with object by activity: single-piston helicopters (commercially manufactured)Figure 32. In flight collision with object by part hit: single-piston helicopters (commercially manufactured)Figure 33. Loss of control yearly accident statistics: single-piston helicopters (commercially manufactured)Figure 34. Loss of control accidents by phase of operation: single-piston helicopters (commercially manufactured)

100
Figure 35. Loss of control accidents by activity: single-piston helicopters (commercially manufactured)Figure 36. Loss of control accidents by cause: single-piston helicopters (commercially manufactured)Figure 37. Loss of control accidents by axis lost: single-piston helicopters (commercially manufactured)Figure 38. Loss of control accidents by pilot in command certification: single-piston helicopters (commercially
manufactured)Figure 39. Airframe failure yearly accident statistics: single-piston helicopters (commercially manufactured)Figure 40. Airframe failure accidents by phase of operation: single-piston helicopters (commercially manufactured)Figure 41. Airframe failure accidents by activity: single-piston helicopters (commercially manufactured)Figure 42. Airframe failure accidents by system: single-piston helicopters (commercially manufactured)Figure 43. Summary accident statistics, mid-1963 through 1997: single-piston helicopters (commercially
manufactured)Figure 44. Fatalities per 100 accidents, mid-1963 through 1997: single-piston helicopters (commercially
manufactured)
Commercial, Single-Turbine Engine Helicopters
Figure 45. Single-turbine helicopter fleet size (commercially manufactured)Figure 46. Accidents per 1,000 registered aircraft: single-turbine helicopters (commercially manufactured)Figure 47. Accident count by first event category: single-turbine helicopters (commercially manufactured)Figure 48. Loss of engine-power and airframe failure or malfunction accidents: single-turbine helicopers
(commercially manufactured)Figure 49. In flight collision with object and loss-of-control accidents: single-turbine helicopters (commercially
manufactured)Figure 50. Accidents per 1,000 registered aircraft projected to 2010: single-turbine helicopters (commercially
manufactured)Figure 51. Loss of engine power yearly accident statistics: single-turbine helicopters (commercially manufactured)Figure 52. Loss of engine power accidents by category: single-turbine helicopters (commercially manufactured)Figure 53. Loss-of engine power accidents by activity: single-turbine helicopters (commercially manufactured)Figure 54. Loss of engine power accidents by phase of operation: single-turbine helicopters (commercially
manufactured)Figure 55. In flight collision with object yearly accident statistics: single-turbine helicopters (commercially
manufactured)Figure 56. In flight collision with object accidents by object hit: single-turbine helicopters (commercially
manufactured)Figure 57. In flight collision with object accidents by cause: single-turbine helicopters (commercially manufactured)Figure 58. In flight collision with object accidents by phase of operation: single-turbine helicopters (commercially
manufactured)Figure 59. In flight collision with object accidents by activity: single-turbine helicopters (commercially
manufactured)Figure 60. In flight collision with object accidents by part hit: single-turbine helicopters (commercially
manufactured)Figure 61. Loss of control yearly accident statistics: single-turbine helicopters (commercially manufactured)Figure 62. Loss of control accidents by axis lost: single-turbine helicopters (commercially manufactured)Figure 63. Loss of control accidents by cause: single-turbine helicopters (commercially manufactured)Figure 64. Loss of control accidents by phase of operation: single-turbine helicopters (commercially manufactured)Figure 65. Loss-of-control accidents by activity: single-turbine helicopters (commercially manufactured)Figure 66. Loss-of-control accidents by pilot-in-command certification: single-turbine helicopters (commercially
manufactured)Figure 67. Airframe failure yearly accident statistics: single-turbine helicopters (commercially manufactured)Figure 68. Airframe failure accidents by phase of operation: single-turbine helicopters (commercially
manufactured)Figure 69. Airframe failure accidents by activity: single-turbine helicopters (commercially manufactured)Figure 70. Airframe failure accidents by system: single-turbine helicopters (commercially manufactured)Figure 71. Summary accident statistics, mid-1963 through 1997: single-turbine helicopters (commercially
manufactured)

101
Figure 72. Fatalities per 100 accidents, mid-1963 through 1997: single-turbine helicopters (commerciallymanufactured)
Commercial, Twin-Turbine-Engine Helicopters
Figure 73. Twin-turbine helicopter fleet size (commercially manufactured)Figure 74. Accidents per 1,000 registered aircraft: twin-turbine helicopters (commercially manufactured)Figure 75. Accident count by first event category: twin-turbine helicopters (commercially manufactured)Figure 76. Other first event categories: twin-turbine helicopters (commercially manufactured)Figure 77. Accidents by first-event categories: twin-turbine helicopters (commercially manufactured)Figure 78. Accidents per 1,000 registered aircraft projected to 2010: twin-turbine helicopters (commercially
manufactured)Figure 79. Loss of engine-power yearly accident statistics: twin-turbine helicopters (commercially manufactured)Figure 80. Loss of engine power accidents by category: twin-turbine helicopters (commercially manufactured)Figure 81. Loss of engine power accidents by activity: twin-turbine helicopters (commercially manufactured)Figure 82. Loss of engine power accidents by phase of operation: twin-turbine helicopters (commercially
manufactured)Figure 83. In flight collision with object yearly accident statistics: twin-turbine helicopters (commercially
manufactured)Figure 84. In flight collision with object accidents by object hit: twin-turbine helicopters (commercially
manufactured)Figure 85. In flight collision with object accidents by cause: twin-turbine helicopters (commercially manufactured)Figure 86. In flight collision with object accidents by activity: twin-turbine helicopters (commercially manufactured)Figure 87. In flight collision with object accidents by phase of operation: twin-turbine helicopters (commercially
manufactured)Figure 88. In flight collision with object accidents by part hit: twin-turbine helicopters (commercially manufactured)Figure 89. Loss of control yearly accident statistics: twin-turbine helicopters (commercially manufactured)Figure 90. Loss of control accidents by axis lost: twin-turbine helicopters (commercially manufactured)Figure 91. Loss of control accidents by cause: twin-turbine helicopters (commercially manufactured)Figure 92. Loss of control accidents by phase of operation: twin-turbine helicopters (commercially manufactured)Figure 93. Loss of control accidents by activity: twin-turbine helicopters (commercially manufactured)Figure 94. Airframe failure yearly accident statistics: twin-turbine helicopters (commercially manufactured)Figure 95. Airframe failure accidents by phase of operation: twin-turbine helicopters (commercially manufactured)Figure 96. Airframe failure accidents by activity: twin-turbine helicopters (commercially manufactured)Figure 97. Airframe failure accidents by system: twin-turbine helicopters (commercially manufactured)Figure 98. Summary accident statistics, mid-1963 through 1997: twin-turbine helicopters (commercially
manufactured)Figure 99. Fatalities per 100 accidents, mid-1963 through 1997: twin-turbine helicopters (commercially
manufactured)
All Other Rotorcraft Types
Figure 100. All other rotorcraft types fleet SizeFigure 101. Accidents per 1,000 registered aircraft: all other rotorcraft typesFigure 102. Accident count by first event category: all other rotorcraft typesFigure 103. Loss of engine power accidents: all other rotorcraft typesFigure 104. In flight collision with object accidents: all other rotorcraft typesFigure 105. Loss of control accidents: all other rotorcraft typesFigure 106. Airframe failure accidents: all other rotorcraft typesFigure 107. Summary accident statistics, mid-1963 through 1997: all other rotorcraft typesFigure 108. Fatalities per 100 accidents, mid-1963 through 1997: all other rotorcraft typesFigure 109. Accidents per 1,000 registered aircraft projected to 2010: all other rotorcraft types

102
THIS PAGE INTENTIONALLY BLANK

103
Figure 1. NACA accident form, ca. 1936.

104
2-0342 (1)64/5/14 TIME - 1030 (2
BRYANT WASH (3)
BRANTLY B2 N5900X (4)
CR- 0 0 1PX- 0 0 0, (5)OT- 0 0 0
COMMERCIAL AERIAL APPLICATION (6)
COMMERCIAL, AGE 42, 8177 TOTAL HOURS, 52 IN TYPE NOT INSTRUMENT RATED. (7)
DAMAGE-SUBSTANTIAL (8)
TYPE OF ACCIDENT (9)ENGINE FAILURE OR MALFUNCTIONROLL OVER
PHASE OF OPERATION (10)IN FLIGHT: STARTING SWATH RUNLANDING: POWER-OFF AUTOROTATIVE LANDING
PROBABLE CAUSE(S) (11)MISCELLANEOUS ACTS,CONDITIONS - ICE-CARBURETORMISCELLANEOUS ACTS,CONDITIONS - ANTI-ICING/DEICING EQUIPMENT-IMPROPER OPERATION OF/OR FAILED TO USE
FACTOR(S) (12)WEATHER - CONDITIONS CONDUCIVE TO CARB./INDUCTION SYSTEM ICINGCOMPLETE POWER LOSS - COMPLETE ENGINE FAILURE/FLAMEOUT-1 ENGINEEMERGENCY CIRCUMSTANCES - FORCED LANDING OFF AIRPORT ON LAND
SKY CONDITION CLEAR (13)CEILING AT ACCIDENT SITE UNLIMITEDVISIBILITY AT ACCIDENT SITE 5 OR OVER(UNLIMITED)TEMPERATURE-F 60WIND DIRECTION-DEGREES 270WIND VELOCITY-KNOTS 5TYPE OF WEATHER CONDITIONS VFRTYPE OF FLIGHT PLAN NONE
SPECIAL DATA (14)TOTAL HOURS IN CROP CONTROL - 1750KIND OF OPERATION - SPRAYING FORESTSKIND OF CROP - FOREST-TREESTYPE OF CHEMICAL USED - LIQUID CHEMICAL-NONTOXICPILOT' S SEAT BELT -FASTENED-PROPERLYGLOVES - NOT USEDGOGGLES - NOT USEDCRASH HELMET - NOT AVAILABLECOCKPIT CRASHPAD - NOT INSTALLEDCRASH BAR - NOT INSTALLEDTANK/HOPPER-LOCATION - BELLYELEVATION-AREA BEING TREATED-FEET - 680
REMARKS (15)FORCED LANDING ON UNSUITABLE TERRAIN
Figure 2. Accident mini-brief, 1963–1971.

105
3-0196 72/1/9 TIME - 1415
HILLSBOROUGH,NCENSTROM F-28A N426RD
CR- 0 0 1PX- 0 0 1OT- 0 0 0
COMMERCIAL CTR PASSG-D
COMMERCIAL, AGE 38, 5750 TOTAL HOURS, 38 IN TYPE, INSTRUMENT RATED.
DAMAGE-SUBSTANTIAL
DEPARTURE POINT HILLSBOROUGH,NCINTENDED DESTINATION LOCAL
TYPE OF ACCIDENT ENGINE FAILURE OR MALFUNCTION HARD LANDING
PHASE OF OPERATIONTAKEOFF: INITIAL CLIMBLANDING: POWER-OFF AUTOROTATIVE LANDING
PROBABLE CAUSE(S) POWERPLANT - MISCELLANEOUS: POWERPLANT FAILURE FORUNDETERMINED REASONS PILOT IN COMMAND - MISJUDGED SPEED AND ALTITUDE PARTIAL POWER LOSS - PARTIAL LOSS OF POWER - 1 ENGINE EMERGENCY CIRCUMSTANCES - PRECAUTIONARY LANDING OFF AIRPORT UNUSUAL NOISE
REMARKSENG CKD OK.PLT RPRTD LOUD BANG,ENG RPM INCRD TO 3300.ENTERED AUTO
FM LOW ALT,T/R BLDS HIT TLCONE.
Figure 3. Accident mini-brief, 1972–1981.

106
FILE NO. - 0069 2/10/82 URBANA,IL A/C Reg. No. N2256G Time (Lcl) - 1400 CST----------------------------------------------------------------------------------------------------------------------------------------Basic Information---- Type Operating Certificate-NONE (GENERAL AVIATION) Aircraft Damage Injuries Substantial Fatal Serious Minor None Type of Operation -OTHER Fire Crew 0 0 0 2 Flight Conducted Under -14 CFR 91 NONE Pass 0 0 0 0 Accident Occurred During -LANDING----------------------------------------------------------------------------------------------------------------------------------------Aircraft Information---- Make/Model - SIKORSKY UH-19B Eng Make/Model - WRIGHT R-1300 ELT Installed/Activated - NO -N/A Landing Gear - Tailwheel-all fixed Number Engines - 1 Stall Warning System - UNK/NR Max Gross Wt - 7200 Engine Type - Reciprocating-carburetor Weather Radar - NO No. of Seats - 4 Rated Power - 600 HP----------------------------------------------------------------------------------------------------------------------------------------Environment/Operations Information---- Weather Data Itinerary Airport Proximity Wx Briefing - No record of briefing Last Departure Point On airport Method - N/A HOMER,IL Completeness - N/A Destination Airport Data Basic Weather - VMC URBANA,IL RESTRICTED HELIPORT Wind Dir/Speed- 180/005 KTS Runway Ident - UNK/NR Visibility - 12.0 SM ATC/Airspace Runway Lth/Wid - UNK/NR Cloud Conditions(1st) - NONE Type of Flight Plan - None Runway Surface - Concrete Cloud Conditions(2nd) - NONE Type of Clearance - None Runway Status - Snow - dry Obstructions to Vision- None Type Apch/Lndg - Visual full circuit Precipitation - None Condition of Light - Daylight----------------------------------------------------------------------------------------------------------------------------------------Personnel Information---- Pilot-In-Command Age - 48 Medical Certificate - Valid medical-waivers/limit Certificate(s)/Rating(s) Biennial Flight Review Flight Time (Hours) Private,Commercial Current - YES Total - 561 Last 24 Hrs - 0 SE land Months Since - 1 Make/Model- 53 Last 30 Days- UNK/NR Helicopter Aircraft Type - UNK/NR Instrument- 12 Last 90 Days- 38 Multi-Eng - 64 Rotorcraft - 291 Instrument Rating(s) - None----Narrative----THE PILOT AND A MEDICAL ATTENDANT WERE ON A FLIGHT TO URBANA TO MAKE A MEDICAL EVACUATION. THEPILOT STATED THAT JUST PRIOR TO TOUCHDOWN, THE HELICOPTER BEGAN TO ROTATE TO THE LEFT. HEREPORTED THAT HE LANDED IMMEDIATELY, CUT THE POWER, AND STOPPED THE ROTATION OF THE MAINROTOR AS QUICKLY AS POSSIBLE AFTER TOUCHDOWN. DURING THE LANDING, A MAIN ROTOR BLADE HIT THETAIL CONE AND TAIL ROTOR DRIVE SHAFT, AND FLYING PARTS STRUCK THE FUSELAGE.
Occurrence #1 HARD LANDINGPhase of Operation LANDING - FLARE/TOUCHDOWN
Finding(s) 1. ALTITUDE - MISJUDGED - PILOT IN COMMAND 2. DISTANCE - MISJUDGED - PILOT IN COMMAND 3. ROTORCRAFT FLIGHT CONTROLS - IMPROPER USE OF - PILOT IN COMMAND
----Probable Cause---- is/are finding(s) 1,2,3
Figure 4. Accident mini-brief, 1982.

107
Public 02/25/83 1518 MKC83FA073 COUNCIL BLUFFS ,IA:
HUGHES TH-55A N1040SIOWA WESTERN COMMUNITYCOLLEGE / 0 0 1 1ACC / On Airport/ COUNCIL BLUFFS MUNICIPAL (CBF) Substantial91 Instruction
THE STUDENT, WHO WAS A RATED HELICOPTER PLT, AND A HELICOPTERINSTRUCTOR (CFI) WERE ON A DUAL INSTRUCTIONAL FLT. AFTER TAKEOFF, THEAIRCREW REMAINED IN A RIGHT TRAFFIC PATTERN FOR RWY 13 , INTENDING FORTHE STUDENT TO MAKE A 180 DEG AUTOROTATION TO A PARALLEL TAXIWAY. THESTUDENT OVERSHOT THE AUTOROTATIVE TURN & THE CFI INSTRUCTED HIM TOCONTINUE THE APCH TO A GRASS AREA BETWEEN THE TAXIWAY & RWY. THE CFIREPORTED THAT THE TOUCHDOWN WAS SMOOTH WITH ZERO AIRSPEED. HOWEVER,THE HELICOPTER BEGAN VIBRATING & TURNED TO THE LEFT. REPORTEDLY, THEMAIN ROTOR BLADES HAD SEVERED THE TAIL BOOM.
No Occ Phs Subj Mod Pers-- --- --- ----- ---- ---- 1 200 571 Hard landing Landing - flare/touchdown F 24545 3141 4103 Emergency procedure <> Simulated <> Pilot in command(CFI) F 24520 3135 4101 Autorotation <> Performed <> Dual student C 24523 3120 4101 Distance <> Misjudged <> Dual student C 24518 3120 4101 Altitude <> Misjudged <> Dual studen C 24627 3115 4103 Supervision <> Inadequate <> Pilot in command(CFI)
Figure 5. Accident mini-brief, 1983–1997.

108
NTSB Identification: MIA98LA051. The docket is stored in the (offline) NTSB Imaging System.
Accident occurred JAN-03-98 at BUNNELL, FLAircraft: Bell 47D1, registration: N59326
Injuries: 1 Uninjured.
The student pilot was on a supervised solo flight in the traffic pattern, practicing landings andtakeoffs. At an altitude of about 300 feet above the airport, the helicopter's engine lost power. Thestudent autorotated to an open field, and the helicopter was damaged during a forced landing. Thestudent said when he checked the fuel gauge during preflight, it indicated "5/8" of a tank, whichwas confirmed by a "dip stick test." When he next checked the fuel gauge after doing some patternwork, it indicated "3/8" tank. According to an FAA Inspector's statement, "...the fuel tank wasdrained and less than 12 ounces of fuel remained in the undamaged fuel tank...no othermaintenance discrepancies were found which may have contributed to the accident." The flight wasabout 1 hour and 10 minutes in duration.
Probable Causethe student pilot's improper planning/decision, which resulted in fuel exhaustion, loss of enginepower, and a forced landing.
The helicopter was released to the owner's representative.
MIA98LA051
On January 3, 1998, about 0840 eastern standard time, a Bell 47D1 helicopter, N59326, registeredto a private owner, operating as a 14 CFR Part 91, local instructional flight, crashed during a forcedlanding near Bunnell, Florida. Visual meteorological conditions prevailed and no flight plan wasfiled. The helicopter was substantially damaged. The student pilot was not injured. The flightoriginated about 0730.
The student pilot was on a solo flight in the traffic pattern, practicing landings and takeoffs whenthe engine lost power. The pilot autorotated to an open field. The pilot said when he checked "thefuel indicator [it] was on 5/8 tank (sic), which was confirmed by the dip stick test." When he nextchecked the fuel gauge after doing some pattern work, it indicated "3/8 tank (sic)."
According to the FAA Inspector's statement, the student pilot was on a supervised instructionalflight, and at an altitude of about 300 feet above the airport the helicopter's "engine stopped." Theinspector stated, "...the fuel tank was drained and less then 12 ounces of fuel remained in theundamaged fuel tank...no other maintenance discrepancies were found which may have contributedto the accident."
Figure 6. Accident mini-brief, NTSB web site summary.

109
050100
150
200
250
300
350 19
6019
6519
7019
7519
8019
8519
9019
9520
00
Rot
orcr
aft
acci
dent
coun
tea
chye
ar
End
of
year
All
rot
orcr
aft
Ref
eren
cetr
end
line
Acc
iden
t"b
ubbl
e"pe
riod
Fig
ure
7. R
otor
craf
t ac
cide
nts
per
year
: 19
64–1
997
(tot
al r
egis
tere
d ro
torc
raft
fle
et).
Acc
iden
t"b
ubbl
e"

110
0
2,00
0
4,00
0
6,00
0
8,00
0
10,0
00
12,0
00
14,0
00
1945
1950
1955
1960
1965
1970
1975
1980
1985
1990
1995
2000
Reg
iste
red
roto
rcra
ftfl
eet
size
End
of
year
Tot
alro
torc
raft
flee
t
Com
mer
cial
helic
opte
rm
anuf
actu
rers
onlyA
llot
her
type
s
Fig
ure
8. F
AA
reg
iste
red
roto
rcra
ft c
ount
: 19
51–1
997
(tot
al r
egis
tere
d ro
torc
raft
fle
et).

111
0
500
1,00
0
1,50
0
2,00
0
2,50
0
01,
000
2,00
03,
000
4,00
05,
000
6,00
07,
000
8,00
09,
000
Rot
orcr
aft
cum
ulat
ive
acci
dent
cou
nt o
ver
34 y
ears
Fat
alit
ies
and
inju
ries
(cum
ulat
ive)
8,43
6
Peo
ple
invo
lved
1
6,82
5
Fat
al
2
,135
S
erio
us
1,7
60
Min
or +
Non
e 1
2,93
0
Fat
al2,
135
Seri
ous
1,76
0
Fig
ure
9. I
njur
ies
and
fata
litie
s ca
used
by
roto
rcra
ft a
ccid
ents
: 19
63–1
997
(tot
al r
egis
tere
d ro
torc
raft
fle
et).
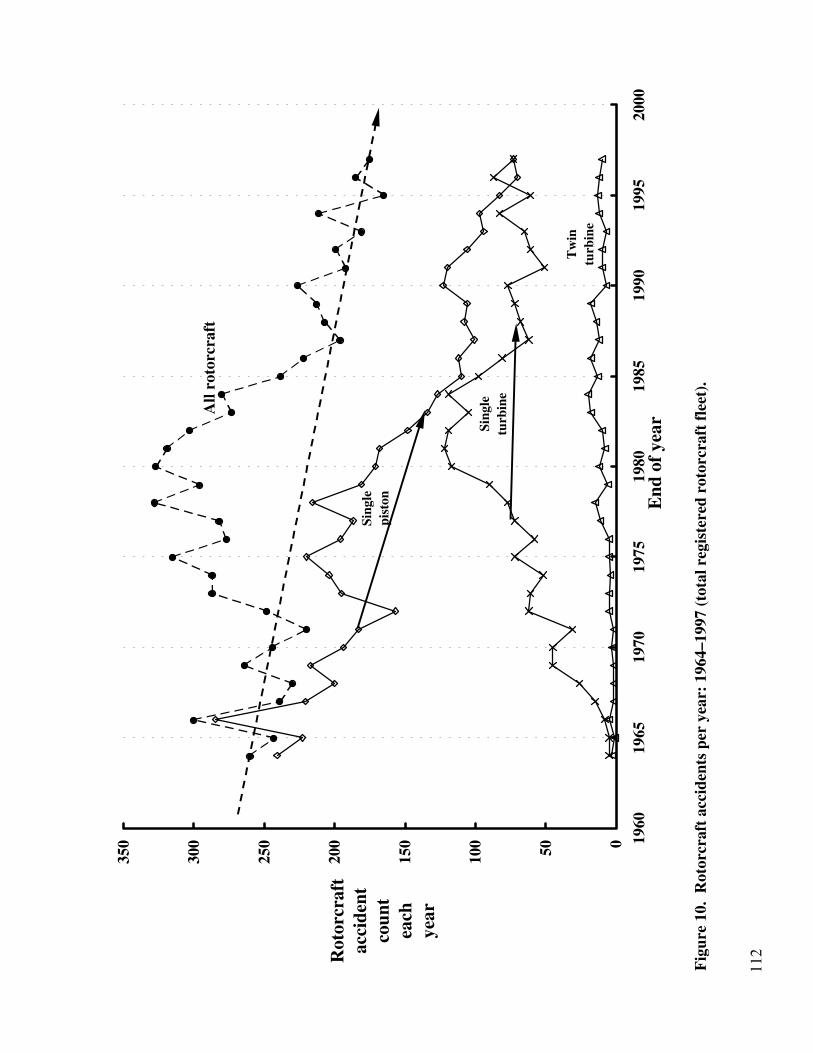
112
050100
150
200
250
300
350 19
6019
6519
7019
7519
8019
8519
9019
9520
00
Rot
orcr
aft
acci
dent
coun
tea
chye
ar
End
of
year
Sing
lepi
ston
Sing
letu
rbin
e
Tw
intu
rbin
e
All
roto
rcra
ft
Fig
ure
10.
Rot
orcr
aft
acci
dent
s pe
r ye
ar:
1964
–199
7 (t
otal
reg
iste
red
roto
rcra
ft f
leet
).

113
2,40
8
1,32
2
1,11
4
1,08
3
656
642
433
159
134
79 83 61 56 50 32 27 24 24 28 19 2 050
01,
000
1,50
02,
000
2,50
0
Los
s of
eng
ine
pow
er
In f
light
col
lisio
n w
ith
obje
ct
Los
s of
con
trol
Air
fram
e/co
mpo
nent
/sys
tem
fai
lure
/mal
func
tion
Har
d la
ndin
g
In f
light
col
lisio
n w
ith
terr
ain/
wat
er
Rol
love
r/no
seov
er
Wea
ther
Mis
cella
neou
s/ot
her
Pro
pelle
r/ro
tor
cont
act
to p
erso
n
Stal
l/set
tlin
g w
ith
pow
er
Mid
air
colli
sion
On
grou
nd/w
ater
col
lisio
n w
ith
obje
ct
Fir
e/ex
plos
ion
Abr
upt
man
euve
r
Gea
r co
llaps
ed
Und
ersh
oot/
over
shoo
t
Dra
gged
win
g, r
otor
, pod
, flo
at o
r ta
il/sk
id
Und
eter
min
ed
On
grou
nd/w
ater
enc
ount
er w
ith
terr
ain/
wat
er
Mis
sing
NT
SB a
ccid
ent
coun
t
Fig
ure
11.
Rot
orcr
aft
acci
dent
cou
nt b
y fi
rst
even
t ca
tego
ry (
tota
l reg
iste
red
roto
rcra
ft f
leet
).
Tot
al o
f 8,
436
acci
dent
sfr
om m
id-1
963
thro
ugh
1997

114
020406080100
120 19
6019
6519
7019
7519
8019
8519
9019
9520
00
Rot
orcr
aft
acci
dent
coun
tea
chye
ar
End
of
year
Los
s of
eng
ine
pow
er(a
ll ro
torc
raft
)
Air
fram
e/co
mpo
nent
/sy
stem
fai
lure
/mal
func
tion
(all
roto
rcra
ft)
Fig
ure
12.
Los
s of
eng
ine
pow
er a
nd a
irfr
ame/
com
pone
nt/s
yste
m f
ailu
re o
r m
alfu
ncti
on a
ccid
ents
(to
tal r
egis
tere
d ro
torc
raft
fle
et).

115
01020304050607080
1960
1965
1970
1975
1980
1985
1990
1995
2000
Rot
orcr
aft
acci
dent
coun
tea
chye
ar
End
of
year
Los
s of
con
trol
(all
roto
rcra
ft)
Fig
ure
13.
In f
light
col
lisio
n w
ith
obje
ct a
nd lo
ss o
f co
ntro
l acc
iden
ts (
tota
l reg
iste
red
roto
rcra
ft f
leet
).
In f
light
col
lisio
n w
ith
obje
ct(a
ll ro
torc
raft
)

116
609
6562
135
10
36
7679
107
145
417
495
172
010
020
030
040
050
060
070
0
Und
eter
min
ed/O
ther
Oth
er S
ub-c
ateg
orie
s
Rot
or D
rive
Sys
tem
Oth
er E
ngin
e Sy
stem
s
F
uel i
mpr
oper
I
nduc
tion
air
sys
tem
C
arbu
reto
r he
at
F
uel c
ontr
ol
F
uel s
tarv
atio
n
F
uel c
onta
min
atio
n
F
uel s
yste
m
F
uel e
xhau
stio
n
Eng
ine
stru
ctur
e
NT
SB a
ccid
ent
coun
t
1,04
2F
uel /
air
m
ixtu
rere
late
dac
cide
nts
Fig
ure
14.
Fac
tors
rel
ated
to
loss
of
engi
ne p
ower
acc
iden
ts (
tota
l reg
iste
red
roto
rcra
ft f
leet
).

117
0102030405060708090100
110
120
130 19
6019
6519
7019
7519
8019
8519
9019
9520
0020
0520
10
Acc
iden
tspe
r1,
000
regi
ster
edro
torc
raft
End
of
year
Fig
ure
15.
Rot
orcr
aft
acci
dent
s pe
r 1,
000
regi
ster
ed a
ircr
aft:
(to
tal r
egis
tere
d ro
torc
raft
fle
et).
1964
thr
ough
199
7ac
cide
nt e
xper
ienc
e tr
end-
line
extr
apol
ated
to
2010
(exp
onen
tial
)

118
0
500
1,00
0
1,50
0
2,00
0
2,50
0
3,00
0
3,50
0
4,00
0
4,50
0
5,00
0 1955
1960
1965
1970
1975
1980
1985
1990
1995
2000
Reg
iste
red
sing
le-
pist
onhe
licop
ters
End
of
year
FA
A d
ata,
(edi
ted
by H
arri
s)
Rot
or R
oste
r da
ta,
from
Air
Tra
ck
Gro
wth
rat
e12
7 p
er y
ear
Gro
wth
rat
e19
3 pe
r ye
ar
Fig
ure
16.
Sing
le-p
isto
n he
licop
ter
flee
t si
ze (
com
mer
cial
ly m
anuf
actu
red)
.

119
0102030405060708090100
110
120
130
140
150 19
6019
6519
7019
7519
8019
8519
9019
9520
00
Acc
iden
tspe
r1,
000
regi
ster
ed
roto
rcra
ft
End
of
year
Fig
ure
17.
Acc
iden
ts p
er 1
,000
reg
iste
red
airc
raft
: si
ngle
-pis
ton
helic
opte
rs (
com
mer
cial
ly m
anuf
actu
red)
.

120
1,55
4
953
625
639
483
443
290
57 74
33
67
17 26 28 12 16 16 20 12 5 1 020
040
060
080
01,
000
1,20
01,
400
1,60
01,
800
Los
s of
eng
ine
pow
er
In f
light
col
lisio
n w
ith
obje
ct
Los
s of
con
trol
Air
fram
e/co
mpo
nent
/sys
tem
fai
lure
/mal
func
tion
Har
d la
ndin
g
In f
light
col
lisio
n w
ith
terr
ain/
wat
er
Rol
love
r/no
seov
er
Wea
ther
Mis
cella
neou
s/ot
her
Pro
pelle
r/ro
tor
cont
act
to p
erso
n
Stal
l/set
tlin
g w
ith
pow
er
Mid
air
colli
sion
On
grou
nd/w
ater
col
lisio
n w
ith
obje
ct
Fir
e/ex
plos
ion
Abr
upt
man
euve
r
Gea
r co
llaps
ed
Und
ersh
oot/
over
shoo
t
Dra
gged
win
g, r
otor
, pod
, flo
at o
r ta
il/sk
id
Und
eter
min
ed
On
grou
nd/w
ater
enc
ount
er w
ith
terr
ain/
wat
er
Mis
sing
NT
SB a
ccid
ent
coun
t
Fig
ure
18.
Acc
iden
t co
unt
by f
irst
eve
nt c
ateg
ory:
sin
gle-
pist
on h
elic
opte
rs (
com
mer
cial
ly m
anuf
actu
red)
.
Tot
al o
f 5,
371
acci
dent
sfr
om m
id-1
963
thro
ugh
1997

121
0102030405060708090
1960
1965
1970
1975
1980
1985
1990
1995
2000
Sing
le-
pist
onhe
licop
ter
acci
dent
coun
t
End
of
year
Los
s of
eng
ine
pow
er
Air
fram
e/co
mpo
nent
/sy
stem
fai
lure
or
mal
func
tion
Fig
ure
19.
Los
s of
eng
ine
pow
er a
nd a
irfr
ame
failu
re o
r m
alfu
ncti
on a
ccid
ents
: si
ngle
-pis
ton
helic
opte
rs
(
com
mer
cial
ly m
anuf
actu
red)
.

122
01020304050607080
1960
1965
1970
1975
1980
1985
1990
1995
2000
Sing
le-
pist
onhe
licop
ter
acci
dent
coun
t
End
of
year
Los
s of
con
trol
In f
light
col
lisio
n w
ith
obje
ct
Fig
ure
20.
In f
light
col
lisio
n w
ith
obje
ct a
nd lo
ss o
f co
ntro
l acc
iden
ts:
sing
le-p
isto
n he
licop
ters
(co
mm
erci
ally
man
ufac
ture
d).

123
0102030405060708090100
110
120
130
140
150
160 19
6019
6519
7019
7519
8019
8519
9019
9520
00
Acc
iden
tspe
r1,
000
regi
ster
ed
roto
rcra
ft
End
of
yea
r
Fig
ure
21.
Acc
iden
ts p
er 1
,000
reg
iste
red
airc
raft
: 19
64–1
997:
sin
gle-
pist
on h
elic
opte
rs (
com
mer
cial
ly m
anuf
actu
red)
.
1964
thr
ough
196
9ac
cide
nt e
xper
ienc
e tr
end-
line
extr
apol
ated
to
1985
(exp
onen
tial
)
1970
thr
ough
198
5ac
cide
nt e
xper
ienc
e tr
end-
line
(exp
onen
tial
)19
90 t
hrou
gh 1
997
acci
dent
exp
erie
nce
tren
d-lin
e(e
xpon
enti
al)

124
05101520253035
1985
1990
1995
2000
2005
2010
Acc
iden
tspe
r1,
000
regi
ster
edro
torc
raft
End
of
year
Fig
ure
22.
Acc
iden
ts p
er 1
,000
reg
iste
red
airc
raft
pro
ject
ed t
o 20
10:
sing
le-p
isto
n he
licop
ters
(co
mm
erci
ally
man
ufac
ture
d).
1990
thr
ough
199
7ac
cide
nt e
xper
ienc
e tr
end-
line
extr
apol
ated
to
2010
(exp
onen
tial
)

125
051015202530354045
1960
1965
1970
1975
1980
1985
1990
1995
2000
Los
s of
engi
nepo
wer
stat
isti
cs
End
of
year
Per
cent
age
ofto
tal s
ingl
e-pi
ston
acci
dent
s
Acc
iden
ts p
er 1
,000
regi
ster
ed s
ingl
e-pi
ston
Fig
ure
23.
Los
s of
eng
ine
pow
er y
earl
y ac
cide
nt s
tati
stic
s: s
ingl
e-pi
ston
hel
icop
ters
(co
mm
erci
ally
man
ufac
ture
d).

126
397
5453
101
66
70
42
72
97
326
263
67
050
100
150
200
250
300
350
400
450
Und
eter
min
ed/O
ther
Oth
er S
ub-c
ateg
orie
s
Rot
or D
rive
Sys
tem
Oth
er E
ngin
e Sy
stem
s
F
uel i
mpr
oper
I
nduc
tion
air
sys
tem
C
arbu
reto
r he
at
F
uel c
ontr
ol
F
uel s
tarv
atio
n
F
uel c
onta
min
atio
n
F
uel s
yste
m
F
uel e
xhau
stio
n
Eng
ine
stru
ctur
e
NT
SB a
ccid
ent
coun
t
686
Fue
l / a
ir
mix
ture
rela
ted
acci
dent
s
Fig
ure
24.
Los
s of
eng
ine
pow
er a
ccid
ents
by
cate
gory
: si
ngle
-pis
ton
helic
opte
r (c
omm
erci
ally
man
ufac
ture
d).

127
2
272630
80
97
173
117
231
277
494
010
020
030
040
050
060
0
Unk
now
n/no
t re
port
ed
Pub
lic/m
ilita
ry u
se
Exe
cuti
ve/c
orpo
rate
Flig
ht/m
aint
enan
ce t
est
Fer
ry/r
epos
itio
n
Bus
ines
s us
e
Inst
ruct
iona
l/tra
inin
g
Pas
seng
er s
ervi
ce
Per
sona
l use
Gen
eral
uti
lity
Aer
ial a
pplic
atio
n
NT
SB a
ccid
ent
coun
t
Fig
ure
25.
Los
s of
eng
ine
pow
er a
ccid
ents
by
acti
vity
: si
ngle
-pis
ton
helic
opte
rs (
com
mer
cial
ly m
anuf
actu
red)
.

128
13
10
18
35
72
60
53
87
280
328
607
010
020
030
040
050
060
070
0
Stan
ding
/sta
tic
Unk
now
n
Tax
i
Oth
er
Clim
b
Des
cent
Lan
ding
Hov
er
App
roac
h
Tak
eoff
Man
euve
ring
Cru
ise
NT
SB a
ccid
ent
coun
t
Fig
ure
26.
Los
s of
eng
ine
pow
er a
ccid
ents
by
phas
e of
ope
rati
on:
sing
le-p
isto
n he
licop
ters
(co
mm
erci
ally
man
ufac
ture
d).

129
0510152025303540
1960
1965
1970
1975
1980
1985
1990
1995
2000
In f
light
colli
sion
wit
hob
ject
stat
isti
cs
End
of
year
Per
cent
age
ofto
tal s
ingl
e-pi
ston
acci
dent
s
Acc
iden
ts p
er 1
,000
regi
ster
ed s
ingl
e-pi
ston
Fig
ure
27.
In f
light
col
lisio
n w
ith
obje
ct y
earl
y ac
cide
nt s
tati
stic
s: s
ingl
e-pi
ston
hel
icop
ters
(co
mm
erci
ally
man
ufac
ture
d).

130
81078
14
27
19
3535
30
26
32
47
148
197
310
050
100
150
200
250
300
350
Mis
cella
neou
s
Uns
peci
fied
obj
ect
Bir
d st
rike
Ele
ctro
nic
tow
er
Air
craf
t
Bui
ldin
g
FO
D
Cro
p
Veh
icle
Roc
k/br
ush/
terr
ain
Fen
ce/f
ence
pos
t
Air
port
/hel
ipad
fac
ility
Pol
e/pi
pe
Tre
e(s)
Wir
e/po
le
Wir
e
NT
SB a
ccid
ent
coun
t
Fig
ure
28.
In f
light
col
lisio
n w
ith
obje
ct a
ccid
ents
by
obje
ct h
it:
sing
le-p
isto
n he
licop
ters
(co
mm
erci
ally
man
ufac
ture
d).

131
188
2020
22
39
5254
68
83
87
157
165
020
4060
8010
012
014
016
018
020
0
Und
eter
min
ed
Obs
tacl
e P
roxi
mit
y
Inco
rrec
t In
form
atio
n
Insu
ff C
lear
ance
for
Tur
n
Con
ceal
ed in
Ter
rain
Win
d ca
uses
dri
ft
Div
erte
d A
tten
tion
End
of
Day
- F
atig
ue
Inad
equa
te R
PM
/per
f
Deg
rade
d V
isib
ility
Fai
lure
to
See
& A
void
Impr
oper
Dec
isio
n
NT
SB a
ccid
ent
coun
t
Fig
ure
29.
In f
light
col
lisio
n w
ith
obje
ct a
ccid
ents
by
caus
e: s
ingl
e-pi
ston
hel
icop
ters
(co
mm
erci
ally
man
ufac
ture
d).

132
245
15
36
50
55
75
106
96
133
376
050
100
150
200
250
300
350
400
Unk
now
n
Stan
ding
/sta
tic
Clim
b
Des
cent
Oth
er
Tax
i
App
roac
h
Hov
er
Lan
ding
Cru
ise
Tak
eoff
Man
euve
ring
NT
SB a
ccid
ent
coun
t
Fig
ure
30.
In f
light
col
lisio
n w
ith
obje
ct a
ccid
ents
by
phas
e of
ope
rati
on:
sing
le-p
isto
n he
licop
ters
(co
mm
erci
ally
man
ufac
ture
d).

133
3
101211
31
62
69
98
70
168
419
050
100
150
200
250
300
350
400
450
Unk
now
n/N
ot r
epor
ted
Flig
ht/m
aint
enan
ce t
est
Pub
lic/m
ilita
ry u
se
Exe
cuti
ve/c
orpo
rate
Fer
ry/R
epos
itio
n
Inst
ruct
iona
l/tra
inin
g
Bus
ines
s us
e
Per
sona
l use
Pas
seng
er s
ervi
ce
Gen
eral
uti
lity
Aer
ial a
pplic
atio
n
NT
SB a
ccid
ent
coun
t
Fig
ure
31.
In f
light
col
lisio
n w
ith
obje
ct a
ccid
ents
by
acti
vity
: si
ngle
-pis
ton
helic
opte
rs (
com
mer
cial
ly m
anuf
actu
red)
.

134
33
5
12
35
83
87
010
2030
4050
6070
8090
100
Cab
in
Mai
n ro
tor
mas
t
Tai
l boo
m
Ext
erna
l Loa
d
Lan
ding
gea
r
Mai
n ro
tor
blad
es
Tai
l rot
or
NT
SB a
ccid
ent
coun
t
Fig
ure
32.
In f
light
col
lisio
n w
ith
obje
ct a
ccid
ents
by
part
hit
: si
ngle
-pis
ton
helic
opte
rs (
com
mer
cial
ly m
anuf
actu
red)
.

135
051015202530
1960
1965
1970
1975
1980
1985
1990
1995
2000
Los
sof
cont
rol
stat
isti
cs
End
of
year
Per
cent
age
ofto
tal s
ingl
e-pi
ston
acci
dent
s
Acc
iden
ts p
er 1
,000
regi
ster
ed s
ingl
e-pi
ston
Fig
ure
33.
Los
s of
con
trol
ear
ly a
ccid
ent
stat
isti
cs:
sing
le-p
isto
n he
licop
ters
(co
mm
erci
ally
man
ufac
ture
d).

136
8
56
9
23
21
37
43
79
96
150
148
020
4060
8010
012
014
016
0
Oth
er
Stan
ding
/sta
tic
Clim
b
Des
cent
Tax
i
Unk
now
n
App
roac
h
Cru
ise
Lan
ding
Man
euve
ring
Hov
er
Tak
eoff
NT
SB a
ccid
ent
coun
t
Fig
ure
34.
Los
s of
con
trol
acc
iden
ts b
y ph
ase
of o
pera
tion
: si
ngle
-pis
ton
helic
opte
rs (
com
mer
cial
ly m
anuf
actu
red)
.

137
1
4
10
22
16
33
40
133
98
152
116
020
4060
8010
012
014
016
0
Unk
now
n/N
ot r
epor
ted
Exe
cuti
ve/c
orpo
rate
Pub
lic/m
ilita
ry u
se
Fer
ry/R
epos
itio
n
Flig
ht/m
aint
enan
ce t
est
Bus
ines
s us
e
Pas
seng
er s
ervi
ce
Aer
ial a
pplic
atio
n
Gen
eral
uti
lity
Inst
ruct
iona
l/tra
inin
g
Per
sona
l use
NT
SB a
ccid
ent
coun
t
Fig
ure
35.
Los
s of
con
trol
acc
iden
ts b
y ac
tivi
ty:
sing
le-p
isto
n he
licop
ters
(co
mm
erci
ally
man
ufac
ture
d).

138
29
1213
2021
29
33
38
44
72
209
105
050
100
150
200
250
Mis
cella
neou
s
Inad
equa
te p
refl
ight
pla
nnin
g
Air
fram
e/co
mp.
/sys
. fai
l. or
mal
f.
Unq
ualif
ied
oper
ator
Los
s of
vis
ual r
ef./s
pati
al d
isor
ient
.
Wei
ght/
CG
Flig
ht c
ontr
ol f
ailu
re/d
efic
ienc
y
Att
ache
d/sn
agge
d to
grd
. equ
ip.
Und
eter
min
ed
Win
ds
Low
rot
or R
PM
Impr
oper
ope
rati
on o
f co
ntro
ls
NT
SB a
ccid
ent
coun
t
Fig
ure
36.
Los
s of
con
trol
acc
iden
ts b
y ca
use:
sin
gle-
pist
on h
elic
opte
rs (
com
mer
cial
ly m
anuf
actu
red)
.

139
56
231
30
3
70
25
94
21
95
0 0
5010
015
020
025
0
Not
Rep
orte
d B
ut L
ow R
otor
RP
MNot
Rep
orte
d
Pit
ch &
Low
Rot
or R
PM
Pit
ch
Rol
l & L
ow R
otor
RP
M
Rol
l
Ver
tica
l & L
ow R
otor
RP
M
Ver
tica
l
Yaw
& L
ow R
otor
RP
M
Yaw
NT
SB a
ccid
ent
coun
t
Fig
ure
37.
Los
s of
con
trol
acc
iden
ts b
y ax
is lo
st:
sing
le-p
isto
n he
licop
ters
(co
mm
erci
ally
man
ufac
ture
d).

140
1
5
7
12
1617
55
77
96
175
050
100
150
200
Mili
tary
Onl
y
Oth
er/U
nkno
wn/
Not
Rep
orte
d
No
Rat
ing
Spec
ifie
d-C
FI
Non
e
AT
P-C
FI
Air
line
Tra
nspo
rt P
ilot
Stud
ent
Pri
vate
Com
mer
cial
-CF
I
Com
mer
cial
NT
SB a
ccid
ent
coun
t
Fig
ure
38.
Los
s of
con
trol
acc
iden
ts b
y pi
lot
in c
omm
and
cert
ific
atio
n: s
ingl
e-pi
ston
hel
icop
ters
(co
mm
erci
ally
man
ufac
ture
d).

141
02468101214161820
1960
1965
1970
1975
1980
1985
1990
1995
2000
Air
fram
e/co
mpo
nent
/sy
stem
failu
reor
mal
func
tion
stat
isti
cs
End
of
year
Per
cent
age
ofto
tal s
ingl
e-pi
ston
acci
dent
s
Acc
iden
ts p
er 1
,000
regi
ster
ed s
ingl
e-pi
ston
Fig
ure
39.
Air
fram
e fa
ilure
yea
rly
acci
dent
sta
tist
ics:
sin
gle-
pist
on h
elic
opte
rs (
com
mer
cial
ly m
anuf
actu
red)
.

142
8
5
1314
26
13
31
36
41
99
137
216
050
100
150
200
250
Unk
now
n
Oth
er
Tax
i
Des
cent
Stan
ding
/sta
tic
Clim
b
App
roac
h
Lan
ding
Hov
er
Tak
eoff
Man
euve
ring
Cru
ise
NT
SB a
ccid
ent
coun
t
Fig
ure
40.
Air
fram
e fa
ilure
acc
iden
ts b
y ph
ase
of o
pera
tion
: si
ngle
-pis
ton
helic
opte
rs (
com
mer
cial
ly m
anuf
actu
red)
.

143
1
7
1414
25
55
7375
55
191
129
050
100
150
200
250
Unk
now
n/N
ot r
epor
ted
Pub
lic/m
ilita
ry u
se
Flig
ht/m
aint
enan
ce t
est
Exe
cuti
ve/c
orpo
rate
Fer
ry/R
epos
itio
n
Bus
ines
s us
e
Inst
ruct
iona
l/tra
inin
g
Per
sona
l use
Pas
seng
er s
ervi
ce
Aer
ial a
pplic
atio
n
Gen
eral
uti
lity
NT
SB a
ccid
ent
coun
t
Fig
ure
41.
Air
fram
e fa
ilure
acc
iden
ts b
y ac
tivi
ty:
sing
le-p
isto
n he
licop
ters
(co
mm
erci
ally
man
ufac
ture
d).

144
16
7
24
64
38
63
124
57
119
127
020
4060
8010
012
014
0
Und
eter
min
ed/O
ther
Eng
ine
Lan
ding
gea
r
Air
fram
e
Con
trol
sys
tem
-Tai
l
Con
trol
sys
tem
-Mai
n
Tai
l rot
or
Mai
n ro
tor
Dri
ve t
rain
-Tai
l
Dri
ve t
rain
-Mai
n
NT
SB a
ccid
ent
coun
t
Fig
ure
42.
Air
fram
e fa
ilure
acc
iden
ts b
y sy
stem
: si
ngle
-pis
ton
helic
opte
rs (
com
mer
cial
ly m
anuf
actu
red)
.

145
0
1,00
0
2,00
0
3,00
0
4,00
0
5,00
0
6,00
0
03
69
1215
1821
1,55
4
Los
s of
eng
ine
pow
er
953
In
flig
ht c
ollis
ion
wit
h ob
ject
63
9
Air
fram
e/co
mpo
nent
/sys
tem
fai
lure
/mal
func
tion
62
5
Los
s of
con
trol
48
3
Har
d la
ndin
g
443
In
-flig
ht c
ollis
ion
wit
h te
rrai
n/w
ater
29
0
Rol
love
r/no
se-o
ver
4,
987
A
ccid
ents
fro
m f
irst
7 c
ateg
orie
s
384
A
ccid
ents
fro
m o
ther
14
cate
gori
es
5,37
1
Tot
al
7 C
ateg
orie
s ac
coun
t fo
r 93
% o
f ac
cide
nts
4 C
ateg
orie
s ac
coun
t fo
r 70
% o
f ac
cide
nts
NT
SB m
ajor
cat
egor
ies
Sing
le-
pist
onhe
licop
ter
acci
dent
coun
t
Fig
ure
43.
Sum
mar
y ac
cide
nt s
tati
stic
s, m
id-1
963
thro
ugh
1997
: si
ngle
-pis
ton
helic
opte
rs (
com
mer
cial
ly m
anuf
actu
red)
.

146
1
3
4
77
9
10
11
13
15
1718
24
37
42
42
0
0 0
510
1520
2530
3540
45
Gea
r co
llaps
ed
On
grou
nd/w
ater
enc
ount
er w
ith
terr
ain/
wat
er
Har
d la
ndin
g
Rol
love
r/no
seov
er
On
grou
nd/w
ater
col
lisio
n w
ith
obje
ct
Los
s of
eng
ine
pow
er
Fir
e/ex
plos
ion
Stal
l/set
tlin
g w
ith
pow
er
Dra
gged
win
g, r
otor
, pod
, flo
at o
r ta
il/sk
id
In f
light
col
lisio
n w
ith
terr
ain/
wat
er
Und
ersh
oot/
over
shoo
t
Los
s of
con
trol
In f
light
col
lisio
n w
ith
obje
ct
Mis
cella
neou
s/ot
her
Air
fram
e/co
mpo
nent
/sys
tem
fai
lure
/mal
func
tion
Wea
ther
Abr
upt
man
euve
r
Pro
pelle
r/ro
tor
cont
act
to p
erso
n
Fat
alit
ies
per
100
acci
dent
s
Fig
ure
44.
Fat
alit
ies
per
100
acci
dent
s, m
id-1
963
thro
ugh
1997
: si
ngle
-pis
ton
helic
opte
rs (
com
mer
cial
ly m
anuf
actu
red)
.
Fat
alit
ies
Fir
st-e
vent
cat
egor
y 1
66
In f
light
col
lisio
n w
ith
obje
ct 1
53
Air
fram
e/co
mpo
nent
/sys
tem
fai
lure
/mal
func
tion
106
L
oss
of e
ngin
e po
wer
9
2
L
oss
of c
ontr
ol
47
In
flig
ht c
ollis
ion
wit
h te
rrai
n/w
ater
2
2
M
idai
r co
llisi
on
21
Wea
ther
1
4
P
rope
ller/
roto
r co
ntac
t to
per
son
6
2
U
ndet
erm
ined
/mis
cella
neou
s/ot
her
683
T
otal

147
0
500
1,00
0
1,50
0
2,00
0
2,50
0
3,00
0
3,50
0
4,00
0
4,50
0
5,00
0 1955
1960
1965
1970
1975
1980
1985
1990
1995
2000
Reg
iste
red
sing
le-
turb
ine
helic
opte
rs
End
of
year
Rot
or R
oste
r D
ata,
from
Air
Tra
ck
Fig
ure
45.
Sing
le-t
urbi
ne h
elic
opte
r fl
eet
size
(co
mm
erci
ally
man
ufac
ture
d).
FA
A d
ata,
(edi
ted
by H
arri
s)

148
0102030405060708090100
110
120
130
140
150 19
6019
6519
7019
7519
8019
8519
9019
9520
00
Acc
iden
tspe
r1,
000
regi
ster
edro
torc
raft
End
of
year
Sing
lepi
ston
(fig
. 17)
Sing
letu
rbin
e
Fig
ure
46.
Acc
iden
ts p
er 1
,000
reg
iste
red
airc
raft
: si
ngle
-tur
bine
hel
icop
ters
(co
mm
erci
ally
man
ufac
ture
d).

149
704
298
284
282
140
143
119
85
42 35
2
37
18 15 8 3 4 2
13 12
1 010
020
030
040
050
060
070
080
0
Los
s of
eng
ine
pow
er
In f
light
col
lisio
n w
ith
obje
ct
Los
s of
con
trol
Air
fram
e/co
mpo
nent
/sys
tem
fai
lure
/mal
func
tion
Har
d la
ndin
g
In f
light
col
lisio
n w
ith
terr
ain/
wat
er
Rol
love
r/no
seov
er
Wea
ther
Mis
cella
neou
s/ot
her
Pro
pelle
r/ro
tor
cont
act
to p
erso
n
Stal
l/set
tlin
g w
ith
pow
er
Mid
air
colli
sion
On
grou
nd/w
ater
col
lisio
n w
ith
obje
ct
Fir
e/ex
plos
ion
Abr
upt
man
euve
r
Gea
r co
llaps
ed
Und
ersh
oot/
over
shoo
t
Dra
gged
win
g, r
otor
, pod
, flo
at o
r ta
il/sk
id
Und
eter
min
ed
On
grou
nd/w
ater
enc
ount
er w
ith
terr
ain/
wat
er
Mis
sing
NT
SB a
ccid
ent
coun
t
Fig
ure
47.
Acc
iden
t co
unt
by f
irst
eve
nt c
ateg
ory:
sin
gle-
turb
ine
helic
opte
rs (
com
mer
cial
ly m
anuf
actu
red)
. Tot
al o
f 2,
247
acci
dent
sfr
om m
id-1
963
thro
ugh
1997

150
0102030405060
1960
1965
1970
1975
1980
1985
1990
1995
2000
Sing
le-
turb
ine
helic
opte
rac
cide
ntco
unt
End
of
year
Los
s of
eng
ine
pow
er
Air
fram
e/co
mpo
nent
/sy
stem
fai
lure
/mal
func
tion
Fig
ure
48.
Los
s of
eng
ine
pow
er a
nd a
irfr
ame
failu
re o
r m
alfu
ncti
on a
ccid
ents
: si
ngle
-tur
bine
hel
icop
ters
(co
mm
erci
ally
man
ufac
ture
d).

151
0510152025303540
1960
1965
1970
1975
1980
1985
1990
1995
2000
Sing
le-
turb
ine
helic
opte
rac
cide
ntco
unt
End
of
year
Los
s of
con
trol
In f
light
col
lisio
n w
ith
obje
ct
In f
light
col
lisio
n w
ith
obje
ctP
lus
Los
s of
con
trol
Fig
ure
49.
In f
light
col
lisio
n w
ith
obje
ct a
nd lo
ss o
f co
ntro
l acc
iden
ts:
sing
le-t
urbi
ne h
elic
opte
rs (
com
mer
cial
ly m
anuf
actu
red)
.

152
0510152025
1980
1985
1990
1995
2000
2005
2010
Acc
iden
tspe
r1,
000
regi
ster
edro
torc
raft
End
of
year
Fig
ure
50.
Acc
iden
ts p
er 1
,000
reg
iste
red
airc
raft
pro
ject
ed t
o 20
10:
sing
le-t
urbi
ne h
elic
opte
rs (
com
mer
cial
ly m
anuf
actu
red)
.
1986
thr
ough
199
7ac
cide
nt e
xper
ienc
e tr
end-
line
extr
apol
ated
to
2010
(exp
onen
tial
)

153
010203040506070
1960
1965
1970
1975
1980
1985
1990
1995
2000
Los
s of
engi
nepo
wer
stat
isti
cs
End
of
year
Per
cent
age
ofto
tal s
ingl
e-tu
rbin
eac
cide
nts
Acc
iden
ts p
er 1
,000
regi
ster
ed s
ingl
e-tu
rbin
e
Fig
ure
51.
Los
s of
eng
ine
pow
er y
earl
y ac
cide
nt s
tati
stic
s: s
ingl
e-tu
rbin
e he
licop
ters
(co
mm
erci
ally
man
ufac
ture
d).

154
181
11
7
17
3
262726
43
82
189
0
92
020
4060
8010
012
014
016
018
020
0
Und
eter
min
ed/O
ther
Oth
er S
ub-c
ateg
orie
s
Rot
or D
rive
Sys
tem
Oth
er E
ngin
e Sy
stem
s
F
uel i
mpr
oper
I
nduc
tion
air
sys
tem
C
arbu
reto
r he
at
F
uel c
ontr
ol
F
uel s
tarv
atio
n
F
uel c
onta
min
atio
n
F
uel s
yste
m
F
uel e
xhau
stio
n
Eng
ine
stru
ctur
e
NT
SB a
ccid
ent
coun
t
299
Fue
l / a
ir
mix
ture
rela
ted
acci
dent
s
Fig
ure
52.
Los
s of
eng
ine
pow
er a
ccid
ents
by
cate
gory
: si
ngle
-tur
bine
hel
icop
ters
(co
mm
erci
ally
man
ufac
ture
d).

155
3
16
33
26
53
71
15
215
58
162
52
050
100
150
200
250
Unk
now
n/N
ot r
epor
ted
Pub
lic/m
ilita
ry u
se
Exe
cuti
ve/c
orpo
rate
Flig
ht/m
aint
enan
ce t
est
Fer
ry/r
epos
itio
n
Bus
ines
s us
e
Inst
ruct
iona
l/tra
inin
g
Pas
seng
er s
ervi
ce
Per
sona
l use
Gen
eral
uti
lity
Aer
ial a
pplic
atio
n
NT
SB a
ccid
ent
coun
t
Fig
ure
53.
Los
s of
eng
ine
pow
er a
ccid
ents
by
acti
vity
: si
ngle
-tur
bine
hel
icop
ters
(co
mm
erci
ally
man
ufac
ture
d).

156
210
5
15
24
33
58
64
104
84
314
050
100
150
200
250
300
350
Stan
ding
/sta
tic
Unk
now
n
Tax
i
Oth
er
Clim
b
Des
cent
Lan
ding
Hov
er
App
roac
h
Tak
eoff
Man
euve
ring
Cru
ise
NT
SB a
ccid
ent
coun
t
Fig
ure
54.
Los
s of
eng
ine
pow
er a
ccid
ents
by
phas
e of
ope
rati
on:
sing
le-t
urbi
ne h
elic
opte
rs (
com
mer
cial
ly m
anuf
actu
red)
.

157
0510152025
1960
1965
1970
1975
1980
1985
1990
1995
2000
In f
light
colli
sion
wit
hob
ject
stat
isti
cs
End
of
year
Per
cent
age
ofto
tal s
ingl
e-tu
rbin
eac
cide
nts
Acc
iden
ts p
er 1
,000
regi
ster
ed s
ingl
e-tu
rbin
e
Fig
ure
55.
In f
light
col
lisio
n w
ith
obje
ct y
earl
y ac
cide
nt s
tati
stic
s: s
ingl
e-tu
rbin
e he
licop
ters
(co
mm
erci
ally
man
ufac
ture
d).

158
12
7
9
45
13
1
4
11
202019
50
24
108
020
4060
8010
012
0
Mis
cella
neou
s
Uns
peci
fied
obj
ect
Bir
d st
rike
Ele
ctro
nic
tow
er
Air
craf
t
Bui
ldin
g
FO
D
Cro
p
Veh
icle
Roc
k/br
ush/
terr
ain
Fen
ce/f
ence
pos
t
Air
port
/hel
ipad
fac
ility
Pol
e/pi
pe
Tre
e(s)
Wir
e/po
le
Wir
e
NT
SB a
ccid
ent
coun
t
Fig
ure
56.
In f
light
col
lisio
n w
ith
obje
ct a
ccid
ents
by
obje
ct h
it:
sing
le-t
urbi
ne h
elic
opte
rs (
com
mer
cial
ly m
anuf
actu
red)
.

159
1112
13
14
15
16
18
21
32
34
37
77
0 010
2030
4050
6070
8090
Inco
rrec
t In
form
atio
n
Insu
ff C
lear
ance
for
Tur
n
Inad
equa
te R
PM
/per
f
Equ
ipm
t sn
ag
Obs
tacl
e P
roxi
mit
y
End
of
Day
- F
atig
ue
Con
ceal
ed in
Ter
rain
Div
erte
d A
tten
tion
Win
d ca
uses
dri
ft
Fai
lure
to
See
& A
void
Deg
rade
d V
isib
ility
Und
eter
min
ed
Impr
oper
Dec
isio
n
NT
SB a
ccid
ent
coun
t
Fig
ure
57.
In f
light
col
lisio
n w
ith
obje
ct a
ccid
ents
by
caus
e: s
ingl
e-tu
rbin
e he
licop
ters
(co
mm
erci
ally
man
ufac
ture
d).

160
2
1
2
9
10
15
16
41
30
50
57
65
010
2030
4050
6070
Unk
now
n
Stan
ding
/sta
tic
Clim
b
Des
cent
Oth
er
Tax
i
App
roac
h
Hov
er
Lan
ding
Cru
ise
Tak
eoff
Man
euve
ring
NT
SB a
ccid
ent
coun
t
Fig
ure
58.
In f
light
col
lisio
n w
ith
obje
ct a
ccid
ents
by
phas
e of
ope
rati
on:
sin
gle-
turb
ine
helic
opte
rs (
com
mer
cial
ly m
anuf
actu
red)
.

161
11
13
17
12
4
33
26
71
83
37
010
2030
4050
6070
8090
Unk
now
n/N
ot r
epor
ted
Flig
ht/m
aint
enan
ce t
est
Pub
lic/m
ilita
ry u
se
Exe
cuti
ve/c
orpo
rate
Fer
ry/R
epos
itio
n
Inst
ruct
iona
l/tra
inin
g
Bus
ines
s us
e
Per
sona
l use
Pas
seng
er s
ervi
ce
Gen
eral
uti
lity
Aer
ial a
pplic
atio
n
NT
SB a
ccid
ent
coun
t
Fig
ure
59.
In f
light
col
lisio
n w
ith
obje
ct a
ccid
ents
by
acti
vity
: si
ngle
-tur
bine
hel
icop
ters
(co
mm
erci
ally
man
ufac
ture
d).

162
00
3
11
13
34
43
010
2030
4050
Cab
in
Mai
n ro
tor
mas
t
Tai
l boo
m
Ext
erna
l Loa
d
Lan
ding
gea
r
Mai
n ro
tor
blad
es
Tai
l rot
or
NT
SB a
ccid
ent
coun
t
Fig
ure
60.
In f
light
col
lisio
n w
ith
obje
ct a
ccid
ents
by
part
hit
: s
ingl
e-tu
rbin
e he
licop
ters
(co
mm
erci
ally
man
ufac
ture
d).

163
0510152025
1960
1965
1970
1975
1980
1985
1990
1995
2000
Los
sof
cont
rol
stat
isti
cs
End
of
year
Per
cent
age
ofto
tal s
ingl
e-tu
rbin
eac
cide
nts
Acc
iden
ts p
er 1
,000
regi
ster
ed s
ingl
e-tu
rbin
e
Fig
ure
61.
Los
s of
con
trol
yea
rly
acci
dent
sta
tist
ics:
sin
gle-
turb
ine
helic
opte
rs (
com
mer
cial
ly m
anuf
actu
red)
.

164
8
139
11
38
13
75
0
0
0
0 0
2040
6080
100
120
140
160
Not
Rep
orte
d B
ut L
ow R
otor
RP
MNot
Rep
orte
d
Pit
ch &
Low
Rot
or R
PM
Pit
ch
Rol
l & L
ow R
otor
RP
M
Rol
l
Ver
tica
l & L
ow R
otor
RP
M
Ver
tica
l
Yaw
& L
ow R
otor
RP
M
Yaw
NT
SB a
ccid
ent
coun
t
Fig
ure
62.
Los
s of
con
trol
acc
iden
ts b
y ax
is lo
st:
sing
le-t
urbi
ne h
elic
opte
rs (
com
mer
cial
ly m
anuf
actu
red)
.

165
22
5
7
6
36
1414
30
32
28
82
8
010
2030
4050
6070
8090
Mis
cella
neou
s
Inad
equa
te p
refl
ight
pla
nnin
g
Air
fram
e/co
mp.
/sys
. fai
l. or
mal
f.
Unq
ualif
ied
oper
ator
Los
s of
vis
ual r
ef./s
pati
al d
isor
ient
.
Wei
ght/
CG
Flig
ht c
ontr
ol f
ailu
re/d
efic
ienc
y
Att
ache
d/sn
agge
d to
grd
. equ
ip.
Und
eter
min
ed
Win
ds
Low
rot
or R
PM
Impr
oper
ope
rati
on o
f co
ntro
ls
NT
SB a
ccid
ent
coun
t
Fig
ure
63.
Los
s of
con
trol
acc
iden
ts b
y ca
use:
sin
gle-
turb
ine
helic
opte
rs (
com
mer
cial
ly m
anuf
actu
red)
.

166
2
5
2
44
9
20
34
30
39
61
74
010
2030
4050
6070
80
Oth
er
Stan
ding
/sta
tic
Clim
b
Des
cent
Tax
i
Unk
now
n
App
roac
h
Cru
ise
Lan
ding
Man
euve
ring
Hov
er
Tak
eoff
NT
SB a
ccid
ent
coun
t
Fig
ure
64.
Los
s of
con
trol
acc
iden
ts b
y ph
ase
of o
pera
tion
: si
ngle
-tur
bine
hel
icop
ters
(co
mm
erci
ally
man
ufac
ture
d).

167
9
19
11
8
30
74
13
79
11
30
0 010
2030
4050
6070
8090
Unk
now
n/N
ot r
epor
ted
Exe
cuti
ve/c
orpo
rate
Pub
lic/m
ilita
ry u
se
Fer
ry/R
epos
itio
n
Flig
ht/m
aint
enan
ce t
est
Bus
ines
s us
e
Pas
seng
er s
ervi
ce
Aer
ial a
pplic
atio
n
Gen
eral
uti
lity
Inst
ruct
iona
l/tra
inin
g
Per
sona
l use
NT
SB a
ccid
ent
coun
t
Fig
ure
65.
Los
s of
con
trol
acc
iden
ts b
y ac
tivi
ty:
sing
le-t
urbi
ne h
elic
opte
rs (
com
mer
cial
ly m
anuf
actu
red)
.

168
3
1113
34
43
104
194
298
00 050
100
150
200
250
300
350
Mili
tary
Onl
y
Oth
er/U
nkno
wn/
Not
Rep
orte
d
No
Rat
ing
Spec
ifie
d-C
FI
Non
e
AT
P-C
FI
Air
line
Tra
nspo
rt P
ilot
Stud
ent
Pri
vate
Com
mer
cial
-CF
I
Com
mer
cial
NT
SB a
ccid
ent
coun
t
Fig
ure
66.
Los
s of
con
trol
acc
iden
ts b
y pi
lot-
in-c
omm
and
cert
ific
atio
n: s
ingl
e-tu
rbin
e he
licop
ters
(co
mm
erci
ally
man
ufac
ture
d).

169
02468101214161820
1960
1965
1970
1975
1980
1985
1990
1995
2000
End
of
year
Per
cent
age
ofto
tal s
ingl
e-tu
rbin
eac
cide
nts
Acc
iden
ts p
er 1
,000
regi
ster
ed s
ingl
e-tu
rbin
e
Air
fram
e/co
mpo
nent
/sy
stem
failu
reor
mal
func
tion
stat
isti
cs
Fig
ure
67.
Air
fram
e fa
ilure
yea
rly
acci
dent
sta
tist
ics:
sin
gle-
turb
ine
helic
opte
rs (
com
mer
cial
ly m
anuf
actu
red)
.

170
0
6
1
7
6
16
1414
47
36
28
107
020
4060
8010
012
0
Unk
now
n
Oth
er
Tax
i
Des
cent
Stan
ding
/sta
tic
Clim
b
App
roac
h
Lan
ding
Hov
er
Tak
eoff
Man
euve
ring
Cru
ise
NT
SB a
ccid
ent
coun
t
Fig
ure
68.
Air
fram
e fa
ilure
acc
iden
ts b
y ph
ase
of o
pera
tion
: si
ngle
-tur
bine
hel
icop
ters
(co
mm
erci
ally
man
ufac
ture
d).

171
2
10
6
10
17
25
8
16
73
25
90
010
2030
4050
6070
8090
100
Unk
now
n/N
ot r
epor
ted
Pub
lic/m
ilita
ry u
se
Flig
ht/m
aint
enan
ce t
est
Exe
cuti
ve/c
orpo
rate
Fer
ry/R
epos
itio
n
Bus
ines
s us
e
Inst
ruct
iona
l/tra
inin
g
Per
sona
l use
Pas
seng
er s
ervi
ce
Aer
ial a
pplic
atio
n
Gen
eral
uti
lity
NT
SB a
ccid
ent
coun
t
Fig
ure
69.
Air
fram
e fa
ilure
acc
iden
ts b
y ac
tivi
ty:
sing
le-t
urbi
ne h
elic
opte
rs (
com
mer
cial
ly m
anuf
actu
red)
.

172
5
3
2
41
11
29
52
36
54
49
010
2030
4050
60
Und
eter
min
ed/O
ther
Eng
ine
Lan
ding
gea
r
Air
fram
e
Con
trol
sys
tem
-Tai
l
Con
trol
sys
tem
-Mai
n
Tai
l rot
or
Mai
n ro
tor
Dri
ve t
rain
-Tai
l
Dri
ve t
rain
-Mai
n
NT
SB a
ccid
ent
coun
t
Fig
ure
70.
Air
fram
e fa
ilure
acc
iden
ts b
y sy
stem
: si
ngle
-tur
bine
hel
icop
ters
(co
mm
erci
ally
man
ufac
ture
d).

173
0
500
1,00
0
1,50
0
2,00
0
2,50
0
03
69
1215
1821
70
4
Los
s of
eng
ine
pow
er
298
In
flig
ht c
ollis
ion
wit
h ob
ject
28
4
Los
s of
con
trol
28
2
Air
fram
e/co
mpo
nent
/sys
tem
fai
lure
/mal
func
tion
14
3
In f
light
col
lisio
n w
ith
terr
ain/
wat
er
140
H
ard
land
ing
11
9
Rol
love
r/no
se-o
ver
8
5
Wea
ther
2,05
5
Acc
iden
ts f
rom
fir
st 8
cat
egor
ies
19
2
Acc
iden
ts f
rom
oth
er 1
3 ca
tego
ries
2,
247
T
otal
8 C
ateg
orie
s ac
coun
t fo
r 92
% o
f ac
cide
nts
4 C
ateg
orie
s ac
coun
t fo
r 70
% o
f ac
cide
nts
NT
SB m
ajor
cat
egor
ies
Sing
le-
turb
ine
helic
opte
rac
cide
ntco
unt
Fig
ure
71.
Sum
mar
y ac
cide
nt s
tati
stic
s, m
id-1
963
thro
ugh
1997
: si
ngle
-tur
bine
hel
icop
ters
(co
mm
erci
ally
man
ufac
ture
d).

174
2
11
18
21
3334
47
50
5556
73
88
126
178
000 0 020
4060
8010
012
014
016
018
020
0
On
grou
nd/w
ater
enc
ount
er w
ith
terr
ain/
wat
er
On
grou
nd/w
ater
col
lisio
n w
ith
obje
ct
Gea
r co
llaps
ed
Dra
gged
win
g, r
otor
, pod
, flo
at o
r ta
il/sk
id
Har
d la
ndin
g
Rol
love
r/no
seov
er
Los
s of
eng
ine
pow
er
Mis
cella
neou
s/ot
her
Fir
e/ex
plos
ion
Pro
pelle
r/ro
tor
cont
act
to p
erso
n
In f
light
col
lisio
n w
ith
obje
ct
Und
ersh
oot/
over
shoo
t
Los
s of
con
trol
Air
fram
e/co
mpo
nent
/sys
tem
fai
lure
/mal
func
tion
In f
light
col
lisio
n w
ith
terr
ain/
wat
er
Abr
upt
man
euve
r
Wea
ther
Mid
air
colli
sion
Fat
alit
ies
per
100
acci
dent
s
Fig
ure
72.
Fat
alit
ies
per
100
acci
dent
s, m
id-1
963
thro
ugh
1997
: si
ngle
-tur
bine
hel
icop
ters
(co
mm
erci
ally
man
ufac
ture
d).
Fat
alit
ies
Fir
st-e
vent
cat
egor
y 1
57
Air
fram
e/co
mpo
nent
/sys
tem
fai
lure
/mal
func
tion
155
L
oss
of c
ontr
ol 1
40
In f
light
col
lisio
n w
ith
obje
ct 1
29
Los
s of
eng
ine
pow
er 1
07
Wea
ther
104
In
flig
ht c
ollis
ion
wit
h te
rrai
n/w
ater
6
6
M
idai
r co
llisi
on
93
Und
eter
min
ed/m
isce
llane
ous/
othe
r 9
51
Tot
al

175
0
200
400
600
800
1,00
0
1,20
0
1,40
0 1955
1960
1965
1970
1975
1980
1985
1990
1995
2000
Reg
iste
red
twin
-tu
rbin
ehe
licop
ters
End
of
year
FA
A d
ata,
(edi
ted
by H
arri
s)
Rot
or R
oste
r da
ta,
from
Air
Tra
ck
Fig
ure
73.
Tw
in-t
urbi
ne h
elic
opte
r fl
eet
size
(co
mm
erci
ally
man
ufac
ture
d).

176
0102030405060708090100 19
6019
6519
7019
7519
8019
8519
9019
9520
00
Acc
iden
tspe
r1,
000
regi
ster
edro
torc
raft
End
of
yearTw
in-
turb
ine
Sing
le-
turb
ine
(Fig
. 46)
Fig
ure
74.
Acc
iden
ts p
er 1
,000
reg
iste
red
airc
raft
: tw
in-t
urbi
ne h
elic
opte
rs (
com
mer
cial
ly m
anuf
actu
red)
.

177
39
43
40
89
8
16
4
12
9 8
1
6
10
5
2
6
1 1 2
0
0 0
1020
3040
5060
7080
9010
0
Los
s of
eng
ine
pow
er
In f
light
col
lisio
n w
ith
obje
ct
Los
s of
con
trol
Air
fram
e/co
mpo
nent
/sys
tem
fai
lure
/mal
func
tion
Har
d la
ndin
g
In f
light
col
lisio
n w
ith
terr
ain/
wat
er
Rol
love
r/no
seov
er
Wea
ther
Mis
cella
neou
s/ot
her
Pro
pelle
r/ro
tor
cont
act
to p
erso
n
Stal
l/set
tlin
g w
ith
pow
er
Mid
air
colli
sion
On
grou
nd/w
ater
col
lisio
n w
ith
obje
ct
Fir
e/ex
plos
ion
Abr
upt
man
euve
r
Gea
r co
llaps
ed
Und
ersh
oot/
over
shoo
t
Dra
gged
win
g, r
otor
, pod
, flo
at o
r ta
il/sk
id
Und
eter
min
ed
On
grou
nd/w
ater
enc
ount
er w
ith
terr
ain/
wat
er
Mis
sing
NT
SB a
ccid
ent
coun
t
Fig
ure
75.
Acc
iden
t co
unt
by f
irst
eve
nt c
ateg
ory:
tw
in-t
urbi
ne h
elic
opte
rs (
com
mer
cial
ly m
anuf
actu
red)
.Tot
al o
f 30
2 ac
cide
nts
from
mid
-196
3 th
roug
h 19
97

178
3.8
1.9
1.6
0.1
1.6
0.8
0.7
0.4
0.1 0.
2
0.1
0.6
0.5
4.0
3.0
2.6
0.3
2.0
3.3
1.7
0.7
2.0
0.3
0.3
0.7
0.0
0.0
0.5
1.0
1.5
2.0
2.5
3.0
3.5
4.0
4.5
Wea
ther
Mis
cella
neou
s/ot
her
Pro
pelle
r/ro
tor
cont
act
to p
erso
n
Stal
l/set
tlin
g w
ith
pow
er
Mid
air
colli
sion
On
grou
nd/w
ater
col
lisio
n w
ith
obje
ct
Fir
e/ex
plos
ion
Abr
upt
man
euve
r
Gea
r co
llaps
ed
Und
ersh
oot/
over
shoo
t
Dra
gged
win
g, r
otor
, pod
, flo
at o
r ta
il/sk
id
Und
eter
min
ed
On
grou
nd/w
ater
enc
ount
er w
ith
terr
ain/
wat
er
Sing
le T
urbi
ne H
elic
opte
r (2
,247
Tot
al A
ccid
ents
)T
win
Tur
bine
Hel
icop
ter
(302
Tot
al A
ccid
ents
)
Per
cent
of
tota
ls b
y N
TSB
fir
st e
vent
cat
egor
y
Fig
ure
76.
Oth
er f
irst
eve
nt c
ateg
orie
s: t
win
-tur
bine
vs.
sin
gle-
turb
ine
helic
opte
rs (
com
mer
cial
ly m
anuf
actu
red)
.
Tw
in-t
urbi
ne h
elic
opte
r (3
02 t
otal
acc
iden
ts)
Sing
le-t
urbi
ne h
elic
opte
r (2
,247
tot
al a
ccid
ents
)

179
024681012141618
1960
1965
1970
1975
1980
1985
1990
1995
2000
Tw
in-
turb
ine
helic
opte
rac
cide
ntco
unt
End
of
year
Sum
of
firs
t fo
ur c
ateg
orie
sa.
Los
s of
eng
ine
pow
erb.
In
flig
ht c
ollis
ion
wit
h ob
ject
c. L
oss
of c
ontr
old.
Air
fram
e/co
mpo
nent
/sys
tem
fai
lure
/mal
func
tion
Sum
of
all 1
7ot
her
cate
gori
es
Fig
ure
77.
Acc
iden
ts b
y fi
rst
even
t ca
tego
ries
: tw
in-t
urbi
ne h
elic
opte
rs (
com
mer
cial
ly m
anuf
actu
red)
.

180
05101520
1980
1985
1990
1995
2000
2005
2010
Acc
iden
tspe
r1,
000
regi
ster
edro
torc
raft
End
of
year
Fig
ure
78.
Acc
iden
ts p
er 1
,000
reg
iste
red
airc
raft
pro
ject
ed t
o 20
10:
twin
-tur
bine
hel
icop
ters
(co
mm
erci
ally
man
ufac
ture
d).
1986
thr
ough
199
7ac
cide
nt e
xper
ienc
e tr
end-
line
extr
apol
ated
to
2010
(exp
onen
tial
)

181
05101520253035404550
1960
1965
1970
1975
1980
1985
1990
1995
2000
Los
s of
engi
nepo
wer
stat
isti
cs
End
of
year
Per
cent
age
of
tota
l tw
in-
turb
ine
Acc
iden
ts p
er 1
,000
regi
ster
ed t
win
-tur
bine
Fig
ure
79.
Los
s of
eng
ine
pow
er y
earl
y ac
cide
nt s
tati
stic
s: t
win
-tur
bine
hel
icop
ters
(co
mm
erci
ally
man
ufac
ture
d).

182
6
1
4
3
5
11
15
0 0 0
3
0
02
46
810
1214
16
Und
eter
min
ed/O
ther
Oth
er S
ub-c
ateg
orie
s
Rot
or D
rive
Sys
tem
Oth
er E
ngin
e Sy
stem
s
F
uel i
mpr
oper
I
nduc
tion
air
sys
tem
C
arbu
reto
r he
at
F
uel c
ontr
ol
F
uel s
tarv
atio
n
F
uel c
onta
min
atio
n
F
uel s
yste
m
F
uel e
xhau
stio
n
Eng
ine
stru
ctur
e
NT
SB a
ccid
ent
coun
t
17F
uel /
Air
m
ixtu
rere
late
dac
cide
nts
Fig
ure
80.
Los
s of
eng
ine
pow
er a
ccid
ents
by
cate
gory
: tw
in-t
urbi
ne h
elic
opte
rs (
com
mer
cial
ly m
anuf
actu
red)
.

183
33
5
4
11
1
11
1
000 02
46
810
12
Unk
now
n/N
ot r
epor
ted
Pub
lic/m
ilita
ry u
se
Exe
cuti
ve/c
orpo
rate
Flig
ht/m
aint
enan
ce t
est
Fer
ry/r
epos
itio
n
Bus
ines
s us
e
Inst
ruct
iona
l/tra
inin
g
Pas
seng
er s
ervi
ce
Per
sona
l use
Gen
eral
uti
lity
Aer
ial a
pplic
atio
n
NT
SB a
ccid
ent
coun
t
Fig
ure
81.
Los
s of
eng
ine
pow
er a
ccid
ents
by
acti
vity
: tw
in-t
urbi
ne h
elic
opte
rs (
com
mer
cial
ly m
anuf
actu
red)
.

184
000
222
8
2
8
2
13
0 02
46
810
1214
Stan
ding
/sta
tic
Unk
now
n
Tax
i
Oth
er
Clim
b
Des
cent
Lan
ding
Hov
er
App
roac
h
Tak
eoff
Man
euve
ring
Cru
ise
NT
SB a
ccid
ent
coun
t
Fig
ure
82.
Los
s of
eng
ine
pow
er a
ccid
ents
by
phas
e of
ope
rati
on:
twin
-tur
bine
hel
icop
ters
(co
mm
erci
ally
man
ufac
ture
d).

185
0510152025
1960
1965
1970
1975
1980
1985
1990
1995
2000
In f
light
colli
sion
wit
hob
ject
stat
isti
cs
End
of
year
Per
cent
age
ofto
tal t
win
-tur
bine
acci
dent
s
Acc
iden
ts p
er 1
,000
regi
ster
ed t
win
-tur
bine
Fig
ure
83.
In f
light
col
lisio
n w
ith
obje
ct y
earl
y ac
cide
nt s
tati
stic
s: t
win
-tur
bine
hel
icop
ters
(co
mm
erci
ally
man
ufac
ture
d).

186
22
111
2
12
2
7
13
000000 02
46
810
1214
Mis
cella
neou
s
Uns
peci
fied
obj
ect
Bir
d st
rike
Ele
ctro
nic
tow
er
Air
craf
t
Bui
ldin
g
FO
D
Cro
p
Veh
icle
Roc
k/br
ush/
terr
ain
Fen
ce/f
ence
pos
t
Air
port
/hel
ipad
fac
ility
Pol
e/pi
pe
Tre
e(s)
Wir
e/po
le
Wir
e
NT
SB a
ccid
ent
coun
t
Fig
ure
84.
In f
light
col
lisio
n w
ith
obje
ct a
ccid
ents
by
obje
ct h
it:
twin
-tur
bine
hel
icop
ters
(co
mm
erci
ally
man
ufac
ture
d).

187
0.5
0.5
111
22
2.5
2.5
3.5
3.5
5
8
01
23
45
67
89
Con
ceal
ed in
Ter
rain
Inad
equa
te R
PM
/per
f
Div
erte
d A
tten
tion
End
of
Day
- F
atig
ue
Equ
ipm
t sn
ag
Fai
lure
to
See
& A
void
Und
eter
min
ed
Obs
tacl
e P
roxi
mit
y
Insu
ff C
lear
ance
for
Tur
n
Inco
rrec
t In
form
atio
n
Win
d ca
uses
dri
ft
Deg
rade
d V
isib
ility
Impr
oper
Dec
isio
n
NT
SB a
ccid
ent
coun
t
Fig
ure
85.
In f
light
col
lisio
n w
ith
obje
ct a
ccid
ents
by
caus
e: t
win
-tur
bine
hel
icop
ters
(co
mm
erci
ally
man
ufac
ture
d).

188
1
4
3
7
1
2
19
5
1
0
0 0
24
68
1012
1416
1820
Unk
now
n/N
ot r
epor
ted
Flig
ht/m
aint
enan
ce t
est
Pub
lic/m
ilita
ry u
se
Exe
cuti
ve/c
orpo
rate
Fer
ry/R
epos
itio
n
Inst
ruct
iona
l/tra
inin
g
Bus
ines
s us
e
Per
sona
l use
Pas
seng
er s
ervi
ce
Gen
eral
uti
lity
Aer
ial a
pplic
atio
n
NT
SB a
ccid
ent
coun
t
Fig
ure
86.
In f
light
col
lisio
n w
ith
obje
ct a
ccid
ents
by
acti
vity
: tw
in-t
urbi
ne h
elic
opte
rs (
com
mer
cial
ly m
anuf
actu
red)
.

189
00000
5
1
6
10
4
11
6
02
46
810
12
Unk
now
n
Stan
ding
/sta
tic
Clim
b
Des
cent
Oth
er
Tax
i
App
roac
h
Hov
er
Lan
ding
Cru
ise
Tak
eoff
Man
euve
ring
NT
SB a
ccid
ent
coun
t
Fig
ure
87.
In f
light
col
lisio
n w
ith
obje
ct a
ccid
ents
by
phas
e of
ope
rati
on:
twin
-tur
bine
hel
icop
ters
(co
mm
erci
ally
man
ufac
ture
d).

190
00000
4
10
02
46
810
12
Cab
in
Mai
n ro
tor
mas
t
Tai
l boo
m
Ext
erna
l Loa
d
Lan
ding
gea
r
Mai
n ro
tor
blad
es
Tai
l rot
or
NT
SB a
ccid
ent
coun
t
Fig
ure
88.
In f
light
col
lisio
n w
ith
obje
ct a
ccid
ents
by
part
hit
: tw
in-t
urbi
ne h
elic
opte
rs (
com
mer
cial
ly m
anuf
actu
red)
.

191
0510152025
1960
1965
1970
1975
1980
1985
1990
1995
2000
Los
sof
cont
rol
stat
isti
cs
End
of
year
Per
cent
age
ofto
tal t
win
-tur
bine
acci
dent
s
Acc
iden
ts p
er 1
,000
regi
ster
ed t
win
-tur
bine
Fig
ure
89.
Los
s of
con
trol
yea
rly
acci
dent
sta
tist
ics:
tw
in-t
urbi
ne h
elic
opte
rs (
com
mer
cial
ly m
anuf
actu
red)
.

192
20
3
5
1
4
7
0
0
0
0 0
510
1520
25
Not
Rep
orte
d B
ut L
ow R
otor
RP
MNot
Rep
orte
d
Pit
ch &
Low
Rot
or R
PM
Pit
ch
Rol
l & L
ow R
otor
RP
M
Rol
l
Ver
tica
l & L
ow R
otor
RP
M
Ver
tica
l
Yaw
& L
ow R
otor
RP
M
Yaw
NT
SB a
ccid
ent
coun
t
Fig
ure
90.
Los
s of
con
trol
acc
iden
ts b
y ax
is lo
st:
twin
-tur
bine
hel
icop
ters
(co
mm
erci
ally
man
ufac
ture
d).

193
5
0
1
0
7
0
6
3
4
5
8
1
01
23
45
67
89
Mis
cella
neou
s
Inad
equa
te p
refl
ight
pla
nnin
g
Air
fram
e/co
mp.
/sys
. fai
l. or
mal
f.
Unq
ualif
ied
oper
ator
Los
s of
vis
ual r
ef./s
pati
al d
isor
ient
.
Wei
ght/
CG
Flig
ht c
ontr
ol f
ailu
re/d
efic
ienc
y
Att
ache
d/sn
agge
d to
grd
. equ
ip.
Und
eter
min
ed
Win
ds
Low
rot
or R
PM
Impr
oper
ope
rati
on o
f co
ntro
ls
NT
SB a
ccid
ent
coun
t
Fig
ure
91.
Los
s of
con
trol
acc
iden
ts b
y ca
use:
tw
in-t
urbi
ne h
elic
opte
rs (
com
mer
cial
ly m
anuf
actu
red)
.

194
0
3
00
11
8
6
2
8
5
6
01
23
45
67
89
Oth
er
Stan
ding
/sta
tic
Clim
b
Des
cent
Tax
i
Unk
now
n
App
roac
h
Cru
ise
Lan
ding
Man
euve
ring
Hov
er
Tak
eoff
NT
SB a
ccid
ent
coun
t
Fig
ure
92.
Los
s of
con
trol
acc
iden
ts b
y ph
ase
of o
pera
tion
: tw
in-t
urbi
ne h
elic
opte
rs (
com
mer
cial
ly m
anuf
actu
red)
.
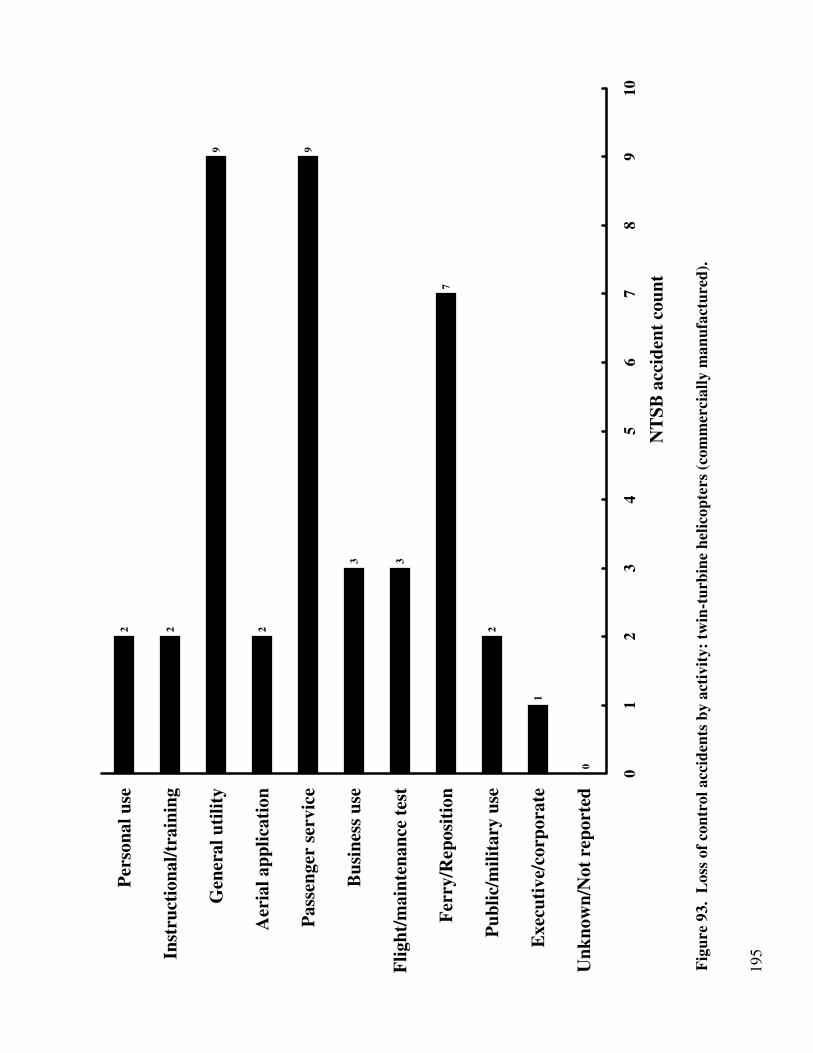
195
1
2
7
33
9
2
9
22
0 01
23
45
67
89
10
Unk
now
n/N
ot r
epor
ted
Exe
cuti
ve/c
orpo
rate
Pub
lic/m
ilita
ry u
se
Fer
ry/R
epos
itio
n
Flig
ht/m
aint
enan
ce t
est
Bus
ines
s us
e
Pas
seng
er s
ervi
ce
Aer
ial a
pplic
atio
n
Gen
eral
uti
lity
Inst
ruct
iona
l/tra
inin
g
Per
sona
l use
NT
SB a
ccid
ent
coun
t
Fig
ure
93.
Los
s of
con
trol
acc
iden
ts b
y ac
tivi
ty:
twin
-tur
bine
hel
icop
ters
(co
mm
erci
ally
man
ufac
ture
d).

196
010203040506070
1960
1965
1970
1975
1980
1985
1990
1995
2000
End
of
year
Per
cent
age
ofto
tal t
win
-tur
bine
acci
dent
s
Acc
iden
ts p
er 1
,000
regi
ster
ed t
win
-tur
bine
Air
fram
e/co
mpo
nent
/sy
stem
failu
reor
mal
func
tion
stat
isti
cs
Fig
ure
94.
Air
fram
e fa
ilure
yea
rly
acci
dent
sta
tist
ics:
tw
in-t
urbi
ne h
elic
opte
rs (
com
mer
cial
ly m
anuf
actu
red)
.

197
1
0
1
2
3
9
5
4
6
9
3
46
05
1015
2025
3035
4045
50
Unk
now
n
Oth
er
Tax
i
Des
cent
Stan
ding
/sta
tic
Clim
b
App
roac
h
Lan
ding
Hov
er
Tak
eoff
Man
euve
ring
Cru
ise
NT
SB a
ccid
ent
coun
t
Fig
ure
95.
Air
fram
e fa
ilure
acc
iden
ts b
y ph
ase
of o
pera
tion
: tw
in-t
urbi
ne h
elic
opte
rs (
com
mer
cial
ly m
anuf
actu
red)
.

198
11
7
1313
6
1
34
13
0
0 05
1015
2025
3035
40
Unk
now
n/N
ot r
epor
ted
Pub
lic/m
ilita
ry u
se
Flig
ht/m
aint
enan
ce t
est
Exe
cuti
ve/c
orpo
rate
Fer
ry/R
epos
itio
n
Bus
ines
s us
e
Inst
ruct
iona
l/tra
inin
g
Per
sona
l use
Pas
seng
er s
ervi
ce
Aer
ial a
pplic
atio
n
Gen
eral
uti
lity
NT
SB a
ccid
ent
coun
t
Fig
ure
96.
Air
fram
e fa
ilure
acc
iden
ts b
y ac
tivi
ty:
twin
-tur
bine
hel
icop
ters
(co
mm
erci
ally
man
ufac
ture
d).

199
2
8
7
11
10
1919
13
0
0 0
24
68
1012
1416
1820
Und
eter
min
ed/O
ther
Eng
ine
Lan
ding
gea
r
Air
fram
e
Con
trol
sys
tem
-Tai
l
Con
trol
sys
tem
-Mai
n
Tai
l rot
or
Mai
n ro
tor
Dri
ve t
rain
-Tai
l
Dri
ve t
rain
-Mai
n
NT
SB a
ccid
ent
coun
t
Fig
ure
97.
Air
fram
e fa
ilure
acc
iden
ts b
y sy
stem
: tw
in-t
urbi
ne h
elic
opte
rs (
com
mer
cial
ly m
anuf
actu
red)
.

200
050100
150
200
250
300
350
03
69
1215
1821
89
Air
fram
e/co
mpo
nent
/sys
tem
fai
lure
/mal
func
tion
43
In
flig
ht c
ollis
ion
wit
h ob
ject
40
Los
s of
con
trol
39
Los
s of
eng
ine
pow
er
16
I
n fl
ight
col
lisio
n w
ith
terr
ain/
wat
er
12
W
eath
er
10
On
grou
nd/w
ater
col
lisio
n w
ith
obje
ct
9
M
isce
llane
ous/
othe
r
8
H
ard
land
ing
8
Pro
pelle
r/ro
tor
cont
act
to p
erso
n
274
A
ccid
ents
fro
m f
irst
10
cate
gori
es
28
A
ccid
ents
fro
m o
ther
11
cate
gori
es
302
T
otal
10 C
ateg
orie
s ac
coun
t fo
r 91
% o
f ac
cide
nts
4 C
ateg
orie
s ac
coun
t fo
r 70
% o
f ac
cide
nts
NT
SB m
ajor
cat
egor
ies
Tw
in-
turb
ine
helic
opte
rac
cide
ntco
unt
Fig
ure
98.
Sum
mar
y ac
cide
nt s
tati
stic
s, m
id-1
963
thro
ugh
1997
: tw
in-t
urbi
ne h
elic
opte
rs (
com
mer
cial
ly m
anuf
actu
red)
.

201
38
41
50
6767
81
95
100
113
133
166
180
217
0
0
0
0
0 0
5010
015
020
025
0
Har
d la
ndin
g
Fir
e/ex
plos
ion
Rol
love
r/no
seov
er
Stal
l/set
tlin
g w
ith
pow
er
Dra
gged
win
g, r
otor
, pod
, flo
at o
r ta
il/sk
id
Pro
pelle
r/ro
tor
cont
act
to p
erso
n
Los
s of
eng
ine
pow
er
Und
eter
min
ed
Mis
cella
neou
s/ot
her
Gea
r co
llaps
ed
In f
light
col
lisio
n w
ith
obje
ct
Los
s of
con
trol
Abr
upt
man
euve
r
In f
light
col
lisio
n w
ith
terr
ain/
wat
er
Wea
ther
Air
fram
e/co
mpo
nent
/sys
tem
fai
lure
/mal
func
tion
On
grou
nd/w
ater
col
lisio
n w
ith
obje
ct
Mid
air
colli
sion
Fat
alit
ies
per
100
acci
dent
s
Fig
ure
99.
Fat
alit
ies
per
100
acci
dent
s, m
id-1
963
thro
ugh
1997
: tw
in-t
urbi
ne h
elic
opte
rs (
com
mer
cial
ly m
anuf
actu
red)
.
Fat
alit
ies
Fir
st-e
vent
cat
egor
y 1
48
A
irfr
ame/
com
pone
nt/s
yste
m f
ailu
re/m
alfu
ncti
on
38
Los
s of
con
trol
3
5
I
n fl
ight
col
lisio
n w
ith
obje
ct
18
In
flig
ht c
ollis
ion
wit
h te
rrai
n/w
ater
1
8
O
n gr
ound
col
lisio
n w
ith
obje
ct
1
6
L
oss
of e
ngin
e po
wer
1
6
W
eath
er
13
Mid
air
colli
sion
1
9
U
ndet
erm
ined
/mis
cella
neou
s/ot
her
951
T
otal

202
0
500
1,00
0
1,50
0
2,00
0
2,50
0
3,00
0 1955
1960
1965
1970
1975
1980
1985
1990
1995
2000
Reg
iste
red
amat
eur
helic
opte
rsan
dau
togy
ros
End
of
year
Tot
alam
ateu
r(e
dite
d by
Har
ris)
Am
ateu
rhe
licop
ters
(edi
ted
by H
arri
s)
Fig
ure
100.
All
othe
r ro
torc
raft
typ
es f
leet
siz
e.

203
010203040
1960
1965
1970
1975
1980
1985
1990
1995
2000
Acc
iden
tspe
r1,
000
regi
ster
ed
roto
rcra
ft
End
of
year
Fig
ure
101.
Acc
iden
ts p
er 1
,000
reg
iste
red
airc
raft
: al
l oth
er r
otor
craf
t ty
pes.

204
111
28
165
73
25
40
20
5
9
3
13
1 2 2
10
2 3
1 1 2
0 020
4060
8010
012
014
016
018
0
Los
s of
eng
ine
pow
er
In f
light
col
lisio
n w
ith
obje
ct
Los
s of
con
trol
Air
fram
e/co
mpo
nent
/sys
tem
fai
lure
/mal
func
tion
Har
d la
ndin
g
In f
light
col
lisio
n w
ith
terr
ain/
wat
er
Rol
love
r/no
seov
er
Wea
ther
Mis
cella
neou
s/ot
her
Pro
pelle
r/ro
tor
cont
act
to p
erso
n
Stal
l/set
tlin
g w
ith
pow
er
Mid
air
colli
sion
On
grou
nd/w
ater
col
lisio
n w
ith
obje
ct
Fir
e/ex
plos
ion
Abr
upt
man
euve
r
Gea
r co
llaps
ed
Und
ersh
oot/
over
shoo
t
Dra
gged
win
g, r
otor
, pod
, flo
at o
r ta
il/sk
id
Und
eter
min
ed
On
grou
nd/w
ater
enc
ount
er w
ith
terr
ain/
wat
er
Mis
sing
NT
SB a
ccid
ent
coun
t
Fig
ure
102.
Acc
iden
t co
unt
by f
irst
eve
nt c
ateg
ory:
all
othe
r ro
torc
raft
typ
es.
Tot
al o
f 51
6 ac
cide
nts
from
mid
-196
3 th
roug
h 19
97

205
25
2
16
1
6
7
44
8
28
0 0
10
05
1015
2025
30
Und
eter
min
ed/O
ther
Oth
er S
ub-c
ateg
orie
s
Rot
or D
rive
Sys
tem
Oth
er E
ngin
e Sy
stem
s
F
uel i
mpr
oper
I
nduc
tion
air
sys
tem
C
arbu
reto
r he
at
F
uel c
ontr
ol
F
uel s
tarv
atio
n
F
uel c
onta
min
atio
n
F
uel s
yste
m
F
uel e
xhau
stio
n
Eng
ine
stru
ctur
e
NT
SB a
ccid
ent
coun
t
40F
uel /
air
m
ixtu
rere
late
dac
cide
nts
Fig
ure
103.
Los
s of
eng
ine
pow
er a
ccid
ents
: al
l oth
er r
otor
craf
t ty
pes.

206
111
2
11
6
5
10
0 00000 0 02
46
810
12
Bir
d st
rike
Ele
ctro
nic
tow
er
Mis
cella
neou
s
Uns
peci
fied
obj
ect
Air
craf
t
FO
D
Fen
ce/f
ence
pos
t
Bui
ldin
g
Roc
k/br
ush/
terr
ain
Air
port
/hel
ipad
fac
ility
Cro
p
Veh
icle
Pol
e/pi
pe
Tre
e(s)
Wir
e/po
le
Wir
e
NT
SB a
ccid
ent
coun
t
Fig
ure
104.
In
flig
ht c
ollis
ion
wit
h ob
ject
acc
iden
ts:
all o
ther
rot
orcr
aft
type
s.

207
5
1
6
29
0
2
11
0
20
8
70
13
010
2030
4050
6070
80
Mis
cella
neou
s
Inad
equa
te p
refl
ight
pla
nnin
g
Air
fram
e/co
mp.
/sys
. fai
l. or
mal
f.
Unq
ualif
ied
oper
ator
Los
s of
vis
ual r
ef./s
pati
al d
isor
ient
.
Wei
ght/
CG
Flig
ht c
ontr
ol f
ailu
re/d
efic
ienc
y
Att
ache
d/sn
agge
d to
grd
. equ
ip.
Und
eter
min
ed
Win
ds
Low
rot
or R
PM
Impr
oper
ope
rati
on o
f co
ntro
ls
NT
SB a
ccid
ent
coun
t
Fig
ure
105.
Los
s of
con
trol
acc
iden
ts:
all o
ther
rot
orcr
aft
type
s.

208
19
3
7
2
18
11
6
7
0 02
46
810
1214
1618
20
Oth
er
Lan
ding
gea
r
Air
fram
e
Tai
l rot
or
Mai
n ro
tor
Con
trol
sys
tem
-Tai
l
Con
trol
sys
tem
-Mai
n
Dri
ve t
rain
-Tai
l
Dri
ve t
rain
-Mai
n
NT
SB a
ccid
ent
coun
t
Fig
ure
106.
Air
fram
e fa
ilure
acc
iden
ts:
all o
ther
rot
orcr
aft
type
s.

209
0
100
200
300
400
500
600
03
69
1215
1821
165
L
oss
of c
ontr
ol
11
1
Los
s of
eng
ine
pow
er
7
3
Air
fram
e/co
mpo
nent
/sys
tem
fai
lure
/mal
func
tion
40
In
flig
ht c
ollis
ion
wit
h te
rrai
n/w
ater
28
In
flig
ht c
ollis
ion
wit
h ob
ject
25
H
ard
land
ing
20
R
ollo
ver/
nose
-ove
r
1
3
Stal
l/set
tlin
g w
ith
pow
er
475
A
ccid
ents
fro
m f
irst
8 c
ateg
orie
s
4
1
Acc
iden
ts f
rom
oth
er 1
3 ca
tego
ries
516
T
otal
5 C
ateg
orie
s ac
coun
t fo
r 80
% o
f ac
cide
nts
NT
SB m
ajor
cat
egor
ies
All
othe
rro
torc
raft
acci
dent
coun
t
Fig
ure
107.
Sum
mar
y ac
cide
nt s
tati
stic
s, m
id-1
963
thro
ugh
1997
: al
l oth
er r
otor
craf
t ty
pes.
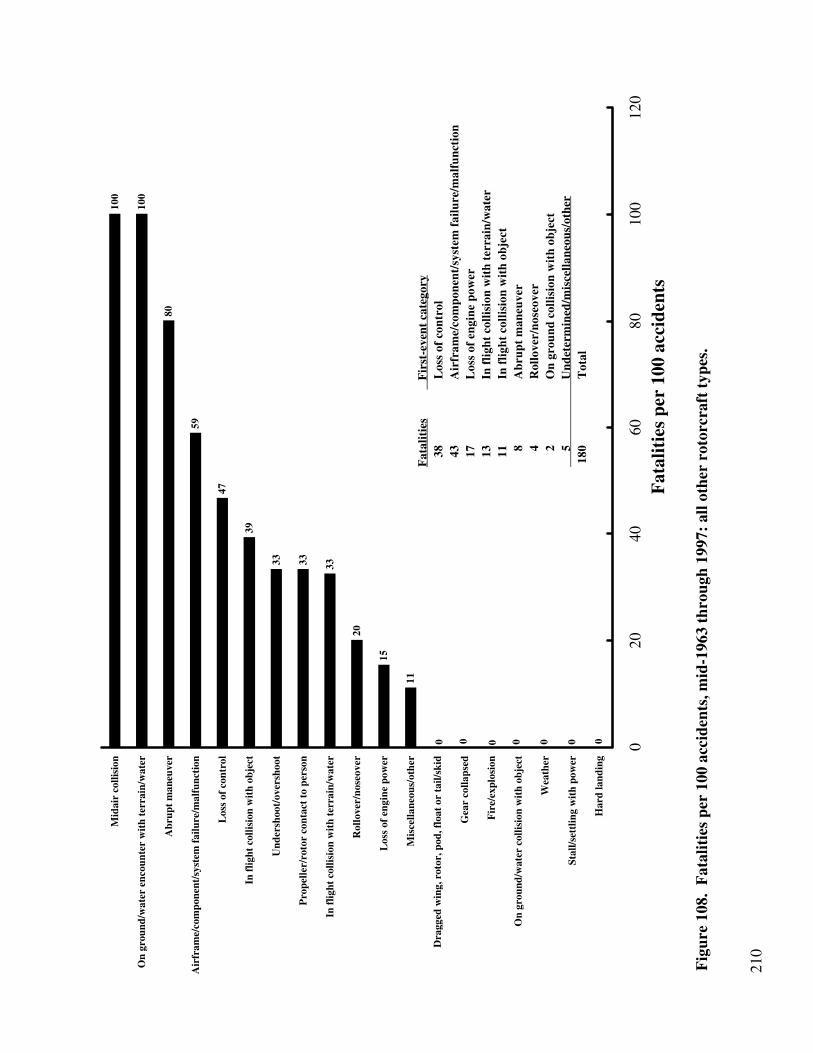
210
11
15
20
333333
39
47
59
80
100
100
0000000 020
4060
8010
012
0
Har
d la
ndin
g
Stal
l/set
tlin
g w
ith
pow
er
Wea
ther
On
grou
nd/w
ater
col
lisio
n w
ith
obje
ct
Fir
e/ex
plos
ion
Gea
r co
llaps
ed
Dra
gged
win
g, r
otor
, pod
, flo
at o
r ta
il/sk
id
Mis
cella
neou
s/ot
her
Los
s of
eng
ine
pow
er
Rol
love
r/no
seov
er
In f
light
col
lisio
n w
ith
terr
ain/
wat
er
Pro
pelle
r/ro
tor
cont
act
to p
erso
n
Und
ersh
oot/
over
shoo
t
In f
light
col
lisio
n w
ith
obje
ct
Los
s of
con
trol
Air
fram
e/co
mpo
nent
/sys
tem
fai
lure
/mal
func
tion
Abr
upt
man
euve
r
On
grou
nd/w
ater
enc
ount
er w
ith
terr
ain/
wat
er
Mid
air
colli
sion
Fat
alit
ies
per
100
acci
dent
s
Fig
ure
108.
Fat
alit
ies
per
100
acci
dent
s, m
id-1
963
thro
ugh
1997
: al
l oth
er r
otor
craf
t ty
pes.
Fat
alit
ies
F
irst
-eve
nt c
ateg
ory
38
Los
s of
con
trol
43
Air
fram
e/co
mpo
nent
/sys
tem
fai
lure
/mal
func
tion
17
Los
s of
eng
ine
pow
er 1
3
I
n fl
ight
col
lisio
n w
ith
terr
ain/
wat
er 1
1
I
n fl
ight
col
lisio
n w
ith
obje
ct
8
Abr
upt
man
euve
r
4
Rol
love
r/no
seov
er
2
On
grou
nd c
ollis
ion
wit
h ob
ject
5
Und
eter
min
ed/m
isce
llane
ous/
othe
r18
0
T
otal

211
051015202530
1970
1975
1980
1985
1990
1995
2000
2005
2010
Acc
iden
tspe
r1,
000
regi
ster
ed
roto
rcra
ft
End
of
year
Fig
ure
109.
Acc
iden
ts p
er 1
,000
reg
iste
red
airc
raft
pro
ject
ed t
o 20
10:
all o
ther
rot
orcr
aft
type
s.
1972
thr
ough
199
7ac
cide
nt e
xper
ienc
e tr
end-
line
extr
apol
ated
to
2010
(exp
onen
tial
)

212
THIS PAGE INTENTIONALLY BLANK

213
Appendix ANTSB DEFINITIONS
This appendix provides excerpts from the Federal Aviation Regulations that govern the NationalTransportation Safety Board (NTSB) and excerpts from the NTSB manual that guide investigators inreporting accidents.
A-1. Definitions of Accident/Incident
The following definitions of terms used in this report have been extracted from NTSB Part 830 ofthe Federal Aviation Regulations. These regulations are included in most commercially availableFAR/AIM digests and should be referenced for detailed information.
Aircraft Accident—An occurrence incident to flight in which “as a result of the operation of anaircraft, any person (occupant or non-occupant) receives fatal or serious injury or any aircraftreceives substantial damage.”
A fatal injury is one that results in death within 30 days of the accident.
A serious injury is one that:
1. Requires hospitalization for more than 48 hours, commencing within seven days from thedate the injury was received;
2. Results in a fracture of any bone (except simple fractures of the fingers, toes, or nose);
3. Involves lacerations that cause severe hemorrhages, nerve, muscle, or tendon damage;
4. Involves injury to any internal organ; or
5. Involves second- or third-degree burns, or any burns affecting more than 5% of bodysurface.
A minor injury is one that does not qualify as fatal or serious.
Destroyed means that an aircraft was demolished beyond economical repair; that is, substantiallydamaged to the extent that it would be impractical to rebuild it and return it to an airworthycondition.
(This may not coincide with the definition of “total loss” for insurance purposes. Because of thevariability of insurance limits carried and such additional factors as time on engines and propellersand aircraft condition before the accident, an aircraft may be “totaled” even though it is notconsidered “destroyed” for accident investigation purposes.)

214
Substantial Damage:
1. Except as provided below, substantial damage means damage or structural failure thatadversely affects the structural strength, performance, or flight characteristics of the aircraft, and thatwould normally require major repair or replacement of the affected part.
2. Engine failure, damage limited to an engine, bent fairings or cowling, dented skin, smallpuncture holes in the skin or fabric, ground damage to rotor or propeller blades, damage to landinggear, wheels, tires, flaps, engine accessories, brakes, or wing tips are not considered “substantialdamage.”
(As with “destroyed” above, the definition of “substantial” for accident investigation purposes doesnot necessarily correlate with “substantial” in terms of financial loss. Contrary to popularmisconception, there is no dollar value that defines substantial damage. Because of the high cost ofmany repairs, large sums may be spent to repair damage resulting from incidents that do not meetthe NTSB Part 830 definition of “substantial damage.”)
Minor damage is damage that does not qualify as substantial, such as that under “substantialdamage” above.
A-2. Definitions of Kinds of Flying
The purpose for which the aircraft is being operated at the time of the accident:
On-Demand Air Taxi—Revenue flights conducted by commercial air carriers operating under14 CFR 135 that are not operated in regular scheduled service, such as charter flights, and all non-revenue flights incident to such flights.
Personal—Flying by individuals in their own or rented aircraft for pleasure or personaltransportation, not in furtherance of their occupation or company business. This category includespractice flying (for the purpose of increasing or maintaining proficiency) not performed undersupervision of an accredited instructor and not part of an approved flight training program.
Business—The use of aircraft by pilots (not receiving direct salary or compensation for piloting) inconnection with their occupation or in the furtherance of a private business.
Instruction—Flying accomplished in supervised training under the direction of an accreditedinstructor.
Executive/Corporate—The use of aircraft owned or leased and operated by a corporate or businessfirm for the transportation of personnel or cargo in furtherance of the corporation’s or firm’sbusiness, and that are flown by professional pilots receiving a direct salary or compensation forpiloting.

215
Aerial Application—The operation of aircraft for the purpose of dispensing any substance for plantnourishment, soil treatment, propagation of plant life, pest control, or fire control, including flying toand from the application site.
Aerial Observation—The operation of an aircraft for the purpose of pipeline/powerline patrol, landand animal surveys, etc. This does not include traffic observation (electronic news gathering) orsightseeing.
Other Work Use—The operation of an aircraft for the purpose of aerial photography, banner/glidertowing, parachuting, demonstration or test flying, racing, aerobatics, etc.
Public Use—Any operation of an aircraft by any federal, state, or local entity.
Ferry—A non-revenue flight for the purpose of (1) returning an aircraft to base, (2) delivering anaircraft from one location to another, or (3) moving an aircraft to and from a maintenance base.Ferry flights, under certain terms, may be conducted under terms of a special flight permit.
Positioning—Positioning of the aircraft without the purpose of revenue.
Other—Any flight that does not meet the criteria of any of the above.
Unknown—A flight whose purpose is not known.
A-3. NTSB Manual Definitions and Codes
PART I—INSTRUCTIONS
Introduction
The NTSB Coding Manual is a source document for codes to be used in the Board’s main framecomputer for storage and retrieval of information concerning the findings of aviation accidents. Thisrevision of the coding manual contains suggested changes that were received in the RegionalOperations and General Aviation Division (AS-20). Procedures are in effect to update the manual ona periodic basis. Suggestions for changes or corrections should be forwarded to the SeniorAnalyst(s) in AS-20. Suggestions may be forwarded by using the form at the end of this manual orby telephone.
The codes are normally sent to the main frame computer through a network system by using theADMS program. Entry of codes may be made by the individual investigator by using his (or her) PCor by personnel in AS-20. A computer matrix is provided in the ADMS program for entry of codes.The codes should be entered in the matrix to correspond with the sequence in which they led to theaccident/incident.

216
Computerized findings are published for each accident and incident in a brief format (Brief-of-Accident or Brief-of-Incident). Each brief includes findings, which are identified in a sequence-of-events as occurrences, phases, causes, factors, and/or events. A probable cause (PC) statement is alsopublished to provide a narrative presentation of the NTSB findings.
The codes and respective printout data are listed in the coding manual in an alphabetical order,within the respective categories, rather than in a sequential or number order. Printout data is listed inupper-case letters, whereas explanatory notes (that do not print out) are in parenthesis with lower-case wording.
The previous publication of the this manual was in January 1995. Codes that have been added orchanged (since the previous publication) are annotated as follows:
• Pound sign (#) designates a change
• Plus sign (+) designates an addition
• Equal sign (=) designates a code for a subject (printout) that was previously usedbefore the previous revision
• Less-than symbol (<) interim change to previous revision
• Asterisk (*) references definition in Part II of manual.
General Instructions
As previously noted, the codes in this manual are intended to be used to describe the sequence-of-events of each accident and/or incident. All entries in the sequence-of-events (and brief narrative)must be substantiated by information that is documented in the Factual Report or is available inother accessible documents or publications.
Multiple occurrences, causes, factors and/or events may be used in each sequence-of-events todescribe the findings. Each occurrence is coded separately and a corresponding phase of operationmust be entered with each occurrence; as of the date of this publication, only five occurrences can berecorded for each mishap. There must be at least one occurrence and one cause identified with eachaccident or incident. The occurrences must be chronologically numbered. For accidents withmultiple causes, there is no provision to show the magnitude of each cause with respect to the others.Likewise, there is no provision to show the relative magnitude of multiple factors. For retrievalpurposes, elements of the PC statement should be coded in the sequence-of-events, if feasible.
The number of findings and the size of the PC statement are limited by the amount of spaceavailable on the second page of the computer printout. Depending on the number of occurrences andnumber of lines used in the PC statement, about 15 to 43 causes/factors/events can be listed for anyone accident or incident.
The sequence-of-events matrix (see: Sequence-of-Events Worksheet, Part III) contains entry spacesfor codes in the following sections:

217
1. IA—Primary Non-Person-Related Findings (Aircraft/Environment)
2. IB—Primary Person-Related Findings (Operations/Performance)
3. II—Direct Underlying Events
4. III—Indirect Underlying Events.
Each section of the matrix contains columns of spaces. The spaces in the left column of each sectionare for “subject” codes. The long spaces to the right of the subject spaces are for modifiers/persons.The short spaces in the middle of each section are used to describe whether the subjects are causesor factors by entering “C” or “F” codes. These may be left blank, if the subject is neither a cause nora factor, but merely an event.
Formerly, the main frame (DEC 10) computer (using System 1022) was programmed to allow entryof restricted information in the database that would not print out in the briefs. This wasaccomplished by putting an “X” in the middle space to denote the restricted information. Thisinformation was stored in the computer for use as statistical information only. Currently, there is norequirement for entry of restricted data, and the VAX/MV-4 computer (using System 1032) has notbeen programmed for entry of this information. The database, however, still contains restrictedinformation that was previously entered via the DEC 10.
Within each section of the matrix, each line entry must be completed in its entirety; i.e., each subjectcode must be followed by a modifier and/or person code. Sections IA and IB are used to list theprimary events/findings that led to the accident or incident. Sections II and III are used to furtherdefine or explain a primary event or finding that is listed in Section IA or IB.
Section IA is used to identify the primary non-people-related findings. It contains columns of spacesto enter non-people-related subjects and modifiers. However, a code is available to allowed themodifier to be left blank, if needed. The non-people-related subjects are grouped in the followingcategories:
Aircraft systems/componentsAir traffic facilitiesAirport facilitiesTerrain conditionsWeather conditionsLight conditionsObject(s).
Section IB identifies the primary finding(s) that are people related. This section normally contains asubject, modifier, and person, although codes are available for the modifier and person to be leftblank. However, the blank code for a person should only be used when no other person code can besupported by the factual report. A blank modifier code is only used in conjunction with a blankperson code.

218
Sections II and III are used for the direct and indirect underlying findings. They are normally codedwith a subject and a person (or institution), but codes are available for the person code to be leftblank. Any number of underlying findings can be related to a primary finding in Section IA and/orIB. However, underlying findings in Section II or III should only be used when they are related to aprimary finding in Section IA and/or IB
The computer system was previously programmed so that when more than one finding was enteredon the same line, findings in sections/columns to the right would be indented to show a relationship.This feature is no longer available. Print-outs from the codes are now (without indentation),beginning with the first code entered on the left in line one of the matrix followed by those to theright and below.
Mandatory Conventions:
The coding manual is designed to provide a great degree of latitude and flexibility in formulating thefindings. However, certain conventions should be followed to logically present some sequences-of-events.
For NTSB retrieval of multiengine aircraft information, the phrase “TOTAL LOSS OF ENGINEPOWER” and “PARTIAL LOSS OF ENGINE POWER” are to be used in reference to the specificengine(s) being addressed, rather than to the overall power of the aircraft. Specifically, for a situationinvolving total loss of power for mechanical reasons in one engine of a multiengine aircraft, the codefor that occurrence would be 351 (for “LOSS OF ENGINE POWER (TOTAL)—MECHFAILURE/MALFUNCTION”). Also, codes are provided in the aircraft section to identify thenumber of engines affected on multiengine aircraft. The following codes are intended for use withmultiengine aircraft findings:
a. [16905] ONE ENGINE
b. [16906] TWO ENGINES
c. [16907] THREE OR MORE ENGINES
d. [16908] ALL ENGINES.
For occurrences involving loss of engine power in multiengine aircraft, one of the above codeswould normally be used as the first entry (subject) in the sequence-of-events (in Section IA); anexception would be when the number of engines that lost power was unknown. These (subject)codes should be modified by Code 1220 (blank code), so that no modifier will print out. Typically,losses of power in more than one engine would be coded as separate occurrences, except when morethan one engine loses power at the same time for the same reason. If the occurrence resulted in allengines losing power (i.e., fuel exhaustion), then Code 16908 (ALL ENGINES) should be used(even if the aircraft had two or three engines, though there are codes for two and three engines).
For example, consider a turbine disk failure of the No. 1 engine of a Boeing 727 that resulted in atotal loss of power of that engine; then shortly thereafter, partial loss of power occurred in the No. 2and No. 3 engines due to a fuel system problem.

219
In coding this scenario, there would be two occurrences involving loss of power; i.e. the firstoccurrence would be coded “LOSS OF ENGINE POWER (TOTAL)—MECH FAILURE/MALFUNCTION.” The first subject code for this occurrence would be 16905, (ONE ENGINE),which would be modified by Code 1220 (blank space). Of course, additional findings would followto describe the appropriate cause(s) and/or factor(s).
The second occurrence would be coded “LOSS OF ENGINE POWER (PARTIAL)—MECHANICAL FAILURE/MALF.” The first subject code for the second occurrence would be16906 (TWO ENGINES) followed by Code 1220 (blank space).
For single-engine aircraft accidents/incidents, there is no reason to provide a code for the number ofengines, since “one engine” would be obvious.
A progressive loss of power may be considered a single event. For example, a bearing failure mayresult in a partial loss of power at first, but the power loss could deteriorate until there was a totalloss of power. For all practical purposes, this would be one occurrence.
Whenever an occurrence mandates a forced landing, the next occurrence in the sequence-of-eventswould normally be “FORCED LANDING” (180). The associated phase of operation will often be“EMERGENCY DESCENT/LANDING” (576), but the phase could be “MANEUVERING—TURNTO LANDING AREA (EMERGENCY)” (583), “EMERGENCY LANDING AFTER TAKEOFF”(575), “EMERGENCY LANDING” (574), or “LANDING” (570). Forced landings are oftenpresented with no other findings listed for that occurrence. However, there are some typical findingsthat are occasionally used with forced landings, if they are appropriate and substantiated;i.e., “EMERGENCY PROCEDURE—NOT FOLLOWED—PILOT IN COMMAND” if and whenappropriate, and “AUTOROTATION—PERFORMED—PILOT IN COMMAND” when a helicopteris involved in an autorotation during a forced landing.
Code 502, “STANDING—STARTING ENGINE(S),” is used for hand propping/runaway accidents.The typical convention for coding this situation would be as follows:
1st Occurrence—MISCELLANEOUS/OTHER (430)
1st Phase—STANDING-STARTING ENGINE(S) (502)
2nd Occurrence—Usually a collision with object or terrain
2nd Phase—Usually “TAXI” (510), although the aircraft could become airborne before thesecond occurrence, result in an in flight collision with terrain or object.

220
For occurrences involving carburetor ice, the sequence-of-events should include the environmentalcondition and the events leading to the situation as well as listing the cause/factor(s). The followingis a typical convention for mechanical loss of power due to carburetor heat control failure andsubsequent carburetor ice:
LOSS OF ENGINE POWER (TOTAL)—MECH FAILURE/MALF (351)
1. WEATHER—CARBURETOR ICING CONDITIONS (20000/F/2202)
2. CARB HEAT CONTROL—FAILURE, TOTAL (16400/C/1135)
3. FUEL SYSTEM, CARBURETOR—ICE (15109/C/1146).
For non-mechanical loss of power due to improper use of the carburetor heat by the pilot:
LOSS OF ENGINE POWER (TOTAL)—NON-MECHANICAL (353)
1. WEATHER—CARBURETOR ICING CONDITIONS (20000/F/2202)
2. FUEL SYSTEM, CARBURETOR—ICE (15109/C/1146)
3. CARB HEAT—IMPROPER USE OF—PIC (22304/C/3110/4000).
PART II—DEFINITIONS
ABRUPT MANEUVER: An intentional maneuver that directly results in personal injury or aircraftdamage.
ALTITUDE DEVIATION, UNCONTROLLED: For an occurrence in which there is a loss-of-control that results in a loss or gain in the altitude, but recovery is accomplished (i.e., autopilotmalfunction of airliner that results in altitude deviation & injury to unbelted occupant).
COLLECTIVE BIAS: A mechanism, system, or function of a helicopter that automatically adjustsengine power to maintain rotor rpm, when an increase or decrease in collective is made. (Themechanism is also known as a throttle/collective correlator box.)
DITCHING: A planned event in which a flight crew knowingly makes a controlled emergencylanding in water. (Excludes float plane landings in normal water landing areas.)
DRAGGED WING, ROTOR, POD, FLOAT, OR TAIL: Use as a first occurrence only, when thisresults in an aircraft accident or incident during taxi, takeoff, or landing. (Not used in conjunctionwith a hard landing or after a gear collapse or ground loop/swerve.)
DYNAMIC ROLLOVER: Ground rollover mishap of a helicopter, which results from a cumulativeeffect of dynamic forces. These forces cause a roll reaction that results in the helicopter exceedingits static rollover angle.

221
ENGINE TEARAWAY: An occurrence in which one or more engines are torn away from an aircraft,but not due to contact with an external object. (Includes tearaway due to internal damage fromforeign object damage.)
FORCED LANDING: An emergency landing involving circumstances in which the pilot does nothave the option to selectively choose the time and appropriate location for landing. (See“precautionary landing” for circumstances in which the pilot has the time and option to choose anappropriate landing area.)
GEAR COLLAPSE: Collapse of the landing gear due to mechanical failure other than malfunctionof the retracting system. When the landing gear collapses as a result of a hard landing, the gearcollapse will be the subsequent (second) occurrence.
FIRE/EXPLOSION: Use as an occurrence for fire, explosion, or heavy smoke occurring in flight,and for aircraft fires occurring on the ground, except those resulting from impact.
GEAR RETRACTION: Retraction of the landing gear (on ground or runway) due to malfunction ofthe retraction system, or due to inadvertent or premature retraction by the crew. (Gear retraction ontakeoff will be coded as gear retraction in the takeoff phase, and will not be recorded as a wheels-uplanding. Excludes intentional gear retractions.)
GO-AROUND: A maneuver following an uncompleted approach, which involves transition to aclimbing flightpath.
GROUND LOOP: An involuntary uncontrolled (abrupt) turn of an aircraft, while moving along theground (i.e., ground taxiing or moving on the takeoff or landing run).
GROUND RESONANCE: Dangerous natural vibration of a helicopter on the ground, caused bystiffness and frequency of the landing gear legs, amplifying the primary frequency of the main rotor.(Includes the self-excited vibration of a helicopter, occurring whenever the frequency of oscillationof the blades about the lead-lag hinges of an articulated rotor becomes the same as the naturalfrequency of the fuselage.)
HARD LANDING: Stalling onto or flying into a runway or other intended landing area withabnormally high vertical speed. For rotorcraft, includes “tail-down” landings and those where themain rotor contacts the tail boom on landing.
HEIGHT/VELOCITY CURVE: Fundamental plot of indicated airspeed against altitude, which isincluded in the helicopter flight manual; indicates region(s) from which safe autorotative descent ispossible, normally assuming zero wind, sea level, and maximum takeoff weight.
HELIPAD: Prepared area (of land, water or structure) designated as a takeoff/landing area forhelicopters (no facilities other than markings needed); includes truck or trailer that is routinely usedas heliport.
HELIPORT: A facility used for operating, basing, housing, and maintaining helicopters.

222
IN FLIGHT ENCOUNTER WITH WEATHER: Weather encountered that is not normal to theintended phase of operation. Use as an occurrence only when it leads to an accident or incident.(Excludes: vortex turbulence and operations in normal crosswind or IFR conditions.)
MISSING AIRCRAFT: For purposes of coding, a missing aircraft is one that is presumed to havecrashed, and the location of the crash is unknown. If credible witness(es) or pieces of wreckage canreasonably verify the accident and location, then the aircraft would not be considered as missing.
NOSE DOWN: When an aircraft noses down on the ground, water, or runway without goinginverted.
NOSE OVER: When an aircraft goes inverted on the ground, water, or runway, while taxiing or ontakeoff or landing.
NOTAR SYSTEM: Helicopter “No Tail Rotor” System. (For McDonnell Douglas Helicopters:consists of an enclosed variable pitch fan driven by the transmission, a circulation control tail boom,direct-jet thruster, and vertical stabilators.)
OCCURRENCE: Distinct major event of relative significance that leads to an accident or incident.
ON-GROUND ENCOUNTER WITH WEATHER: An occurrence involving weather that is notnormal to the phase of operation. (Excludes: vortex turbulence, jet/prop blast, and normal IFR orcrosswind conditions.)
OVERRUN: The continuation of aircraft movement beyond the end of the runway; i.e., overrunningthe intended landing or takeoff area. (Used in takeoff and landing phases.)
PHASE OF OPERATION: The point in aircraft operations during which an occurrence takes place.
PIBAL: Small balloon launched to check wind direction before takeoff of hot air balloon to assist invisualizing ground track relative to anticipated flightpath.
PRECAUTIONARY LANDING: A landing involving a sense of urgency due to an emergency orpending emergency, in which the pilot has the option and time to selectively choose an appropriatelanding area.
PROPELLER FAILURE/MALFUNCTION: An occurrence concerning failure or malfunction of apropeller blade, hub, or related part, including separation or overspeeding of a propeller, or failure ofa propeller system. (Note: When propeller failure results from engine seizure, crankshaft failure,etc., the occurrence should be coded as an engine failure.)
ROLL OVER: Refers to rotorcraft only. Includes tilting with the main rotor blades striking theground.

223
ROTOR FAILURE/MALFUNCTION: An occurrence concerning failure or malfunction of a rotorblade, hub, or related part, including separation or overspeeding of a rotor or failure of the rotordrive system.
SETTLING WITH POWER: A condition of helicopter power settling, in which hover powerrequired exceeds power available, normally resulting from an attempt to hover out of ground effectwith insufficient power available to compensate for elevation, temperature, and/or humidity.
UNAPPROVED PART: A part, component, or material that has not been manufactured inaccordance with the approval procedures in FAR 21.305 or repaired in accordance with FAR Part 43;does not conform to an approved type design; or does not conform to established industry or U.S.specifications (standard parts). Examples of an unapproved part include, but are not limited to: (1)Counterfeit or fraudulently marked parts, components, or materials; (2) Parts shipped directly tousers by a manufacturer, supplier, or distributor who does not hold, or operate under the authority of,a production approval for the part; and (3) Parts that have been maintained or repaired and returnedto service by persons or facilities not authorized under FAR Parts 43 or 145.
UNDERSHOOT: A condition that occurs during an approach to landing that results in an inadvertentlanding or contact with the ground or an object short of the runway or intended landing area,normally due to misjudgment of distance, speed, and/or altitude on final approach. For IFRapproaches, an undershoot will occur only after the field or intended landing area is in sight. Anundershoot will always be followed by a subsequent occurrence; i.e., in flight collision-with-objector terrain, etc. (Does not include occurrences in which the aircraft could not have reached theintended landing area; i.e. after loss of engine power.)
VORTEX RING STATE: An area of nonuniform and unsteady airflow around a rotating main rotoror tail rotor in which the rotor is affected by an induced velocity of airflow that approaches orexceeds the airflow being produced by the affected rotor. It is characterized by a sudden requirementfor increased power and/or rotor pitch when airflow from the affected rotor is forced back throughand around the rotor.
WHEELS-UP LANDING: Code as an occurrence when the landing gear is not lowered and lockedbefore contact with the ground/runway during a landing. (Excludes inadvertent retraction on theground and retractions due to failure or malfunction of the gear assembly and/or retractingmechanism. Includes intentional wheels-up landing and inability to extend the gear due tomalfunction of the gear extension system.)
VLOF “Lift-off speed”
VMCG “Minimum control speed on the ground” The minimum speed at which, the critical enginehaving been made suddenly inoperative at that speed and having been recognized by the pilot, it ispossible to maintain control of the airplane with the engine still inoperative, using primaryaerodynamic controls alone, and thereafter maintain a straight path parallel to that originallyintended.

224
VMCA “Minimum control speed” The minimum speed at which, when the critical engine issuddenly made inoperative at that speed, it is possible to recover control of the airplane with theengine still inoperative and to maintain it in a straight flight at a speed, either with zero yaw or withan angle of bank not in excess of 5o.
VYSE “Best rate-of-climb single-engine speed”
VXSE “Best angle-of-climb single-engine speed”
VS “Stalling speed” The minimum speed in flight at which the airplane can develop a lift equal tothe weight of the airplane.
VSO “The power off stall speed” or minimum steady flight speed in the landing configuration.
VFE “Maximum flap extended speed”
VLO “Maximum landing gear extension/retraction speed”
VLE “Maximum landing gear extended speed”
VA “Design maneuvering speed” The maximum speed for which the aircraft is designed for fullabrupt control deflection without incurring structural damage.
VMO “Maximum operating limit speed”
VNE “Never-exceed speed”
VREF “Landing approach speed” The indicated airspeed that the aircraft should be at 50 feet abovethe landing area in the landing configuration. (1.3 × VSO)
VR “Rotation speed”
Vtoss “Takeoff safety speed” (Category A helicopter)
V1 “Takeoff decision speed” (Formerly denoted as critical engine failure speed.) The speed atwhich, should the critical engine fail, the pilot could elect to abandon the takeoff or continue.
V2 “Takeoff safety speed” A reference speed obtained after lift-off at which the required one-engine-inoperative climb performance can be achieved.
V2MIN “Minimum takeoff safety speed” (1.15 × VS for two and three engine propeller-drivenaircraft or 1.10 × VS for four engine propeller-driven aircraft or 1.10 × VMCA, whichever isgreater.)

225
PART IV—CODES FOR OCCURRENCES
100 ABRUPT MANEUVER*
130 AIRFRAME/COMPONENT/SYSTEM FAILURE/MALFUNCTION (incld inflt brkup)
131 PROPELLER FAILURE/MALFUNCTION
132 ROTOR FAILURE/MALFUNCTION (main or tail rotor of helicopter)
110 ALTITUDE DEVIATION, UNCONTROLLED (i.e., after auto-plt malfunction)
120 CARGO SHIFT
140 DECOMPRESSION
150 DITCHING*
160 DRAGGED WING, ROTOR, POD, FLOAT OR TAIL/SKID*
355 ENGINE TEARAWAY
170 FIRE/EXPLOSION
172 EXPLOSION
171 FIRE
180 FORCED LANDING
190 GEAR COLLAPSED
194 COMPLETE GEAR COLLAPSED
191 MAIN GEAR COLLAPSED
192 NOSE GEAR COLLAPSED
195 OTHER GEAR COLLAPSED
193 TAIL GEAR COLLAPSED
198 GEAR RETRACTION ON GROUND*
200 HARD LANDING
210 HAZARDOUS MATERIALS LEAK/SPILL (fumes/smoke therefrom)
220 IN FLIGHT COLLISION WITH OBJECT (object modifiers, 20200 series)
230 IN FLIGHT COLLISION WITH TERRAIN/WATER (trrn modfrs, 19200 series)
231 WHEELS DOWN LANDING IN WATER
232 WHEELS UP LANDING
240 IN FLIGHT ENCOUNTER WITH WEATHER* (wx modifiers, 20000 series)
250 LOSS OF CONTROL—IN FLIGHT (includes stall, spin, vmc roll, and inability to ctl acftafter becoming spatially disoriented)
260 LOSS OF CONTROL—ON GROUND/WATER(excludes intentional gnd loop)

226
350 LOSS OF ENGINE POWER (includes loss of power for unknown reason)
352 LOSS OF ENGINE POWER(PARTIAL)—MECH FAILURE/MALF
354 LOSS OF ENGINE POWER(PARTIAL)—NONMECHANICAL
351 LOSS OF ENGINE POWER(TOTAL)—MECH FAILURE/MALFUNCTION
353 LOSS OF ENGINE POWER(TOTAL)—NONMECHANICAL
270 MIDAIR COLLISION (when both aircraft involved are airborne)
271 COLLISION BETWEEN AIRCRAFT (OTHER THAN MIDAIR) (excludes unoccupied acft)
420 MISSING AIRCRAFT*
430 MISCELLANEOUS/OTHER
280 NEAR COLLISION BETWEEN AIRCRAFT
290 NOSE DOWN*
300 NOSE OVER*
310 ON GROUND/WATER COLLISION WITH OBJECT (obj mod, 20200 series)
320 ON GROUND/WATER ENCOUNTER WITH TERRAIN/WATER (trrn/19200 series)
330 ON GROUND/WATER ENCOUNTER WITH WEATHER* (wx mod, 20000 series)
340 OVERRUN*
360 PROPELLER BLAST OR JET EXHAUST/SUCTION
370 PROPELLER/ROTOR CONTACT TO PERSON
380 ROLL OVER (normally associated with helicopter)
390 UNDERSHOOT*
400 UNDETERMINED
410 VORTEX TURBULENCE ENCOUNTERED
PART V—CODES FOR PHASES OF OPERATION
500 STANDING
501 STANDING—PRE-FLIGHT
502 STANDING—STARTING ENGINE(S)
503 STANDING—ENGINE(S) OPERATING
504 STANDING—ENGINE(S) NOT OPERATING
505 STANDING—IDLING ROTORS
510 TAXI (includes runaway while hand-propping)
511 PUSHBACK/TOW

227
512 TAXI TO TAKEOFF
513 TAXI—FROM LANDING
514 TAXI—AERIAL (includes air/hover taxi)
520 TAKEOFF (modify with operational code 24563, if on touch-and-go)
523 TAKEOFF—ABORTED
522 TAKEOFF—INITIAL CLIMB (to 1st power reduction or pattern altitude; includes crosswindleg)
521 TAKEOFF—ROLL/RUN (ground or water)
530 CLIMB
531 CLIMB—TO CRUISE
540 CRUISE (includes low-altitude straight and level flight)
541 CRUISE—NORMAL
550 DESCENT
551 DESCENT—NORMAL
552 DESCENT—EMERGENCY (plt initiated; i.e., after decompression)
553 DESCENT—UNCONTROLLED
560 APPROACH
561 APPROACH—VFR PATTERN—DOWNWIND
562 APPROACH—VFR PATTERN—BASE TURN
563 APPROACH—VFR PATTERN—BASE LEG/BASE TO FINAL
564 APPROACH—VFR PATTERN—FINAL APPROACH
566 APPROACH—IAF TO FAF/OUTER MARKER (IFR)
567 APPROACH—FAF/OUTER MARKER TO THRESHOLD (IFR)
568 APPROACH—CIRCLING (IFR) (in conjunction with IFR approach)
569 MISSED APPROACH (IFR)
565 GO-AROUND (VFR) (before touchdown)* (refer to 573 for after touchdown)
570 LANDING (modify with operational code 24563, if touch-and-go)
573 LANDING—ABORTED (balked—after touchdown)
571 LANDING—FLARE/TOUCHDOWN
572 LANDING—ROLL
574 EMERGENCY LANDING
575 EMERGENCY LANDING AFTER TAKEOFF (i.e., forced lndg after tkof)

228
576 EMERGENCY DESCENT/LANDING (i.e., with forced landing, except after takeoff orduring landing approach)
580 MANEUVERING (includes buzzing)
581 MANEUVERING—AERIAL APPLICATION (includes swath run)
582 MANEUVERING—TURN TO REVERSE DIRECTION
583 MANEUVERING—TURN TO LANDING AREA (EMERGENCY)
542 MANEUVERING—HOLDING(IFR)
590 HOVER (stationary; excludes aerial taxi)
591 HOVER—IN GROUND EFFECT
592 HOVER—OUT OF GROUND EFFECT
600 OTHER
610 UNKNOWN

229
Appendix BESTIMATION OF ROTORCRAFT FLEET SIZE AND HOURS FLOWN
Some often-quoted aviation safety statistics for any given aircraft class are fatalities per 100,000flight hours and accidents per 100,000 flight hours. These ratios are obtained by dividing twonumbers. The numerator for these ratios, fatalities or accidents for a given year, comes from theNTSB’s files, which are reliable. The denominator, flight hours per year, comes from the FAA files,which are frequently questioned because the statistical data are very dependent on (1) the AircraftRegistration Master File, (2) the aircraft owners’ response to FAA registration and activity requests,and (3) the FAA statistical methodology. The FAA and its CAA predecessor have—since 1944—made a yearly effort to publish their Census of U.S. Civil Aircraft.* This census includes results,since 1977, from the General Aviation Activity and Avionics Survey. Rotorcraft are grouped withgeneral aviation fixed-wing aircraft in the surveys and reports.
In the early 1980s, the census data for the active aircraft count, as well as hours flown per year bythe active rotorcraft fleet, began to appear erratic, and the rotorcraft industry publicly expressed itsconcern (see, for example, ref. 7). Because the FAA groups rotorcraft together with general aviationfixed-wing aircraft in their yearly census, the rotorcraft industry felt that their unique rotary wingproducts—representing anywhere from 3% to 5% of the general aviation fleet—were likely not to beaccurately represented statistically. Should the flight hours per year be substantially in error, forexample, the rotorcraft accidents per 100,000 flight hours would be misleading. In turn, this could,perhaps, cast the rotorcraft industry’s safety record in a bad light, with obvious consequences. Inresponse to the rotorcraft industry’s misgivings, the FAA performed a special survey of just theregistered rotorcraft fleet activity in 1989 (ref. 17).
In view of the situation discussed above, an in-depth review of the FAA yearly Census of U.S. CivilAircraft reports (1957 through 1994), and the General Aviation Activity and Avionics Survey reports(1977 through 1997) was completed. Particular attention was paid to the FAA’s one-time-onlyRotorcraft Activity Survey (ref. 17), which was also included in the 1987 General Aviation Activityand Avionics Survey report. The following discussion offers some insight into several issuesconcerning the method for gathering, evaluating, and using FAA rotorcraft fleet activity data.
The Rotorcraft Activity Survey (ref. 17) illustrates the statistical methodology used by the FAA toarrive at their 1989 reference data. The data bank accumulation process begins with the AircraftRegistration Master File (maintained by the FAA’s Mike Monroney Aeronautical Center inOklahoma City). This Master File is sent to the FAA’s Statistical Analysis Branch in Washington,D.C., where the surveys are conducted and the data published. The Statistical Analysis Brancharrives at the number of active aircraft and the number of hours flown by active aircraft by sendingout a questionnaire to registered owners. For example, the Rotorcraft Activity Survey questionnaire(Form 1800-55) contained 31 blanks to be filled in by respondents to the questionnaire. Thisquestionnaire specifically asked for “(1) hours by use and the number of landings for the entire
*The last version of this Census available as a paper copy is for 1994. In 1995, the primary data tables were put on theWorld Wide Web. It now looks like a Census for 1996, 1997, 1998, and 1999 will not be published at all. The FAA nowappears to have no staff available for what many consider to be a very valuable service.

230
calendar year, 1989 and (2) total airframe hours and the aircraft’s base location as of December 31,1989.” The questionnaire was sent out to 10,469 rotorcraft owners/operators. Appendix A of theRotorcraft Activity Survey report describes the methodology for the survey in additional detail.
After reading the Rotorcraft Activity Survey and its appendix several times, it is concluded that:
1. The final tally of 10,469 rotorcraft represents some culling from the Aircraft RegistrationMaster File, which is approximately 10% greater in number. For example, questionnaires were notsent for rotorcraft registered to dealers; rotorcraft with “Sale Reported” or “Registration Pending”appearing in the record instead of the owner’s name; rotorcraft with a known, inaccurate owner’saddress; and rotorcraft with missing state of registration, aircraft make-model-series code, or aircrafttype information.
2. The return rate on the 10,469 questionnaires with three mailings was: first mailing,March 1990 of 10,469 with return of 5,786; second mailing, May 1990 of 4,683 with return of 619;and third mailing, July 1990 of 2,181 with return of 319.
Thus, the overall response totaling 6,724 was 64% of the 10,469 questionnaires mailed. The secondmailing included a repeat mailing to postal returns from the first mailing. The third mailing excluded1,883 postal returns. Between these first two factors, a large percentage of the rotorcraft fleet isunaccounted for. The last sentence in the Survey’s appendix (Paragraph 5.3.2, Non-Sampling Error)states: “Unfortunately, the high rate of postal returns reflects a seriously out-of-date rotorcraft file.”With about 275,000 aircraft to keep track of, rotorcraft represented slightly less than 4% of the civilaircraft fleet.
The Rotorcraft Activity Survey appendix describes, in paragraph 5.2, how the responses from 6,724owners were extrapolated to the baseline 10,469 population. Apparently, any rotorcraft owner whoanswered at least one question on a 31 blank form was counted as a “respondent.” Paragraph 5.2then goes on to describe a weighting computation based on respondents, “census frame” and“response rate for a cell,” words that were undefined. Despite other hints about the method, we wereunable to follow the details.* However, the 1989 results of the extrapolation were provided intable 2.1, chapter II, of the Rotorcraft Activity Survey. The key data from that table are reproducedbelow.
Using data from the Rotorcraft Activity Survey as a 1989 reference point, a detailed review ofavailable census tabulations and surveys from 1964 through 1997 was completed. Based on thatreview, the principal author is of the opinion that the rotorcraft industry (representing just oneaircraft type) has every reason to question the validity of the FAA published count of activerotorcraft—as well as the hours flown by the active rotorcraft fleet—in any given year after 1979. Abasis for the rotorcraft industry concern is given by figures B-1 through B-9 or tables D-20, D-21,and D-22.
*A more detailed and helpful explanation of the method is included as an appendix in each General Aviation Activityand Avionics Survey report. The reports for 1996 and 1997 can be found at Web pagehttp://api.hq.faa.gov/apo_pubs.htm on the Internet.

231
Rotorcraft typePopulation
size
Estimate ofnumberactive
Estimate of totalhours flown(in 1989 by
active aircraft)a
Estimate ofaverage hours
flown (per year by
active aircraft)a
Manufacturer built
Piston total 3,994 2,684 728,125 277.8
Single turbine 3,616 3,248 1,532,270 480.5
Twin turbine 1,069 984 546,471 551.8
Turbine total 4,685 4,232 2,078,741 496.5
Manufacturer total 8,679 6,916 2,806,866 417.3
Amateur built total 1,790 572 21,830 38.2
Total all rotorcraft 10,469 7,488 2,828,697 390.2
aIt is not clear why column three divided by column two does not equal column four in the above table.
As figures B-1 and B-2 suggest, the trend in FAA quoted hours flown by the “active” portion of theregistered rotorcraft fleet in any given year after 1979 appears quite erratic relative to the trendshown for earlier years. Figure B-1 suggests that the timing of this erratic appearance might beconsistent with the downturn in the rotorcraft industry’s growth in the 1980s (see figs. 8, 16, 45, or73). However, when yearly hours flown are graphed versus registered fleet size (i.e., active plusinactive rotorcraft), as shown in figure B-2, an entirely different impression is made. Figure B-2suggests that registered fleet size growth after 1979 was accompanied by fewer hours flown per year.This would be at odds with the historical trend shown prior to 1979. One interpretation of figure B-2might be, that the active fleet (i.e., those rotorcraft that flew at least 1 hour in the year) decreased,that the active fleet flew fewer hours, and that 1,000 to 2,000 rotorcraft were simply “mothballed.”(This possible explanation will be discussed shortly.) Similar contradictory impressions are shownindividually by the piston-engine-powered portion of the fleet (figs. B-3 and B-4) and the turbine-engine-powered portion of the fleet (figs. B-3 and B-5). In fact, the generally erratic trend in censusand fleet activity borders on the absurd for the piston-powered fleet shown in figure B-4. The post-1979 trend (shown by the long dashed line) suggests that when the Aircraft Registration Master Filelists 8,000 piston-powered rotorcraft, all rotorcraft of this type will be “inactive” and the total fleetwill accumulate no flight hours in that year.
The more likely explanation for the picture presented by figures B-1 through B-5 is that the methodof gathering data changed in the 1977-1979 period. A hint that this is exactly what happened isprovided by the FAA Census of U.S. Civil Aircraft for calendar year 1979. In the section entitled"ACTIVE GENERAL AVIATION AIRCRAFT AND HOURS FLOWN," beginning on page 51,several key statements are made. These statements (along with comments by the principal author inbrackets) are as follows:
From paragraph 1: These data [tables 3.1 onward] are for the active fleet, as opposed to theregistered fleet data shown in preceding tables.

232
From paragraph 2: Beginning in 1977, General Aviation Aircraft Activity information [whererotorcraft are grouped] was obtained using the General Aviation Activity and Avionics Survey.Heretofore, the activity data were collected from each owner of a registered aircraft [principalauthor’s italics] using the Aircraft Registration, Eligibility, Identification, and Activity report.
From paragraph 3: [The General Aviation Activity and Avionics Survey, which replaced theAircraft Registration, Eligibility, Identification, and Activity report, used a sampling method.] Thesample of 31,208 aircraft was selected from approximately 234,000 registered general aviationaircraft. The sample is a scientifically designed random sample which represents all general aviationaircraft registered in the United States.
From paragraph 4: Because the estimates [of active aircraft and hours flown] are derivedfrom a sample—not the total population of aircraft—a certain amount of sampling error isintroduced. …Although the exact value of the sample error is unknown, a quantity known as thestandard error is used to approximate it [etc.].
From paragraph 5: If, for example, the estimate for the total number of active piston poweredrotorcraft were 2,658 and the standard error were 176, then the 95% confidence interval would be2,658 ± 2(176) or (2,306; 3010). One would say that there is a 95% chance that the number of activepiston-powered rotorcraft lies between 2,306 and 3,010.
From last paragraph: More detail estimates and a more detailed discussion of the survey andits method are available in the 1978 General Aviation Activity and Avionics Survey. [The firstGAAA Survey was conducted in 1978 to examine fleet activity for the calendar year 1977. Theresults were published in April 1979 as Report No. FAA-MS-79-5.]
The FAA initiative to unburden the public and save money in the data gathering effort by relyingmore heavily on statistical methods than it did in earlier years was not a blind step.* The reliance onthe General Aviation Activity and Avionics Survey appears to have been a smart decision even for1978 and 1979. However, as figures B-6 and B-7 show (see also tables D-21A, D-21B, and D-21C),the results throughout the 1980s, and so far in the 1990s, shows a diverging pattern of erraticbehavior that is not reflected in the total registered fleet census data of figures 8, 16, 45, or 73.
In itself, the erratic character of the FAA data shown in figures B-1 through B-7 may be consideredrelatively inconsequential by many people. After all, the major rotorcraft manufacturers maintainmuch more accurate records of where their rotorcraft are, what they are being used for, and thestatus of each type’s fleet hours. However, when potentially misleading FAA data are used as thedenominator in a safety ratio (such as accidents per 100,000 flight hours) and this ratio then createsa misleading impression—either way—a disservice is being done to the public and to the aviationindustry.
*The first GAAA Survey states in Paragraph 1.1.2, Background, that “Specifically, the public reporting burden wasreduced by an estimated 13,000 hours annually, and the cost savings to the public and Government were estimated to beone million dollars annually.” Figures 1.4, 1.5 and 1.6 of this first GAAA Survey show 1977 data obtained by the newstatistical methodology connected quite well with data from 1973, 1974, 1975, and 1976.

233
A more practical view of the statistical situation is given in figures B-8 and B-9. These two figuresshow that the error in hours flown using the General Aviation Activity and Avionics Survey methodadopted in 1978 might easily be ±30% for piston-powered rotorcraft and ±25% for turbine-poweredrotorcraft when calculated at constant active rotorcraft fleet size. More specifically, suppose infigure B-8, the active piston count in 1983 is truly 2,541 rotorcraft. Then the possibility exists thatthe hours flown in that year could be as low as 480,000 or as high as 790,000. Now, according to theNTSB’s report (see table D-1), 150 accidents occurred with piston-powered rotorcraft of all types in1983. Thus, the safety statistic could be anywhere from 150 accidents per 4.8 hundred thousandhours (i.e., 31 accidents per 100,000 hours) down to 150 accidents per 7.9 hundred thousand hours(i.e., 19 accidents per 100,000 hours).
The chronology of this ambiguity—a growing uncertainty of rotorcraft fleet flight hoursaccumulated in any given year and the number of rotorcraft actually flying—is documented in theGeneral Aviation Activity and Avionics Survey reports (1977 through 1997). Table D-22 provides adata summary from selected GAAA survey yearly reports to examine the chronology. To begin with,the first GAAA Survey (covering 1977) provided encouragement that a “statistically designedsample of about 14.4% of the registered general aviation fleet” would be accurate enough for FAApurposes. Data obtained by the new statistical method correlated reasonably well with data from1973, 1974, 1975, and 1976. For rotorcraft, instead of sending out 6,845 questionnaires (the censuscount after some culling to yield the approximate population), only 1,924 questionnaires were sent,which defined the “sample size” of 1,924 in table D-22. The 80.5% response rate yielded thestatisticians 1,548 returns from which the total “population’s” activity could be constructed. Resultsdifferentiating piston- from turbine-powered rotorcraft were obtained, but a breakdown to specificmake and model was not published; nor were results comparing single-turbine against multi-turbinepowered rotorcraft.
This first GAAA Survey was actually conducted in 1978 and was published in April 1979. Itcontained information of additional note. Again, principal author comments are in brackets.
1. “In 1978, the FAA replaced AC Form 8050-73 with a new system[Form 1800-54].” The new system changed the mandatory aircraft registrationrenewal requirement from once a year to a “triennial registration program.”(Par. 1.1.2)
2. The sample size was constructed using the Aircraft Registration MasterFile as of December 31, 1977. “This file is the official record of registered civilaircraft in the U.S., containing one record per aircraft. It accurately represents thecurrent civil air fleet, being updated continuously for new registrations, change inownership, etc.” (Par. 1.3.1)
3. The population “consisted of 212,598 general aviation aircraft recordsfrom which 30,643 records were sampled, yielding a 14.4% sample.” “These[figures] clearly demonstrate the disproportionality of the sample to the population,an intended result of the sample design to gain efficiency and to control errors.”(Par. 1.3.1)

234
4. “Errors associated with estimates derived from sample survey results fallinto two categories: sampling and non-sampling errors.” [Reference is made to theU.S. Dept. of Commerce, Bureau of the Census document entitled Standards forDiscussion and Presentation of Errors in Data, 1974, pp. I1–I4.] “Sampling errorsoccur because the estimates are based on a sample—not the entire population. Non-sampling errors arise from a number of sources such as non-response, inability orunwillingness of respondents to provide correct information [etc.].” (Par. 1.3.3)
5. A second mailing and telephone survey of a sample of non-respondentswere conducted in addition to the original mailing to improve the response rate,since a low response rate is a major cause of non-sampling error.” “[Ultimately]80% of those aircraft sampled responded to at least one question of the survey.” (Par.1.3.3.2)
As figure B-1 and table D-22 strongly suggest, the inadequacy of the “new system” and associatedGAAA Survey method quickly became evident. From 1977 to 1987, response rate dropped from80% to roughly 50%. The 1987 GAAA Survey, in its Appendix B, paragraph B.1, adequatelysummed up the dilemma the new system was creating by stating:
1. Instead of requiring all owners to revalidate and update their aircraftregistration annually, FAA required revalidation for only those owners who had notcontacted the registry for 3 years. The less frequent updating affected the accuracyof the file and its representativeness. Two major consequences for the survey resultsare discussed below:
A. The accuracy of owner’s addresses deteriorated causing the percentage ofquestionnaires returned by the post office to almost triple from 1977 to 1982.Post office returns have since increased to nearly 13% in 1987, of the originalsample of aircraft selected. This partially accounted for the lower surveyresponse rates experienced since 1977.
B. The [Aircraft Registration Master] file contained a residue of aircraftwhich under the old revalidation system would have been deregistered andpurged from the file, but remained under the new system. Consequently, thepopulation counts were inflated resulting in artificially large increases in theestimates of the number of active general aviation aircraft from 1977 to 1978,and from 1978 to 1979.
2. Also during this period the entire Aircraft Registration System wasinstalled on a new computer system. At the same time, FAA modified many of theupdating and processing procedures. It is quite possible that these changes affectedthe registration file, although it is not known in what way.
These three basic themes—points 1 and 1.A and 1.B above—along with a continued unsatisfactoryresponse rate of around 50% are repeated in each GAAA Survey report from 1987 to 1997. It shouldbe noted that at no time over this 20-year period did the FAA arbitrarily increase its sample sizefrom approximately 30,000, which might have offset the reduced response rate and increasing

235
number of post office returns. In 1977, the defined general aviation aircraft population was 212,598aircraft, 30,643 questionnaires were sent out and about 24,500 (i.e., 80% response rate) respondentsfilled in at least 1 blank on Form 1800-54. In 1987, the corresponding numbers were 267,400aircraft, 29,719, questionnaires and about 18,100 respondents (i.e., 61.1% response rate). By 1996,the defined population was 247,821 aircraft with 29,952 questionnaires sent out. The Post Officereturned 1,641 envelopes, and 19,362 responses were counted to give a response rate of 68.7%. Afootnote on page A-12 of the 1996 GAAA Survey report states that “The 68.7% response rate iscomputed by subtracting the Post Master Returns (1,641) and museum pieces (126) from the totalvalid sample size of 29,952.” This method change, among several others, as well as a recompilationof survey results over the 1987 to 1996 period (to account for a “nonresponse bias”) is discussed inthe 1996 GAAA Survey report. This 1996 report and the 1997 report are available at Web pagehttp://api.hq.faa.gov/apo_pubs.htm on the Internet.
From the rotorcraft industry point of view shown in table D-22, the statisticians began in 1988 todeflate the census count given by the Aircraft Registration Master File to arrive at the definedpopulation. Apparently dealing with an outdated, unpurged Master File was consideredunsatisfactory. How the size of the population and then the sample size were arrived at is, however,not clear. One thing is clear and that is: to statistically infer the activity of 8,000 to 12,000 rotorcraftfrom 750 to 1,500 responses is a very bold extrapolation—regardless of the perceived intentions “togain efficiency and to control errors.”
Safety statistics can be constructed, of course, at face value irrespective of the concerns about FAA-provided fleet hours raised in the preceding discussion. Some results, when approached in thisfashion, are provided in figures B-10, B-11, B-12, and B-13, based on the tabulations of table D-23.These results are provided without further discussion.
A very real danger exists given the possibility that safety statistical trends could be influenced andvaried as much as discussed above. For example, reference 22 notes that on 12 February 1997, theWhite House Gore Commission on Aviation Safety issued a report. Based upon therecommendations of this report, President William J. Clinton announced a national goal of reducingaviation fatal accident rate 80% over the next 10 years.*
One meaning to the rotorcraft community of this national goal can be interpreted first withfigure B-14 and, perhaps more familiarly in ratio form, with figure B-15. Figure B-14 shows thenumber of people who lost their lives each year in civil rotorcraft accidents in the United States.These are yearly fatalities as recorded by the NTSB—not the number of fatal accidents in the year orthe fatal accident rate referred to by President Clinton. These yearly fatalities are graphed with thesolid-black, circled points shown in the figure. These “data” are associated with the left-handvertical scale, as the arrow labeled Fatalities (NTSB) points out. The second set of data is the graphof hours accumulated in a year of flying by the active rotorcraft fleet in each year from 1965 through1997. This FAA published data use the × symbol and the right-hand vertical scale that the arrowlabeled Hours (FAA) points to. The hours are in units of 100,000. Note that the last 5 years of FAAdata were abruptly displaced downward relative to the preceding 5 or 7 years by about 25%. Thischange reflects the apparent decision to define the rotorcraft population independently of the * The actual goal contained in the FAA’s Strategic Plan aims to “ reduce the U.S. aviation fatal accident rate per aircraftdeparture, as measured by a 3-year moving average, by 80% from the 3-year average from 1994–1996” by 2007.

236
Aircraft Registration Master File census as discussed above and shown in table D-22 for years 1991,1992, and 1993.
The statistical ratio of fatalities per 100,000 hours is obtained for each year from figure B-14 bydividing the number of fatalities by the number of 100,000-hour units. The result of this division isshown in figure B-15 and table D-23. An exponential trend, shown as the heavy solid line in figureB-15, gives a sense of how the rotorcraft industry is generally improving despite considerable year-to-year ups and downs. The national goal announced by President Clinton could, in fact, be appliedto the fatality rate (i.e., fatalities per 100,000 hours—not fatal accidents per 100,000 hours). If thiswere done, then a reference point for 1997 might be 2.5 fatalities per100,000 hours, which lies at the end of the exponential trend line. Should the 80% goal then beapplied, it follows that the rotorcraft industry would be striving for less than 0.5 fatalities per100,000 hours by the year 2007.
Figure B-15 suggests an ambitious goal irrespective of accuracy questions concerning FAA fleetactivity data. Of course, the true aviation goal is—unquestionably—no fatalities or injuries.

237
0
500,
000
1,00
0,00
0
1,50
0,00
0
2,00
0,00
0
2,50
0,00
0
3,00
0,00
0 1960
1965
1970
1975
1980
1985
1990
1995
2000
Tot
alho
urs
flow
npe
r ye
arby
the
acti
vero
torc
raft
flee
t
Yea
r e
ndin
gF
igur
e B
-1. A
nnua
l hou
rs f
low
n by
the
act
ive
roto
rcra
ft f
leet
.
Upp
er t
rend
line L
ower
tre
nd li
ne
Ann
ual f
light
hour
s es
tim
ated
by t
he F
AA

238
0
500,
000
1,00
0,00
0
1,50
0,00
0
2,00
0,00
0
2,50
0,00
0
3,00
0,00
0
02,
000
4,00
06,
000
8,00
010
,000
12,0
0014
,000
1979
Tot
alho
urs
flow
npe
r ye
arby
the
acti
vero
torc
raft
flee
t
Tot
al r
egis
tere
d ro
torc
raft
(ac
tive
plu
s in
acti
ve)
Fig
ure
B-2
. Ann
ual h
ours
flo
wn
vs. r
egis
tere
d ro
torc
raft
yea
rly
coun
t.
1969
1964
1970
1997
1993
1991
Lin
ear
tren
dsi
nce
1979

239
0
500,
000
1,00
0,00
0
1,50
0,00
0
2,00
0,00
0
2,50
0,00
0
3,00
0,00
0 1965
1970
1975
1980
1985
1990
1995
2000
Tot
alho
urs
flow
npe
r ye
arby
acti
vero
torc
raft
type
Fig
ure
B-3
. Ann
ual h
ours
flo
wn
by r
otor
craf
t ty
pe.
Yea
r en
ding
Pis
ton
pow
ered
Tur
bine
pow
ered
Act
ive
flee
t to
tal

240
0
200,
000
400,
000
600,
000
800,
000
1,00
0,00
0
01,
000
2,00
03,
000
4,00
05,
000
6,00
07,
000
8,00
0
1977
1979
Tot
alho
urs
flow
npe
r ye
arby
the
acti
vepi
ston
pow
ered
flee
t
Tot
al r
egis
tere
d pi
ston
pow
ered
rot
orcr
aft
(ac
tive
plu
s in
acti
ve)
Fig
ure
B-4
. Ann
ual h
ours
flo
wn
vs. r
egis
tere
d pi
ston
pow
ered
rot
orcr
aft.
1970
1997 L
inea
rtr
end
sinc
e19
79

241
0
500,
000
1,00
0,00
0
1,50
0,00
0
2,00
0,00
0
2,50
0,00
0
01,
000
2,00
03,
000
4,00
05,
000
6,00
0
1979
Tot
alho
urs
flow
npe
r ye
arby
the
acti
vetu
rbin
epo
wer
edfl
eet
Tot
al r
egis
tere
d tu
rbin
e po
wer
ed r
otor
craf
t (
acti
ve p
lus
inac
tive
)
Fig
ure
B-5
. Ann
ual h
ours
flo
wn
vs. r
egis
tere
d tu
rbin
e po
wer
ed f
leet
.
1970
1997

242
0
1,00
0
2,00
0
3,00
0
4,00
0
5,00
0
6,00
0
7,00
0
8,00
0 1960
1965
1970
1975
1980
1985
1990
1995
2000
tabl
e D
-21A
tabl
e D
-21B
tabl
e D
-21C
Act
ive
roto
rcra
ftfl
eet
Yea
r en
ding
Fig
ure
B-6
. Tot
al a
ctiv
e ro
torc
raft
fle
et c
ount
by
year
(in
clud
ing
revi
sion
s).

243
0
1,00
0
2,00
0
3,00
0
4,00
0
5,00
0
6,00
0
7,00
0
8,00
0
02,
000
4,00
06,
000
8,00
010
,000
12,0
0014
,000
tabl
e D
-21A
tabl
e D
-21B
tabl
e D
-21C
1979
Act
ive
roto
rcra
ftfl
eet
Tot
al r
egis
tere
d ro
torc
raft
(ac
tive
plu
s in
acti
ve)
Fig
ure
B-7
. Act
ive
coun
t vs
. tot
al c
ount
by
year
(in
clud
ing
revi
sion
s).
1993
1994
1964
1997
Upp
er t
rend
of s
catt
er
Low
er t
rend
of s
catt
er

244
0
200,
000
400,
000
600,
000
800,
000
1,00
0,00
0
050
01,
000
1,50
02,
000
2,50
03,
000
3,50
0
tabl
e D
-21A
tabl
e D
-21B
tabl
e D
-21C
Act
ive
pist
on f
leet
cou
nt (
incl
udin
g re
visi
ons)
Fig
ure
B-8
. Ann
ual h
ours
flo
wn
by a
ctiv
e pi
ston
fle
et v
s. a
ctiv
e pi
ston
fle
et.
Tot
alho
urs
flow
npe
r ye
arby
the
acti
vepi
ston
flee
t
1997
Lin
ear
tre
nd
Lin
ear
tren
dpl
us 3
0 %
Lin
ear
tren
dm
inus
30
%

245
0
500,
000
1,00
0,00
0
1,50
0,00
0
2,00
0,00
0
2,50
0,00
0
01,
000
2,00
03,
000
4,00
05,
000
tabl
e D
-21A
tabl
e D
-21B
tabl
e D
-21C
Act
ive
turb
ine
flee
t co
unt
(inc
ludi
ng r
evis
ions
)
Fig
ure
B-9
. Ann
ual h
ours
flo
wn
by a
ctiv
e tu
rbin
e fl
eet
vs. a
ctiv
e tu
rbin
e fl
eet.
Tot
alho
urs
flow
npe
r ye
arby
the
acti
vetu
rbin
efl
eet
Lin
ear
tren
d
Lin
ear
tren
dpl
us 2
5 %
Lin
ear
tren
dm
inus
25
%

246
050100
150
200
250
300
350
05
1015
2025
30
Acc
iden
tspe
r ye
arfo
r th
eto
tal
flee
t
Hou
rs f
low
n pe
r ye
ar b
y th
e to
tal a
ctiv
e fl
eet
(100
,000
hrs
.)
Fig
ure
B-1
0. A
nnua
l acc
iden
t co
unt
vs. a
nnua
l hou
rs f
low
n fo
r th
e ac
tive
fle
et.
1970
1997
1979
1964
60 A
ccid
ents
per
100,
000
hrs
12 A
ccid
ents
per
100,
000
hrs
8 A
ccid
ents
per
100,
000
hrs

247
0510152025303540
1970
1975
1980
1985
1990
1995
2000
2005
2010
Pis
ton
pow
ered
roto
rcra
ftac
cide
nts
per
100,
000
hour
s
Yea
r en
ding
Fig
ure
B-1
1. A
n ac
cide
nt s
tati
stic
for
pis
ton
pow
ered
rot
orcr
aft.
Exp
onen
tial
tren
d
1997
92 A
ccid
ents
343,
841
Hrs
.
1996
86 A
ccid
ents
591,
000
Hrs
.
1995
91 A
ccid
ents
337,
000
Hrs
.
1994
116
Acc
iden
ts34
0,18
9 H
rs.

248
0246810121416
1970
1975
1980
1985
1990
1995
2000
2005
2010
Tur
bine
pow
ered
roto
rcra
ftac
cide
nts
per
100,
000
hour
s
Yea
r en
ding
Fig
ure
B-1
2. A
n ac
cide
nt s
tati
stic
for
tur
bine
pow
ered
rot
orcr
aft.
Exp
onen
tial
Tre
nd

249
010203040506070
1960
1965
1970
1975
1980
1985
1990
1995
2000
2005
2010
Rot
orcr
aft
acci
dent
spe
r10
0,00
0ho
urs
Yea
r en
ding
Fig
ure
B-1
3. A
n ac
cide
nt s
tati
stic
for
all
roto
rcra
ft.
8 ac
cide
nts
per
100,
000
hrs
by t
rend
Exp
onen
tial
Tre
nd

250
020406080100
120 19
6519
7019
7519
8019
8519
9019
9520
000102030405060
Yea
r en
ding
Fat
alit
ies
per
year
for
the
tota
lfl
eet
Fig
ure
B-1
4. R
otor
craf
t tr
ends
in f
atal
itie
s pe
r ye
ar a
nd a
nnua
l hou
rs f
low
n.
Hou
rsfl
own
per
year
by t
heto
tal
acti
vefl
eet
(100
,000
)
Fat
alit
ies
(NT
SB)
Hou
rs (
FA
A)
25 %

251
012345678 1960
1965
1970
1975
1980
1985
1990
1995
2000
2005
2010
Fat
alit
ies
per
100,
000
hour
s
Yea
r en
ding
Fig
ure
B-1
5. A
pos
sibl
e av
iati
on g
oal f
or r
otor
craf
t.
Exp
onen
tial
Tre
nd
2.5
fata
litie
s pe
r10
0,00
0 hr
sin
199
7fr
om t
rend
Yea
r 2
007
Goa
l0.
5 fa
talit
ies
per
100,
000
hrs

252
THIS PAGE INTENTIONALLY BLANK

253
Appendix CAUTOROTATION-RELATED ACCIDENTS
A fairly common issue for discussion among rotorcraft pilots, operators, designers,manufacturers, and regulators is the value of autorotation training. The question, similar toongoing discussions regarding spin training in fixed-wing aircraft, is whether autorotationtraining (with its inherent risks) would result in a reduction of autorotation accidents in case ofactual emergency. The NTSB database used in this study provides information that interestedparties can use to explore this issue.
For this analysis, accidents from 1987 through 1997 were extracted from the NTSB database.The accident summaries for the subgroup were searched for the terms “autorotation,”“autorotational,” and “autorotative.” Summaries with any of those terms were examined; if thesummary showed that the accident involved an autorotation, the information was placed on a newspreadsheet. After review of all such accidents, a new subgrouping containing autorotation-related accidents was available for use.
For the 11-year period under consideration (1987 through 1997), 713 accidents were identifiedas autorotation related. Of these, 401 (56.2%) involved piston-engine-powered rotorcraft, 295(41.4%) involved single-turbine-engine helicopters, and 17 (2.4%) involved twin-turbine-enginehelicopters. Annual numbers of autorotation-related accidents for each aircraft type and rates per1,000 airframes were also extracted and are presented in figures C-1 and C-2.
In figure C-2, the annual rate of autorotation accidents per 1000 aircraft varies about an averageof 8 per 1000 aircraft. What is interesting is that the rates are approximately the same for bothsingle-piston and turbine helicopters—in other words, this metric does not show an improvementresulting from the use of turbine engines over piston engines.
The long-term ratio of autorotation-related accidents to all accidents is 0.33 for the entirerotorcraft fleet, 0.32 for piston-engine rotorcraft, 0.39 for single-turbine helicopters, and 0.14 fortwins (fig. C-3). The yearly ratios for single turbines are consistently above the annual fleet ratio,whereas the ratios for piston rotorcraft generally remain below those of the entire fleet. Theratios are remarkably consistent from year to year. Even the twin-turbine ratios remain fairlyclose to the long-term type mean if 1993 and 1997 are disregarded. Thus, as a rule of thumb, onecan estimate that 35% of rotorcraft accidents involve an autorotation.
The question, “does the autorotation capability of rotorcraft decrease the severity of accidents(i.e., increase the survivability)?” may be raised. Figure C-4 shows two comparative ratios ofaccidents involving fatalities. The upper curve in figure C-4 gives the ratio of fatal accidents toall accidents. The lower curve on figure C-4 shows the ratio of fatal autorotation accidents to allautorotation accidents. The annual ratios of fatal autorotation-related accidents to totalautorotation accidents remain consistently below the corresponding ratio of fatal accidents to allaccidents. The difference in the long-term averages (0.09 for autorotations and 0.19 for all fatalaccidents) represents the survivability advantage provided by the ability to autorotate. In otherwords, if the accident sequence permits the pilot to enter autorotation, survival chances improve.

254
What are the reasons pilots enter autorotation? Figure C-5 shows the distribution of precipitatingevents that led to autorotation-related accidents. Two major events stand out: engine problemsand practice. The dominance of the single-engine rotorcraft types drives this characteristic.When flying a single-engine rotorcraft, the pilot normally reacts to any loss of engine power byentering autorotation. Figure C-5 shows that 21% of autorotations-related accidents take placeduring practice of the maneuver. However, it is important to note that this statistic (indeed all thepercentages shown on this chart) does not measure the risk per autorotation event, since, for themost part, successful autorotations are not reported. In addition, some autorotation accidents thattook place during practice autorotations actually involved some mechanical or operationalproblem, which turned the practice maneuver into an actual forced landing. This is also true forsome of the small number of autorotations during test flights. Figure C-6 amplifies figure C-5 byreallocating these actual forced landings during practice or test into the appropriate reason bin.When reallocated, practice autorotations account not for 21%, but for 17%.
This reallocation further increases the proportion of autorotation accidents precipitated by somesort of engine problem (i.e., from 44.18% in fig. C-5 to 47.41% in fig. C-6). It thus appears thatthe true proportion of accidents caused by poorly executed practice autorotations is about 17% to18%. Flight instructors, flight schools, pilot examiners, and regulators should seriously considerthis statistic when evaluating the risk of practice autorotations compared with the benefits itoffers in improved survivability.
Engine problems are further broken down to determine their underlying events in figure C-7.Mechanical failures are the major causal factor in both engine-problem-related autorotationaccidents and all autorotation accidents. Almost a quarter of all autorotations that resulted inaccidents are due to some mechanical failure of the engines. Further, and troubling, is that thereasons for one-quarter of the engine problems could not be determined. Additionally, as wasdiscussed in the main part of this report, fuel exhaustion (the principal problem directly underthe control of the pilot) accounted for nearly one-fifth of the autorotation-related accidents. Thelarge number of undetermined-cause accidents is troublesome, because without knowing whatactually took place, no corrective action can be proposed.
Figure C-8 depicts the first event categories that virtually describe the end of an unsuccessfulautorotation. Hard landings and collisions with the terrain are the major problems withautorotative landings. There is a degree of overlap between these categories. A basic distinctionis that a hard landing is normally a result of inadequate flare or collective pitch pull, whereascollision with the terrain implies either no flare or the existence of a terrain feature the pilotcould not avoid. In any event, it appears that these two problem areas can be considered togetherand, taken together, imply that the main difficulty in autorotative landings is judgment andapplication of the flare and collective pitch pull. Together, almost two-thirds of the autorotationaccidents involve hard landings or collisions. This is another consideration for instructors, flightschools, pilot examiners, and regulators in evaluating the benefits of practice autorotations inreducing errors during actual forced landings.
Further examination of the data led to developing a distribution of problems identified inautorotation accidents. The results of this examination are shown in figure C-9. A clearly evidentproblem is the difficulty in maintaining autorotational RPM. This factor relates to the hardlanding problem since low rotor RPM, especially in the flare, will almost inevitably result in ahard landing. This leads to a basic question: How can instructors, designers, manufacturers,

255
regulators, and pilots themselves improve RPM awareness and controllability (i.e., how to makelow RPM conditions more difficult to encounter or how to make corrections easier)?
The second major problem area identified by figure C-9 is difficulty in the flare. A successfulflare is the product of awareness of and correction for a wide variety of operational andenvironmental factors such as aircraft performance, wind, altitude, presence of obstacles, type ofterrain, and many others. The required situational awareness and judgment develops withpractice. However, as has been discussed above, the practice autorotation is itself a fairly riskymaneuver. Thus, a balance must be struck between the risks of autorotation practice and thebenefits of improved pilot performance.
Several key questions remain to be answered before the rotorcraft industry improves itsautorotation experience; several examples follow:
1 Given the risk and cost of aircraft-based autorotation training, is it really necessary?
2. Will the development and availability of low-cost, medium-fidelity small computer-based simulators permit initial and recurrent training, which will improve pilot performance?
3. Can currently available low-cost simulation systems provide the necessary fidelity forrealistic training?
4. Are there other possible methods of improving pilot performance during forcedlandings?
5. Can low-cost advanced pilot cueing systems be developed and fielded to improveRPM awareness and correction of low RPM conditions?
6. Can the pilot be provided “flare now” cues?
7. Can the pilot be provided cues to indicate that the aircraft is nearing or is inside the“avoid” areas of the height-velocity diagram?
It is not the purpose of this report to suggest specific systems. However, the hope is that bypresenting the reduced and analyzed autorotation data, the rotorcraft industry will haveinformation that is necessary to develop and implement the systematic changes required toreduce accidents.

256
Fig
ure
C-1
. Aut
orot
atio
n-re
late
d ac
cide
nts
by y
ear.
0102030405060708090
1987
1988
1989
1990
1991
1992
1993
1994
1995
1996
1997
Num
ber
of a
ccid
ents
Tot
al a
utor
otat
ion
acci
dent
s
Pis
ton
auto
rota
tion
acc
iden
ts
Sing
le-t
urbi
ne a
utor
otat
ion
acci
dent
s
Tw
in-t
urbi
ne a
utor
otat
ion
acci
dent
s
Yea
r e
ndin
g

257
Fig
ure
C-2
. Aut
orot
atio
n-re
late
d ac
cide
nts
per
1,00
0 ai
rfra
mes
024681012
1987
1988
1989
1990
1991
1992
1993
1994
1995
1996
1997
Aut
orot
atio
n ac
cide
nt r
ate/
1000
Air
fram
es:
all
Aut
orot
atio
n ac
cide
nt r
ate/
1000
air
fram
es:
pist
on
Aut
orot
atio
n ac
cide
nt r
ate/
1000
air
fram
es:
sing
le-t
urbi
ne
Aut
orot
atio
n ac
cide
nt r
ate/
1000
air
fram
es:
twin
-tur
bine
Yea
r e
ndin
g
Acc
iden
tspe
r1,
000
airf
ram
es

258
Fig
ure
C-3
. Aut
orot
atio
n-re
late
d ac
cide
nt/t
otal
acc
iden
t ra
tio.
0.0
0.1
0.2
0.3
0.4
0.5
0.6 19
8719
8819
8919
9019
9119
9219
9319
9419
9519
9619
97
Aut
orot
atio
n ac
cide
nts/
tota
l: a
ll
Aut
orot
atio
n ac
cide
nts/
all:
pis
ton
Aut
orot
atio
n ac
cide
nts/
all:
sin
gle-
turb
ine
Aut
orot
atio
n ac
cide
nts/
all:
tw
in-t
urbi
ne
Yea
r e
ndin
g
Rat
io

259
Fig
ure
C-4
. Aut
orot
atio
n-to
-tot
al a
utor
otat
ion
and
fata
l acc
iden
ts-t
o-to
tal a
ccid
ent
rati
os.
0.00
0.05
0.10
0.15
0.20
0.25
1987
1988
1989
1990
1991
1992
1993
1994
1995
1996
1997
Fat
al a
utor
otat
ion/
tota
l aut
orot
atio
n
Tot
al f
atal
/tot
al a
ccid
ents
Yea
r e
ndin
g
Rat
io

260
Fig
ure
C-5
. Rea
sons
for
aut
orot
atio
n.
0.3%
0.3%
0.3%
0.3%
0.4%
0.6%
0.6%1.
3%1.5%2.
0%
3.2%
5.6%
8.6%
9.8%
21.2
%
44.2
%
0%5%
10%
15%
20%
25%
30%
35%
40%
45%
50%
Air
fram
e F
ailu
re/F
ire
FO
D
Mai
n R
otor
Hit
Tai
l
Mid
air
Col
lisio
n
Flig
ht C
ontr
ol F
ailu
re
Los
s of
Con
trol
Not
Rep
orte
d
Dem
onst
rati
on
Tes
t
Col
lided
wit
h O
bsta
cles
Pre
caut
iona
ry L
andi
ng
Rot
or D
rive
Sys
tem
Fai
lure
Los
s of
Dir
ecti
onal
Con
trol
Fue
l Exh
aust
ion
Pra
ctic
e
Eng
ine
Fai
lure
or
Mal
func
tion

261
Fig
ure
C-6
. Rea
sons
for
aut
orot
atio
n (p
robl
ems
duri
ng p
ract
ice
dist
ribu
ted
to r
easo
ns).
0.3%
0.3%
0.3%
0.3%
0.4%
0.6%
0.7%1.
1%
1.3%2.
1%
3.4%
5.9%
8.6%
9.8%
17.7
%
47.4
%
0%5%
10%
15%
20%
25%
30%
35%
40%
45%
50%
Air
fram
e F
ailu
re/F
ire
FO
D
Mai
n R
otor
Hit
Tai
l
Mid
air
Col
lisio
n
Flig
ht C
ontr
ol F
ailu
re
Los
s of
Con
trol
Not
Rep
orte
d
Tes
t
Dem
onst
rati
on
Col
lided
wit
h O
bsta
cles
Pre
caut
iona
ry L
andi
ng
Rot
or D
rive
Sys
tem
Fai
lure
Los
s of
Dir
ecti
onal
Con
trol
Fue
l Exh
aust
ion
Pra
ctic
e
Eng
ine
Fai
lure
or
Mal
func
tion

262
Fig
ure
C-7
. Eng
ine
prob
lem
s in
volv
ed in
aut
orot
atio
n ac
cide
nts.
0.2%
0.2%
0.2%
0.2%0.5%
1.5%2.
2%
4.2%
5.6%6.
1%
17.2
%
25.0
%
36.8
%
0.1%
0.1%
0.1%
0.1%0.3%0.
8%1.3%
2.4%3.
2%3.5%
9.8%
14.3
%
21.0
%
0%5%
10%
15%
20%
25%
30%
35%
40%
Env
iron
men
tal
Fir
e
Fue
l Sys
tem
Wat
er in
Int
ake
Wro
ng F
uel
Err
oneo
us I
nstr
umen
t In
dica
tion
s
Impr
oper
Ope
rati
on o
f C
ontr
ols
Icin
g
Fue
l Sta
rvat
ion
Fue
l Con
tam
inat
ion
Fue
l Exh
aust
ion
Und
eter
min
ed
Mec
hani
cal
Per
cent
age
of t
otal
Per
cent
age
of e
ngin
e-re
late
d

263
Fig
ure
C-8
. Res
ults
of
auto
rota
tive
acc
iden
t la
ndin
gs.
0.1%
0.1%
0.3%
0.4%
0.6%1.
3%
1.4%
1.5%
1.5%
3.5%
10.1
%
14.0
%
20.9
%
44.2
%
0%5%
10%
15%
20%
25%
30%
35%
40%
45%
50%
Gro
und
Res
onan
ce
Non
Aut
orot
ativ
e L
andi
ng
Tai
l Boo
m F
ailu
re
Dra
gged
Tai
l
Gea
r C
olla
psed
Nos
e O
ver
Succ
essf
ul A
utor
otat
ive
Lan
ding
Mai
n R
otor
Hit
Tai
l
Not
Rep
orte
d
Dit
ched
Rol
l Ove
r
Col
lided
wit
h O
bsta
cles
Col
lided
wit
h T
erra
in/W
ater
Har
d L
andi
ng

264
Fig
ure
C-9
. Ide
ntif
ied
prob
lem
s in
aut
orot
atio
n m
isha
ps.
91011
14
24
27
33
55
66
106
020
4060
8010
012
0
Win
d C
ondi
tion
s
Poo
r V
isua
l Ref
eren
ces
Aut
orot
atio
n D
elay
ed/N
otP
erfo
rmed
Alt
itud
e A
war
enes
s
Out
side
Aut
orot
atio
n E
nvel
ope
Impr
oper
ly P
erfo
rmed
Aut
orot
atio
n
Impr
oper
Use
of
Con
trol
s-U
nspe
cifi
ed
No
Suit
able
Lan
ding
Are
a
Fla
re P
robl
ems
Rot
or R
PM
Not
Mai
ntai
ned

265
Appendix DOTHER STATISTICAL DATA TABLES
In preparing this report, the master data file was sorted into a number of data tables. Some of themost useful tables (tables D-1 through D-31) are included in this appendix. Most of figures 1through 109 were created from these tables.

266
THIS PAGE INTENTIONALLY BLANK

TA
BL
E D
-1.
NT
SB A
CC
IDE
NT
CO
UN
T B
Y Y
EA
R A
ND
TY
PE
Cou
nt
Cum
Com
mer
cial
ly m
anuf
actu
red
helic
opte
rsA
ll ot
her
roto
rcra
ft t
ypes
Yea
rpe
r y
ear
coun
t S
ingl
e P
isto
n S
ingl
e T
urbi
ne T
win
Tur
bine
Aut
o. m
an.
Am
ateu
r he
l.A
mat
eur
aut
o.U
nkno
wn
end
all t
ypes
all t
ypes
Per
yr
Cum
Per
yr
Cum
Per
yr
Cum
Per
yr
Cum
Per
yr
Cum
Per
yr
Cum
Per
yr
Cum
1963
44
00
22
22
00
00
00
00
1964
260
264
241
241
57
35
00
00
99
22
1965
243
507
223
464
512
16
88
00
413
24
1966
300
807
285
749
820
511
08
00
114
15
1967
239
1,04
622
197
015
352
130
80
00
141
619
6823
01,
276
200
1,17
026
612
150
80
01
151
719
6926
41,
540
217
1,38
745
106
217
08
00
015
07
1970
244
1,78
419
41,
581
4515
13
200
80
00
152
919
7122
02,
004
183
1,76
431
182
222
08
33
015
110
1972
248
2,25
215
71,
921
6224
45
277
152
514
291
1119
7328
72,
539
195
2,11
661
305
532
217
49
1746
314
1974
287
2,82
620
42,
320
5235
74
364
212
1118
643
1719
7531
53,
141
220
2,54
072
429
541
021
314
1175
421
1976
277
3,41
819
62,
736
5848
75
464
254
188
832
2319
7728
23,
700
187
2,92
372
559
1157
126
220
992
023
1978
328
4,02
821
63,
139
7763
615
721
273
2313
105
326
1979
296
4,32
418
13,
320
9072
66
780
276
2912
117
127
1980
327
4,65
117
13,
491
117
843
1290
128
736
1713
42
2919
8131
94,
970
168
3,65
912
296
58
982
305
4113
147
130
1982
303
5,27
314
83,
807
119
1,08
410
108
131
950
1416
12
3219
8327
35,
546
134
3,94
110
51,
189
1812
61
322
5210
171
335
1984
280
5,82
612
74,
068
119
1,30
820
146
133
557
717
81
3619
8523
86,
064
110
4,17
898
1,40
613
159
235
360
818
64
4019
8622
26,
286
112
4,29
081
1,48
718
177
237
161
619
22
4219
8719
66,
482
101
4,39
162
1,54
912
189
239
768
1120
31
4319
8820
76,
689
108
4,49
968
1,61
714
203
140
371
921
24
4719
8921
36,
902
106
4,60
572
1,68
918
221
444
677
521
72
4919
9022
67,
128
123
4,72
877
1,76
67
228
246
683
1022
71
5019
9119
27,
320
120
4,84
851
1,81
710
238
147
386
623
31
5119
9219
97,
519
106
4,95
461
1,87
810
248
047
1298
924
21
5219
9318
17,
700
945,
048
651,
943
725
51
483
101
624
85
5719
9421
17,
911
975,
145
832,
026
1226
72
507
108
325
17
6419
9516
58,
076
835,
228
612,
087
1328
00
505
113
225
31
6519
9618
58,
261
705,
298
872,
174
1229
20
5011
124
425
71
6619
9717
58,
436
735,
371
732,
247
1030
20
5013
137
426
12
68
267

TABLE D-2. CAA/FAA ROTORCRAFT CENSUS
Commercially manufactured helicopters Amateur/Census Total Total experimental
Year all Single Twin Single Twin helicopter autogyro total allend types piston piston turbine turbine mfg. mfg. types1952 150 150 0 0 0 150 0 01953 171 171 0 0 0 171 0 01954 192 192 0 0 0 192 0 01955 306 306 0 0 0 306 0 01956 413 413 0 0 0 413 0 01957 540 463 0 0 0 463 0 771958 700 576 0 14 1 591 0 1081959 882 713 1 20 1 735 9 1391960 1,096 817 1 88 2 908 9 1801961 1,331 1,006 0 87 10 1,103 9 2191962 1,606 1,211 2 83 18 1,314 9 2831963 1,915 1,501 2 52 25 1,580 8 3271964 2,196 1,717 0 59 29 1,805 17 3741965 2,390 1,830 0 66 29 1,925 54 411
1966 2,740 2,003 0 88 30 2,121 87 5321967 3,175 2,141 0 193 31 2,365 88 7221968 3,755 2,313 0 351 43 2,707 88 9601969 4,256 2,426 0 558 43 3,027 88 1,1411970 3,476 2,116 0 498 28 2,642 36 798
1971 3,892 2,328 1 621 33 2,983 36 873
1972 4,265 2,385 3 858 34 3,280 34 9511973 4,723 2,633 3 993 57 3,686 32 1,0051974 5,395 2,959 4 1,266 93 4,322 32 1,0411975 6,011 3,260 5 1,498 148 4,911 32 1,0681976 6,391 3,411 5 1,710 145 5,271 30 1,090
1977 6,855 3,558 5 1,976 145 5,684 28 1,1431978 7,688 3,763 47 2,377 172 6,359 26 1,3031979 8,380 3,942 47 2,701 205 6,895 28 1,4571980 9,012 4,041 47 3,111 261 7,460 29 1,523
1981 9,522 4,036 47 3,494 424 8,001 27 1,494
1982 9,733 3,897 47 3,745 562 8,251 28 1,4541983 10,047 3,960 47 3,829 646 8,482 27 1,5381984 10,416 3,980 47 3,975 773 8,775 27 1,6141985 10,539 4,000 47 3,965 844 8,856 28 1,6451986 10,530 3,983 47 3,856 914 8,800 27 1,7031987 10,374 3,909 46 3,688 932 8,575 27 1,7721988 10,153 3,840 46 3,518 872 8,276 28 1,8491989 10,445 3,920 46 3,574 942 8,482 27 1,9361990 10,646 3,993 46 3,590 965 8,594 26 2,0261991 10,834 4,037 45 3,676 1,051 8,809 31 1,9941992 10,952 4,061 45 3,681 1,078 8,865 33 2,0541993 11,144 4,061 45 3,676 988 8,770 29 2,3451994 11,459 4,114 45 3,888 1,061 9,109 29 2,3221995 11,785 4,110 45 4,114 1,051 9,322 35 2,4301996 12,354 4,172 45 4,410 1,091 9,720 35 2,6011997 12,911 4,220 45 4,722 1,108 10,097 34 2,782
* 1995, 1996, and 1997 are preliminary
268

Tab
le D
-3.
FA
TA
LIT
IES,
IN
JUR
IES
AN
D A
IRC
RA
FT
DA
MA
GE
(C
UM
UL
AT
IVE
)
Cum
Peo
ple
affe
cted
Rot
orcr
aft
dam
age
(S
= su
bsta
ntia
l, D
= d
estr
oyed
)Y
ear
acci
dent
Seri
ous
Min
or/
Sin
gle
pist
on S
ingl
e tu
rbin
e T
win
tur
bine
A
uto.
man
. A
mat
eur
hel.
Am
ateu
r a
uto.
U
nkno
wn
end
coun
tC
umK
illed
inju
ryno
neS
DS
DS
DS
DS
DS
DS
D19
634
226
016
00
20
11
00
00
00
00
1964
264
471
3344
394
187
526
14
10
00
06
32
019
6550
788
656
8474
636
110
08
45
16
20
09
43
119
6680
71,
462
102
146
1,21
457
516
914
610
16
20
09
54
119
671,
046
1,90
414
418
71,
573
745
220
2510
121
62
00
95
42
1968
1,27
62,
389
224
220
1,94
589
227
243
1712
36
20
09
65
219
691,
540
2,89
727
325
42,
370
1,05
732
374
3113
46
20
09
65
219
701,
784
3,37
629
827
82,
800
1,20
536
611
037
155
62
00
96
63
1971
2,00
43,
768
322
311
3,13
51,
334
418
136
4216
66
23
09
67
319
722,
252
4,30
638
635
13,
569
1,44
745
917
659
207
123
41
1810
83
1973
2,53
94,
881
433
404
4,04
41,
597
504
217
7722
714
37
229
168
619
742,
826
5,41
050
045
14,
459
1,72
857
525
194
248
174
92
4122
107
1975
3,14
16,
019
550
503
4,96
61,
892
630
308
108
2610
174
122
4925
138
1976
3,41
86,
552
614
581
5,35
72,
026
692
350
124
3110
205
153
5329
158
1977
3,70
07,
083
671
630
5,78
22,
164
741
397
143
3814
215
164
5833
158
1978
4,02
87,
713
749
698
6,26
62,
313
805
443
172
4719
225
185
6440
179
1979
4,32
48,
259
840
750
6,66
92,
446
848
507
197
5319
225
236
7145
189
1980
4,65
18,
927
942
813
7,17
22,
568
897
584
232
5724
226
306
8251
209
1981
4,97
09,
548
1,01
387
47,
661
2,68
594
865
927
159
2723
734
788
5821
919
825,
273
10,1
671,
101
952
8,11
42,
797
984
730
316
6232
238
3812
9664
2111
1983
5,54
610
,768
1,16
61,
013
8,58
92,
901
1,01
479
934
770
3824
839
1310
169
2213
1984
5,82
611
,382
1,24
61,
088
9,04
82,
988
1,05
088
037
980
4625
840
1710
473
2214
1985
6,06
411
,896
1,31
31,
162
9,42
13,
074
1,07
193
342
187
5227
843
1710
976
2317
1986
6,28
612
,435
1,41
41,
218
9,80
33,
154
1,10
197
545
699
5727
1043
1811
081
2319
1987
6,48
212
,832
1,48
31,
259
10,0
903,
229
1,12
51,
016
477
102
6329
1047
2111
884
2419
1988
6,68
913
,255
1,52
71,
320
10,4
083,
312
1,14
81,
061
497
107
6830
1048
2312
289
2522
1989
6,90
213
,681
1,59
11,
376
10,7
143,
388
1,17
71,
108
520
116
7733
1151
2612
492
2623
1990
7,12
814
,147
1,64
01,
427
11,0
803,
481
1,20
61,
157
541
120
7935
1157
2612
897
2723
1991
7,32
014
,558
1,71
01,
480
11,3
683,
572
1,23
51,
190
559
124
8436
1159
2713
110
027
2419
927,
519
14,9
511,
793
1,52
711
,631
3,65
31,
260
1,23
057
912
888
3611
6929
136
104
2725
1993
7,70
015
,321
1,86
61,
573
11,8
823,
719
1,28
51,
271
601
130
9137
1171
3013
810
830
2719
947,
911
15,7
631,
951
1,62
312
,189
3,79
21,
309
1,32
063
313
598
3812
7533
138
111
3628
1995
8,07
616
,080
1,99
71,
657
12,4
263,
857
1,32
61,
363
651
141
103
3812
8033
140
111
3728
1996
8,26
116
,437
2,06
31,
692
12,6
823,
910
1,34
31,
430
669
147
108
3812
8737
142
112
3828
1997
8,43
616
,825
2,13
51,
760
1293
03,
971
1,35
41,
468
702
152
112
3812
9542
145
113
4028
269

TA
BL
E D
-4.
AL
L R
OT
OR
CR
AF
T A
CC
IDE
NT
CO
UN
T B
Y Y
EA
R A
ND
BY
FIR
ST E
VE
NT
CA
TE
GO
RY
NT
SB f
irst
eve
nt c
ateg
ory
1963
1964
1965
1966
1967
1968
1969
1970
1971
1972
1973
1974
1975
1976
1977
1978
1979
1980
1981
1982
1983
1984
1985
Los
s of
eng
ine
pow
er2
5856
7964
5774
7272
6586
7710
486
8696
8098
107
9990
8285
In f
light
col
lisio
n w
ith o
bjec
t0
5052
7047
3845
5347
6151
5858
5142
5656
5238
3326
3634
Los
s of
con
trol
021
1716
2229
4226
2623
3833
2622
2620
1723
2248
4552
38
Air
fram
e/co
mpo
nent
/sys
tem
fai
lure
/mal
func
tion
122
2429
3031
2917
1927
3139
3642
3953
5356
4541
4730
20
Har
d la
ndin
g0
4231
2215
2721
2924
2228
2227
2628
2430
3331
1211
910
In f
light
col
lisio
n w
ith te
rrai
n/w
ater
019
2127
2013
1318
1712
2219
2913
2739
3023
3825
1922
13
Rol
love
r/no
seov
er0
1513
1012
1526
155
158
2428
3215
2320
2129
910
103
Wea
ther
00
04
23
00
11
10
00
00
21
117
818
11
Mis
cella
neou
s/ot
her
012
93
41
01
02
20
41
24
20
18
47
9
Prop
elle
r/ro
tor
cont
act t
o pe
rson
02
12
23
35
47
25
10
14
15
23
24
3
Stal
l/set
tling
with
pow
er0
910
2011
65
11
54
00
12
21
10
00
00
Mid
air
colli
sion
00
14
00
22
00
24
10
20
25
22
12
4
On
grou
nd/w
ater
col
lisio
n w
ith o
bjec
t0
34
56
02
03
24
10
02
30
00
30
30
Fire
/exp
losi
on0
21
11
10
21
32
21
33
10
62
03
22
Abr
upt m
aneu
ver
00
01
20
00
00
20
00
00
00
11
30
2
Gea
r co
llaps
ed1
12
30
11
10
21
10
02
01
10
02
01
Und
ersh
oot/o
vers
hoot
03
14
03
00
01
12
00
21
00
02
00
0
Dra
gged
win
g, r
otor
, pod
, flo
at o
r ta
il/sk
id0
00
00
00
00
00
00
00
00
00
01
01
Und
eter
min
ed0
10
01
21
10
02
00
02
21
20
00
10
On
grou
nd/w
ater
enc
ount
er w
ith te
rrai
n/w
ater
00
00
00
00
00
00
00
00
00
00
12
2
Mis
sing
00
00
00
01
00
00
00
10
00
00
00
0
Tot
al b
y ye
ar4
260
243
300
239
230
264
244
220
248
287
287
315
277
282
328
296
327
319
303
273
280
238
270

TA
BL
E D
-4.
AL
L R
OT
OR
CR
AF
T A
CC
IDE
NT
CO
UN
T B
Y Y
EA
R A
ND
BY
FIR
ST E
VE
NT
CA
TE
GO
RY
(CO
NC
LU
DE
D)
NT
SB F
irst
Eve
nt C
ateg
ory
1986
1987
1988
1989
1990
1991
1992
1993
1994
1995
1996
1997
Cum
Los
s of
eng
ine
pow
er65
5560
5662
4655
4361
3843
492,
408
In f
light
col
lisio
n w
ith o
bjec
t26
2118
3126
1222
2524
2419
201,
322
Los
s of
con
trol
3543
4940
4843
3141
4232
3246
1,11
4
Air
fram
e/co
mpo
nent
/sys
tem
fai
lure
/mal
func
tion
3226
3230
2629
2320
2228
3222
1,08
3
Har
d la
ndin
g8
1310
127
1612
716
1110
1065
6
In f
light
col
lisio
n w
ith te
rrai
n/w
ater
1110
816
1423
2219
1610
104
642
Rol
love
r/no
seov
er3
48
313
49
66
510
443
3
Wea
ther
189
96
94
87
56
35
159
Mis
cella
neou
s/ot
her
74
43
76
72
33
84
134
Prop
elle
r/ro
tor
cont
act t
o pe
rson
40
21
40
11
10
12
79
Stal
l/set
tling
with
pow
er0
00
00
00
00
02
283
Mid
air
colli
sion
22
13
52
01
40
32
61
On
grou
nd/w
ater
col
lisio
n w
ith o
bjec
t0
00
50
10
52
02
056
Fire
/exp
losi
on3
20
01
03
11
00
050
Abr
upt m
aneu
ver
35
32
12
10
20
10
32
Gea
r co
llaps
ed1
10
10
01
00
11
027
Und
ersh
oot/o
vers
hoot
11
00
10
00
00
10
24
Dra
gged
win
g, r
otor
, pod
, flo
at o
r ta
il/sk
id3
03
32
32
10
31
124
Und
eter
min
ed0
00
00
01
13
03
428
On
grou
nd/w
ater
enc
ount
er w
ith te
rrai
n/w
ater
00
01
01
11
34
30
19
Mis
sing
00
00
00
00
00
00
2T
otal
by
year
222
196
207
213
226
192
199
181
211
165
185
175
8,43
6
271

TA
BL
E D
-5.
MA
NU
FA
CT
UR
ER
SIN
GL
E-P
IST
ON
AC
CID
EN
T C
OU
NT
BY
YE
AR
AN
D B
Y F
IRST
EV
EN
T C
AT
EG
OR
Y
1963
1964
1965
1966
1967
1968
1969
1970
1971
1972
1973
1974
1975
1976
1977
1978
1979
1980
1981
1982
1983
1984
1985
NT
SB f
irst
eve
nt c
ateg
ory
Los
s of
eng
ine
pow
er0
5353
7460
5059
5359
4561
5681
6263
6642
5348
5149
3945
In f
light
col
lisio
n w
ith o
bjec
t0
4650
6942
3641
4741
4340
4842
4032
3738
3222
1913
1811
Los
s of
con
trol
020
1416
2026
3422
2010
2220
1313
1510
78
620
2019
16
Air
fram
e/co
mpo
nent
/sys
tem
fai
lure
/mal
func
tion
021
2228
3027
2415
1615
2126
2527
2631
3432
2917
1913
8
Har
d la
ndin
g0
3830
2013
2318
2321
1619
1219
1819
2220
2122
88
47
In f
light
col
lisio
n w
ith te
rrai
n/w
ater
019
1827
2012
817
156
1514
2011
1730
2111
2117
1113
9
Rol
love
r/no
seov
er0
1312
1011
1322
94
126
1517
217
1413
1016
77
53
Wea
ther
00
04
22
00
10
10
00
00
11
16
25
2
Mis
cella
neou
s/ot
her
011
92
41
00
01
10
20
11
10
03
16
4
Prop
elle
r/ro
tor
cont
act t
o pe
rson
02
12
21
11
33
13
00
02
10
10
02
1
Stal
l/set
tling
with
pow
er0
87
1911
65
10
13
00
12
10
10
00
00
Mid
air
colli
sion
00
13
00
22
00
04
00
00
10
00
00
0
On
grou
nd/w
ater
col
lisio
n w
ith o
bjec
t0
33
53
01
02
02
10
00
00
00
00
10
Fire
/exp
losi
on0
21
11
00
11
32
21
30
10
21
02
11
Abr
upt m
aneu
ver
00
01
20
00
00
00
00
00
00
10
10
0
Gea
r co
llaps
ed0
12
10
01
10
20
10
01
01
00
00
01
Und
ersh
oot/o
vers
hoot
03
03
03
00
00
02
00
20
00
00
00
0
Dra
gged
win
g, r
otor
, pod
, flo
at o
r ta
il/sk
id0
00
00
00
00
00
00
00
00
00
01
01
Und
eter
min
ed0
10
00
01
10
01
00
02
11
00
00
00
On
grou
nd/w
ater
enc
ount
er w
ith te
rrai
n/w
ater
00
00
00
00
00
00
00
00
00
00
01
1
Mis
sing
00
00
00
01
00
00
00
00
00
00
00
0
Tot
al b
y ye
ar0
241
223
285
221
200
217
194
183
157
195
204
220
196
187
216
181
171
168
148
134
127
110
Reg
iste
red
flee
t siz
e15
0117
1718
3020
0321
4123
1324
2621
1623
2823
8526
3329
5932
6034
1135
5837
6339
4240
4140
3638
9739
6039
8040
00A
ccid
ents
per
1,0
00 a
ircr
aft
140
122
142
103
8689
9279
6674
6967
5753
5746
4242
3834
3228
272

TA
BL
E D
-5.
MA
NU
FA
CT
UR
ER
SIN
GL
E-P
IST
ON
AC
CID
EN
T C
OU
NT
BY
YE
AR
AN
D B
Y F
IRST
EV
EN
T C
AT
EG
OR
Y (C
ON
CL
UD
ED
)
1986
1987
1988
1989
1990
1991
1992
1993
1994
1995
1996
1997
Cum
NT
SB f
irst
eve
nt c
ateg
ory
Los
s of
eng
ine
pow
er36
2835
2633
3031
2233
1519
241,
554
In f
light
col
lisio
n w
ith o
bjec
t14
1311
1715
911
1712
123
1295
3
Los
s of
con
trol
2019
2821
2629
1720
1921
1519
625
Air
fram
e/co
mpo
nent
/sys
tem
fai
lure
/mal
func
tion
1511
1413
1812
97
812
95
639
Har
d la
ndin
g5
94
84
108
511
85
548
3
In f
light
col
lisio
n w
ith te
rrai
n/w
ater
65
611
817
1211
35
52
443
Rol
love
r/no
seov
er1
34
19
46
42
34
229
0
Wea
ther
65
21
31
34
11
20
57
Mis
cella
neou
s/ot
her
33
22
33
31
21
21
74
Prop
elle
r/ro
tor
cont
act t
o pe
rson
20
01
10
11
00
00
33
Stal
l/set
tling
with
pow
er0
00
00
00
00
00
167
Mid
air
colli
sion
01
00
10
01
00
10
17
On
grou
nd/w
ater
col
lisio
n w
ith o
bjec
t0
00
20
10
01
01
026
Fire
/exp
losi
on0
00
00
01
01
00
028
Abr
upt m
aneu
ver
03
00
11
00
20
00
12
Gea
r co
llaps
ed1
00
00
01
00
11
016
Und
ersh
oot/o
vers
hoot
11
00
00
00
00
10
16
Dra
gged
win
g, r
otor
, pod
, flo
at o
r ta
il/sk
id2
02
31
31
10
31
120
Und
eter
min
ed0
00
00
01
01
01
112
On
grou
nd/w
ater
enc
ount
er w
ith te
rrai
n/w
ater
00
00
00
10
11
00
5
Mis
sing
00
00
00
00
00
00
1T
otal
by
yea
r11
210
110
810
612
312
010
694
9783
7073
5,37
1R
egis
tere
d f
leet
siz
e39
8339
0938
4039
2039
9340
3740
6140
6141
1441
1041
7242
20A
ccid
ents
per
1,0
00 a
ircr
aft
2826
2827
3130
2623
2420
1717
273

TA
BL
E D
-6.
MA
NU
FA
CT
UR
ER
SIN
GL
E-T
UR
BIN
E A
CC
IDE
NT
CO
UN
T B
Y Y
EA
R A
ND
BY
FIR
ST E
VE
NT
CA
TE
GO
RY
1963
1964
1965
1966
1967
1968
1969
1970
1971
1972
1973
1974
1975
1976
1977
1978
1979
1980
1981
1982
1983
1984
1985
NT
SB f
irst
eve
nt c
ateg
ory
Los
s of
eng
ine
pow
er2
33
43
715
1811
1518
1719
1915
2134
3949
4236
3733
In f
light
col
lisio
n w
ith o
bjec
t0
01
05
24
66
1510
714
99
1415
1713
1210
1421
Los
s of
con
trol
00
00
23
83
36
85
47
55
79
1214
1719
15
Air
fram
e/co
mpo
nent
/sys
tem
fai
lure
/mal
func
tion
00
01
01
30
36
66
98
914
917
1118
1613
8
Har
d la
ndin
g0
20
12
33
63
67
37
59
210
107
32
42
In f
light
col
lisio
n w
ith te
rrai
n/w
ater
00
00
01
51
24
34
71
97
78
146
58
4
Rol
love
r/no
seov
er0
00
01
24
61
32
99
97
66
612
23
50
Wea
ther
00
00
01
00
00
00
00
00
10
011
610
7
Mis
cella
neou
s/ot
her
00
00
00
01
01
10
10
12
00
15
21
3
Prop
elle
r/ro
tor
cont
act t
o pe
rson
00
00
02
24
14
01
10
12
04
11
22
1
Stal
l/set
tling
with
pow
er0
00
00
00
00
00
00
00
00
00
00
00
Mid
air
colli
sion
00
01
00
00
00
20
10
20
15
12
12
3
On
grou
nd/w
ater
col
lisio
n w
ith o
bjec
t0
01
01
01
01
12
00
01
30
00
20
10
Fire
/exp
losi
on0
00
00
10
00
00
00
03
00
11
01
11
Abr
upt m
aneu
ver
00
00
00
00
00
00
00
00
00
00
20
0
Gea
r co
llaps
ed0
00
10
10
00
00
00
00
00
00
01
00
Und
ersh
oot/o
vers
hoot
00
00
00
00
01
10
00
00
00
01
00
0
Dra
gged
win
g, r
otor
, pod
, flo
at o
r ta
il/sk
id0
00
00
00
00
00
00
00
00
00
00
00
Und
eter
min
ed0
00
01
20
00
01
00
00
10
10
00
10
On
grou
nd/w
ater
enc
ount
er w
ith te
rrai
n/w
ater
00
00
00
00
00
00
00
00
00
00
11
0
Mis
sing
00
00
00
00
00
00
00
10
00
00
00
0
Tot
al b
y y
ear
25
58
1526
4545
3162
6152
7258
7277
9011
712
211
910
511
998
Reg
iste
red
fle
et s
ize
5259
6688
193
351
558
498
621
858
993
1266
1498
1710
1976
2377
2701
3111
3494
3745
3829
3975
3965
Acc
iden
ts p
er 1
,000
air
craf
t85
7691
7874
8190
5072
6141
4834
3632
3338
3532
2730
25
274

TA
BL
E D
-6.
MA
NU
FA
CT
UR
ER
SIN
GL
E-T
UR
BIN
E A
CC
IDE
NT
CO
UN
T B
Y Y
EA
R A
ND
BY
FIR
ST E
VE
NT
CA
TE
GO
RY
(CO
NC
LU
DE
D)
1986
1987
1988
1989
1990
1991
1992
1993
1994
1995
1996
1997
Cum
NT
SB f
irst
eve
nt c
ateg
ory
Los
s of
eng
ine
pow
er24
2223
2726
1517
1622
1719
1670
4
In f
light
col
lisio
n w
ith o
bjec
t8
56
108
28
79
1115
529
8
Los
s of
con
trol
1215
137
118
412
146
1218
284
Air
fram
e/co
mpo
nent
/sys
tem
fai
lure
/mal
func
tion
138
1012
510
910
911
1512
282
Har
d la
ndin
g1
45
32
64
25
24
514
0
In f
light
col
lisio
n w
ith te
rrai
n/w
ater
23
02
44
85
104
41
143
Rol
love
r/no
seov
er1
12
24
03
24
05
211
9
Wea
ther
111
53
53
43
35
15
85
Mis
cella
neou
s/ot
her
10
11
42
31
12
43
42
Prop
elle
r/ro
tor
cont
act t
o pe
rson
10
10
20
00
10
01
35
Stal
l/set
tling
with
pow
er0
00
00
00
00
01
12
Mid
air
colli
sion
21
12
41
00
10
22
37
On
grou
nd/w
ater
col
lisio
n w
ith o
bjec
t0
00
00
00
40
00
018
Fire
/exp
losi
on2
20
01
00
10
00
015
Abr
upt m
aneu
ver
20
12
00
00
00
10
8
Gea
r co
llaps
ed0
00
00
00
00
00
03
Und
ersh
oot/o
vers
hoot
00
00
10
00
00
00
4
Dra
gged
win
g, r
otor
, pod
, flo
at o
r ta
il/sk
id1
00
00
01
00
00
02
Und
eter
min
ed0
00
00
00
12
01
213
On
grou
nd/w
ater
enc
ount
er w
ith te
rrai
n/w
ater
00
01
00
01
23
30
12
Mis
sing
00
00
00
00
00
00
1T
otal
by
yea
r81
6268
7277
5161
6583
6187
732,
247
Reg
iste
red
fle
et s
ize
3856
3688
3518
3574
3590
3676
3681
3676
3888
4114
4410
4722
Acc
iden
ts p
er 1
,000
air
craf
t21
1719
2021
1417
1821
1520
15
275

TA
BL
E D
-7.
MA
NU
FA
CT
UR
ER
TW
IN T
UR
BIN
E A
CC
IDE
NT
CO
UN
T B
Y Y
EA
R E
ND
AN
D B
Y F
IRST
EV
EN
T C
AT
EG
OR
Y
1963
1964
1965
1966
1967
1968
1969
1970
1971
1972
1973
1974
1975
1976
1977
1978
1979
1980
1981
1982
1983
1984
1985
NT
SB f
irst
eve
nt c
ateg
ory
Los
s of
eng
ine
pow
er0
00
10
00
11
10
00
05
20
12
01
55
In f
light
col
lisio
n w
ith o
bjec
t0
20
10
00
00
21
11
01
51
11
02
41
Los
s of
con
trol
00
10
00
00
10
00
11
11
01
03
25
2
Air
fram
e/co
mpo
nent
/sys
tem
fai
lure
/mal
func
tion
10
00
02
21
01
11
13
15
45
35
93
2
Har
d la
ndin
g0
10
10
00
00
00
10
00
00
01
01
00
In f
light
col
lisio
n w
ith te
rrai
n/w
ater
00
00
00
00
00
10
10
10
00
00
20
0
Rol
love
r/no
seov
er0
00
00
00
00
00
00
10
01
10
00
00
Wea
ther
00
00
00
00
00
00
00
00
00
00
02
2
Mis
cella
neou
s/ot
her
00
01
00
00
00
00
10
01
00
00
00
0
Prop
elle
r/ro
tor
cont
act t
o pe
rson
00
00
00
00
00
11
00
00
01
02
00
0
Stal
l/set
tling
with
pow
er0
00
00
00
00
00
00
00
00
00
00
00
Mid
air
colli
sion
00
00
00
00
00
00
00
00
00
10
00
1
On
grou
nd/w
ater
col
lisio
n w
ith o
bjec
t0
00
02
00
00
10
00
01
00
00
00
10
Fire
/exp
losi
on0
00
00
00
10
00
00
00
00
20
00
00
Abr
upt m
aneu
ver
00
00
00
00
00
00
00
00
00
00
00
0
Gea
r co
llaps
ed1
00
10
00
00
01
00
01
00
00
01
00
Und
ersh
oot/o
vers
hoot
00
00
00
00
00
00
00
01
00
00
00
0
Dra
gged
win
g, r
otor
, pod
, flo
at o
r ta
il/sk
id0
00
00
00
00
00
00
00
00
00
00
00
Und
eter
min
ed0
00
00
00
00
00
00
00
00
00
00
00
On
grou
nd/w
ater
enc
ount
er w
ith te
rrai
n/w
ater
00
00
00
00
00
00
00
00
00
00
00
0
Mis
sing
00
00
00
00
00
00
00
00
00
00
00
0
Tot
al b
y y
ear
23
15
22
23
25
54
55
1115
612
810
1820
13R
egis
tere
d f
leet
siz
e25
2929
3031
4343
2833
3457
9314
814
514
517
220
526
142
456
264
677
384
4A
ccid
ents
per
1,0
00 a
ircr
aft
103
34.5
167
64.5
46.5
46.5
107
60.6
147
87.7
4333
.834
.575
.987
.229
.346
18.9
17.8
27.9
25.9
15.4
276

TA
BL
E D
-7.
MA
NU
FA
CT
UR
ER
TW
IN T
UR
BIN
E A
CC
IDE
NT
CO
UN
T B
Y Y
EA
R E
ND
AN
D B
Y F
IRST
EV
EN
T C
AT
EG
OR
Y (C
ON
CL
UD
ED
)
1986
1987
1988
1989
1990
1991
1992
1993
1994
1995
1996
1997
Cum
NT
SB f
irst
eve
nt c
ateg
ory
Los
s of
eng
ine
pow
er2
10
01
12
12
21
139
In f
light
col
lisio
n w
ith o
bjec
t2
21
33
11
12
11
143
Los
s of
con
trol
20
24
12
01
14
04
40
Air
fram
e/co
mpo
nent
/sys
tem
fai
lure
/mal
func
tion
36
63
14
41
15
32
89
Har
d la
ndin
g2
00
00
00
00
01
08
In f
light
col
lisio
n w
ith te
rrai
n/w
ater
10
02
01
12
21
10
16
Rol
love
r/no
seov
er0
01
00
00
00
00
04
Wea
ther
11
12
10
10
10
00
12
Mis
cella
neou
s/ot
her
31
00
00
00
00
20
9
Prop
elle
r/ro
tor
cont
act t
o pe
rson
10
10
00
00
00
01
8
Stal
l/set
tling
with
pow
er0
00
00
00
00
01
01
Mid
air
colli
sion
00
01
01
00
20
00
6
On
grou
nd/w
ater
col
lisio
n w
ith o
bjec
t0
00
20
00
11
01
010
Fire
/exp
losi
on1
00
00
01
00
00
05
Abr
upt m
aneu
ver
01
10
00
00
00
00
2
Gea
r co
llaps
ed0
00
10
00
00
00
06
Und
ersh
oot/o
vers
hoot
00
00
00
00
00
00
1
Dra
gged
win
g, r
otor
, pod
, flo
at o
r ta
il/sk
id0
01
00
00
00
00
01
Und
eter
min
ed0
00
00
00
00
01
12
On
grou
nd/w
ater
enc
ount
er w
ith te
rrai
n/w
ater
00
00
00
00
00
00
0
Mis
sing
00
00
00
00
00
00
0T
otal
by
yea
r18
1214
187
1010
712
1312
1030
2R
egis
tere
d f
leet
siz
e91
493
287
294
296
510
5110
7898
810
6111
6312
0312
20A
ccid
ents
per
1,0
00 a
ircr
aft
19.7
12.9
16.1
19.1
7.25
9.51
9.28
7.09
11.3
11.2
9.98
8.2
277

TA
BL
E D
-8.
MA
NU
FA
CT
UR
ER
AU
TO
GY
RO
AC
CID
EN
T C
OU
NT
BY
YE
AR
AN
D B
Y F
IRST
EV
EN
T C
AT
EG
OR
Y
1963
1964
1965
1966
1967
1968
1969
1970
1971
1972
1973
1974
1975
1976
1977
1978
1979
1980
1981
1982
1983
1984
1985
NT
SB F
irst
Eve
nt C
ateg
ory
Los
s of
eng
ine
pow
er0
00
00
00
00
10
10
10
10
01
00
00
In f
light
col
lisio
n w
ith o
bjec
t0
01
00
00
00
00
00
10
00
00
00
00
Los
s of
con
trol
00
20
00
00
02
01
00
00
01
01
00
0
Air
fram
e/co
mpo
nent
/sys
tem
fai
lure
/mal
func
tion
00
10
00
00
01
01
01
10
00
00
00
0
Har
d la
ndin
g0
00
00
00
00
01
10
10
00
01
00
00
In f
light
col
lisio
n w
ith te
rrai
n/w
ater
00
10
00
00
01
10
00
00
00
00
00
0
Rol
love
r/no
seov
er0
01
00
00
00
00
00
00
00
00
00
00
Wea
ther
00
00
00
00
01
00
00
00
00
00
01
0
Mis
cella
neou
s/ot
her
00
00
00
00
00
00
00
00
00
00
10
0
Prop
elle
r/ro
tor
cont
act t
o pe
rson
00
00
00
00
00
00
00
00
00
00
00
1
Stal
l/set
tling
with
pow
er0
01
00
00
00
10
00
00
00
00
00
00
Mid
air
colli
sion
00
00
00
00
00
00
00
00
00
00
00
0
On
grou
nd/w
ater
col
lisio
n w
ith o
bjec
t0
00
00
00
00
00
00
00
00
00
00
00
Fire
/exp
losi
on0
00
00
00
00
00
00
00
00
00
00
00
Abr
upt m
aneu
ver
00
00
00
00
00
00
00
00
00
00
00
1
Gea
r co
llaps
ed0
00
00
00
00
00
00
00
00
00
00
00
Und
ersh
oot/o
vers
hoot
00
10
00
00
00
00
00
00
00
00
00
0
Dra
gged
win
g, r
otor
, pod
, flo
at o
r ta
il/sk
id0
00
00
00
00
00
00
00
00
00
00
00
Und
eter
min
ed0
00
00
00
00
00
00
00
00
00
00
00
On
grou
nd/w
ater
enc
ount
er w
ith te
rrai
n/w
ater
00
00
00
00
00
00
00
00
00
00
00
0
Mis
sing
00
00
00
00
00
00
00
00
00
00
00
0
Tot
al b
y y
ear
00
80
00
00
07
24
04
11
01
21
11
2
278
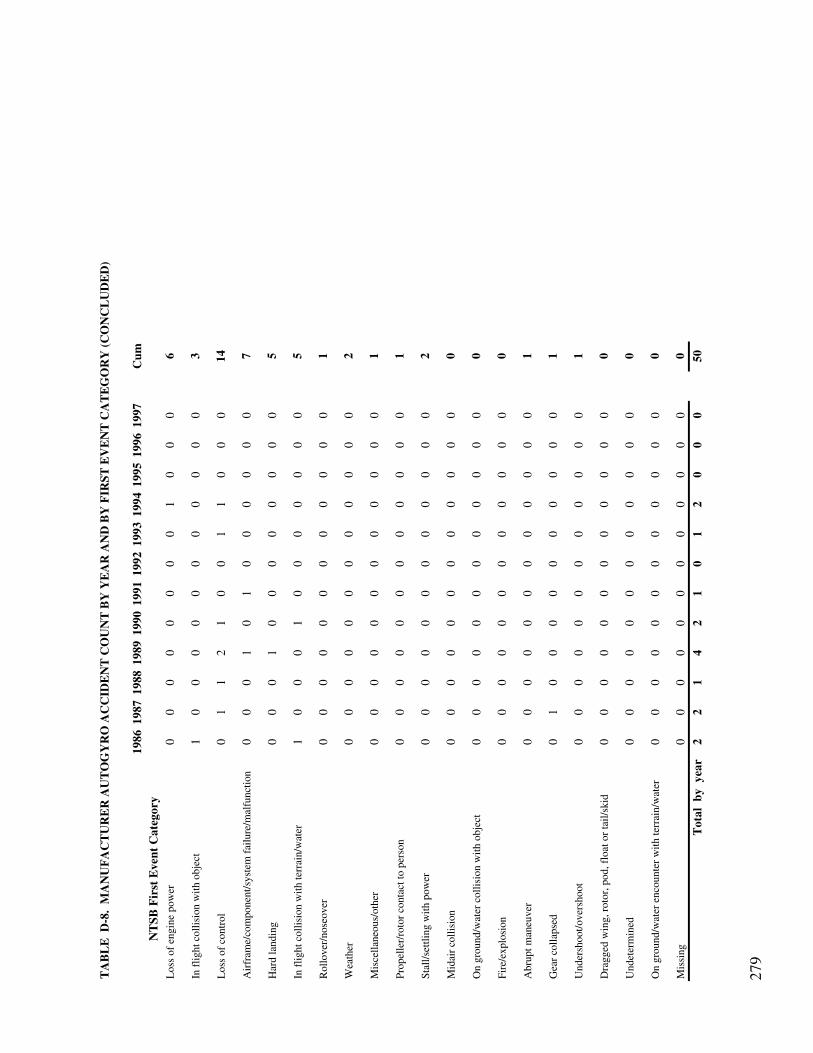
TA
BL
E D
-8.
MA
NU
FA
CT
UR
ER
AU
TO
GY
RO
AC
CID
EN
T C
OU
NT
BY
YE
AR
AN
D B
Y F
IRST
EV
EN
T C
AT
EG
OR
Y (C
ON
CL
UD
ED
)
1986
1987
1988
1989
1990
1991
1992
1993
1994
1995
1996
1997
Cum
NT
SB F
irst
Eve
nt C
ateg
ory
Los
s of
eng
ine
pow
er0
00
00
00
01
00
06
In f
light
col
lisio
n w
ith o
bjec
t1
00
00
00
00
00
03
Los
s of
con
trol
01
12
10
01
10
00
14
Air
fram
e/co
mpo
nent
/sys
tem
fai
lure
/mal
func
tion
00
01
01
00
00
00
7
Har
d la
ndin
g0
00
10
00
00
00
05
In f
light
col
lisio
n w
ith te
rrai
n/w
ater
10
00
10
00
00
00
5
Rol
love
r/no
seov
er0
00
00
00
00
00
01
Wea
ther
00
00
00
00
00
00
2
Mis
cella
neou
s/ot
her
00
00
00
00
00
00
1
Prop
elle
r/ro
tor
cont
act t
o pe
rson
00
00
00
00
00
00
1
Stal
l/set
tling
with
pow
er0
00
00
00
00
00
02
Mid
air
colli
sion
00
00
00
00
00
00
0
On
grou
nd/w
ater
col
lisio
n w
ith o
bjec
t0
00
00
00
00
00
00
Fire
/exp
losi
on0
00
00
00
00
00
00
Abr
upt m
aneu
ver
00
00
00
00
00
00
1
Gea
r co
llaps
ed0
10
00
00
00
00
01
Und
ersh
oot/o
vers
hoot
00
00
00
00
00
00
1
Dra
gged
win
g, r
otor
, pod
, flo
at o
r ta
il/sk
id0
00
00
00
00
00
00
Und
eter
min
ed0
00
00
00
00
00
00
On
grou
nd/w
ater
enc
ount
er w
ith te
rrai
n/w
ater
00
00
00
00
00
00
0
Mis
sing
00
00
00
00
00
00
0T
otal
by
yea
r2
21
42
10
12
00
050
279

TA
BL
E D
-9.
AM
AT
EU
R H
EL
ICO
PT
ER
AC
CID
EN
T C
OU
NT
BY
YE
AR
AN
D B
Y F
IRST
EV
EN
T C
AT
EG
OR
Y
1963
1964
1965
1966
1967
1968
1969
1970
1971
1972
1973
1974
1975
1976
1977
1978
1979
1980
1981
1982
1983
1984
1985
NT
SB f
irst
eve
nt c
ateg
ory
Los
s of
eng
ine
pow
er0
00
00
00
01
02
10
01
12
12
31
00
In f
light
col
lisio
n w
ith o
bjec
t0
00
00
00
00
00
00
00
00
00
00
00
Los
s of
con
trol
00
00
00
00
21
20
10
10
21
24
14
1
Air
fram
e/co
mpo
nent
/sys
tem
fai
lure
/mal
func
tion
00
00
00
00
01
00
02
00
20
00
00
0
Har
d la
ndin
g0
00
00
00
00
00
10
00
00
10
00
10
In f
light
col
lisio
n w
ith te
rrai
n/w
ater
00
00
00
00
00
00
11
00
01
02
00
0
Rol
love
r/no
seov
er0
00
00
00
00
00
01
10
10
31
00
00
Wea
ther
00
00
00
00
00
00
00
00
00
00
00
0
Mis
cella
neou
s/ot
her
00
00
00
00
00
00
00
00
00
00
00
2
Prop
elle
r/ro
tor
cont
act t
o pe
rson
00
00
00
00
00
00
00
00
00
00
00
0
Stal
l/set
tling
with
pow
er0
00
00
00
00
00
00
00
10
00
00
00
Mid
air
colli
sion
00
00
00
00
00
00
00
00
00
00
00
0
On
grou
nd/w
ater
col
lisio
n w
ith o
bjec
t0
00
00
00
00
00
00
00
00
00
00
00
Fire
/exp
losi
on0
00
00
00
00
00
00
00
00
00
00
00
Abr
upt m
aneu
ver
00
00
00
00
00
00
00
00
00
00
00
0
Gea
r co
llaps
ed0
00
00
00
00
00
00
00
00
00
00
00
Und
ersh
oot/o
vers
hoot
00
00
00
00
00
00
00
00
00
00
00
0
Dra
gged
win
g, r
otor
, pod
, flo
at o
r ta
il/sk
id0
00
00
00
00
00
00
00
00
00
00
00
Und
eter
min
ed0
00
00
00
00
00
00
00
00
00
00
00
On
grou
nd/w
ater
enc
ount
er w
ith te
rrai
n/w
ater
00
00
00
00
00
00
00
00
00
00
00
0
Mis
sing
00
00
00
00
00
00
00
00
00
00
00
0
Tot
al B
y Y
ear
00
00
00
00
32
42
34
23
67
59
25
3
280

TA
BL
E D
-9.
AM
AT
EU
R H
EL
ICO
PT
ER
AC
CID
EN
T C
OU
NT
BY
YE
AR
AN
D B
Y F
IRST
EV
EN
T C
AT
EG
OR
Y (C
ON
CL
UD
ED
)
1986
1987
1988
1989
1990
1991
1992
1993
1994
1995
1996
1997
Cum
NT
SB f
irst
eve
nt c
ateg
ory
Los
s of
eng
ine
pow
er0
31
10
04
12
32
840
In f
light
col
lisio
n w
ith o
bjec
t0
10
00
02
00
00
14
Los
s of
con
trol
02
04
21
32
20
42
44
Air
fram
e/co
mpo
nent
/sys
tem
fai
lure
/mal
func
tion
00
01
21
10
30
42
19
Har
d la
ndin
g0
00
01
00
00
00
04
In f
light
col
lisio
n w
ith te
rrai
n/w
ater
01
00
01
10
00
00
8
Rol
love
r/no
seov
er1
00
00
00
00
21
011
Wea
ther
00
10
00
00
00
00
1
Mis
cella
neou
s/ot
her
00
00
00
00
00
00
2
Prop
elle
r/ro
tor
cont
act t
o pe
rson
00
00
00
00
00
00
0
Stal
l/set
tling
with
pow
er0
00
00
00
00
00
01
Mid
air
colli
sion
00
00
00
00
00
00
0
On
grou
nd/w
ater
col
lisio
n w
ith o
bjec
t0
00
00
00
00
00
00
Fire
/exp
losi
on0
00
00
01
00
00
01
Abr
upt m
aneu
ver
00
10
00
00
00
00
1
Gea
r co
llaps
ed0
00
00
00
00
00
00
Und
ersh
oot/o
vers
hoot
00
00
00
00
00
00
0
Dra
gged
win
g, r
otor
, pod
, flo
at o
r ta
il/sk
id0
00
01
00
00
00
01
Und
eter
min
ed0
00
00
00
00
00
00
On
grou
nd/w
ater
enc
ount
er w
ith te
rrai
n/w
ater
00
00
00
00
00
00
0
Mis
sing
00
00
00
00
00
00
0T
otal
by
yea
r1
73
66
312
37
511
1313
7
281

TA
BL
E D
-10.
AM
AT
EU
R A
UT
OG
YR
O A
CC
IDE
NT
CO
UN
T B
Y Y
EA
R A
ND
BY
FIR
ST E
VE
NT
CA
TE
GO
RY
1963
1964
1965
1966
1967
1968
1969
1970
1971
1972
1973
1974
1975
1976
1977
1978
1979
1980
1981
1982
1983
1984
1985
NT
SB f
irst
eve
nt c
ateg
ory
Los
s of
eng
ine
pow
er0
20
00
00
00
35
23
32
51
45
33
12
In f
light
col
lisio
n w
ith o
bjec
t0
00
00
00
00
10
21
10
02
22
11
00
Los
s of
con
trol
01
00
00
00
04
55
51
44
13
25
34
3
Air
fram
e/co
mpo
nent
/sys
tem
fai
lure
/mal
func
tion
01
00
01
00
02
25
11
21
42
21
21
1
Har
d la
ndin
g0
11
00
00
00
01
30
10
00
10
10
01
In f
light
col
lisio
n w
ith te
rrai
n/w
ater
00
20
00
00
01
21
00
01
23
20
11
0
Rol
love
r/no
seov
er0
20
00
00
00
00
01
01
20
00
00
00
Wea
ther
00
00
00
00
00
00
00
00
00
00
00
0
Mis
cella
neou
s/ot
her
01
00
00
00
00
00
01
00
10
00
00
0
Prop
elle
r/ro
tor
cont
act t
o pe
rson
00
00
00
00
00
00
00
00
00
00
00
0
Stal
l/set
tling
with
pow
er0
11
10
00
00
31
00
00
01
00
00
00
Mid
air
colli
sion
00
00
00
00
00
00
00
00
00
00
00
0
On
grou
nd/w
ater
col
lisio
n w
ith o
bjec
t0
00
00
00
00
00
00
00
00
00
10
00
Fire
/exp
losi
on0
00
00
00
00
00
00
00
00
00
00
00
Abr
upt m
aneu
ver
00
00
00
00
00
10
00
00
00
01
00
0
Gea
r co
llaps
ed0
00
00
00
00
00
00
00
00
10
00
00
Und
ersh
oot/o
vers
hoot
00
00
00
00
00
00
00
00
00
01
00
0
Dra
gged
win
g, r
otor
, pod
, flo
at o
r ta
il/sk
id0
00
00
00
00
00
00
00
00
00
00
00
Und
eter
min
ed0
00
00
00
00
00
00
00
00
10
00
00
On
grou
nd/w
ater
enc
ount
er w
ith te
rrai
n/w
ater
00
00
00
00
00
00
00
00
00
00
00
1
Mis
sing
00
00
00
00
00
00
00
00
00
00
00
0
Tot
al b
y y
ear
09
41
01
00
014
1718
118
913
1217
1314
107
8
282

TA
BL
E D
-10.
AM
AT
EU
R A
UT
OG
YR
O A
CC
IDE
NT
CO
UN
T B
Y Y
EA
R A
ND
BY
FIR
ST E
VE
NT
CA
TE
GO
RY
(CO
NC
LU
DE
D)
1986
1987
1988
1989
1990
1991
1992
1993
1994
1995
1996
1997
Cum
NT
SB f
irst
eve
nt c
ateg
ory
Los
s of
eng
ine
pow
er1
11
11
01
10
01
052
In f
light
col
lisio
n w
ith o
bjec
t1
00
10
00
01
00
016
Los
s of
con
trol
16
42
73
63
11
13
88
Air
fram
e/co
mpo
nent
/sys
tem
fai
lure
/mal
func
tion
10
20
01
02
00
10
36
Har
d la
ndin
g0
01
00
00
00
10
012
In f
light
col
lisio
n w
ith te
rrai
n/w
ater
11
11
10
00
10
01
23
Rol
love
r/no
seov
er0
00
00
00
00
00
06
Wea
ther
02
00
00
00
00
00
2
Mis
cella
neou
s/ot
her
00
00
01
10
00
00
5
Prop
elle
r/ro
tor
cont
act t
o pe
rson
00
00
10
00
00
10
2
Stal
l/set
tling
with
pow
er0
00
00
00
00
00
08
Mid
air
colli
sion
00
00
00
00
00
00
0
On
grou
nd/w
ater
col
lisio
n w
ith o
bjec
t0
00
00
00
00
00
01
Fire
/exp
losi
on0
00
00
00
00
00
00
Abr
upt m
aneu
ver
11
00
01
10
00
00
6
Gea
r co
llaps
ed0
00
00
00
00
00
01
Und
ersh
oot/o
vers
hoot
00
00
00
00
00
00
1
Dra
gged
win
g, r
otor
, pod
, flo
at o
r ta
il/sk
id0
00
00
00
00
00
00
Und
eter
min
ed0
00
00
00
00
00
01
On
grou
nd/w
ater
enc
ount
er w
ith te
rrai
n/w
ater
00
00
00
00
00
00
1
Mis
sing
00
00
00
00
00
00
0T
otal
by
yea
r6
119
510
69
63
24
426
1
283

TA
BL
E D
-11.
UN
KN
OW
N C
ON
FIG
UR
AT
ION
AC
CID
EN
T C
OU
NT
BY
YE
AR
AN
D B
Y F
IRST
EV
EN
T C
AT
EG
OR
Y
1963
1964
1965
1966
1967
1968
1969
1970
1971
1972
1973
1974
1975
1976
1977
1978
1979
1980
1981
1982
1983
1984
1985
NT
SB f
irst
eve
nt c
ateg
ory
Los
s of
eng
ine
pow
er0
00
01
00
00
00
01
10
01
00
00
00
In f
light
col
lisio
n w
ith o
bjec
t0
20
00
00
00
00
00
00
00
00
10
01
Los
s of
con
trol
00
00
00
01
00
12
20
00
00
01
21
1
Air
fram
e/co
mpo
nent
/sys
tem
fai
lure
/mal
func
tion
00
10
00
01
01
10
00
02
00
00
10
1
Har
d la
ndin
g0
00
00
10
00
00
11
10
00
00
00
00
In f
light
col
lisio
n w
ith te
rrai
n/w
ater
00
00
00
00
00
00
00
01
00
10
00
0
Rol
love
r/no
seov
er0
00
00
00
00
00
00
00
00
10
00
00
Wea
ther
00
00
00
00
00
00
00
00
00
00
00
0
Mis
cella
neou
s/ot
her
00
00
00
00
00
00
00
00
00
00
00
0
Prop
elle
r/ro
tor
cont
act t
o pe
rson
00
00
00
00
00
00
00
00
00
00
00
0
Stal
l/set
tling
with
pow
er0
01
00
00
01
00
00
00
00
00
00
00
Mid
air
colli
sion
00
00
00
00
00
00
00
00
00
00
00
0
On
grou
nd/w
ater
col
lisio
n w
ith o
bjec
t0
00
00
00
00
00
00
00
00
00
00
00
Fire
/exp
losi
on0
00
00
00
00
00
00
00
00
10
00
00
Abr
upt m
aneu
ver
00
00
00
00
00
10
00
00
00
00
00
1
Gea
r co
llaps
ed0
00
00
00
00
00
00
00
00
00
00
00
Und
ersh
oot/o
vers
hoot
00
01
00
00
00
00
00
00
00
00
00
0
Dra
gged
win
g, r
otor
, pod
, flo
at o
r ta
il/sk
id0
00
00
00
00
00
00
00
00
00
00
00
Und
eter
min
ed0
00
00
00
00
00
00
00
00
00
00
00
On
grou
nd/w
ater
enc
ount
er w
ith te
rrai
n/w
ater
00
00
00
00
00
00
00
00
00
00
00
0
Mis
sing
00
00
00
00
00
00
00
00
00
00
00
0
Tot
al b
y y
ear
02
21
11
02
11
33
42
03
12
12
31
4
284

TA
BL
E D
-11.
UN
KN
OW
N C
ON
FIG
UR
AT
ION
AC
CID
EN
T C
OU
NT
BY
YE
AR
AN
D B
Y F
IRST
EV
EN
T C
AT
EG
OR
Y (
CO
NC
LU
DE
D)
1986
1987
1988
1989
1990
1991
1992
1993
1994
1995
1996
1997
Cum
NT
SB f
irst
eve
nt c
ateg
ory
Los
s of
eng
ine
pow
er2
00
11
00
21
11
013
In f
light
col
lisio
n w
ith o
bjec
t0
00
00
00
00
00
15
Los
s of
con
trol
00
10
00
12
40
00
19
Air
fram
e/co
mpo
nent
/sys
tem
fai
lure
/mal
func
tion
01
00
00
00
10
01
11
Har
d la
ndin
g0
00
00
00
00
00
04
In f
light
col
lisio
n w
ith te
rrai
n/w
ater
00
10
00
01
00
00
4
Rol
love
r/no
seov
er0
01
00
00
00
00
02
Wea
ther
00
00
00
00
00
00
0
Mis
cella
neou
s/ot
her
00
10
00
00
00
00
1
Prop
elle
r/ro
tor
cont
act t
o pe
rson
00
00
00
00
00
00
0
Stal
l/set
tling
with
pow
er0
00
00
00
00
00
02
Mid
air
colli
sion
00
00
00
00
10
00
1
On
grou
nd/w
ater
col
lisio
n w
ith o
bjec
t0
00
10
00
00
00
01
Fire
/exp
losi
on0
00
00
00
00
00
01
Abr
upt m
aneu
ver
00
00
00
00
00
00
2
Gea
r co
llaps
ed0
00
00
00
00
00
00
Und
ersh
oot/o
vers
hoot
00
00
00
00
00
00
1
Dra
gged
win
g, r
otor
, pod
, flo
at o
r ta
il/sk
id0
00
00
00
00
00
00
Und
eter
min
ed0
00
00
00
00
00
00
On
grou
nd/w
ater
enc
ount
er w
ith te
rrai
n/w
ater
00
00
01
00
00
00
1
Mis
sing
00
00
00
00
00
00
0T
otal
by
yea
r2
14
21
11
57
11
268
285

TA
BL
E D
-12.
LO
SS O
F E
NG
INE
PO
WE
R B
Y T
YP
E A
ND
SU
BC
AT
EG
OR
Y
Sing
le p
isto
n
Sin
gle
turb
ine
Tw
in t
urbi
ne
All
othe
r ty
pes
Tot
als
Los
s of
eng
ine
pow
er1,
554
704
3911
124
08
Mec
h fa
ilur
e/m
alf
413
293
2253
781
N
on-m
echa
nica
l73
522
711
3510
08
Und
eter
min
ed40
618
46
2361
9
Sub
- C
ateg
ory
Cla
ssif
icat
ion
Eng
ine
stru
ctur
e26
318
915
2849
5F
uel /
Air
Mix
ture
Rel
ated
686
299
1740
1042
F
uel e
xhau
stio
n32
682
18
417
F
uel c
onta
min
atio
n97
431
414
5
Fue
l sta
rvat
ion
7226
54
107
C
arbu
reto
r he
at70
00
676
F
uel s
yste
m67
923
1017
2
Fue
l con
trol
4227
37
79
Fue
l im
prop
er6
30
110
I
nduc
tion
air
sys
tem
626
40
36O
ther
Sys
tem
s10
117
116
135
I
gnit
ion
syst
em69
00
1382
L
ubri
cati
ng s
yste
m24
151
343
A
cces
sory
dri
ve a
ssy
82
00
10R
otor
Dri
ve S
yste
m53
70
262
C
lutc
h as
sem
bly
331
01
35
Tra
nsm
issi
on to
mai
n ro
tor
141
00
15
Eng
ine
to tr
ansm
issi
on d
rive
44
01
9
Fre
ewhe
elin
g un
it2
10
03
Oth
er S
ub-c
ateg
orie
s54
110
065
S
imul
ated
pow
er f
ailu
re36
80
044
R
otor
rpm
not
mai
ntai
ned
183
00
21U
ndet
erm
ined
/Oth
er39
718
16
2560
9
286

TA
BL
E D
-13.
AIR
FR
AM
E/C
OM
PO
NE
NT
/SY
STE
M F
AIL
UR
E/M
AL
FU
NC
TIO
N B
Y T
YP
E A
ND
SU
BC
AT
EG
OR
Y
Sing
lepi
ston
Sing
letu
rbin
eT
win
turb
ine
All
othe
rty
pes
Tot
als
Cnt
.%
Cnt
.%
Cnt
.%
Cnt
.%
Cnt
.%
Dri
ve t
rain
-mai
n12
920
.244
15.6
1314
.67
9.6
193
17.8
Dri
ve t
rain
-tai
l11
117
.455
19.5
1820
.26
8.2
190
17.5
Mai
n ro
tor
548.
525
8.9
1516
.918
24.7
112
10.3
Tai
l rot
or11
317
.719
6.7
89.
02
2.7
142
13.1
Con
trol
sys
tem
-mai
n64
10.0
3111
.011
12.4
1115
.111
710
.8
Con
trol
sys
tem
-tai
l35
5.5
196.
78
9.0
00.
062
5.7
Air
fram
e50
7.8
3612
.814
15.7
79.
610
79.
9
Lan
ding
gea
r23
3.6
20.
71
1.1
34.
129
2.7
Oth
er60
9.4
5118
.11
1.1
1926
.013
112
.1
Tot
als
639
282
8973
1083
287

TA
BL
E D
-14.
LO
S O
F C
ON
TR
OL
BY
TY
PE
AN
D S
UB
CA
TE
GO
RY
Sing
lepi
ston
Sing
letu
rbin
eT
win
turb
ine
All
othe
r ty
pes
Tot
als
Cnt
.%
Cnt
.%
Cnt
.%
Cnt
.%
Cnt
.%
Impr
oper
ope
rati
on o
f co
ntro
ls20
933
.482
28.9
820
.070
42.4
369
33.1
Low
rot
or R
PM
105
16.8
82.
81
2.5
137.
912
711
.4W
inds
7211
.528
9.9
512
.58
4.8
113
10.1
Und
eter
min
ed44
7.0
3211
.34
10.0
2012
.110
09.
0A
ttac
hed/
snag
ged
to g
rd. e
quip
.38
6.1
3010
.63
7.5
00.
071
6.4
Flig
ht c
ontr
ol f
ailu
re/d
efic
ienc
y33
5.3
144.
96
15.0
116.
764
5.7
Wei
ght/
CG
294.
614
4.9
00.
02
1.2
454.
0L
oss
of v
isua
l ref
./spa
tial
dis
orie
nt.
213.
436
12.7
717
.50
0.0
645.
7U
nqua
lifie
d op
erat
or20
3.2
62.
10
0.0
2917
.655
4.9
Air
fram
e/co
mp.
/sys
. fai
l. or
mal
f.13
2.1
72.
51
2.5
63.
627
2.4
Inad
equa
te p
refl
ight
pla
nnin
g12
1.9
51.
80
0.0
10.
618
1.6
Oth
er9
1.4
82.
81
2.5
00.
018
1.6
FO
D8
1.3
72.
52
5.0
10.
618
1.6
Air
craf
t pe
rfor
man
ce6
1.0
31.
10
0.0
00.
09
0.8
Pas
seng
er in
terf
eren
ce4
0.6
10.
41
2.5
00.
06
0.5
Pilo
t im
pair
men
t/in
capa
cita
tion
20.
33
1.1
12.
54
2.4
100.
9T
otal
s62
528
440
165
1114
288

TA
BL
E D
-15.
IN
FL
IGH
T C
OL
LIS
ION
WIT
H O
BJE
CT
BY
TY
PE
AN
D S
UB
CA
TE
GO
RY
Sing
lepi
ston
Sing
letu
rbin
eT
win
turb
ine
All
othe
r ty
pes
Tot
als
Cnt
.%
Cnt
.%
Cnt
.%
Cnt
.%
Cnt
.%
Wir
e31
032
.510
836
.213
30.2
1035
.744
133
.4W
ire/
pole
197
20.7
248.
10
0.0
517
.922
617
.1T
ree(
s)14
815
.550
16.8
716
.36
21.4
211
16.0
Pol
e/pi
pe47
4.9
196.
42
4.7
00.
068
5.1
Cro
p35
3.7
10.
30
0.0
00.
036
2.7
Veh
icle
353.
74
1.3
00.
00
0.0
393.
0A
irpo
rt/h
elip
ad f
acili
ty32
3.4
206.
712
27.9
00.
064
4.8
Roc
k/br
ush/
terr
ain
303.
111
3.7
12.
31
3.6
433.
3B
uild
ing
272.
85
1.7
12.
31
3.6
342.
6F
ence
/fen
ce p
ost
262.
720
6.7
24.
70
0.0
483.
6F
OD
192.
013
4.4
12.
32
7.1
352.
6A
ircr
aft
141.
54
1.3
24.
71
3.6
211.
6U
nspe
cifi
ed o
bjec
t10
1.0
20.
70
0.0
13.
613
1.0
Ele
ctro
nic
tow
er8
0.8
93.
02
4.7
00.
019
1.4
Mis
cella
neou
s8
0.8
10.
30
0.0
00.
09
0.7
Bir
d st
rike
70.
77
2.3
00.
01
3.6
151.
1T
otal
s95
329
843
2813
22
289

TA
BL
E D
-16.
HA
RD
LA
ND
ING
PL
US
IN F
LIG
HT
CO
LL
ISIO
N W
ITH
TE
RR
AIN
/WA
TE
R P
LU
S R
OL
LO
VE
R/N
OSE
OV
ER
BY
TY
PE
AN
D S
UB
CA
TE
GO
RY
Sing
lepi
ston
Sing
letu
rbin
eT
win
turb
ine
All
othe
r ty
pes
Tot
alC
nt.
%C
nt.
%C
nt.
%C
nt.
%C
nt.
%P
ract
ice/
dem
o au
toro
tati
on31
826
.289
22.1
310
.71
1.2
411
23.7
Mis
judg
ed a
ltit
ude/
spee
d/de
scen
t ra
te/d
ista
nce/
flar
e23
119
.098
24.4
828
.625
29.4
362
20.9
Impr
oper
ope
rati
on o
f fl
ight
/thr
ottl
e/po
wer
con
trol
s19
716
.249
12.2
621
.426
30.6
278
16.1
Fai
led
to m
aint
ain
adeq
uate
rot
or R
PM
174
14.3
246.
02
7.1
1112
.921
112
.2A
dver
se/u
nfav
orab
le w
eath
er/w
ind
786.
447
11.7
414
.35
5.9
134
7.7
Em
erge
ncy/
prec
auti
onar
y la
ndin
g71
5.8
143.
50
0.0
11.
286
5.0
Oth
er c
ause
s43
3.5
266.
54
14.3
910
.682
4.7
Sele
cted
uns
uita
ble
terr
ain
342.
824
6.0
00.
03
3.5
613.
5L
ift-
off
rest
rict
ed35
2.9
205.
00
0.0
22.
457
3.3
Impr
oper
wei
ght/
cg24
2.0
51.
21
3.6
11.
231
1.8
Poo
rly
mai
ntai
ned/
Air
fram
e fa
ilure
110.
96
1.5
00.
01
1.2
181.
0T
otal
s12
1640
228
8517
31
290

TA
BL
E D
-17.
AL
L O
TH
ER
RO
TO
RC
RA
FT
TY
PE
S A
CC
IDE
NT
CO
UN
T B
Y Y
EA
R A
ND
BY
FIR
ST E
VE
NT
CA
TE
GO
RY
1963
1964
1965
1966
1967
1968
1969
1970
1971
1972
1973
1974
1975
1976
1977
1978
1979
1980
1981
1982
1983
1984
1985
NT
SB f
irst
eve
nt c
ateg
ory
Los
s of
eng
ine
pow
er0
20
01
00
01
47
44
53
74
58
64
12
In f
light
col
lisio
n w
ith o
bjec
t0
21
00
00
00
10
21
20
02
22
21
01
Los
s of
con
trol
01
20
00
01
27
88
81
54
35
411
69
5
Air
fram
e/co
mpo
nent
/sys
tem
fai
lure
/mal
func
tion
01
20
01
01
05
36
14
33
62
21
31
2
Har
d la
ndin
g0
11
00
10
00
02
61
30
00
21
10
11
In f
light
col
lisio
n w
ith te
rrai
n/w
ater
00
30
00
00
02
31
11
02
24
32
11
0
Rol
love
r/no
seov
er0
21
00
00
00
00
02
11
30
41
00
00
Wea
ther
00
00
00
00
01
00
00
00
00
00
01
0
Mis
cella
neou
s/ot
her
01
00
00
00
00
00
01
00
10
00
10
2
Prop
elle
r/ro
tor
cont
act t
o pe
rson
00
00
00
00
00
00
00
00
00
00
00
1
Stal
l/set
tling
with
pow
er0
13
10
00
01
41
00
00
11
00
00
00
Mid
air
colli
sion
00
00
00
00
00
00
00
00
00
00
00
0
On
grou
nd/w
ater
col
lisio
n w
ith o
bjec
t0
00
00
00
00
00
00
00
00
00
10
00
Fire
/exp
losi
on0
00
00
00
00
00
00
00
00
10
00
00
Abr
upt m
aneu
ver
00
00
00
00
00
20
00
00
00
01
00
2
Gea
r co
llaps
ed0
00
00
00
00
00
00
00
00
10
00
00
Und
ersh
oot/o
vers
hoot
00
11
00
00
00
00
00
00
00
01
00
0
Dra
gged
win
g, r
otor
, pod
, flo
at o
r ta
il/sk
id0
00
00
00
00
00
00
00
00
00
00
00
Und
eter
min
ed0
00
00
00
00
00
00
00
00
10
00
00
On
grou
nd/w
ater
enc
ount
er w
ith te
rrai
n/w
ater
00
00
00
00
00
00
00
00
00
00
00
1
Mis
sing
00
00
00
00
00
00
00
00
00
00
00
0
Tot
al b
y y
ear
011
142
12
02
424
2627
1818
1220
1927
2126
1614
17R
egis
tere
d f
leet
siz
e32
737
441
153
272
296
011
4179
887
395
110
0510
4110
6810
9011
4313
0314
5715
2314
9414
5415
3816
1416
45A
ccid
ents
per
1,0
00 a
ircr
aft
29.4
34.1
3.76
1.39
2.08
02.
514.
5825
.225
.925
.916
.916
.510
.515
.313
17.7
14.1
17.9
10.4
8.67
10.3
291

TA
BL
E D
-17.
AL
L O
TH
ER
RO
TO
RC
RA
FT
TY
PE
S A
CC
IDE
NT
CO
UN
T B
Y Y
EA
R A
ND
BY
FIR
ST E
VE
NT
CA
TE
GO
RY
(CO
NC
LU
DE
D)
1986
1987
1988
1989
1990
1991
1992
1993
1994
1995
1996
1997
Cum
NT
SB f
irst
eve
nt c
ateg
ory
Los
s of
eng
ine
pow
er3
42
32
05
44
44
811
1
In f
light
col
lisio
n w
ith o
bjec
t2
10
10
02
01
00
228
Los
s of
con
trol
19
68
104
108
81
55
165
Air
fram
e/co
mpo
nent
/sys
tem
fai
lure
/mal
func
tion
11
22
23
12
40
53
73
Har
d la
ndin
g0
01
11
00
00
10
025
In f
light
col
lisio
n w
ith te
rrai
n/w
ater
22
21
21
11
10
01
40
Rol
love
r/no
seov
er1
01
00
00
00
21
020
Wea
ther
02
10
00
00
00
00
5
Mis
cella
neou
s/ot
her
00
10
01
10
00
00
9
Prop
elle
r/ro
tor
cont
act t
o pe
rson
00
00
10
00
00
10
3
Stal
l/set
tling
with
pow
er0
00
00
00
00
00
013
Mid
air
colli
sion
00
00
00
00
10
00
1
On
grou
nd/w
ater
col
lisio
n w
ith o
bjec
t0
00
10
00
00
00
02
Fire
/exp
losi
on0
00
00
01
00
00
02
Abr
upt m
aneu
ver
11
10
01
10
00
00
10
Gea
r co
llaps
ed0
10
00
00
00
00
02
Und
ersh
oot/o
vers
hoot
00
00
00
00
00
00
3
Dra
gged
win
g, r
otor
, pod
, flo
at o
r ta
il/sk
id0
00
01
00
00
00
01
Und
eter
min
ed0
00
00
00
00
00
01
On
grou
nd/w
ater
enc
ount
er w
ith te
rrai
n/w
ater
00
00
01
00
00
00
2
Mis
sing
00
00
00
00
00
00
0T
otal
By
Yea
r11
2117
1719
1122
1519
816
1951
6R
egis
tere
d F
leet
Siz
e17
0317
7218
4919
3620
2619
9420
5423
4523
2126
2527
9829
79A
ccid
ents
per
1,0
00 a
ircr
aft
6.5
11.9
9.2
8.8
9.4
5.5
10.7
6.4
8.2
3.0
5.7
6.4
292

TA
BL
E D
-18.
HA
RD
LA
ND
ING
BY
TY
PE
AN
D S
UB
CA
TE
GO
RY
Sing
lepi
ston
Sing
letu
rbin
eT
win
turb
ine
All
othe
r ty
pes
Tot
alC
nt.
%C
nt.
%C
nt.
%C
nt.
%C
nt.
%P
ract
ice/
dem
o au
toro
tati
on23
648
.976
54.3
337
.50
0.0
315
48.0
Mis
judg
ed a
ltit
ude/
spee
d/de
scen
t ra
te/d
ista
nce/
flar
e54
11.2
1812
.90
0.0
1144
.083
12.7
Fai
led
to m
aint
ain
adeq
uate
rot
or R
PM
5611
.610
7.1
00.
03
12.0
6910
.5E
mer
genc
y/pr
ecau
tion
ary
land
ing
489.
912
8.6
00.
00
0.0
609.
1A
dver
se/u
nfav
orab
le w
eath
er/w
ind
326.
611
7.9
225
.02
8.0
477.
2Im
prop
er o
pera
tion
of
flig
ht/t
hrot
tle/
pow
er c
ontr
ols
347.
05
3.6
225
.04
16.0
456.
9O
ther
cau
ses
234.
88
5.7
112
.55
20.0
375.
6T
otal
s48
314
08
2565
6
293

TABLE D-19. LOSS OF ENGINE POWER STATISTICSLoss of All
Single Single Twin All other power accidentsPeople involved piston turbine turbine types totals totals
Fatal 106 129 16 17 257 2,135Serious 234 237 26 23 494 1,760Minor/none 2,281 1,480 99 93 3,879 12,930Total 2,621 1,846 141 133 4,630 16,825
Aircraft damageNone 0 10 1 0 11 78Minor 3 9 4 1 17 85Substantial 1,286 546 21 82 1,935 5,909Destroyed 265 139 13 28 445 2,363Unkown 0 0 0 0 0 1Total 1,554 704 39 111 2,408 8,436
Flight activityUnknown/not reported 2 3 0 0 5 22Public/military use 27 16 0 0 43 183Executive/corporate 26 33 3 0 62 203Flight/maintenance test 30 26 3 9 68 239Ferry/reposition 80 53 5 1 139 389Business use 97 71 4 3 175 581Instructional/training 173 15 0 14 202 1,198Passenger service 117 215 11 0 343 1,161Personal use 231 58 1 80 370 1,351General utility 277 162 11 3 453 1,457Aerial application 494 52 1 1 548 1,652Total 1,554 704 39 111 2,408 8,436
Phase of operation (common nomenclature)Standing/static 1 2 0 0 3 250Unknown 3 1 0 1 5 89Taxi 10 0 0 1 11 238Other 18 5 0 1 24 108Climb 35 15 2 4 56 128Descent 72 24 2 5 103 259Landing 60 33 2 13 108 1,359Hover 53 58 8 2 121 757Approach 87 64 2 14 167 467Takeoff 280 104 8 26 418 1,405Maneuvering 328 84 2 8 422 1,519Cruise 607 314 13 36 970 1,857Total 1,554 704 39 111 2,408 8,436
294

TA
BL
E D
-20.
FA
A R
OT
OR
CR
AF
T C
EN
SUS
AN
D H
OU
RS
FL
OW
N P
ER
YE
AR
(R
EF
. TA
BL
ES
D-2
1 A
, B, C
)
Cen
sus
Cen
sus
Cen
sus
Cen
sus
Cen
sus
Cen
sus
all
all
all
all
all
all
Hou
rs f
low
n pe
r ye
ar b
y ac
tive
rot
orcr
aft
Yea
rre
gist
ered
acti
vere
gist
ered
acti
vere
gist
ered
acti
veT
otal
All
All
end
type
sty
pes
pist
ons
pist
ons
turb
ines
turb
ines
flee
tpi
ston
turb
ine
Ref
eren
ce
1964
2,19
61,
325
2,10
51,
266
9159
447,
000
????
FA
A S
tat.
Han
dboo
k of
Av.
,196
5, T
able
5.1
1965
2,39
01,
525
2,29
01,
456
100
6945
0,00
0??
??F
AA
Sta
t. H
andb
ook
of A
v.,1
966,
Tab
le 5
.119
662,
740
1,65
22,
614
1,56
412
688
492,
000
????
FA
A S
tat.
Han
dboo
k of
Av.
,196
7, T
able
5.2
1967
3,17
51,
925
2,84
41,
733
231
192
538,
000
????
FA
A S
tat.
Han
dboo
k of
Av.
,196
8, T
able
5.2
1968
3,75
52,
373
3,35
52,
033
400
340
617,
000
????
FA
A S
tat.
Han
dboo
k of
Av.
,196
9, T
able
9.7
1969
4,25
62,
584
3,64
22,
065
614
519
778,
000
????
Tab
le 3
0, 1
969
1970
3,47
62,
275
2,79
31,
669
683
606
844,
268
543,
062
301,
206
GA
Act
ivit
y an
d A
vion
ics
Sur
vey
(R. F
ox)
1971
3,89
22,
375
3,09
51,
692
797
683
869,
400
516,
891
352,
509
GA
Act
ivit
y an
d A
vion
ics
Sur
vey
(R. F
ox)
1972
4,26
52,
787
3,37
31,
957
892
830
1,01
8,52
359
1,13
842
7,38
5G
A A
ctiv
ity
and
Avi
onic
s S
urve
y (R
. Fox
)19
734,
723
3,14
33,
673
2,15
71,
050
986
1,16
9,00
065
4,00
051
5,00
0C
ensu
s T
able
3.7
, 197
919
745,
395
3,59
74,
036
2,31
51,
359
1,28
21,
426,
000
729,
000
697,
000
Cen
sus
Tab
le 3
.7, 1
979
1975
6,01
14,
054
4,36
52,
498
1,64
61,
556
1,48
2,00
068
6,00
079
6,00
0C
ensu
s T
able
3.7
, 197
919
766,
391
4,42
54,
536
2,70
11,
855
1,72
41,
703,
000
753,
000
950,
000
Cen
sus
Tab
le 3
.7, 1
979
1977
6,85
54,
726
4,73
42,
658
2,12
12,
067
1,86
8,00
060
9,00
01,
259,
000
Cen
sus
Tab
le 3
.7, 1
979
1978
7,68
85,
315
5,13
92,
822
2,54
92,
492
2,22
7,65
180
6,41
01,
421,
241
Cen
sus
Tab
le 3
.6, 1
979,
198
3, 1
984,
199
119
798,
380
5,86
45,
474
3,12
32,
906
2,74
02,
555,
000
892,
000
1,66
4,00
0C
ensu
s T
able
3.7
, 198
4 &
1991
1980
9,01
26,
001
5,64
02,
794
3,37
23,
207
2,33
8,00
073
6,00
01,
603,
000
Cen
sus
Tab
le 3
.7, 1
989
1981
9,52
26,
974
5,60
43,
250
3,91
83,
724
2,68
5,00
093
0,00
01,
754,
000
Cen
sus
Tab
le 3
.7, 1
991
1982
9,73
36,
169
5,42
62,
419
4,30
73,
749
2,35
0,00
057
9,00
01,
771,
000
Cen
sus
Tab
le 3
.7, 1
991
1983
10,0
476,
540
5,57
22,
541
4,47
53,
998
2,27
1,00
057
2,00
01,
700,
000
Cen
sus
Tab
le 3
.8, 1
993
1984
10,4
167,
096
5,66
82,
936
4,74
84,
160
2,49
5,00
059
2,00
01,
903,
000
Cen
sus
Tab
le 3
.8, 1
993
1985
10,5
396,
000
5,72
02,
700
4,80
93,
300
1,99
0,00
052
1,00
01,
468,
000
Cen
sus
Tab
le 3
.8, 1
993*
1986
10,5
306,
500
5,76
02,
700
4,77
03,
800
2,42
4,00
074
2,00
01,
682,
000
Cen
sus
Tab
le 3
.8, 1
993*
1987
10,3
745,
900
5,75
42,
600
4,62
03,
300
2,10
8,00
060
2,00
01,
506,
000
Cen
sus
Tab
le 3
.8, 1
993*
1988
10,1
536,
000
5,76
32,
400
4,39
03,
600
2,50
7,00
053
3,00
01,
974,
000
Cen
sus
Tab
le 3
.8, 1
993*
1989
10,4
457,
000
5,92
93,
000
4,51
64,
000
2,61
0,00
069
2,00
01,
918,
000
Cen
sus
Tab
le 3
.8, 1
993*
1990
10,6
466,
900
6,09
13,
200
4,55
53,
700
2,20
9,00
071
6,00
01,
493,
000
Cen
sus
Tab
le 3
.8, 1
993*
1991
10,8
346,
292
6,10
72,
470
4,72
73,
822
2,75
7,00
058
5,00
02,
172,
000
Cen
sus
Tab
le 3
.8, 1
993*
1992
10,9
525,
753
6,19
32,
211
4,75
93,
542
2,28
3,00
041
6,00
01,
866,
000
Cen
sus
Tab
le 3
.8, 1
993*
1993
11,1
444,
510
6,48
01,
646
4,66
42,
864
1,83
2,00
037
0,00
01,
462,
000
Cen
sus
Tab
le 3
.8, 1
994
1994
11,4
594,
390
6,51
01,
381
4,94
93,
009
2,00
6,00
034
0,00
01,
666,
000
Cen
sus
Tab
le 3
.8, 1
994
1995
11,7
855,
830
6,62
01,
863
5,16
53,
967
1,96
1,00
033
7,00
01,
624,
000
GA
Act
ivit
y S
urve
y, T
able
1.5
, 199
719
9612
,354
6,57
06,
853
2,50
75,
501
4,06
32,
122,
000
591,
000
1,53
1,00
0G
A A
ctiv
ity
Sur
vey,
Tab
le 1
.5, 1
997
1997
12,9
116,
786
7,08
12,
259
5,83
04,
527
2,08
3,69
934
3,84
11,
739,
858
GA
Act
ivit
y S
urve
y, T
able
1.4
, 199
7
*Ear
lier
dat
a re
vise
d [d
ownw
ard]
to c
orre
ct f
or n
onre
spon
sive
bia
s
295

TA
BL
E D
-21A
. F
AA
RO
TO
RC
RA
FT
CE
NSU
SH
ours
flo
wn
per
year
by
acti
ve r
otor
craf
tA
llA
llA
llA
llA
llA
llT
otal
All
All
Yea
rre
gist
ered
acti
vere
g.ac
tive
reg.
acti
veac
tive
acti
veac
tive
end
type
sty
pes
pist
ons
pist
ons
turb
ines
turb
ines
Ref
eren
cefl
eet
pist
ontu
rbin
eR
efer
ence
1964
2,19
61,
325
2,10
51,
266
9159
Tab
le 1
, 196
444
7,00
0??
??F
AA
Sta
t. H
andb
ook
of A
viat
ion,
1965
, Tab
le 5
.1
1965
2,39
01,
525
2,29
01,
456
100
69T
able
1, 1
965
450,
000
????
FA
A S
tat.
Han
dboo
k of
Avi
atio
n,19
66, T
able
5.1
1966
2,74
01,
652
2,61
41,
564
126
88T
able
1, 1
966
492,
000
????
FA
A S
tat.
Han
dboo
k of
Avi
atio
n,19
67, T
able
5.2
1967
3,17
51,
925
2,84
41,
733
231
192
Tab
le 1
, 196
753
8,00
0??
??F
AA
Sta
t. H
andb
ook
of A
viat
ion,
1968
, Tab
le 5
.2
1968
3,75
52,
373
3,35
52,
033
400
340
Tab
le 1
, 196
861
7,00
0??
??F
AA
Sta
t. H
andb
ook
of A
viat
ion,
1969
, Tab
le 9
.7
1969
4,25
62,
584
3,64
22,
065
614
519
Tab
le 1
, 196
977
8,00
057
3,00
020
5,00
0T
able
30,
196
9
1970
3,47
62,
275
2,79
31,
669
683
606
Tab
le 6
, 197
0, 1
971
867,
000
552,
000
315,
000
Tab
le 2
9, 1
971/
1970
1971
3,89
22,
375
3,09
51,
692
797
683
Tab
le 6
, 197
0, 1
971
891,
000
527,
000
364,
000
Tab
le 2
9A, 1
971/
1970
1972
4,26
52,
787
3,37
31,
957
892
830
Tab
le 2
1, 1
972
1,01
8,52
359
1,13
842
7,38
5T
able
29,
197
2
1973
4,72
33,
143
3,67
32,
157
1,05
098
6T
able
20,
1973
1,16
9,00
065
4,00
051
5,00
0T
able
3.7
, 197
9
1974
5,39
53,
623
4,03
62,
332
1,35
91,
291
Tab
le 6
,197
41,
426,
000
729,
000
697,
000
Tab
le 3
.7, 1
979
1975
6,01
14,
085
4,36
52,
502
1,64
61,
583
Tab
le 6
,197
51,
482,
000
686,
000
796,
000
Tab
le 3
.7, 1
979
1976
6,39
14,
513
4,53
62,
753
1,85
51,
760
Tab
le 6
,197
61,
703,
000
753,
000
950,
000
Tab
le 3
.7, 1
979
TA
BL
E D
-21B
. F
AA
RO
TO
RC
RA
FT
CE
NSU
SH
ours
flo
wn
per
year
by
acti
ve r
otor
craf
t
All
All
All
All
All
All
Tot
alA
llA
ll
Yea
rre
gist
ered
acti
vere
g.ac
tive
reg.
acti
veac
tive
acti
veac
tive
end
type
sty
pes
pist
ons
pist
ons
turb
ines
turb
ines
Ref
eren
cefl
eet
pist
ontu
rbin
eR
efer
ence
1973
4,72
33,
115
3,67
32,
122
1,05
099
3T
able
3.5
,197
91,
169,
000
654,
000
515,
000
Tab
le 3
.7, 1
979
1974
5,39
53,
597
4,03
62,
315
1,35
91,
282
Tab
le 3
.5,1
979
1,42
6,00
072
9,00
069
7,00
0T
able
3.7
, 197
919
756,
011
4,05
44,
365
2,49
81,
646
1,55
6T
able
3.5
,197
91,
482,
000
686,
000
796,
000
Tab
le 3
.7, 1
979
1976
6,39
14,
425
4,53
62,
701
1,85
51,
724
Tab
le 3
.5,1
979
1,70
3,00
075
3,00
095
0,00
0T
able
3.7
, 197
919
776,
855
4,72
64,
734
2,65
82,
121
2,06
7T
able
3.5
,197
91,
868,
000
609,
000
1,25
9,00
0T
able
3.7
, 197
919
787,
688
5,31
55,
139
2,82
22,
549
2,49
2T
able
3.5
, 197
9, 1
983
2,22
7,65
180
6,41
01,
421,
241
Tab
le 3
.6, 1
979,
198
319
798,
380
5,86
45,
474
3,12
32,
906
2,74
0T
able
3.5
, 198
3, 1
984
2,55
5,00
089
2,00
01,
664,
000
Tab
le 3
.7, 1
983,
198
4, 1
989
1980
9,01
26,
001
5,64
02,
794
3,37
23,
207
Tab
le 3
.5, 1
983,
198
4, 1
989
2,33
8,00
073
6,00
01,
603,
000
Tab
le 3
.7, 1
983,
198
4, 1
989
1981
9,52
26,
974
5,60
43,
250
3,91
83,
724
Tab
le 3
.5, 1
983,
198
4, 1
989,
199
12,
685,
000
930,
000
1,75
4,00
0T
able
3.7
, 198
3, 1
984,
198
9, 1
991
1982
9,73
36,
169
5,42
62,
419
4,30
73,
749
Tab
le 3
.5, 1
983,
198
4, 1
989,
199
12,
350,
000
579,
000
1,77
1,00
0T
able
3.7
, 198
3, 1
984,
198
9, 1
991
1983
10,0
476,
540
5,57
22,
541
4,47
53,
998
Tab
le 3
.5, 1
984,
198
9, 1
991
2,27
1,00
057
2,00
01,
700,
000
Tab
le 3
.7, 1
984,
198
9, 1
991
1984
10,4
167,
096
5,66
82,
936
4,74
84,
160
Tab
le 3
.5, 1
989,
199
12,
495,
000
592,
000
1,90
3,00
0T
able
3.7
, 198
9, 1
991
1985
10,5
396,
418
5,72
02,
877
4,80
93,
541
Tab
le 3
.5, 1
989,
199
12,
155,
000
564,
000
1,59
0,00
0T
able
3.7
, 198
9, 1
991
1986
10,5
306,
943
5,76
02,
921
4,77
04,
022
Tab
le 3
.5, 1
989,
199
12,
625,
000
804,
000
1,82
1,00
0T
able
3.7
, 198
9, 1
991
1987
10,3
746,
333
5,75
42,
813
4,62
03,
520
Tab
le 3
.5, 1
989,
199
12,
283,
000
652,
000
1,63
1,00
0T
able
3.7
, 198
9, 1
991
1988
10,1
536,
406
5,76
32,
584
4,39
03,
822
Tab
le 3
.5, 1
989,
199
12,
707,
000
576,
000
2,13
1,00
0T
able
3.7
, 198
9, 1
991
1989
10,4
457,
475
5,92
93,
244
4,51
64,
232
Tab
le 3
.5,1
991
2,82
6,00
074
9,00
02,
077,
000
Tab
le 3
.7, 1
991
1990
10,6
467,
397
6,09
13,
459
4,55
53,
938
Tab
le 3
.5,1
991
2,39
2,00
077
5,00
01,
617,
000
Tab
le 3
.7, 1
991
296

TA
BL
E D
-21C
. F
AA
RO
TO
RC
RA
FT
CE
NSU
SH
ours
flo
wn
per
year
by
acti
ve r
otor
craf
t
All
All
All
All
All
All
Tot
alA
llA
ll
Yea
rre
gist
ered
acti
vere
g.ac
tive
reg.
acti
veac
tive
acti
veac
tive
end
type
sty
pes
pist
ons
pist
ons
turb
ines
turb
ines
Ref
eren
cefl
eet
pist
ontu
rbin
eR
efer
ence
1985
10,5
396,
000
5,72
02,
700
4,80
93,
300
Tab
le 3
.5,1
993*
, Tab
le 1
.7 1
994
1,99
0,00
052
1,00
01,
468,
000
Tab
le 3
.8, 1
993*
1986
10,5
306,
500
5,76
02,
700
4,77
03,
800
Tab
le 3
.5,1
993*
, Tab
le 1
.7 1
994
2,42
4,00
074
2,00
01,
682,
000
Tab
le 3
.8, 1
993*
1987
10,3
745,
900
5,75
42,
600
4,62
03,
300
Tab
le 3
.5,1
993*
, Tab
le 1
.7 1
994
2,10
8,00
060
2,00
01,
506,
000
Tab
le 3
.8, 1
993*
1988
10,1
536,
000
5,76
32,
400
4,39
03,
600
Tab
le 3
.5,1
993*
, Tab
le 1
.7 1
994
2,50
7,00
053
3,00
01,
974,
000
Tab
le 3
.8, 1
993*
1989
10,4
457,
000
5,92
93,
000
4,51
64,
000
Tab
le 3
.5,1
993*
, Tab
le 1
.7 1
994
2,61
0,00
069
2,00
01,
918,
000
Tab
le 3
.8, 1
993*
1990
10,6
466,
900
6,09
13,
200
4,55
53,
700
Tab
le 3
.5,1
993*
, Tab
le 1
.7 1
994
2,20
9,00
071
6,00
01,
493,
000
Tab
le 3
.8, 1
993*
1991
10,8
346,
292
6,10
72,
470
4,72
73,
822
Tab
le 3
.5,1
993*
, Tab
le 1
.7 1
994
2,75
7,00
058
5,00
02,
172,
000
Tab
le 3
.8, 1
993*
1992
10,9
525,
753
6,19
32,
211
4,75
93,
542
Tab
le 3
.5,1
993*
, Tab
le 1
.7 1
994
2,28
3,00
041
6,00
01,
866,
000
Tab
le 3
.8, 1
993*
1993
11,1
444,
510
6,48
01,
646
4,66
42,
864
Tab
le 3
.5,1
993*
, Tab
le 1
.7 1
994
1,83
2,30
637
0,10
31,
462,
206
Tab
le 3
.7, 1
994
1994
11,4
594,
390
6,51
01,
381
4,94
93,
009
Tab
le 3
.5,1
993*
, Tab
le 1
.7 1
994
2,00
6,47
034
0,18
91,
666,
282
Tab
le 3
.7A
, 199
419
9511
,785
5,83
06,
620
1,86
35,
165
3,96
7G
A A
ct. S
urve
y, T
able
1.2
, 199
71,
961,
000
337,
000
1,62
4,00
0G
A A
ct. S
urve
y, T
able
1.5
, 199
719
9612
,354
6,57
06,
853
2,50
75,
501
4,06
3G
A A
ct. S
urve
y, T
able
1.2
, 199
72,
122,
000
591,
000
1,53
1,00
0G
A A
ct. S
urve
y, T
able
1.5
, 199
719
9712
,911
6,78
67,
081
2,25
95,
830
4,52
7G
A A
ct. S
urve
y, T
able
1.1
, 199
72,
083,
699
343,
841
1,73
9,85
8G
A A
ct. S
urve
y, T
able
1.4
, 199
7
*Ear
lier
dat
a re
vise
d [d
ownw
ard]
to c
orre
ct f
or n
onre
spon
se b
ias
297

TA
BL
E D
-22.
GE
NE
RA
L A
VIA
TIO
N A
CT
IVIT
Y A
ND
AV
ION
ICS
SUR
VE
Y S
UM
MA
RY
FO
R S
EL
EC
TE
D Y
EA
RS
Yea
rR
otor
craf
tA
ppro
xim
ate
Sam
ple
Pos
tmas
ter
Cou
nted
Res
pons
eA
ctiv
eF
leet
Ave
rage
end
type
Cen
sus
popu
lati
onsi
zere
turn
sre
spon
ses
rate
*ro
torc
raft
hour
sho
urs
1977
Tot
al r
otor
craf
t6,
855
6,84
51,
924
na1,
548
80.5
4,72
51,
867,
644
396.
3T
otal
pis
ton
4,73
44,
652
1,48
6na
1,18
980
.02,
658
608,
603
230.
5T
otal
turb
ine
2,12
12,
193
438
na35
982
.02,
067
1,25
9,04
160
8.3
Sing
le1,
976
nana
nana
nana
nana
Mul
ti14
5na
nana
nana
nana
na
1987
Tot
al r
otor
craf
t10
,374
10,0
343,
171
na1,
555
49.0
6,33
32,
283,
000
360.
5T
otal
Pis
ton
5,75
45,
555
2,36
0na
1,18
550
.22,
813
652,
000
231.
8T
otal
Tur
bine
4,62
04,
479
811
na37
045
.63,
520
1,63
1,00
046
3.4
Sing
le3,
688
nana
nana
nana
nana
Mul
ti93
2na
nana
nana
nana
na
1988
Tot
al r
otor
craf
t10
,153
9,76
82,
965
na1,
417
47.8
6,40
62,
706,
719
423.
3T
otal
pis
ton
5,76
35,
334
2,07
8na
979
47.1
2,58
457
5,95
522
7.9
Tot
al tu
rbin
e4,
390
4,43
488
7na
438
49.4
3,82
22,
130,
764
576.
7Si
ngle
3,51
8na
nana
nana
nana
naM
ulti
872
nana
nana
nana
nana
1989
**T
otal
rot
orcr
aft
10,4
4510
,469
10,4
691,
874
6,72
578
.27,
488
2,82
8,69
637
7.8
Man
ufac
ture
r bu
iltPi
ston
3,99
33,
994
3,99
472
02,
488
76.0
2,68
472
8,12
527
7.8
Sing
le tu
rbin
e3,
574
3,61
63,
616
648
2,54
985
.93,
248
1,53
2,27
048
0.5
Mul
ti-t
urbi
ne94
21,
069
1,06
918
470
980
.198
454
6,47
155
1.8
Am
ateu
r bu
ilt1,
936
1,79
01,
790
322
979
66.7
572
21,8
3038
.2
* A
djus
ted
for
post
mas
ter
retu
rns
[i. e
., 10
0*co
unte
d re
spon
ses
/ (sa
mpl
e si
ze –
pos
tal r
etur
ns)]
**
One
tim
e on
ly R
otor
craf
t Act
ivit
y Su
rvey
of
all r
egis
tere
d ro
torc
raft
in th
e U
nite
d St
ates
(N
orm
al G
AA
AS
not c
ondu
cted
for
rot
orcr
aft)
298

TA
BL
E D
-22.
GE
NE
RA
L A
VIA
TIO
N A
CT
IVIT
Y A
ND
AV
ION
ICS
SUR
VE
Y S
UM
MA
RY
FO
R S
EL
EC
TE
D
Y
EA
RS
(CO
NT
INU
ED
)
Yea
rR
otor
craf
tA
ppro
xim
ate
Sam
ple
Pos
tmas
ter
Cou
nted
Res
pons
eA
ctiv
eF
leet
Ave
rage
end
type
Cen
sus
popu
lati
onsi
zere
turn
sre
spon
ses
rate
*ro
torc
raft
hour
sho
urs
1990
Tot
al r
otor
craf
t10
,646
10,4
222,
313
na1,
221
52.8
7,39
42,
392,
066
320.
7T
otal
pis
ton
6,09
15,
802
1,50
5na
783
52.0
3,45
677
4,77
421
6.4
Tot
al tu
rbin
e4,
555
4,62
080
8na
438
54.2
3,93
81,
617,
292
424.
9Si
ngle
3,59
0na
nana
nana
nana
naM
ulti
965
nana
nana
nana
nana
1991
Tot
al r
otor
craf
t10
,834
10,4
742,
856
na1,
331
46.6
6,29
22,
755,
599
451.
6T
otal
pis
ton
6,10
75,
848
1,78
6na
814
45.6
2,47
058
3,68
823
3.7
Tot
al tu
rbin
e4,
727
4,62
61,
070
na51
748
.33,
822
2,17
1,91
159
2.2
Sing
le3,
676
nana
nana
nana
nana
Mul
ti1,
051
nana
nana
nana
nana
1992
Tot
al R
otor
craf
t10
,952
9,59
93,
101
na1,
522
49.1
5,75
22,
282,
701
381.
7T
otal
pis
ton
6,19
35,
209
1,91
8na
980
51.1
2,21
141
6,37
518
4.6
Tot
al tu
rbin
e4,
759
4,39
01,
183
na54
245
.83,
541
1,86
6,32
649
1.3
Sing
le3,
681
nana
nana
nana
nana
Mul
ti1,
078
nana
nana
nana
nana
1993
Tot
al r
otor
craf
t11
,144
8,22
02,
919
155
1,54
552
.94,
508
1,83
2,30
539
8.6
Tot
al p
isto
n6,
480
4,27
41,
741
115
952
58.5
1,64
537
0,09
921
8.8
Tot
al tu
rbin
e4,
664
3,94
61,
178
4059
352
.12,
863
1,46
2,20
650
6.0
Sing
le3,
676
3,04
078
032
381
50.9
2,14
41,
072,
604
501.
8M
ulti
988
906
398
821
254
.471
938
9,60
252
5.5
* A
djus
ted
for
post
mas
ter
retu
rns
[i. e
., 10
0*co
unte
d re
spon
ses
/ (sa
mpl
e si
ze –
pos
tal r
etur
ns)]
299

TA
BL
E D
-22.
GE
NE
RA
L A
VIA
TIO
N A
CT
IVIT
Y A
ND
AV
ION
ICS
SUR
VE
Y S
UM
MA
RY
FO
R S
EL
EC
TE
D
Y
EA
RS
(CO
NC
LU
DE
D)
Yea
rR
otor
craf
tA
ppro
xim
ate
Sam
ple
Pos
tmas
ter
Cou
nted
Res
pons
eA
ctiv
eF
leet
Ave
rage
end
type
Cen
sus
popu
lati
onsi
zere
turn
sre
spon
ses
rate
*ro
torc
raft
hour
sho
urs
1994
Tot
al r
otor
craf
t11
,459
7,86
61,
307
148
683
52.3
4,38
82,
006,
459
458.
6T
otal
pis
ton
6,51
03,
485
643
8534
561
.81,
380
340,
183
252.
7T
otal
turb
ine
4,94
94,
381
664
6333
856
.23,
008
1,66
6,27
657
1.4
Sing
le3,
888
3,52
849
348
242
54.4
2,29
81,
197,
043
526
Mul
ti1,
061
853
171
1596
61.5
710
469,
233
762
1995
Tot
al r
otor
craf
t11
,785
8,21
71,
557
121
737
47.3
5,11
72,
332,
905
439.
2T
otal
pis
ton
6,62
03,
428
718
6233
350
.81,
474
341,
241
233.
7T
otal
turb
ine
5,16
54,
789
839
5940
451
.83,
643
1,99
1,66
452
8.1
Sing
le4,
114
3,76
056
938
279
52.5
2,77
31,
450,
197
504
Mul
ti1,
051
1,02
927
021
125
50.2
870
541,
467
637
1996
Tot
al r
otor
craf
t12
,354
8,27
91,
397
7074
956
.46,
390
2,02
6,00
031
7.1
Tot
al p
isto
n6,
853
3,48
864
432
335
54.7
2,41
557
4,00
023
7.7
Tot
al tu
rbin
e5,
501
4,79
175
338
414
57.9
3,97
51,
452,
000
365.
3Si
ngle
4,41
03,
880
542
3030
259
.03,
329
1,20
2,00
036
1.1
Mul
ti1,
091
911
211
811
255
.264
625
0,00
038
7.0
1997
Tot
al r
otor
craf
t12
,911
8,45
52,
727
170
1,48
958
.26,
785
2,08
3,69
930
7.0
Tot
al p
isto
n7,
081
3,37
81,
130
8454
552
.12,
259
343,
841
152.
2T
otal
turb
ine
5,83
05,
077
1,59
786
944
62.5
4,52
61,
739,
858
384.
3Si
ngle
4,72
24,
061
1,17
866
660
59.4
3,76
21,
310,
878
348.
4M
ulti
1,10
81,
016
419
2028
471
.276
442
8,98
056
1.0
* A
djus
ted
for
post
mas
ter
retu
rns
[i. e
., 10
0*co
unte
d re
spon
ses
/ (sa
mpl
e si
ze –
pos
tal r
etur
ns)]
300

TA
BL
E D
-23.
AC
CID
EN
T A
ND
FA
TA
LIT
Y C
OU
NT
, HO
UR
S F
LO
WN
AN
D A
CC
IDE
NT
RA
TE
BY
YE
AR
AN
D T
YP
E
A
ND
TY
PE
100,
000
hour
s fl
own
per
year
Acc
iden
ts p
erF
atal
itie
s pe
rA
ccid
ents
Acc
iden
tsA
ccid
ents
Fat
alit
ies
by a
ctiv
e ro
torc
raft
10
0,00
0 ho
urs
flow
n pe
r ye
ar10
0,00
0 hr
sY
ear
per
year
All
pist
on a
ll tu
rbin
eP
er y
ear
Tot
alA
llA
llT
otal
All
All
Tot
alen
dA
ll ty
pes
Per
yea
rP
er y
ear
All
type
sfl
eet
pist
ontu
rbin
efl
eet
pist
onT
turb
ine
flee
t19
634
04
6??
????
????
????
1964
260
252
827
4.47
????
58.1
7??
??6.
0419
6524
323
76
234.
50??
??54
.00
????
5.11
1966
300
287
1346
4.92
????
60.9
8??
??9.
3519
6723
922
217
425.
38??
??44
.42
????
7.81
1968
230
202
2880
6.17
????
37.2
8??
??12
.97
1969
264
217
4749
7.78
5.73
2.05
33.9
337
.87
22.9
36.
3019
7024
419
648
258.
445.
433.
0128
.90
36.0
915
.94
2.96
1971
220
187
3324
8.69
5.17
3.53
25.3
036
.18
9.36
2.76
1972
248
181
6764
10.1
95.
914.
2724
.35
30.6
215
.68
6.28
1973
287
221
6647
11.6
96.
545.
1524
.55
33.7
912
.82
4.02
1974
287
231
5667
14.2
67.
296.
9720
.13
31.6
98.
034.
7019
7531
523
877
5014
.82
6.86
7.96
21.2
634
.69
9.67
3.37
1976
277
214
6364
17.0
37.
539.
5016
.27
28.4
26.
633.
7619
7728
219
983
5718
.68
6.09
12.5
915
.10
32.6
86.
593.
0519
7832
823
692
7822
.28
8.06
14.2
114
.72
29.2
76.
473.
5019
7929
620
096
9125
.55
8.92
16.6
411
.59
22.4
25.
773.
5619
8032
719
812
910
223
.38
7.36
16.0
313
.99
26.9
08.
054.
3619
8131
918
913
071
26.8
59.
3017
.54
11.8
820
.32
7.41
2.64
1982
303
174
129
8823
.50
5.79
17.7
112
.89
30.0
57.
283.
7419
8327
315
012
365
22.7
15.
7217
.00
12.0
226
.22
7.24
2.86
1984
280
141
139
8024
.95
5.92
19.0
311
.22
23.8
27.
303.
2119
8523
812
711
167
19.9
05.
2114
.68
11.9
624
.38
7.56
3.37
1986
222
123
9910
124
.24
7.42
16.8
29.
1616
.58
5.89
4.17
1987
196
122
7469
21.0
86.
0215
.06
9.30
20.2
74.
913.
2719
8820
712
582
4425
.07
5.33
19.7
48.
2623
.45
4.15
1.76
1989
213
123
9064
26.1
06.
9219
.18
8.16
17.7
74.
692.
4519
9022
614
284
4922
.09
7.16
14.9
310
.23
19.8
35.
632.
2219
9119
213
161
7027
.57
5.85
21.7
26.
9622
.39
2.81
2.54
1992
199
128
7183
22.8
34.
1618
.66
8.72
30.7
73.
803.
6419
9318
110
972
7318
.32
3.70
14.6
29.
8829
.46
4.92
3.98
1994
211
116
9585
20.0
63.
4016
.66
10.5
234
.12
5.70
4.24
1995
165
9174
4619
.61
3.37
16.2
48.
4127
.00
4.56
2.35
1996
185
8699
6621
.22
5.91
15.3
18.
7214
.55
6.47
3.11
1997
175
9283
7220
.84
3.44
17.4
08.
4026
.76
4.77
3.46
301

TA
BL
E D
-24.
MA
NU
FA
CT
UR
ER
SIN
GL
E-P
IST
ON
AC
CID
EN
T S
UM
MA
RY
NT
SB a
ccid
ent
Peo
ple
Air
craf
tfi
rst
even
t ca
tego
ryin
volv
edF
atal
itie
sSe
riou
sM
inor
/non
ein
volv
edD
estr
oyed
Subs
tant
ial
Min
orN
one
Unk
now
nL
oss
of e
ngin
e po
wer
2,62
110
623
42,
281
1,55
426
51,
286
30
0In
fli
ght c
olli
sion
wit
h ob
ject
1,41
716
620
51,
046
953
327
620
42
0L
oss
of c
ontr
ol1,
048
9210
585
162
519
442
83
00
Air
fram
e/co
mpo
nent
/sys
tem
fai
lure
/mal
func
tion
1,05
115
310
978
963
921
242
23
20
Har
d la
ndin
g91
54
3587
648
351
430
20
0In
fli
ght c
olli
sion
wit
h te
rrai
n/w
ater
708
4761
600
443
119
323
10
0R
ollo
ver/
nose
over
519
817
494
290
5323
70
00
Wea
ther
9721
769
5723
340
00
Mis
cell
aneo
us/o
ther
133
138
112
7420
491
40
Sta
ll/s
ettl
ing
wit
h po
wer
120
615
9967
2146
00
0P
rope
ller
/rot
or c
onta
ct to
per
son
5714
934
332
127
120
Mid
air
coll
isio
n43
223
1817
133
10
0O
n gr
ound
/wat
er c
olli
sion
wit
h ob
ject
431
240
260
260
00
Fir
e/ex
plos
ion
382
531
2822
60
00
Abr
upt m
aneu
ver
195
113
124
80
00
Und
eter
min
ed21
181
212
111
00
0G
ear
colla
psed
290
029
164
120
00
Dra
gged
win
g, r
otor
, pod
, flo
at o
r ta
il/s
kid
292
126
206
140
00
Und
ersh
oot/
over
shoo
t33
20
3116
610
00
0O
n gr
ound
/wat
er e
ncou
nter
wit
h te
rrai
n/w
ater
70
07
51
40
00
Mis
sing
11
00
10
00
01
Tot
al8,
949
683
818
7,44
85,
371
1,35
43,
971
2520
1
302

TA
BL
E D
-25.
MA
NU
FA
CT
UR
ER
SIN
GL
E-T
UR
BIN
E A
CC
IDE
NT
SU
MM
AR
Y
NT
SB a
ccid
ent
Peo
ple
Air
craf
tfi
rst
even
t ca
tego
ryin
volv
edF
atal
itie
sSe
riou
sM
inor
/non
ein
volv
edD
estr
oyed
Subs
tant
ial
Min
orN
one
Unk
now
nL
oss
of e
ngin
e po
wer
1,84
612
923
71,
480
704
139
546
910
0In
fli
ght c
olli
sion
wit
h ob
ject
688
140
106
442
298
114
182
02
0L
oss
of c
ontr
ol75
415
512
347
628
412
515
90
00
Air
fram
e/co
mpo
nent
/sys
tem
fai
lure
/mal
func
tion
705
157
110
438
282
111
163
44
0In
fli
ght c
olli
sion
wit
h te
rrai
n/w
ater
389
104
5223
314
368
750
00
Har
d la
ndin
g35
93
1434
214
011
128
01
0R
ollo
ver/
nose
over
275
139
253
119
2296
10
0W
eath
er24
610
732
107
8554
300
10
Mis
cell
aneo
us/o
ther
186
915
162
427
201
140
Mid
air
coll
isio
n19
566
1711
237
219
52
0P
rope
ller
/rot
or c
onta
ct to
per
son
108
1213
8335
014
156
0O
n gr
ound
/wat
er c
olli
sion
wit
h ob
ject
580
454
181
161
00
Fir
e/ex
plos
ion
375
032
1510
41
00
Und
eter
min
ed39
344
113
112
00
0O
n gr
ound
/wat
er e
ncou
nter
wit
h te
rrai
n/w
ater
230
023
121
110
00
Abr
upt m
aneu
ver
307
716
83
50
00
Und
ersh
oot/
over
shoo
t18
20
164
31
00
0G
ear
colla
psed
50
05
30
30
00
Sta
ll/s
ettl
ing
wit
h po
wer
65
01
20
20
00
Dra
gged
win
g, r
otor
, pod
, flo
at o
r ta
il/s
kid
50
05
20
20
00
Mis
sing
33
00
11
00
00
Tot
al5,
975
951
743
4,28
12,
247
702
1,46
837
400
303

TA
BL
E D
-26.
MA
NU
FA
CT
UR
ER
TW
IN-T
UR
BIN
E A
CC
IDE
NT
SU
MM
AR
Y
NT
SB a
ccid
ent
Peo
ple
Air
craf
tfi
rst
even
t ca
tego
ryin
volv
edF
atal
itie
sSe
riou
sM
inor
/non
ein
volv
edD
estr
oyed
Subs
tant
ial
Min
orN
one
Unk
now
nA
irfr
ame/
com
pone
nt/s
yste
m f
ailu
re/m
alfu
ncti
on45
214
837
267
8934
408
70
In f
ligh
t col
lisi
on w
ith
obje
ct17
535
2911
143
1625
20
0L
oss
of c
ontr
ol13
538
1483
4017
221
00
Los
s of
eng
ine
pow
er14
116
2699
3913
214
10
In f
ligh
t col
lisi
on w
ith
terr
ain/
wat
er52
184
3016
106
00
0W
eath
er29
163
1012
92
10
0O
n gr
ound
/wat
er c
olli
sion
wit
h ob
ject
8018
260
102
80
00
Mis
cell
aneo
us/o
ther
306
123
92
40
30
Har
d la
ndin
g23
02
218
16
10
0P
rope
ller
/rot
or c
onta
ct to
per
son
483
243
80
11
60
Mid
air
coll
isio
n32
133
166
33
00
0G
ear
colla
psed
544
149
60
42
00
Fir
e/ex
plos
ion
270
027
51
31
00
Rol
love
r/no
seov
er18
00
184
13
00
0A
brup
t man
euve
r6
20
42
11
00
0U
ndet
erm
ined
51
04
21
10
00
Sta
ll/s
ettl
ing
wit
h po
wer
10
01
10
10
00
Dra
gged
win
g, r
otor
, pod
, flo
at o
r ta
il/s
kid
20
02
10
10
00
Und
ersh
oot/
over
shoo
t6
30
31
10
00
0O
n gr
ound
/wat
er e
ncou
nter
wit
h te
rrai
n/w
ater
00
00
00
00
00
Mis
sing
00
00
00
00
00
Tot
al1,
316
321
124
871
302
112
152
2117
0
304

TA
BL
E D
-27.
AL
L O
TH
ER
RO
TO
RC
RA
FT
TY
PE
S A
CC
IDE
NT
SU
MM
AR
Y
NT
SB a
ccid
ent
Peo
ple
Air
craf
tfi
rst
even
t ca
tego
ryin
volv
edF
atal
itie
sSe
riou
sM
inor
/non
ein
volv
edD
estr
oyed
Subs
tant
ial
Min
orN
one
Unk
now
nL
oss
of c
ontr
ol17
577
2177
165
7887
00
0L
oss
of e
ngin
e po
wer
133
1723
9311
128
821
00
Air
fram
e/co
mpo
nent
/sys
tem
fai
lure
/mal
func
tion
7843
629
7340
330
00
In f
ligh
t col
lisi
on w
ith
terr
ain/
wat
er45
137
2540
1327
00
0In
fli
ght c
olli
sion
wit
h ob
ject
3511
618
2813
150
00
Har
d la
ndin
g29
01
2825
322
00
0R
ollo
ver/
nose
over
254
219
203
170
00
Sta
ll/s
ettl
ing
wit
h po
wer
130
310
133
100
00
Abr
upt m
aneu
ver
118
12
108
20
00
Mis
cell
aneo
us/o
ther
91
17
91
80
00
Wea
ther
70
16
51
40
00
Pro
pell
er/r
otor
con
tact
to p
erso
n6
11
43
01
11
0U
nder
shoo
t/ov
ersh
oot
31
02
30
30
00
On
grou
nd/w
ater
col
lisi
on w
ith
obje
ct2
00
22
11
00
0F
ire/
expl
osio
n5
00
52
11
00
0G
ear
colla
psed
20
20
20
20
00
On
grou
nd/w
ater
enc
ount
er w
ith
terr
ain/
wat
er3
20
12
11
00
0M
idai
r co
llis
ion
21
01
10
10
00
Und
eter
min
ed1
10
01
10
00
0D
ragg
ed w
ing,
rot
or, p
od, f
loat
or
tail
/ski
d1
00
11
01
00
0M
issi
ng0
00
00
00
00
0T
otal
s58
518
075
330
516
195
318
21
0
305

TABLE D-28. ACCIDENT SUMMARY BY TYPE OF ACTIVITY AND PHASE OF OPERATION
Single Single Twin All otherActivity piston turbine turbine types TotalsAerial application 1,494 150 4 4 1,652General utility 875 520 49 13 1,457Personal use 787 200 6 358 1,351Instructional/training 976 127 13 82 1,198Passenger service 421 642 97 1 1,161Business use 338 209 23 11 581Ferry/reposition 205 135 46 3 389Flight/maintenance test 113 67 16 43 239Executive/corporate 75 97 31 0 203Public/military use 78 93 12 0 183Unknown/not reported 9 7 5 1 22Total 5,371 2,247 302 516 8,436
Single Single Twin All otherPhase of operation piston turbine turbine types TotalsCruise 1,047 633 84 93 1,857Maneuvering 1,149 270 30 70 1,519Takeoff 889 353 36 127 1,405Landing 949 301 35 74 1,359Hover 450 247 32 28 757Approach 241 146 26 54 467Descent 168 73 6 12 259Standing/static 126 97 22 5 250Taxi 164 40 15 19 238Climb 64 40 14 10 128Other 76 24 0 8 108Unknown 48 23 2 16 89Totals 5,371 2,247 302 516 8,436
306

TA
BL
E D
-29.
CO
LL
EC
TE
D A
CC
IDE
NT
SU
MM
AR
Y B
Y N
UM
ER
ICA
L C
OU
NT
Com
mer
cial
ly m
anuf
actu
red
helic
opte
rsA
ll ot
her
roto
rcra
ft t
ypes
All
Com
mer
cial
Com
mer
cial
Am
ateu
rA
mat
eur
Am
ateu
rot
her
NT
SB a
ccid
ent
Sing
leSi
ngle
Tw
inhe
licop
ter
pist
onpi
ston
pist
onun
know
nty
pefi
rst
even
t ca
tego
rypi
ston
turb
ine
turb
ine
tota
lau
togy
rohe
licop
ter
auto
gyro
type
tota
lL
oss
of e
ngin
e po
wer
1,55
470
439
2,29
76
4052
1311
1In
fli
ght c
olli
sion
wit
h ob
ject
953
298
431,
294
34
165
28L
oss
of c
ontr
ol62
528
440
949
1444
8819
165
Air
fram
e/co
mpo
nent
/sys
tem
fai
lure
/mal
func
tion
639
282
891,
010
719
3611
73H
ard
land
ing
483
140
863
15
412
425
In f
ligh
t col
lisi
on w
ith
terr
ain/
wat
er44
314
316
602
58
234
40R
ollo
ver/
nose
over
290
119
441
31
116
220
Wea
ther
5785
1215
42
12
05
Mis
cell
aneo
us/o
ther
7442
912
51
25
19
Sta
ll/s
ettl
ing
wit
h po
wer
672
170
21
82
13P
rope
ller
/rot
or c
onta
ct to
per
son
3335
876
10
20
3M
idai
r co
llis
ion
1737
660
00
01
1O
n gr
ound
/wat
er c
olli
sion
wit
h ob
ject
2618
1054
00
11
2F
ire/
expl
osio
n28
155
480
10
12
Abr
upt m
aneu
ver
128
222
11
62
10U
ndet
erm
ined
1213
227
00
10
1G
ear
colla
psed
163
625
10
10
2D
ragg
ed w
ing,
rot
or, p
od, f
loat
or
tail
/ski
d20
21
230
10
01
Und
ersh
oot/
over
shoo
t16
41
211
01
13
On
grou
nd/w
ater
enc
ount
er w
ith
terr
ain/
wat
er5
120
170
01
12
Mis
sing
11
02
00
00
0T
otal
5,37
12,
247
302
7,92
050
137
261
6851
6
307

TA
BL
E D
-30.
CO
LL
EC
TE
D A
CC
IDE
NT
SU
MM
AR
Y B
Y P
ER
CE
NT
AG
E
Com
mer
cial
ly m
anuf
actu
red
helic
opte
rsA
ll ot
her
roto
rcra
ft t
ypes
All
Com
mer
cial
Com
mer
cial
Am
ateu
rA
mat
eur
Am
ateu
rot
her
NT
SB a
ccid
ent
Sing
leSi
ngle
Tw
inhe
licop
ter
pist
onpi
ston
pist
onun
know
nty
pefi
rst
even
t ca
tego
rypi
ston
turb
ine
turb
ine
tota
lau
togy
rohe
licop
ter
auto
gyro
type
tota
lL
oss
of e
ngin
e po
wer
28.9
331
.33
12.9
129
.00
12.0
029
.20
19.9
219
.12
21.5
1In
fli
ght c
olli
sion
wit
h ob
ject
17.7
413
.26
14.2
416
.34
6.00
2.92
6.13
7.35
5.43
Los
s of
con
trol
11.6
412
.64
13.2
511
.98
28.0
032
.12
33.7
227
.94
31.9
8A
irfr
ame/
com
pone
nt/s
yste
m f
ailu
re/m
alfu
ncti
on11
.90
12.5
529
.47
12.7
514
.00
13.8
713
.79
16.1
814
.15
Har
d la
ndin
g8.
996.
232.
657.
9710
.00
2.92
4.60
5.88
4.84
In f
ligh
t col
lisi
on w
ith
terr
ain/
wat
er8.
256.
365.
307.
6010
.00
5.84
8.81
5.88
7.75
Rol
love
r/no
seov
er5.
405.
301.
325.
212.
008.
032.
302.
943.
88W
eath
er1.
063.
783.
971.
944.
000.
730.
770.
000.
97M
isce
llan
eous
/oth
er1.
381.
872.
981.
582.
001.
461.
921.
471.
74S
tall
/set
tlin
g w
ith
pow
er1.
250.
090.
330.
884.
000.
733.
072.
942.
52P
rope
ller
/rot
or c
onta
ct to
per
son
0.61
1.56
2.65
0.96
2.00
0.00
0.77
0.00
0.58
Mid
air
coll
isio
n0.
321.
651.
990.
760.
000.
000.
001.
470.
19O
n gr
ound
/wat
er c
olli
sion
wit
h ob
ject
0.48
0.80
3.31
0.68
0.00
0.00
0.38
1.47
0.39
Fir
e/ex
plos
ion
0.52
0.67
1.66
0.61
0.00
0.73
0.00
1.47
0.39
Abr
upt m
aneu
ver
0.22
0.36
0.66
0.28
2.00
0.73
2.30
2.94
1.94
Und
eter
min
ed0.
220.
580.
660.
340.
000.
000.
380.
000.
19G
ear
colla
psed
0.30
0.13
1.99
0.32
2.00
0.00
0.38
0.00
0.39
Dra
gged
win
g, r
otor
, pod
, flo
at o
r ta
il/s
kid
0.37
0.09
0.33
0.29
0.00
0.73
0.00
0.00
0.19
Und
ersh
oot/
over
shoo
t0.
300.
180.
330.
272.
000.
000.
381.
470.
58O
n gr
ound
/wat
er e
ncou
nter
wit
h te
rrai
n/w
ater
0.09
0.53
0.00
0.21
0.00
0.00
0.38
1.47
0.39
Mis
sing
0.02
0.04
0.00
0.03
0.00
0.00
0.00
0.00
0.00
Tot
al A
ccid
ent
Cou
nt F
or %
Bas
is5,
371
2,24
730
27,
920
5013
726
168
516
308

TA
BL
E D
-31.
AL
L R
OT
OR
CR
AF
T A
CC
IDE
NT
SU
MM
AR
Y
NT
SB a
ccid
ent
Peo
ple
Air
craf
tfi
rst
even
t ca
tego
ryin
volv
edF
atal
itie
sSe
riou
sM
inor
/non
ein
volv
edD
estr
oyed
Subs
tant
ial
Min
orN
one
Unk
now
n
Los
s of
eng
ine
pow
er4,
741
268
520
3,95
32,
408
445
1,93
517
110
In f
ligh
t col
lisi
on w
ith
obje
ct2,
315
352
346
1,61
71,
322
470
842
64
0L
oss
of c
ontr
ol2,
112
362
263
1,48
71,
114
414
696
40
0A
irfr
ame/
com
pone
nt/s
yste
m f
ailu
re/m
alfu
ncti
on2,
286
501
262
1,52
31,
083
397
658
1513
0H
ard
land
ing
1,32
67
521,
267
656
6658
63
10
In f
ligh
t col
lisi
on w
ith
terr
ain/
wat
er1,
194
182
124
888
642
210
431
10
0R
ollo
ver/
nose
over
837
2528
784
433
7935
31
00
Wea
ther
379
144
4319
215
987
701
10
Mis
cell
aneo
us/o
ther
358
2925
304
134
3081
221
0S
tall
/set
tlin
g w
ith
pow
er14
011
1811
183
2459
00
0P
rope
ller
/rot
or c
onta
ct to
per
son
219
3025
164
792
2824
250
Mid
air
coll
isio
n27
210
223
147
6137
166
20
On
grou
nd/w
ater
col
lisi
on w
ith
obje
ct18
319
815
656
451
10
0F
ire/
expl
osio
n10
77
595
5034
142
00
Abr
upt m
aneu
ver
6622
935
3216
160
00
Und
eter
min
ed66
545
728
244
00
0G
ear
colla
psed
904
383
274
212
00
Und
ersh
oot/
over
shoo
t60
80
5224
1014
00
0D
ragg
ed w
ing,
rot
or, p
od, f
loat
or
tail
/ski
d37
21
3424
618
00
0O
n gr
ound
/wat
er e
ncou
nter
wit
h te
rrai
n/w
ater
332
031
193
160
00
Mis
sing
44
00
21
00
01
Tot
al16
,825
2,13
51,
760
12,9
308,
436
2,36
35,
909
8578
1
309


