18
US Coal Export Market and Terminal Saurabh Pandey Director of Business Development SunCoke Energy Platts Coal Marketing Days Sept 22-23, 2014
US Coal Export Market and Terminal
Saurabh Pandey
Director of Business Development
SunCoke Energy
Platts Coal Marketing Days
Sept 22-23, 2014
TM
2
SXC and SXCP
TM
Odisha, India
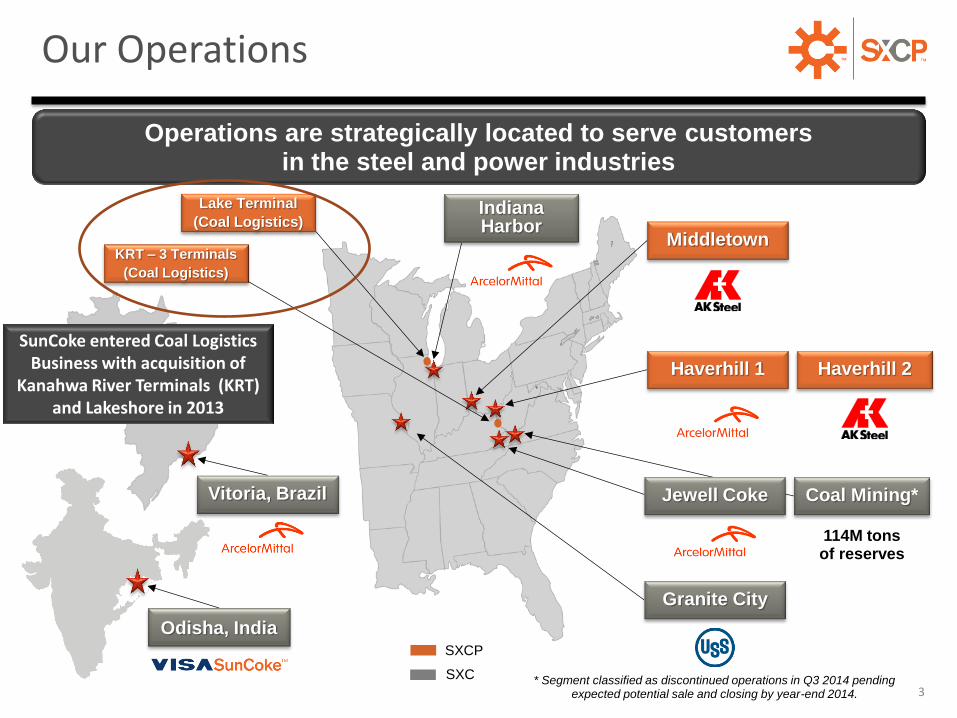
Operations are strategically located to serve customers in the steel and power industries
3
Middletown
Haverhill 1 Haverhill 2
Granite City
Coal Mining* Jewell Coke
Indiana Harbor
Vitoria, Brazil
114M tons of reserves
Lake Terminal
(Coal Logistics)
KRT – 3 Terminals
(Coal Logistics)
SXCP
SXC * Segment classified as discontinued operations in Q3 2014 pending expected potential sale and closing by year-end 2014.
Our Operations
SunCoke entered Coal Logistics Business with acquisition of
Kanahwa River Terminals (KRT) and Lakeshore in 2013
TM
4
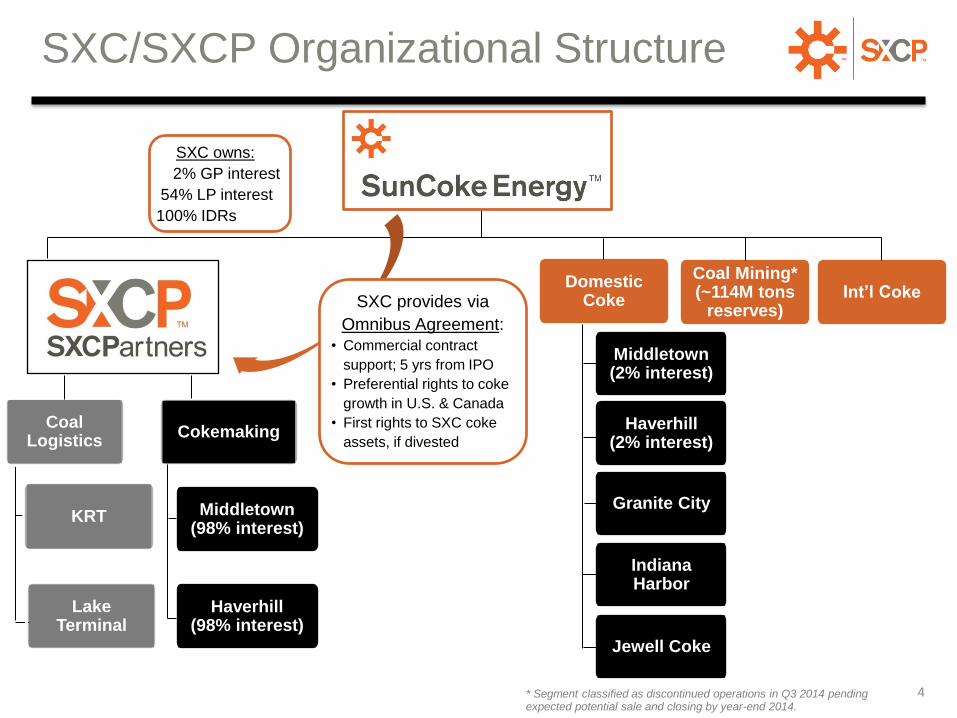
Middletown (98% interest)
SXC owns:
2% GP interest
54% LP interest
100% IDRs
Haverhill (98% interest)
Cokemaking Coal
Logistics
Coal Mining* (~114M tons
reserves) Int’l Coke
Haverhill (2% interest)
Middletown (2% interest)
Indiana Harbor
Jewell Coke
Granite City
Domestic Coke
KRT
Lake Terminal
SXC provides via
Omnibus Agreement:
• Commercial contract
support; 5 yrs from IPO
• Preferential rights to coke
growth in U.S. & Canada
• First rights to SXC coke
assets, if divested
* Segment classified as discontinued operations in Q3 2014 pending expected potential sale and closing by year-end 2014.
SXC/SXCP Organizational Structure

TM
5
Area of focus Cokemaking Coal Logistics Iron Ore Processing
Strategy
Greenfield development and/or acquisition of existing cokemaking
facilities with long-term off-take agreements
Acquisition or development
of selective coal handling & processing assets,
with long-term off-take arrangements
and limited commodity exposure
Investment in ferrous side of steel value chain, such as in concentrating, pelletizing and
transport/handling of iron ore
• Production ramp-up at Indiana Harbor • Received permit for
new plant in May 2014
• Exploring greenfield development opportunities
• Evaluating potential greenfield DRI opportunities
• Preferential rights to cokemaking growth opportunities
• Two acquisitions completed • Evaluating targeted
opportunities
• Received favorable rulings on qualifying income status of concentrating & pelletizing and DRI
Growth Strategy

TM
• Access to all U.S. East Coast, Gulf Coast and Great Lakes ports; Two railroads at Ceredo – CSX and NS
• Serves 2 SunCoke facilities as well as steel, coal and utility companies
• Provides precision blending services
• Acquired for $86M
6
SunCoke Coal Logistics - KRT
Ceredo Coal Terminal
• Throughput Capacity: 18M tons/year
• Storage Capacity: 425K tons
• Rail/Barge in; Rail/Barge out
Kentucky Coal Terminal
• Throughput Capacity: 6M tons/year
• Storage Capacity: 250K tons
• Truck in; Barge out
Ceredo Liquids Terminal
• Three 250K gallon finished prod tanks
• Four heated 1M gallon raw storage tanks
• Truck, Barge, Rail in/out
Quincy Coal Terminal
• Throughput Capacity: 6M tons/year
• Storage Capacity: 250K tons
• Truck in; Rail/Barge out

TM
Asset
•Coal blending site adjacent to SunCoke’s Indiana Harbor facility
•10-year contract to provide services to Indiana Harbor
Location East Chicago, Indiana
Acquisition Price
$29.4 million
7
SunCoke Coal Logistics - Lakeshore
TM
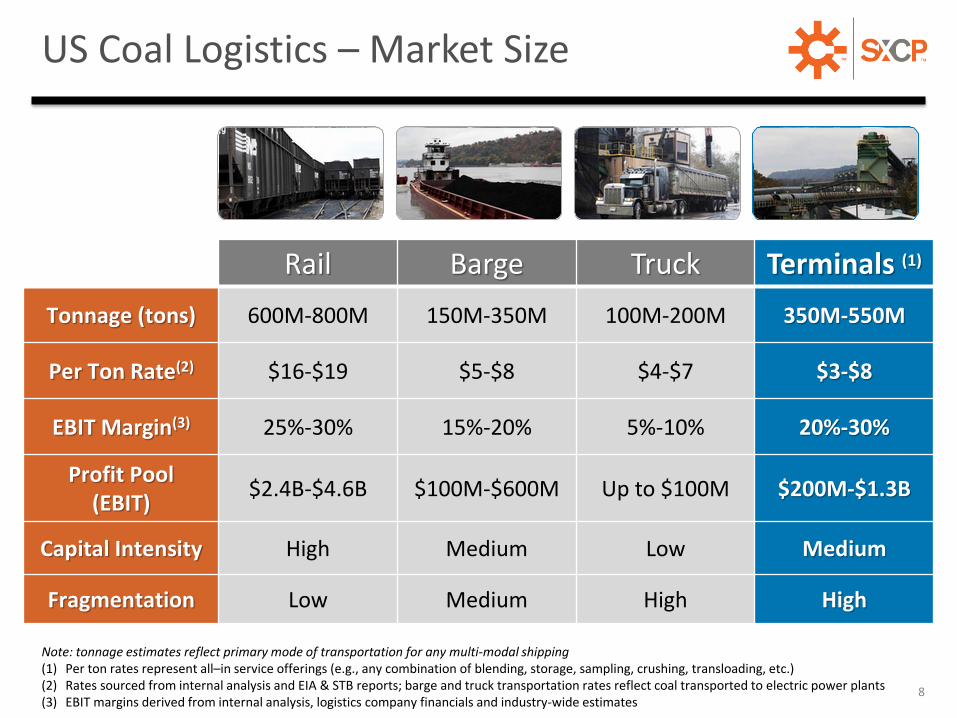
Note: tonnage estimates reflect primary mode of transportation for any multi-modal shipping (1) Per ton rates represent all–in service offerings (e.g., any combination of blending, storage, sampling, crushing, transloading, etc.) (2) Rates sourced from internal analysis and EIA & STB reports; barge and truck transportation rates reflect coal transported to electric power plants (3) EBIT margins derived from internal analysis, logistics company financials and industry-wide estimates
Rail Barge Truck Terminals (1)
Tonnage (tons) 600M-800M 150M-350M 100M-200M 350M-550M
Per Ton Rate(2) $16-$19 $5-$8 $4-$7 $3-$8
EBIT Margin(3) 25%-30% 15%-20% 5%-10% 20%-30%
Profit Pool (EBIT)
$2.4B-$4.6B $100M-$600M Up to $100M $200M-$1.3B
Capital Intensity High Medium Low Medium
Fragmentation Low Medium High High
8
US Coal Logistics – Market Size
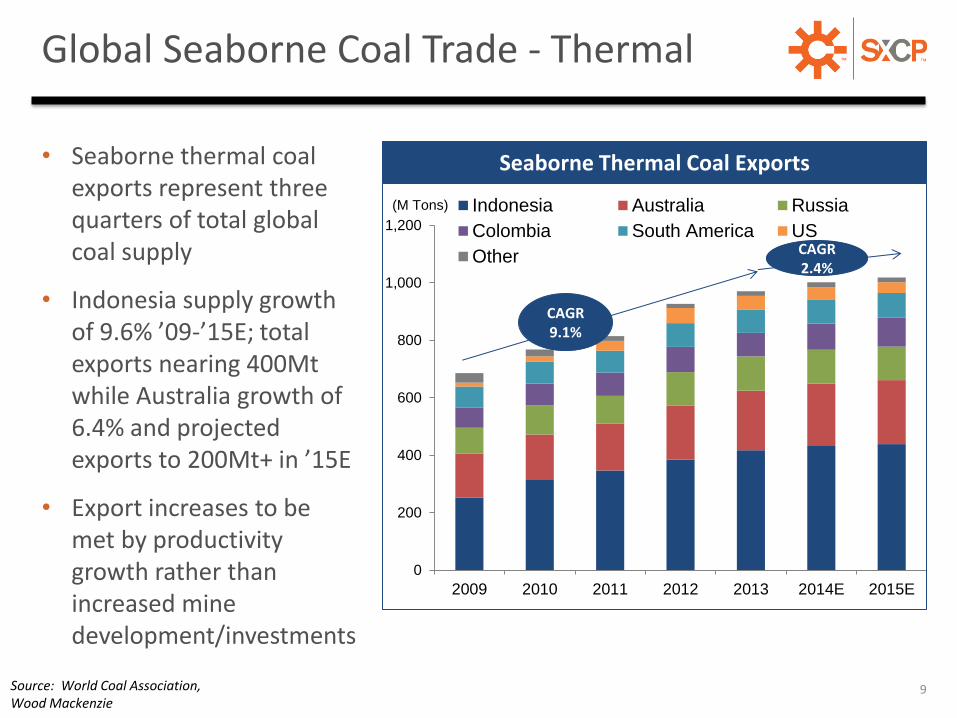
TM Global Seaborne Coal Trade - Thermal
• Seaborne thermal coal exports represent three quarters of total global coal supply
• Indonesia supply growth of 9.6% ’09-’15E; total exports nearing 400Mt while Australia growth of 6.4% and projected exports to 200Mt+ in ’15E
• Export increases to be met by productivity growth rather than increased mine development/investments
9 Source: World Coal Association,
Wood Mackenzie
0
200
400
600
800
1,000
1,200
2009 2010 2011 2012 2013 2014E 2015E
Indonesia Australia Russia
Colombia South America US
Other
Seaborne Thermal Coal Exports
(M Tons)
CAGR 2.4%
CAGR 9.1%
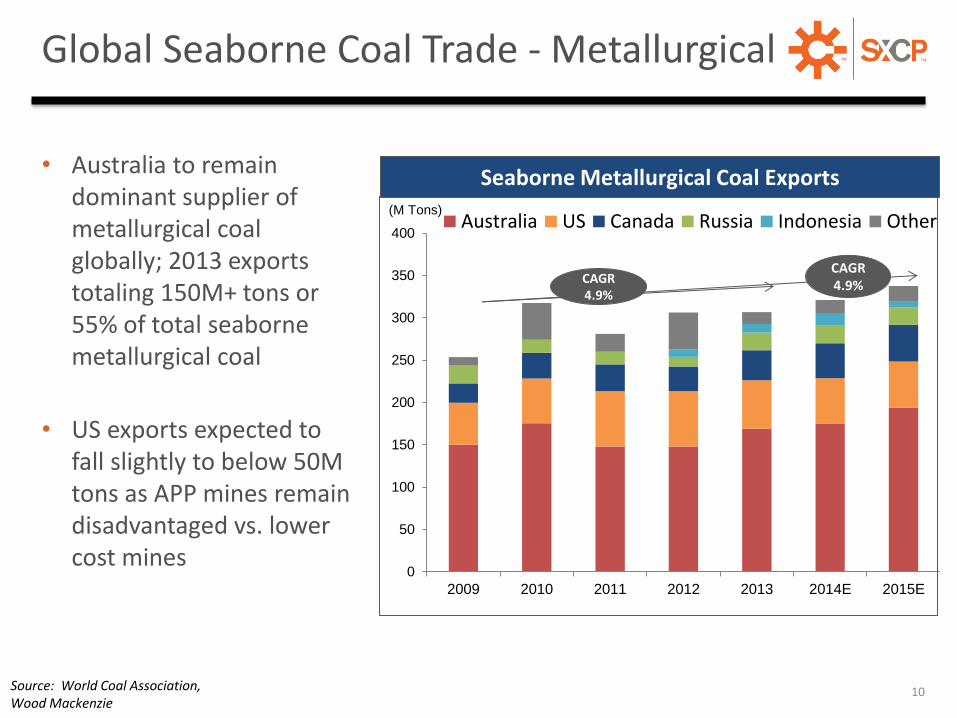
TM Global Seaborne Coal Trade - Metallurgical
0
50
100
150
200
250
300
350
400
2009 2010 2011 2012 2013 2014E 2015E
Australia US Canada Russia Indonesia Other
Seaborne Metallurgical Coal Exports
10
• Australia to remain dominant supplier of metallurgical coal globally; 2013 exports totaling 150M+ tons or 55% of total seaborne metallurgical coal
• US exports expected to fall slightly to below 50M tons as APP mines remain disadvantaged vs. lower cost mines
Source: World Coal Association, Wood Mackenzie
(M Tons)
CAGR 4.9% CAGR
4.9%

TM US Coal Exports
• Europe is the largest importer of thermal coal from the US
• Europe and Asia followed by S. America are the largest importers of US Met coal
• China’s import growth expected to slow as domestic production increases, steel production growth slows, new environmental regulations implemented
• Slight European decline in Met imports in 2013 driven primarily by decreased steel production
11
0
10
20
30
40
50
60
70
80
2009 2010 2011 2012 2013
Americas Europe Asia Other
Met Coal Exports by Destination (M Tons)
Source: EIA short-term energy outlook
0
10
20
30
40
50
60
70
80
2009 2010 2011 2012 2013
Americas Europe Asia Other
Thermal Coal Exports by Destination (M Tons)

TM East Coast Export Volume
12
-
10
20
30
40
50
60
'00 '01 '02 '03 '04 '05 '06 '07 '08 '09 '10 '11 '12 '13
Mil
Sho
rt t
on
s
Coal Exports from Norfolk, VA
-
10
20
30
40
50
60
'00 '01 '02 '03 '04 '05 '06 '07 '08 '09 '10 '11 '12 '13
Mil
Sho
rt t
on
s
Coal Exports from Baltimore, MD
Source: EIA
Export from the five major E. Coast terminals has grown significantly adding both steam and met exports to Europe, Brazil, and Asia; expected to drop-off in ‘14 & ‘15
0%
20%
40%
60%
80%
100%
'00 '01 '02 '03 '04 '05 '06 '07 '08 '09 '10 '11 '12 '13
Steam Met
0%
20%
40%
60%
80%
100%
'00 '01 '02 '03 '04 '05 '06 '07 '08 '09 '10 '11 '12 '13
Steam Met
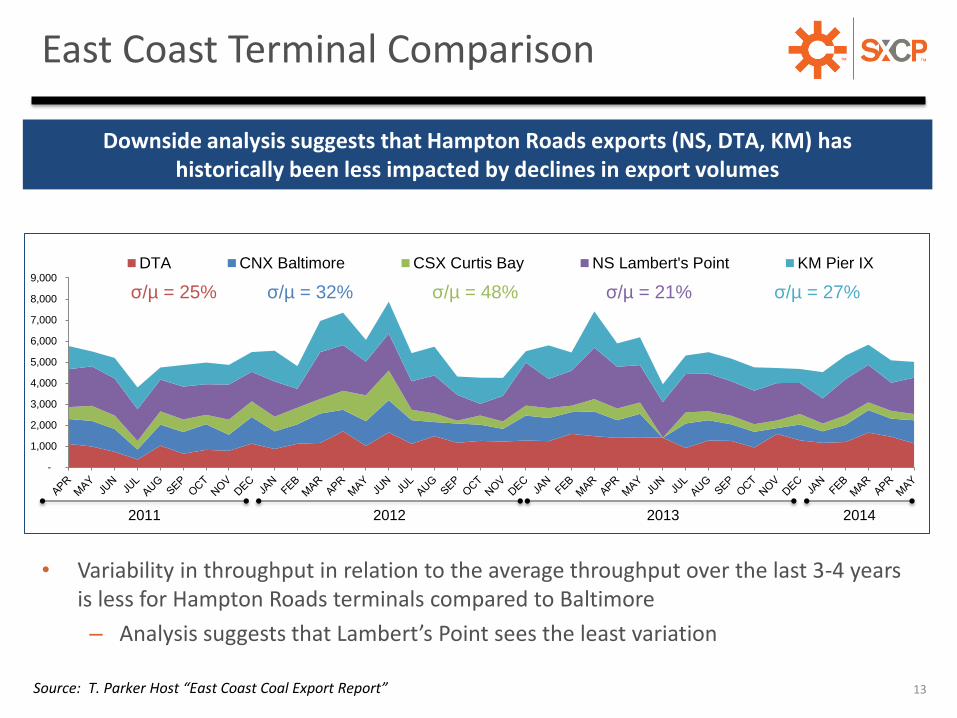
TM East Coast Terminal Comparison
Source: T. Parker Host “East Coast Coal Export Report”
2012
-
1,000
2,000
3,000
4,000
5,000
6,000
7,000
8,000
9,000
DTA CNX Baltimore CSX Curtis Bay NS Lambert's Point KM Pier IX
σ/µ = 25% σ/µ = 48% σ/µ = 21% σ/µ = 27% σ/µ = 32%
2011 2013 2014
Downside analysis suggests that Hampton Roads exports (NS, DTA, KM) has historically been less impacted by declines in export volumes
• Variability in throughput in relation to the average throughput over the last 3-4 years is less for Hampton Roads terminals compared to Baltimore
– Analysis suggests that Lambert’s Point sees the least variation
13

TM Summary
• The global seaborne coal trade remains healthy and will be a vital part of the global economy for the foreseeable future
• After peaking in 2012, US coal export volumes are forecast to decline for the next 18-24 months
• Weakness in Europe, slower growth in Asia, and increased seaborne coal supply from low cost Australian producers will impact the three primary export areas of the US (West Coast, Gulf Coast, and East Coast)
• Despite Appalachian coals being marginally competitive on a global cash cost basis, US East Coast exports are primarily driven by European and South American demand – two areas where the US is logistically advantaged
14

US Coal Export Market and Terminal - Appendix
Saurabh Pandey
Director of Business Development
SunCoke Energy
Platts Coal Marketing Days
Sept 22-23, 2014

TM Asian Demand
16 Source: World Steel Dynamics, Goldman Sachs “The Thermal Coal Paradox”
500
1,250
2,000
2,750
'09 '10 '11 '12 '13 '14E '15E '16E '17E '18E '19E '20E
Thermal - Coal Fired Boiler Utilities Met. – Steel Production Total Steel Production
500
1,250
2,000
2,750
'09 '10 '11 '12 '13 '14E '15E '16E '17E '18E '19E '20E
500
600
700
800
900
'09 '10 '11 '12 '13 '14E '15E '16E '17E '18E '19E '20E
Total Met Coal Consumption
(M tons)
(M tons)
(M tons)
Total Crude Steel Production - BF/BOF
India is now forecast to become the largest single market for seaborne thermal coal, helping to offset muted import demand growth in China
• Although China has been the key driver in thermal seaborne demand as of late, it faces headwinds from oversupply, environmental regulations, and a more diverse fuel mix shifting towards renewable energy
• India forecasted to become the biggest single market for seaborne thermal coal, as domestic production falls behind demand of the country’s highly coal-dependent power sector (~70% coal share of overall fuel mix)
Share of Coal in Fuel Mix (2012)
Seaborne Thermal Coal Import
by Region
CAGR 1.35%
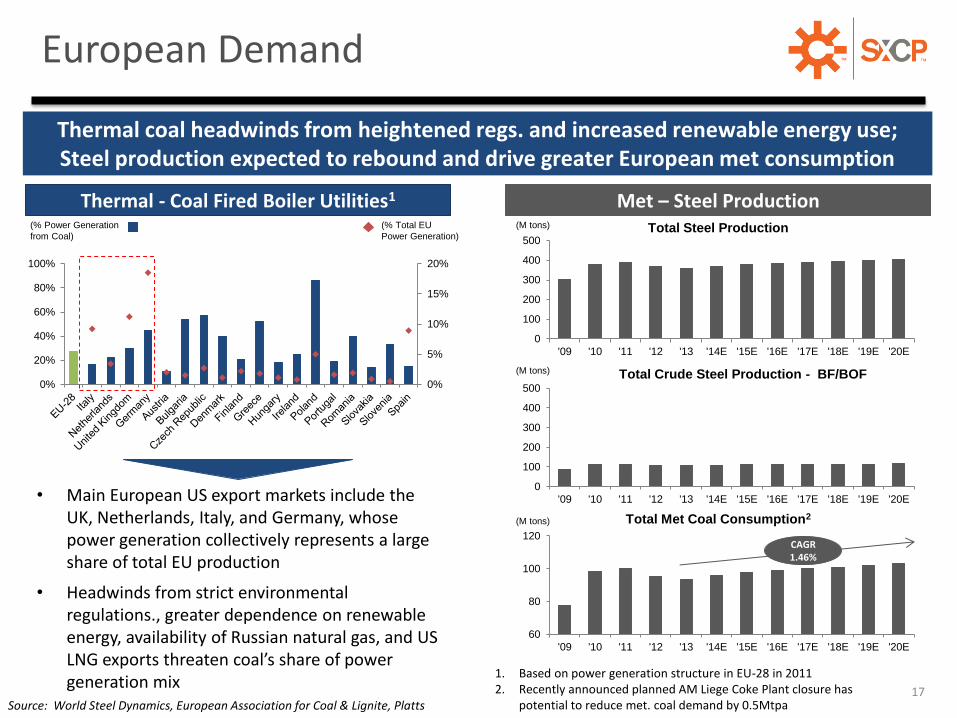
TM European Demand
Source: World Steel Dynamics, European Association for Coal & Lignite, Platts
0
100
200
300
400
500
'09 '10 '11 '12 '13 '14E '15E '16E '17E '18E '19E '20E
Thermal - Coal Fired Boiler Utilities1 Met – Steel Production Total Steel Production
0
100
200
300
400
500
'09 '10 '11 '12 '13 '14E '15E '16E '17E '18E '19E '20E
60
80
100
120
'09 '10 '11 '12 '13 '14E '15E '16E '17E '18E '19E '20E
Total Met Coal Consumption2
(M tons)
(M tons)
(M tons)
Total Crude Steel Production - BF/BOF
Thermal coal headwinds from heightened regs. and increased renewable energy use; Steel production expected to rebound and drive greater European met consumption
0%
5%
10%
15%
20%
0%
20%
40%
60%
80%
100%
• Main European US export markets include the UK, Netherlands, Italy, and Germany, whose power generation collectively represents a large share of total EU production
• Headwinds from strict environmental regulations., greater dependence on renewable energy, availability of Russian natural gas, and US LNG exports threaten coal’s share of power generation mix
1. Based on power generation structure in EU-28 in 2011 2. Recently announced planned AM Liege Coke Plant closure has
potential to reduce met. coal demand by 0.5Mtpa
(% Power Generation
from Coal)
(% Total EU
Power Generation)
CAGR 1.46%
17
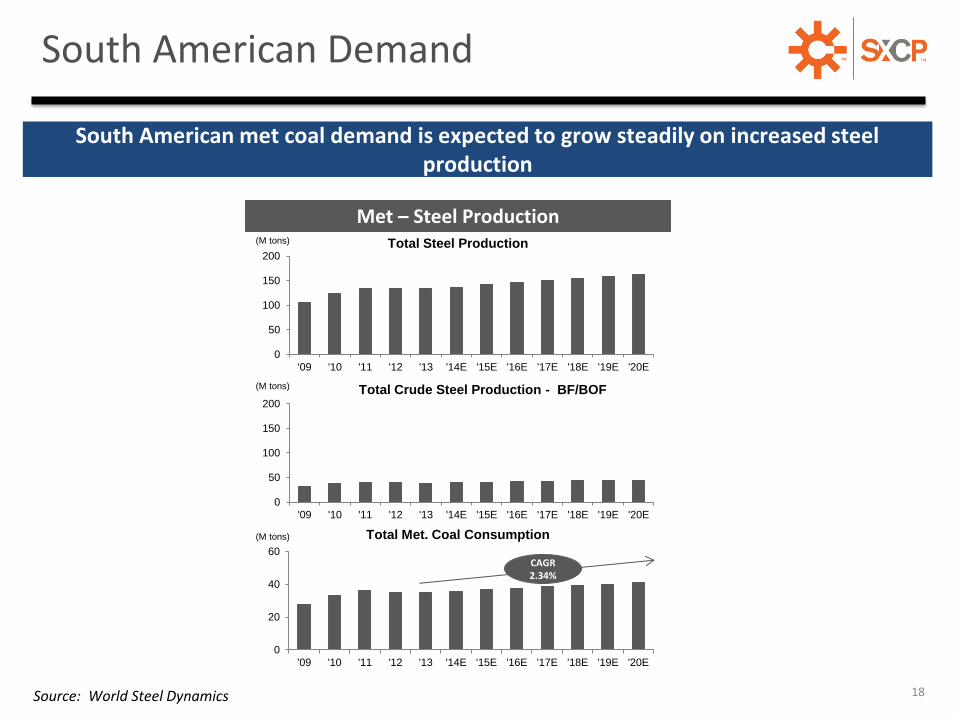
TM South American Demand
18 Source: World Steel Dynamics
0
50
100
150
200
'09 '10 '11 '12 '13 '14E '15E '16E '17E '18E '19E '20E
Met – Steel Production Total Steel Production
0
50
100
150
200
'09 '10 '11 '12 '13 '14E '15E '16E '17E '18E '19E '20E
0
20
40
60
'09 '10 '11 '12 '13 '14E '15E '16E '17E '18E '19E '20E
Total Met. Coal Consumption
(M tons)
(M tons)
(M tons)
Total Crude Steel Production - BF/BOF
South American met coal demand is expected to grow steadily on increased steel production
CAGR 2.34%


