34
Construction activity will grow in 2016, but at a slower rate United States Construction Perspective Q4 2015
| Date post: | 19-Jan-2017 |
| Category: |
Real Estate |
| Upload: | jll |
| View: | 5,012 times |
| Download: | 2 times |
Construction activity will grow
in 2016, but at a slower rateUnited States
Construction Perspective
Q4 2015
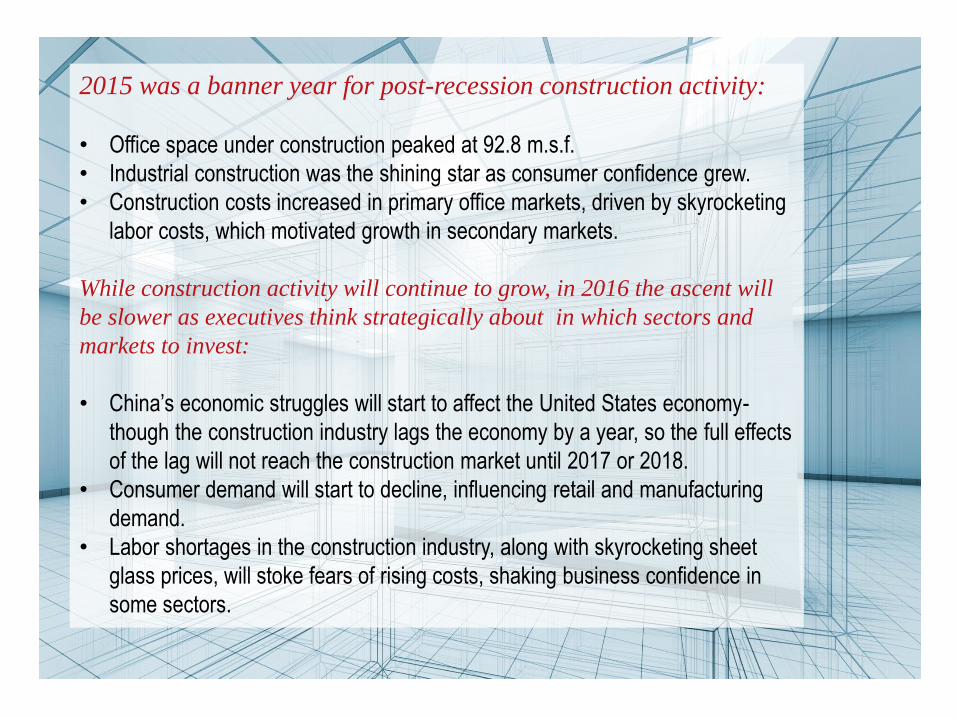
2015 was a banner year for post-recession construction activity:
• Office space under construction peaked at 92.8 m.s.f.
• Industrial construction was the shining star as consumer confidence grew.
• Construction costs increased in primary office markets, driven by skyrocketing
labor costs, which motivated growth in secondary markets.
While construction activity will continue to grow, in 2016 the ascent will
be slower as executives think strategically about in which sectors and
markets to invest:
• China’s economic struggles will start to affect the United States economy-
though the construction industry lags the economy by a year, so the full effects
of the lag will not reach the construction market until 2017 or 2018.
• Consumer demand will start to decline, influencing retail and manufacturing
demand.
• Labor shortages in the construction industry, along with skyrocketing sheet
glass prices, will stoke fears of rising costs, shaking business confidence in
some sectors.
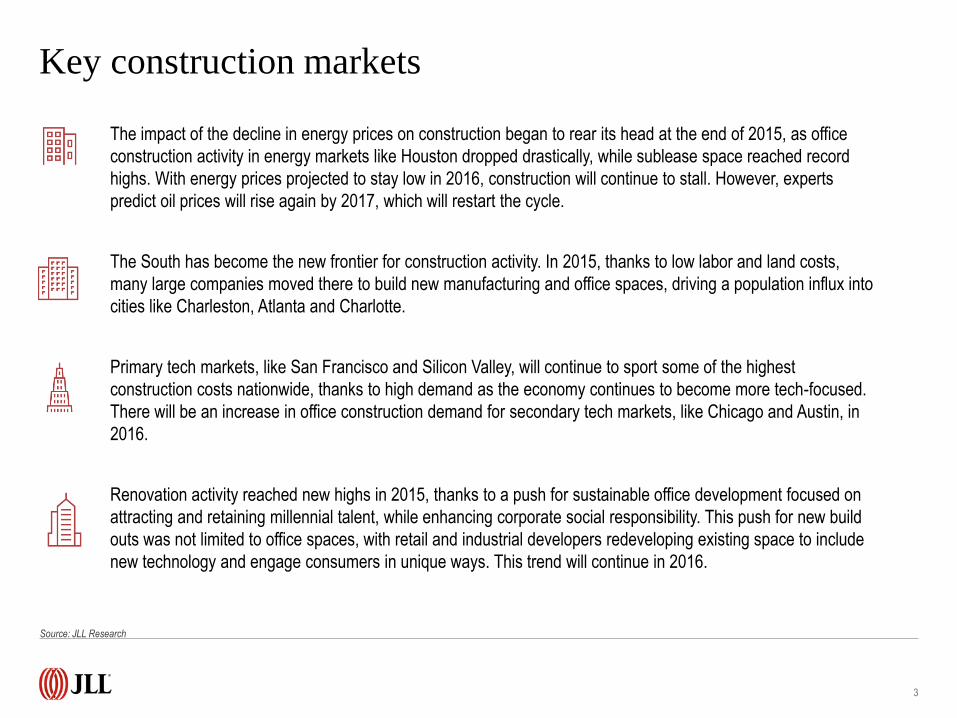
Key construction markets
3
Source: JLL Research
The impact of the decline in energy prices on construction began to rear its head at the end of 2015, as office
construction activity in energy markets like Houston dropped drastically, while sublease space reached record
highs. With energy prices projected to stay low in 2016, construction will continue to stall. However, experts
predict oil prices will rise again by 2017, which will restart the cycle.
The South has become the new frontier for construction activity. In 2015, thanks to low labor and land costs,
many large companies moved there to build new manufacturing and office spaces, driving a population influx into
cities like Charleston, Atlanta and Charlotte.
Primary tech markets, like San Francisco and Silicon Valley, will continue to sport some of the highest
construction costs nationwide, thanks to high demand as the economy continues to become more tech-focused.
There will be an increase in office construction demand for secondary tech markets, like Chicago and Austin, in
2016.
Renovation activity reached new highs in 2015, thanks to a push for sustainable office development focused on
attracting and retaining millennial talent, while enhancing corporate social responsibility. This push for new build
outs was not limited to office spaces, with retail and industrial developers redeveloping existing space to include
new technology and engage consumers in unique ways. This trend will continue in 2016.
Economic growth in 2015
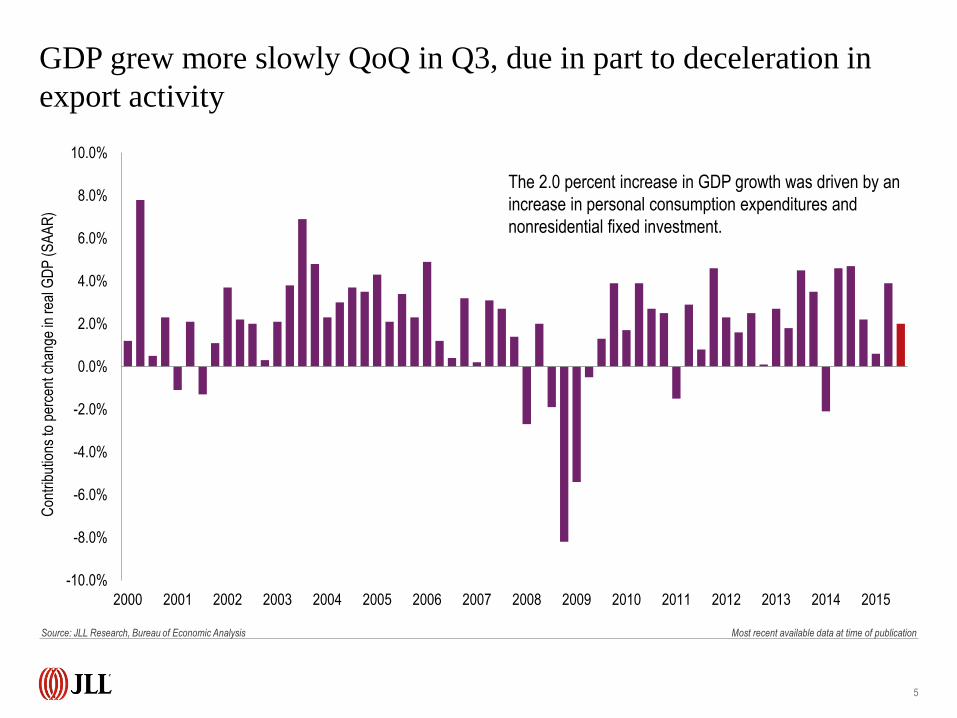
GDP grew more slowly QoQ in Q3, due in part to deceleration in
export activity
5
-10.0%
-8.0%
-6.0%
-4.0%
-2.0%
0.0%
2.0%
4.0%
6.0%
8.0%
10.0%
2000 2001 2002 2003 2004 2005 2006 2007 2008 2009 2010 2011 2012 2013 2014 2015
Con
trib
utio
ns to
per
cent
cha
nge
in r
eal G
DP
(S
AA
R)
The 2.0 percent increase in GDP growth was driven by an
increase in personal consumption expenditures and
nonresidential fixed investment.
Source: JLL Research, Bureau of Economic Analysis Most recent available data at time of publication
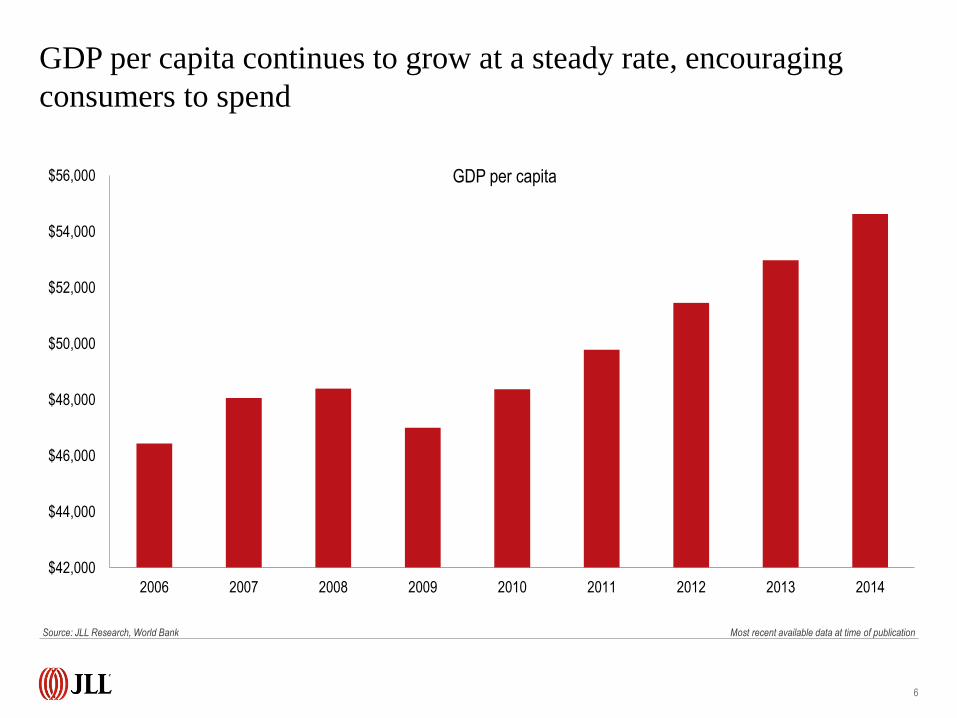
GDP per capita continues to grow at a steady rate, encouraging
consumers to spend
6
Source: JLL Research, World Bank Most recent available data at time of publication
$42,000
$44,000
$46,000
$48,000
$50,000
$52,000
$54,000
$56,000
2006 2007 2008 2009 2010 2011 2012 2013 2014
GDP per capita
7
Con
stru
ctio
n em
ploy
men
t (n
umbe
r of
em
ploy
ees,
in th
ousa
nds)
Overall em
ployment (num
ber of employees, in thousands)
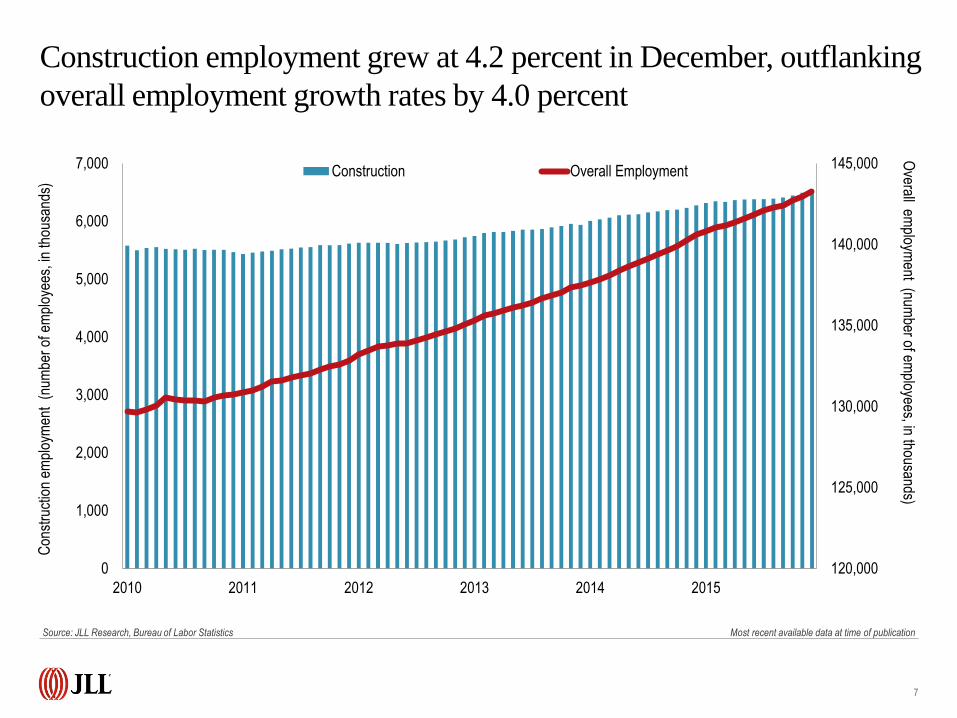
Construction employment grew at 4.2 percent in December, outflanking
overall employment growth rates by 4.0 percent
120,000
125,000
130,000
135,000
140,000
145,000
0
1,000
2,000
3,000
4,000
5,000
6,000
7,000
2010 2011 2012 2013 2014 2015
Construction Overall Employment
Source: JLL Research, Bureau of Labor Statistics Most recent available data at time of publication
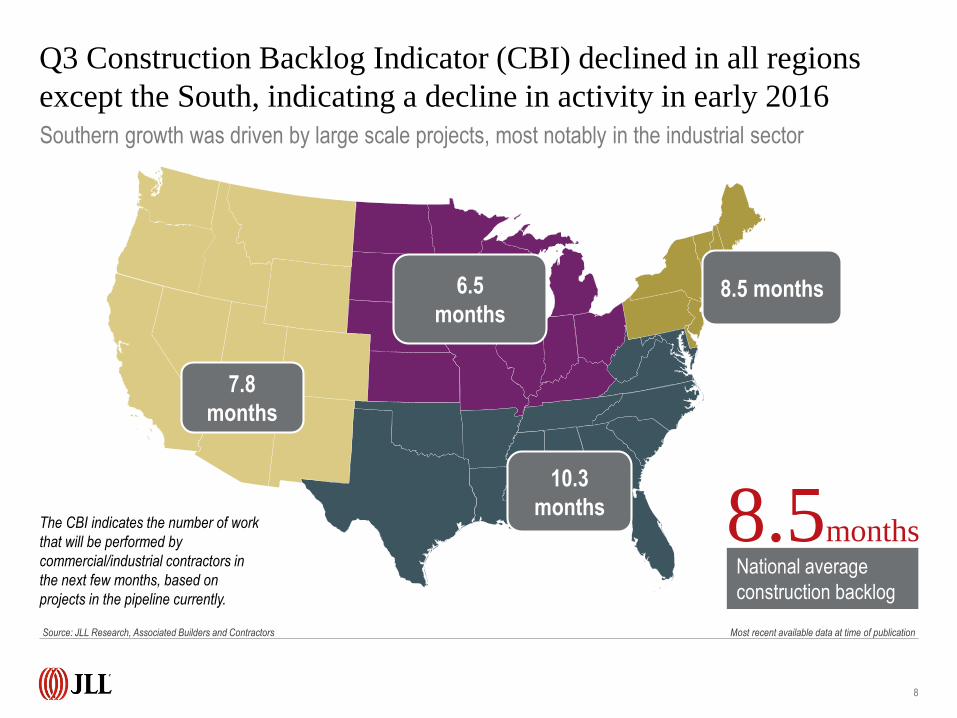
Q3 Construction Backlog Indicator (CBI) declined in all regions
except the South, indicating a decline in activity in early 2016
8
Southern growth was driven by large scale projects, most notably in the industrial sector
7.8
months
10.3
months
8.5 months6.5
months
National average
construction backlog
8.5monthsThe CBI indicates the number of work
that will be performed by
commercial/industrial contractors in
the next few months, based on
projects in the pipeline currently.
Source: JLL Research, Associated Builders and Contractors Most recent available data at time of publication
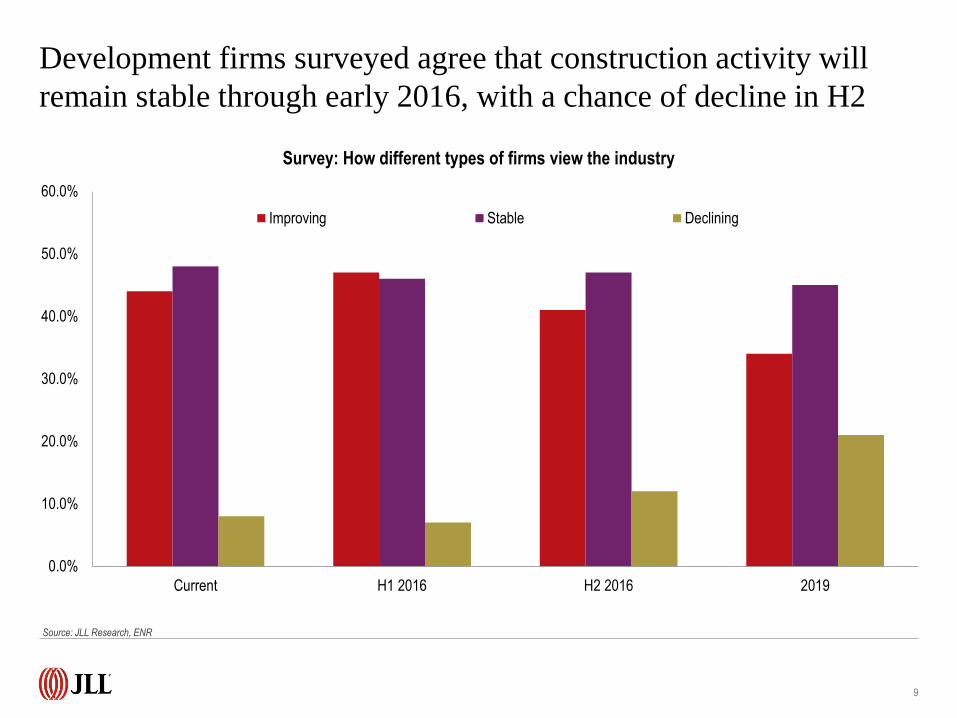
9
0.0%
10.0%
20.0%
30.0%
40.0%
50.0%
60.0%
Current H1 2016 H2 2016 2019
Improving Stable Declining
Survey: How different types of firms view the industry
Development firms surveyed agree that construction activity will
remain stable through early 2016, with a chance of decline in H2
Source: JLL Research, ENR
Cost trends: wages are growing, driving overall cost increase
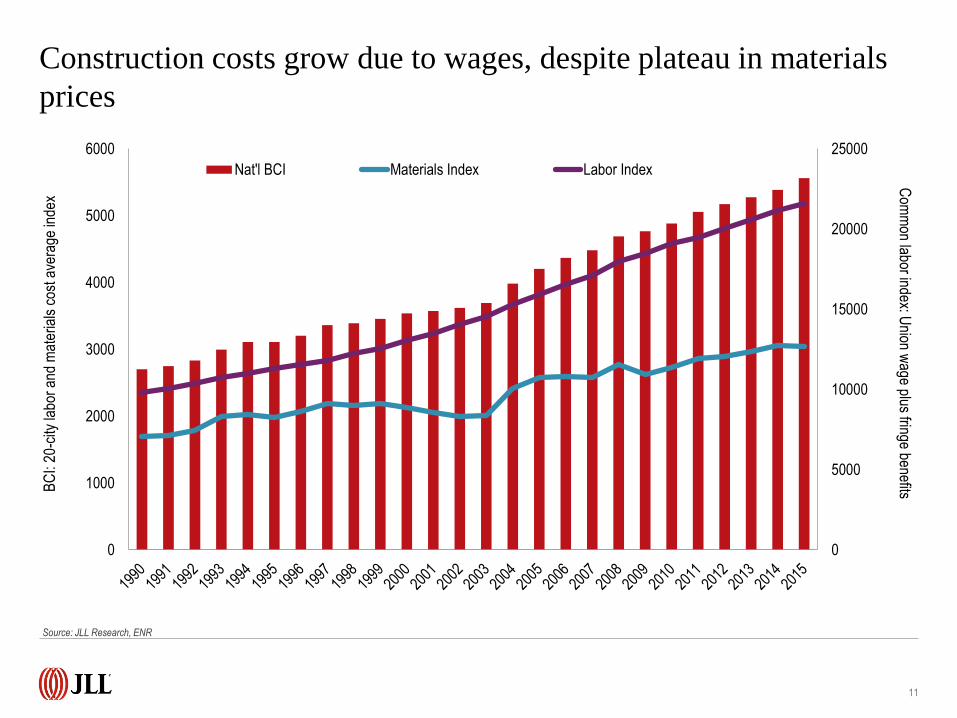
BC
I: 20
-city
labo
r an
d m
ater
ials
cos
t ave
rage
inde
x
0
5000
10000
15000
20000
25000
0
1000
2000
3000
4000
5000
6000
Nat'l BCI Materials Index Labor Index
11
Com
mon labor index: U
nion wage plus fringe benefits
Construction costs grow due to wages, despite plateau in materials
prices
Source: JLL Research, ENR
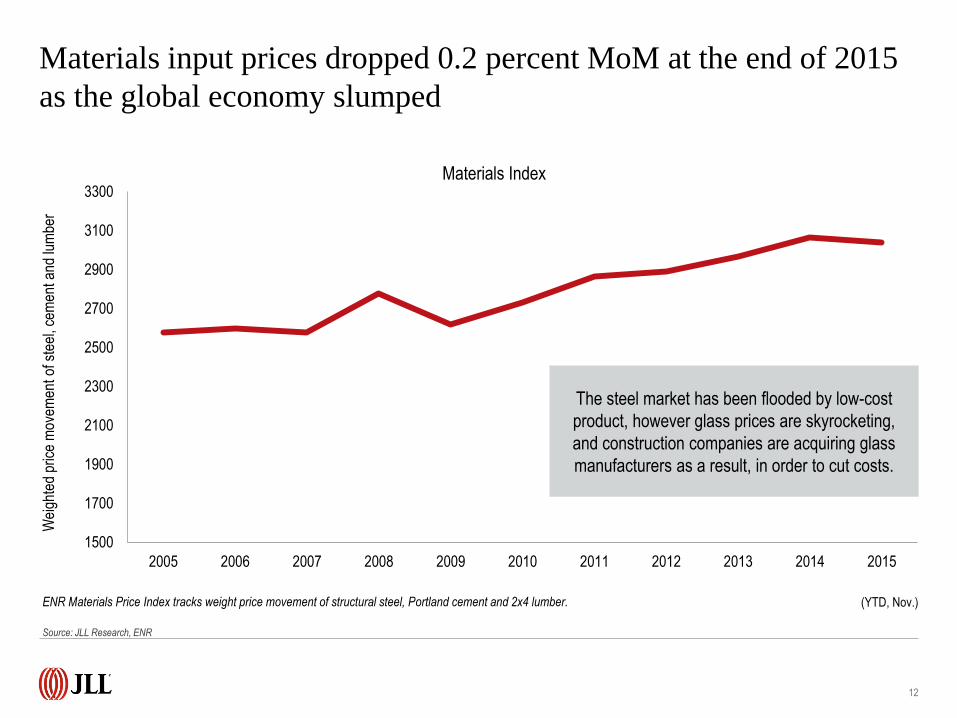
1500
1700
1900
2100
2300
2500
2700
2900
3100
3300
2005 2006 2007 2008 2009 2010 2011 2012 2013 2014 2015
Materials Index
12
ENR Materials Price Index tracks weight price movement of structural steel, Portland cement and 2x4 lumber.
Wei
ghte
d pr
ice
mov
emen
t of s
teel
, cem
ent a
nd lu
mbe
r
The steel market has been flooded by low-cost
product, however glass prices are skyrocketing,
and construction companies are acquiring glass
manufacturers as a result, in order to cut costs.
(YTD, Nov.)
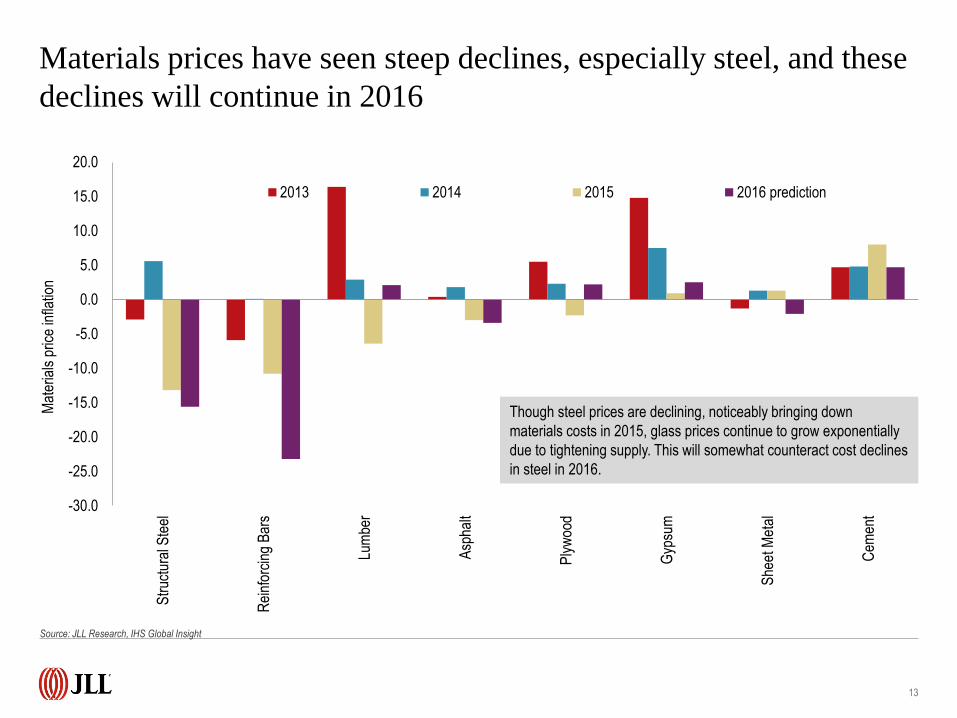
Materials input prices dropped 0.2 percent MoM at the end of 2015
as the global economy slumped
Source: JLL Research, ENR
13
Mat
eria
ls p
rice
infla
tion
-30.0
-25.0
-20.0
-15.0
-10.0
-5.0
0.0
5.0
10.0
15.0
20.0S
truc
tura
l Ste
el
Rei
nfor
cing
Bar
s
Lum
ber
Asp
halt
Ply
woo
d
Gyp
sum
She
et M
etal
Cem
ent
2013 2014 2015 2016 prediction
Though steel prices are declining, noticeably bringing down
materials costs in 2015, glass prices continue to grow exponentially
due to tightening supply. This will somewhat counteract cost declines
in steel in 2016.
Materials prices have seen steep declines, especially steel, and these
declines will continue in 2016
Source: JLL Research, IHS Global Insight
$0
$200
$400
$600
$800
$1,000
$1,200
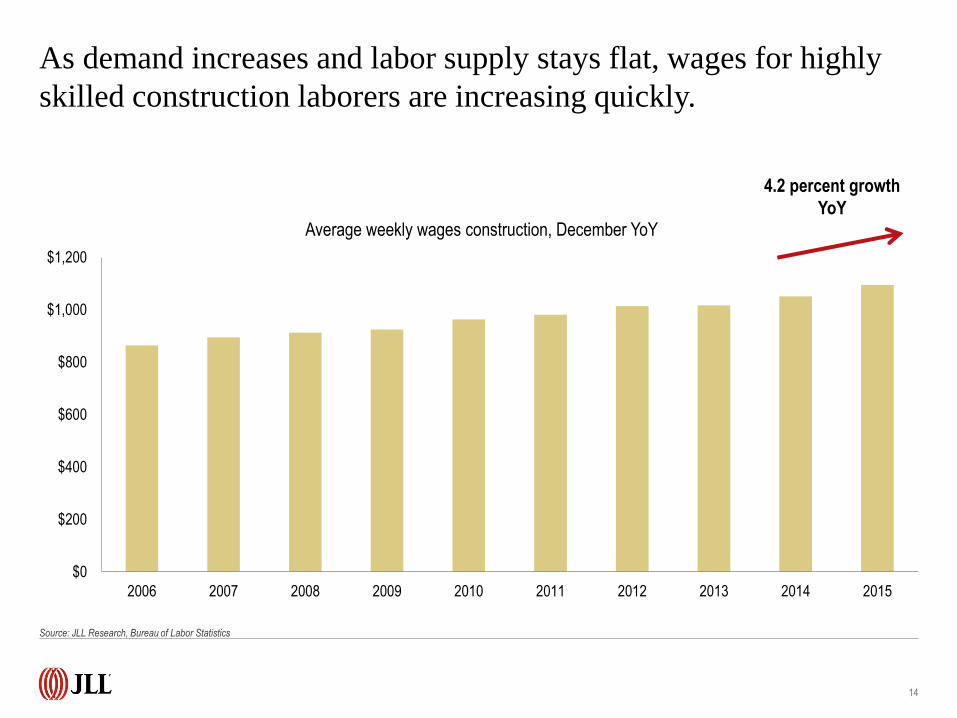
2006 2007 2008 2009 2010 2011 2012 2013 2014 2015
Average weekly wages construction, December YoY
14
4.2 percent growth
YoY
As demand increases and labor supply stays flat, wages for highly
skilled construction laborers are increasing quickly.
Source: JLL Research, Bureau of Labor Statistics
15
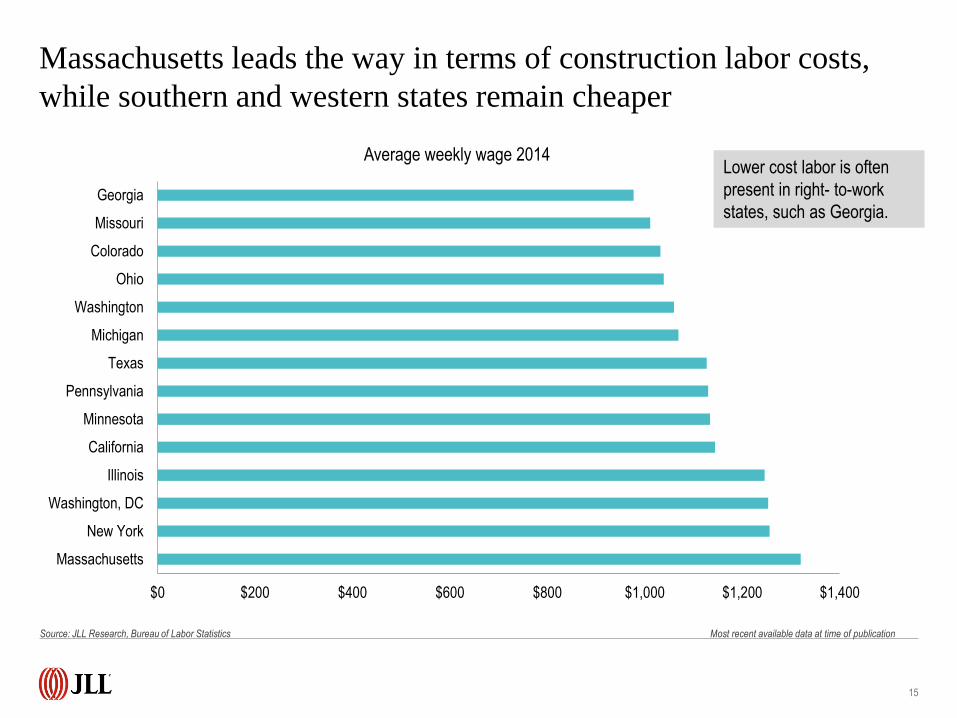
$0 $200 $400 $600 $800 $1,000 $1,200 $1,400
Massachusetts
New York
Washington, DC
Illinois
California
Minnesota
Pennsylvania
Texas
Michigan
Washington
Ohio
Colorado
Missouri
Georgia
Average weekly wage 2014Lower cost labor is often
present in right- to-work
states, such as Georgia.
Massachusetts leads the way in terms of construction labor costs,
while southern and western states remain cheaper
Source: JLL Research, Bureau of Labor Statistics Most recent available data at time of publication
16
Non
resi
dent
ial p
ut in
pla
ce (
$M)
$580.0
$600.0
$620.0
$640.0
$660.0
$680.0
$700.0
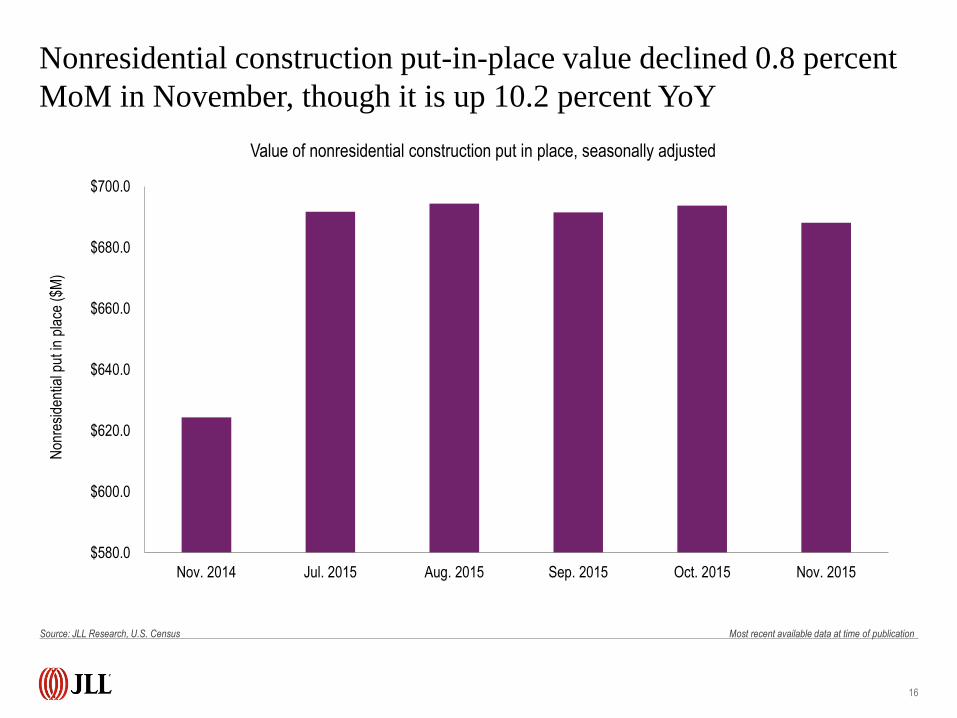
Nov. 2014 Jul. 2015 Aug. 2015 Sep. 2015 Oct. 2015 Nov. 2015
Value of nonresidential construction put in place, seasonally adjusted
Nonresidential construction put-in-place value declined 0.8 percent
MoM in November, though it is up 10.2 percent YoY
Source: JLL Research, U.S. Census Most recent available data at time of publication
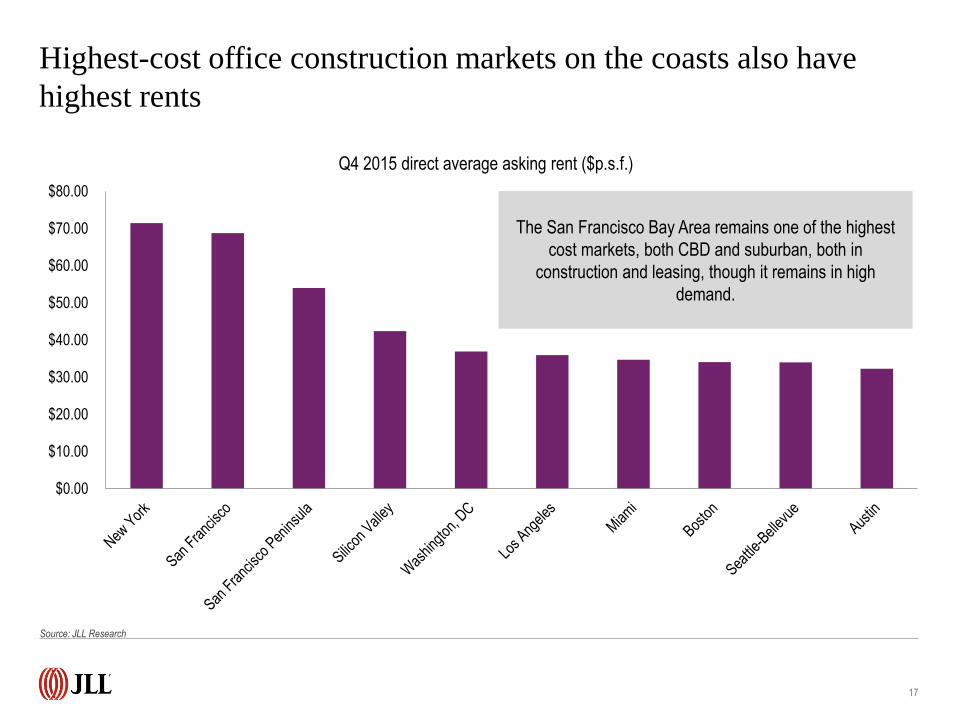
$0.00
$10.00
$20.00
$30.00
$40.00
$50.00
$60.00
$70.00
$80.00
Q4 2015 direct average asking rent ($p.s.f.)
17
The San Francisco Bay Area remains one of the highest
cost markets, both CBD and suburban, both in
construction and leasing, though it remains in high
demand.
Highest-cost office construction markets on the coasts also have
highest rents
Source: JLL Research
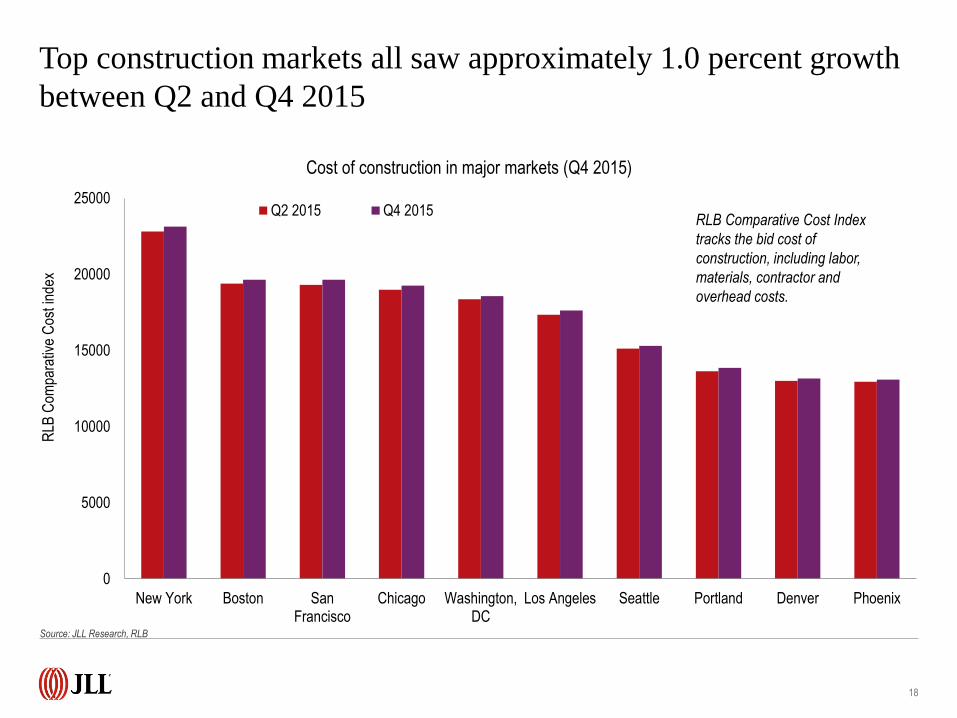
0
5000
10000
15000
20000
25000
New York Boston SanFrancisco
Chicago Washington,DC
Los Angeles Seattle Portland Denver Phoenix
Q2 2015 Q4 2015
18
Cost of construction in major markets (Q4 2015)
RLB Comparative Cost Index
tracks the bid cost of
construction, including labor,
materials, contractor and
overhead costs.
RLB
Com
para
tive
Cos
t ind
exTop construction markets all saw approximately 1.0 percent growth
between Q2 and Q4 2015
Source: JLL Research, RLB
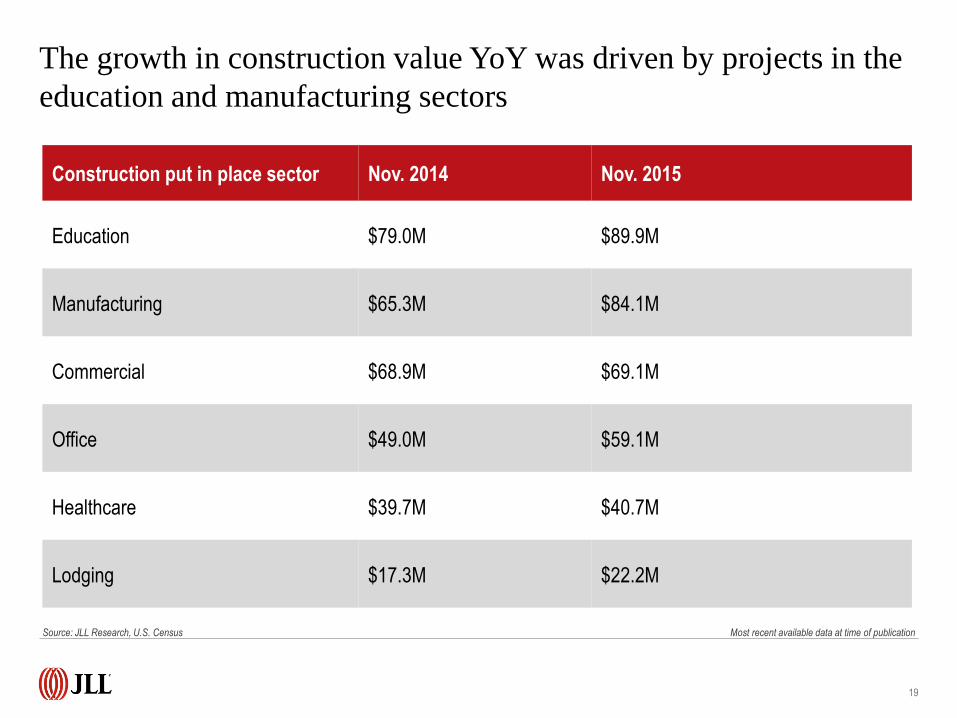
19
Construction put in place sector Nov. 2014 Nov. 2015
Education $79.0M $89.9M
Manufacturing $65.3M $84.1M
Commercial $68.9M $69.1M
Office $49.0M $59.1M
Healthcare $39.7M $40.7M
Lodging $17.3M $22.2M
The growth in construction value YoY was driven by projects in the
education and manufacturing sectors
Source: JLL Research, U.S. Census Most recent available data at time of publication
2015 was a strong growth year for all property types, but growth is beginning to slow
21
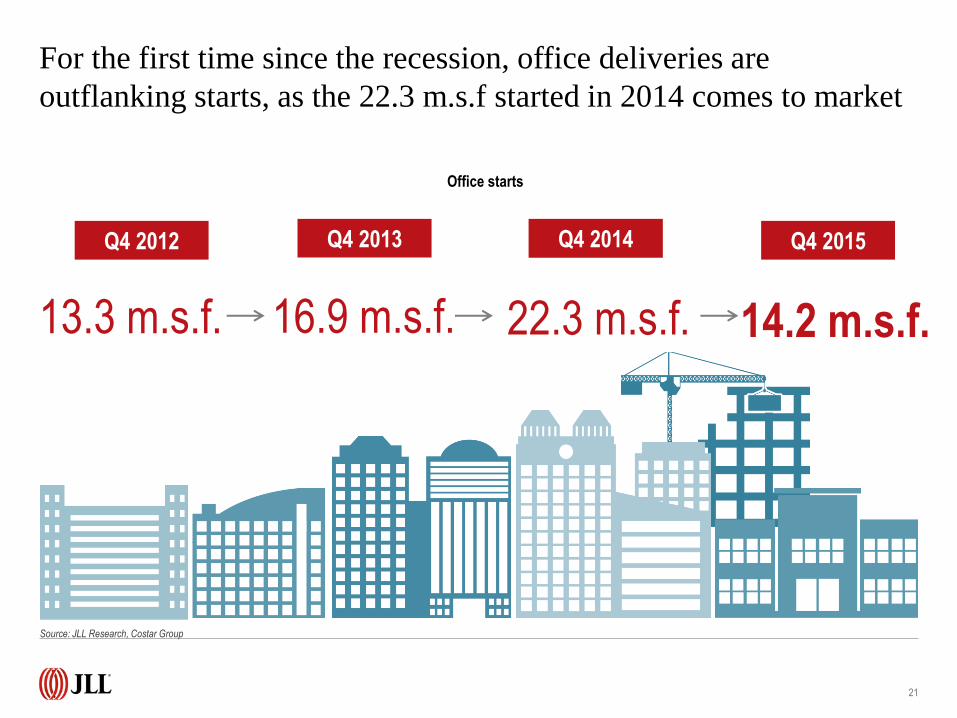
16.9 m.s.f. 22.3 m.s.f. 14.2 m.s.f.
Q4 2012
13.3 m.s.f.
Q4 2013 Q4 2014 Q4 2015
Office starts
For the first time since the recession, office deliveries are
outflanking starts, as the 22.3 m.s.f started in 2014 comes to market
Source: JLL Research, Costar Group
0
20,000,000
40,000,000
60,000,000
80,000,000
100,000,000
120,000,000
140,000,000
2000 2001 2002 2003 2004 2005 2006 2007 2008 2009 2010 2011 2012 2013 2014 2015
Com
plet
ions
(s.
f.)
22
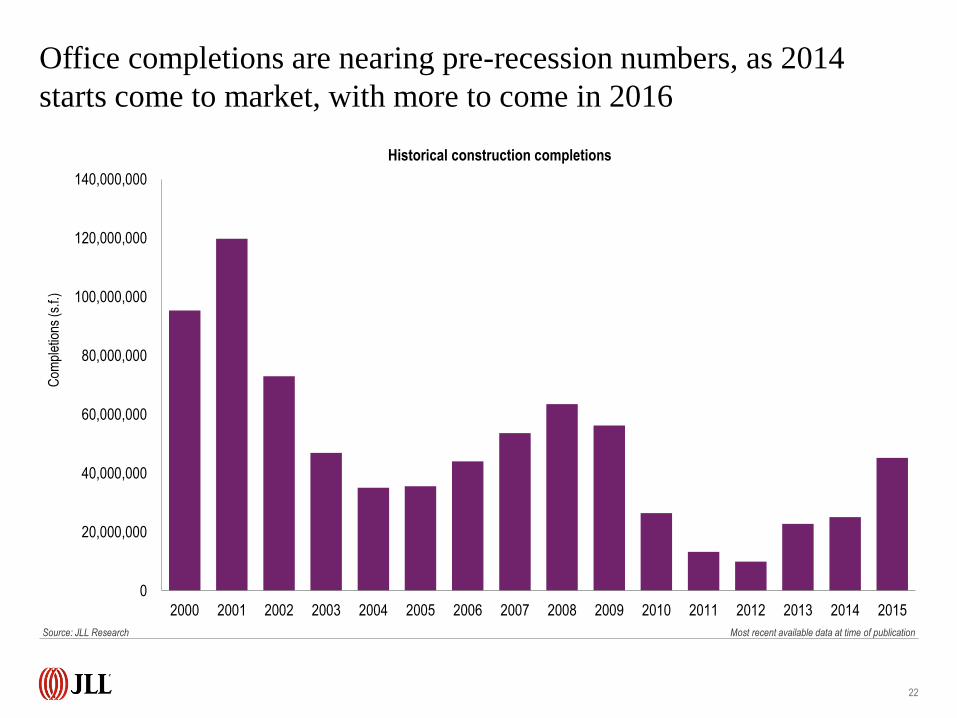
Historical construction completions
Office completions are nearing pre-recession numbers, as 2014
starts come to market, with more to come in 2016
Source: JLL Research Most recent available data at time of publication
23
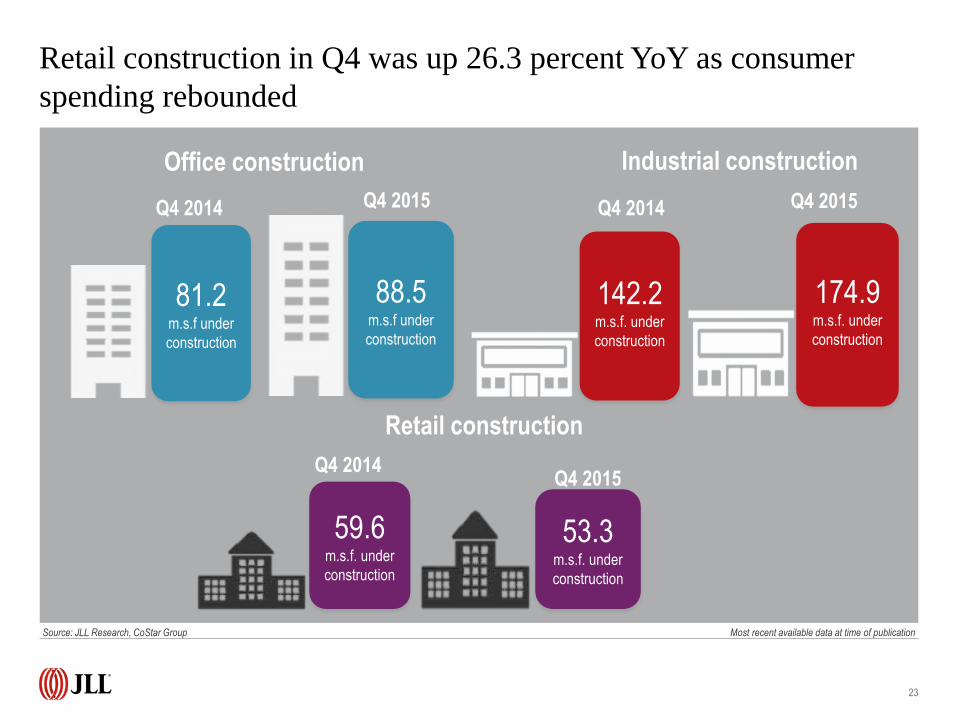
Industrial construction
Retail construction
142.2m.s.f. under
construction
Q4 2015 Q4 2014 Q4 2015
174.9m.s.f. under
construction
59.6m.s.f. under
construction
53.3m.s.f. under
construction
Q4 2014Q4 2015
Office construction
Q4 2014
88.5m.s.f under
construction
81.2m.s.f under
construction
Retail construction in Q4 was up 26.3 percent YoY as consumer
spending rebounded
Source: JLL Research, CoStar Group Most recent available data at time of publication
24
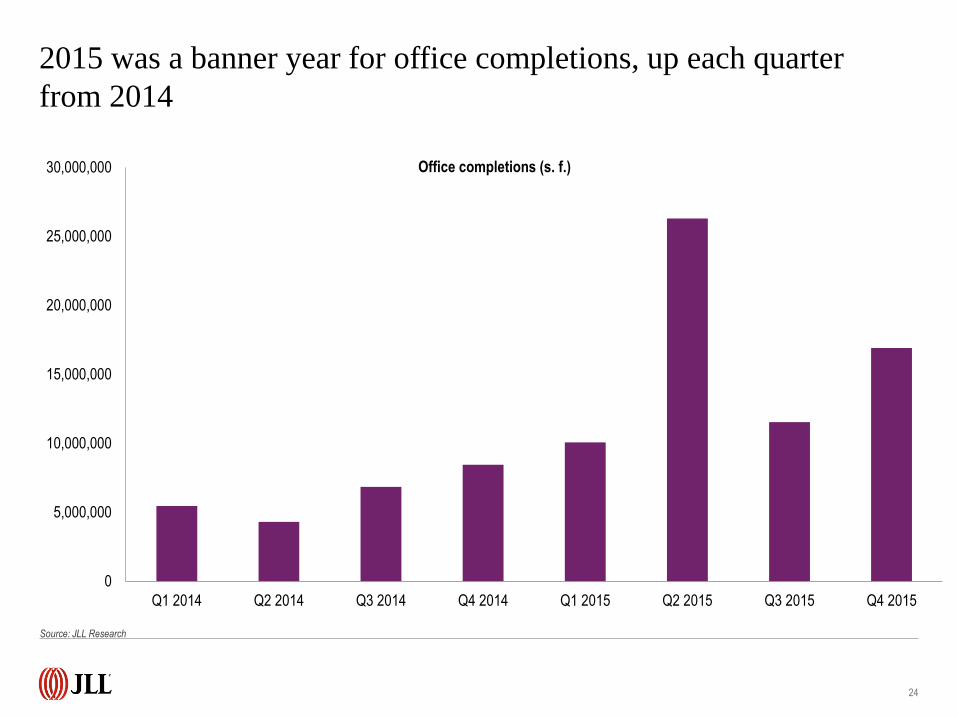
Office completions (s. f.)
0
5,000,000
10,000,000
15,000,000
20,000,000
25,000,000
30,000,000
Q1 2014 Q2 2014 Q3 2014 Q4 2014 Q1 2015 Q2 2015 Q3 2015 Q4 2015
2015 was a banner year for office completions, up each quarter
from 2014
Source: JLL Research
25
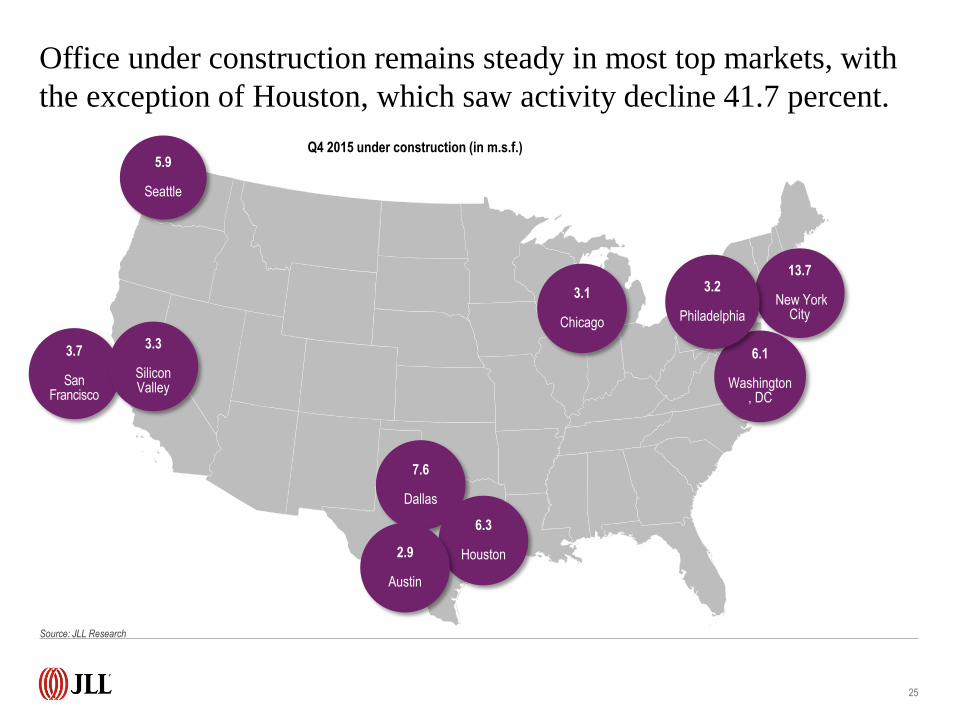
7.6
Dallas
5.9
Seattle
3.7
San Francisco
3.3
Silicon Valley
6.3
Houston
3.1
Chicago
2.9
Austin
13.7
New York City
6.1
Washington, DC
3.2
Philadelphia
Q4 2015 under construction (in m.s.f.)
Office under construction remains steady in most top markets, with
the exception of Houston, which saw activity decline 41.7 percent.
Source: JLL Research
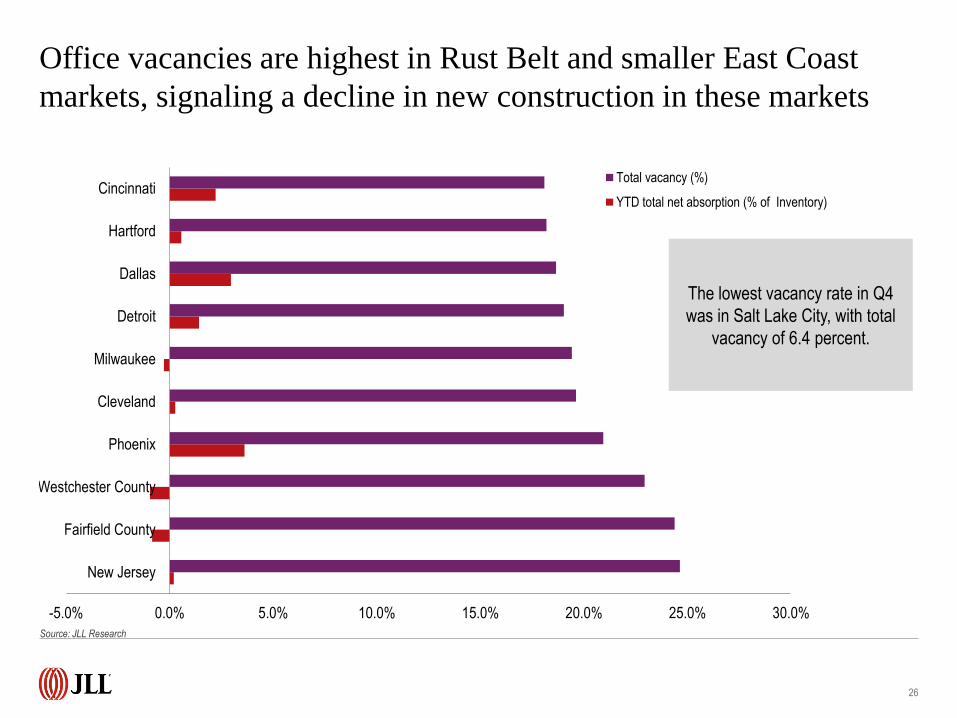
Office vacancies are highest in Rust Belt and smaller East Coast
markets, signaling a decline in new construction in these markets
26
The lowest vacancy rate in Q4
was in Salt Lake City, with total
vacancy of 6.4 percent.
-5.0% 0.0% 5.0% 10.0% 15.0% 20.0% 25.0% 30.0%
New Jersey
Fairfield County
Westchester County
Phoenix
Cleveland
Milwaukee
Detroit
Dallas
Hartford
CincinnatiTotal vacancy (%)
YTD total net absorption (% of Inventory)
Source: JLL Research
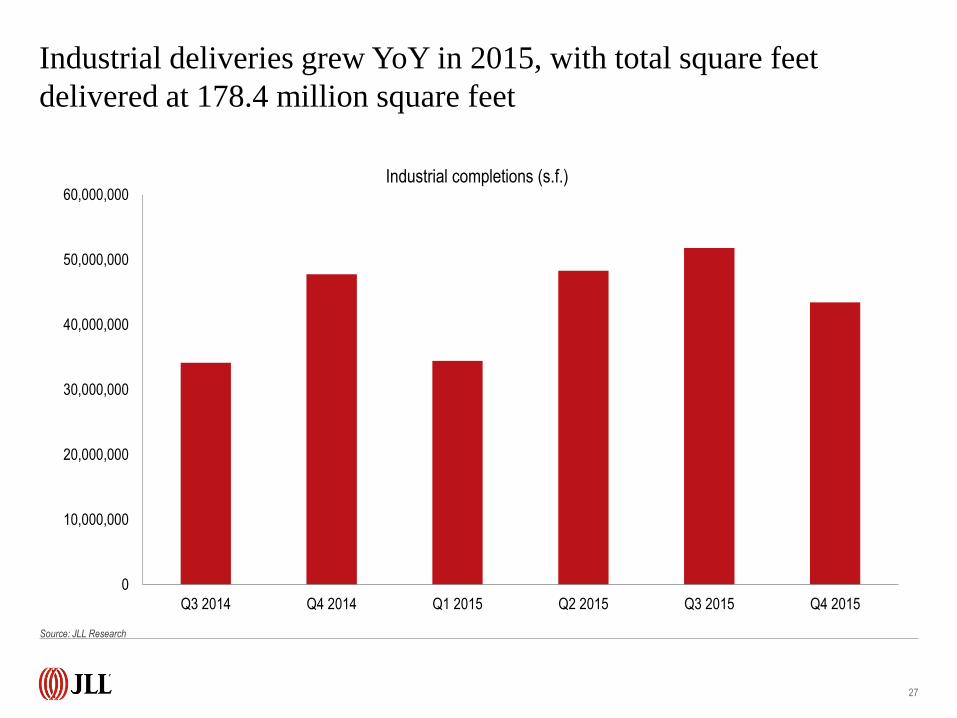
27
0
10,000,000
20,000,000
30,000,000
40,000,000
50,000,000
60,000,000
Q3 2014 Q4 2014 Q1 2015 Q2 2015 Q3 2015 Q4 2015
Industrial completions (s.f.)
Industrial deliveries grew YoY in 2015, with total square feet
delivered at 178.4 million square feet
Source: JLL Research
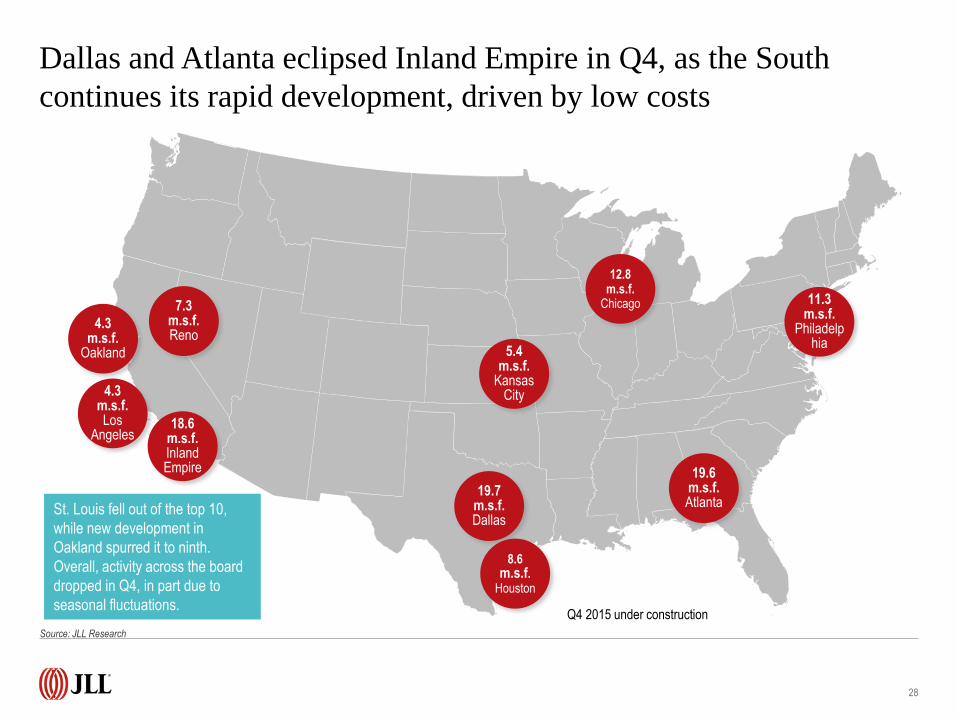
18.6m.s.f.Inland Empire
7.3m.s.f.Reno
28
19.7m.s.f.Dallas
4.3m.s.f.Los
Angeles
4.3m.s.f.
Oakland
8.6m.s.f.
Houston
12.8m.s.f.
Chicago
5.4m.s.f.
Kansas City
19.6m.s.f.Atlanta
11.3m.s.f.
Philadelphia
Q4 2015 under construction
St. Louis fell out of the top 10,
while new development in
Oakland spurred it to ninth.
Overall, activity across the board
dropped in Q4, in part due to
seasonal fluctuations.
Dallas and Atlanta eclipsed Inland Empire in Q4, as the South
continues its rapid development, driven by low costs
Source: JLL Research
29
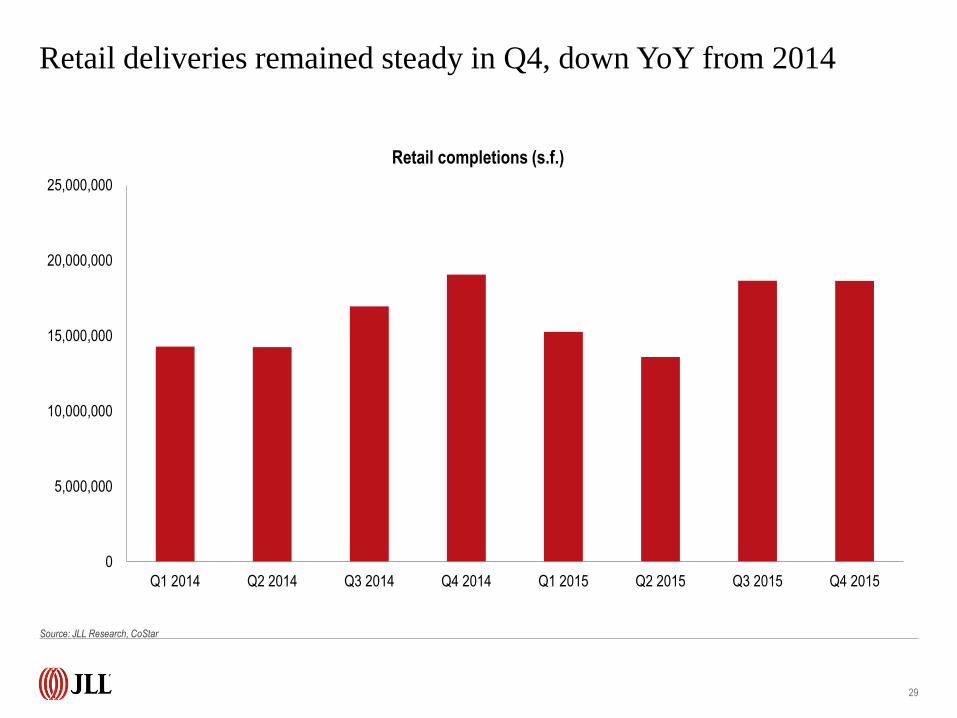
0
5,000,000
10,000,000
15,000,000
20,000,000
25,000,000
Q1 2014 Q2 2014 Q3 2014 Q4 2014 Q1 2015 Q2 2015 Q3 2015 Q4 2015
Retail completions (s.f.)
Retail deliveries remained steady in Q4, down YoY from 2014
Source: JLL Research, CoStar
30
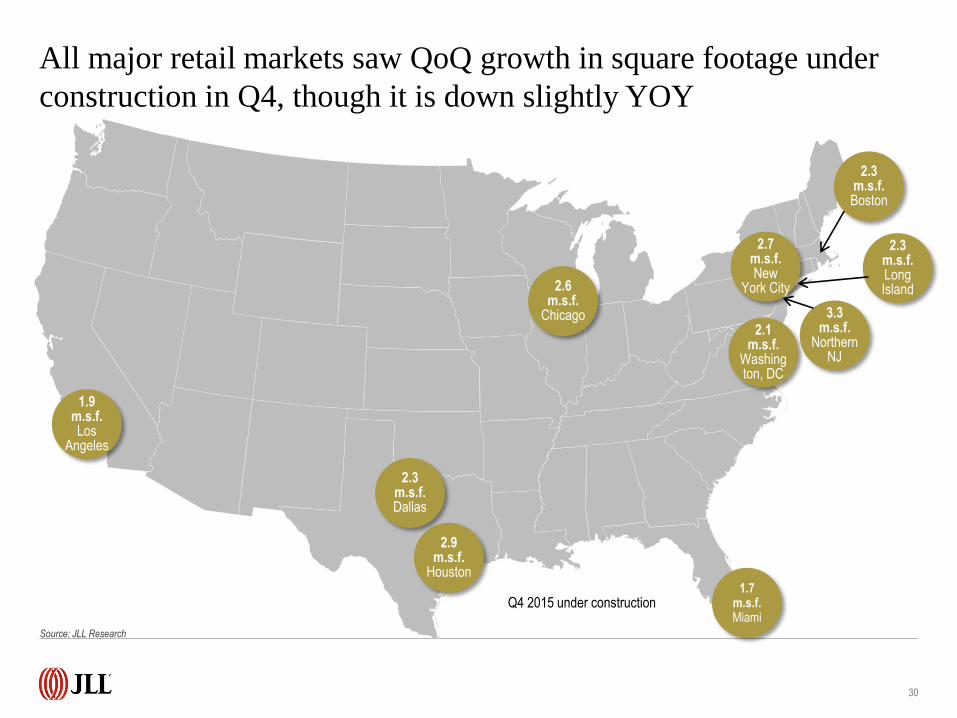
2.9m.s.f.
Houston
1.9m.s.f.Los
Angeles
2.3m.s.f.Dallas
2.6m.s.f.
Chicago 2.1
m.s.f.Washington, DC
3.3m.s.f.
Northern NJ
2.3m.s.f.Long Island
2.7m.s.f.New
York City
2.3m.s.f.Boston
Q4 2015 under construction1.7
m.s.f.Miami
All major retail markets saw QoQ growth in square footage under
construction in Q4, though it is down slightly YOY
Source: JLL Research
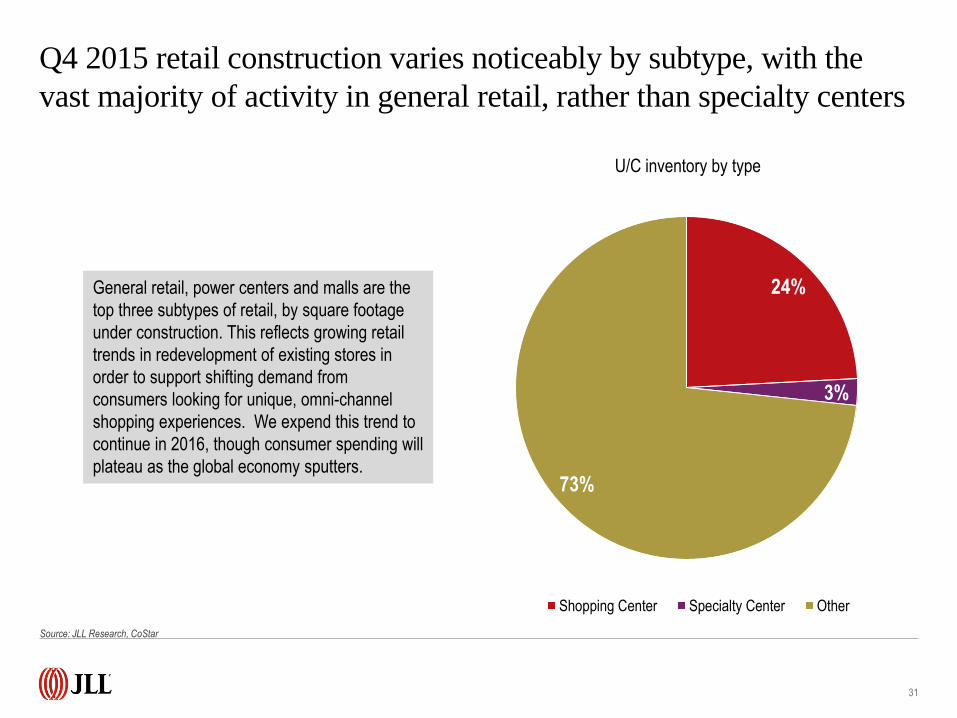
Q4 2015 retail construction varies noticeably by subtype, with the
vast majority of activity in general retail, rather than specialty centers
31
24%
3%
73%
U/C inventory by type
Shopping Center Specialty Center Other
General retail, power centers and malls are the
top three subtypes of retail, by square footage
under construction. This reflects growing retail
trends in redevelopment of existing stores in
order to support shifting demand from
consumers looking for unique, omni-channel
shopping experiences. We expend this trend to
continue in 2016, though consumer spending will
plateau as the global economy sputters.
Source: JLL Research, CoStar
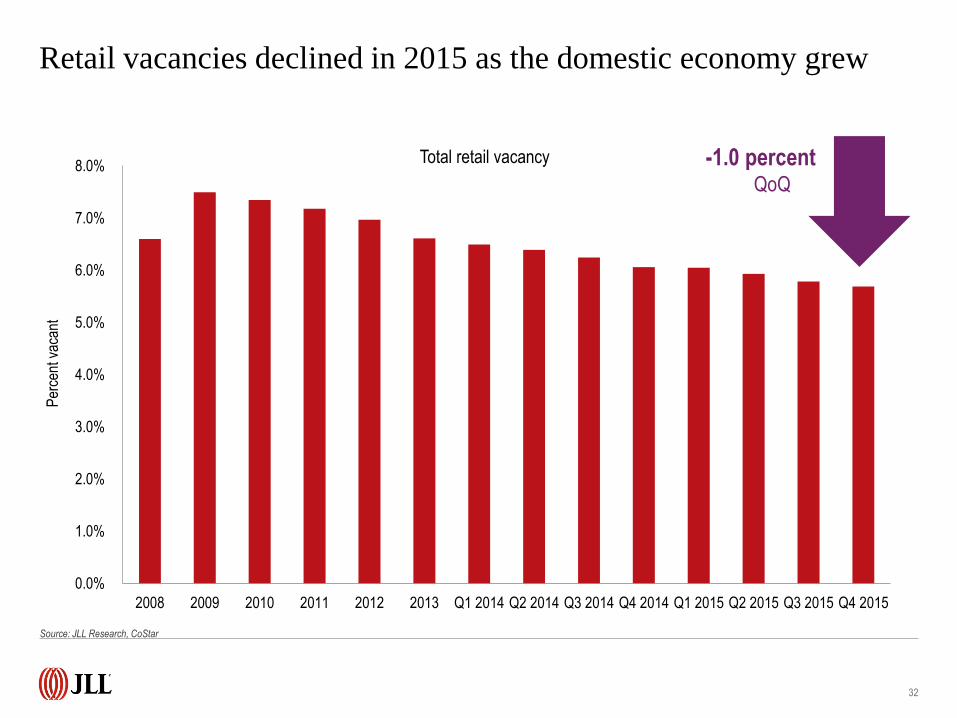
0.0%
1.0%
2.0%
3.0%
4.0%
5.0%
6.0%
7.0%
8.0%
2008 2009 2010 2011 2012 2013 Q1 2014 Q2 2014 Q3 2014 Q4 2014 Q1 2015 Q2 2015 Q3 2015 Q4 2015
Total retail vacancy
32
Per
cent
vac
ant
-1.0 percentQoQ
Retail vacancies declined in 2015 as the domestic economy grew
Source: JLL Research, CoStar
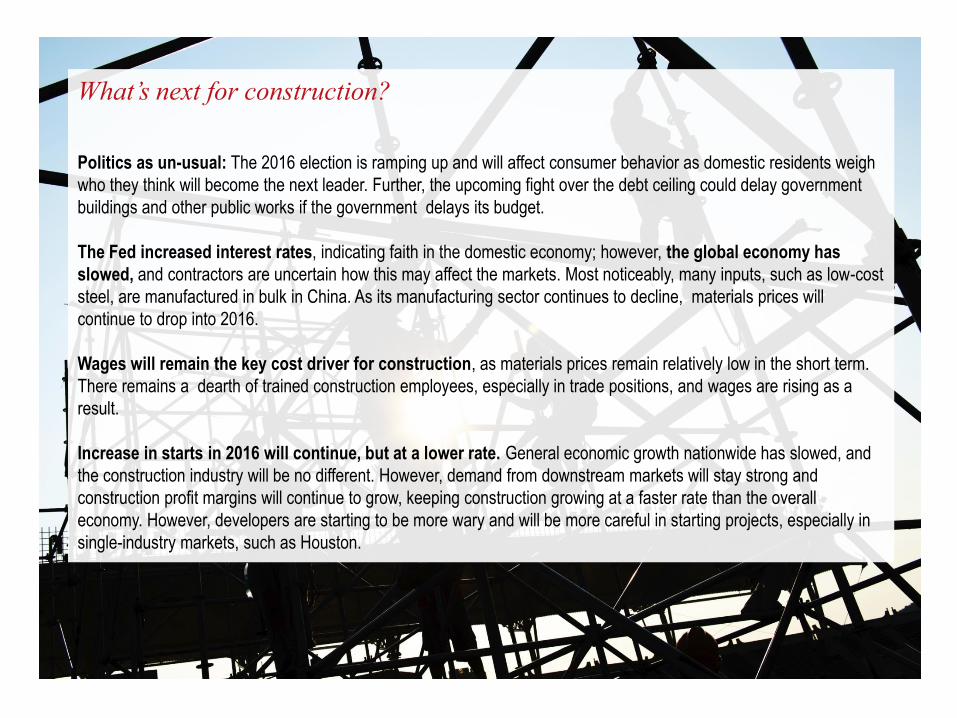
What’s next for construction?
Politics as un-usual: The 2016 election is ramping up and will affect consumer behavior as domestic residents weigh
who they think will become the next leader. Further, the upcoming fight over the debt ceiling could delay government
buildings and other public works if the government delays its budget.
The Fed increased interest rates, indicating faith in the domestic economy; however, the global economy has
slowed, and contractors are uncertain how this may affect the markets. Most noticeably, many inputs, such as low-cost
steel, are manufactured in bulk in China. As its manufacturing sector continues to decline, materials prices will
continue to drop into 2016.
Wages will remain the key cost driver for construction, as materials prices remain relatively low in the short term.
There remains a dearth of trained construction employees, especially in trade positions, and wages are rising as a
result.
Increase in starts in 2016 will continue, but at a lower rate. General economic growth nationwide has slowed, and
the construction industry will be no different. However, demand from downstream markets will stay strong and
construction profit margins will continue to grow, keeping construction growing at a faster rate than the overall
economy. However, developers are starting to be more wary and will be more careful in starting projects, especially in
single-industry markets, such as Houston.
© 2016 Jones Lang LaSalle IP, Inc.
All rights reserved. All information contained herein is from sources deemed reliable; however, no representation or warranty is made to the accuracy thereof.
Thank you
Dana Westgren
Research Analyst
Project and Development Services
+1 (202) 719 5003


