33
U.S. Crude Exports Where Would They Go? 2 nd Annual Crude-by-Water Conference Houston, TX November 17, 2015 John R. Auers Executive Vice President

U.S. Crude Exports Where Would They Go?
2nd Annual Crude-by-Water Conference Houston, TX
November 17, 2015
John R. Auers Executive Vice President

• International consulting practice since 1971
• Downstream focus; refinery/chemical engineers
• Industry and financial clients – Strategic Studies
– FMV Assessments & Venture Analyses
– National Policy Studies
• Publish various outlook and multi-client subscription reports – Crude and Refined Products Outlook – Refinery Construction Outlook – North American Crude and Condensate Outlook
• Several editions
– World Crude Outlook • Released in October 2015
TM&C Overview
2

TM&C “White Paper” on Exports
• Issued Report on September 8th
– Analysis of likely U.S. crude export destinations – Considered quality, regional demand and logistics,
other factors – Focused on light crude
• Available at www.turnermason.com – Top of the page under Publications U.S. Light
Crude Oil Exports: Likely Destinations
3

Presentation Outline
• Evolving U.S. Crude Balance
• “Fit” into Atlantic Basin Refineries
• Transportation Costs/Other Factors
• Final Analysis/Thoughts
4

U.S. Crude Production
0
1
2
3
4
5
6
7
8
9
10
1920
1925
1930
1935
1940
1945
1950
1955
1960
1965
1970
1975
1980
1985
1990
1995
2000
2005
2010
2015
U.S
. Cru
de P
rodu
ctio
n (M
illio
n BP
D)
0
1
2
3
4
5
6
7
8
9
10
2007 2008 2009 2010 2011 2012 2013 2014 2015
U.S
. Cru
de P
rodu
ctio
n (M
illio
n BP
D)
Bakken
Eagle Ford
Niobrara
Permian
All Other
U.S. Production
had risen over 90% since
2008
Growth dominated by
LTO production
8.8
9
9.2
9.4
9.6
9.8
Jan-
15
Feb-
15M
ar-1
5
Apr-
15
May
-15
Jun-
15
Jul-1
5
Aug-
15
Sep-
15
Oct
-15
5

Domestic Lights Latin American & Canadian Heavies Middle
Eastern Design
Basis ->
0.6
0.8
1
1.2
1.4
1.6
30.0
30.5
31.0
31.5
32.0
32.5
1985 1990 1995 2000 2005 2010 2015
Sulfu
r, w
t. %
Gra
vity
, API
2015 YTD, API 31.8, Sulfur 1.40
Changing U.S. Refinery Crude Slates (1985-2015)
LTO growth has led to a much
lighter U.S. crude slate
6

U.S. Refiners Geared for Heavy Crude
• U.S. Refiners had spent billions in the 1990’s and 2000’s to “heavy up”
• Significantly increased complexity; more suited to run heavier crudes
• More recently spending focused on light crude
Comparison of U.S. to Global Refiners
Region Total
Upgrading Cat
Cracking Coking Hydrocracking U.S. - 1981 41% 28% 8% 5% U.S. – 2015 56% 31% 15% 11% Asia 19% 13% 3% 6% Europe 26% 14% 3% 9% Latin + South America 25% 16% 4% 5% World 28% 16% 5% 7% *O&G Journal, as of Jan. 1, 2015
7

8
Light Crude Investment - 2012 to 2018
Spent To Date Total
PADD I
100 50
Spent To Date Total
PADD II
1100 800
Spent To Date Total
PADD III
3900 1800
Spent ToDate
Total
PADD V
Spent To Date Total
PADD IV
1500 900
Drop in Oil Price Could Delay $500 to
$1000+ MM of Investments
100 200
*Millions of $
Spent To Date Total
U.S. Total
3600 6800

Imports Down/Allowable Exports Up
0
100
200
300
400
500
600
700
2006 2007 2008 2009 2010 2011 2012 2013 2014 2015
Crud
e Ex
port
s (Th
ousa
nd B
PD)
Processed Condensate Canada
0
2
4
6
8
10
12
2006 2007 2008 2009 2010 2011 2012 2013 2014 2015
Crud
e Im
port
s (M
illio
n BP
D)
Medium Light Canadian Heavy PADD V
Light/Medium Imports Decline from 4.8
MMBPD in 2006 & 2007 to 1.5 MMPBD in 2015
9

0
100
200
300
400
500
600
700
800
900
1000
2007 2008 2009 2010 2011 2012 2013 2014 2015
Impo
rts (
MBP
D)
Eastern Canadian Imports (Ontario, Quebec, Maritime Provinces)
Heavy
Light (Non U.S.)
Light (U.S.)
No More Room In Canada
Three-month Rolling Average
10
300 MBPD Line 9 reversal startup imminent, will displace U.S. crude
with Western Canadian Barrels

0
2
4
6
8
10
12
14
16
18
20
2015 2016 2017 2018 2019 2020 2021 2022 2023 2024 2025
Current Forecast
Other Exports Splitter Runs U.S. Production Waterborne Imports Canadian Imports Total Refinery Runs
0
2
4
6
8
10
12
14
16
18
20
2015 2016 2017 2018 2019 2020 2021 2022 2023 2024 2025
Mill
ion
BPD
Early 2014 Forecast
Potential Export Volumes
U.S. Exports 2020: 1.1 MMBPD 2025: 1.3 MMBPD
U.S. Exports 2025: 700 MBPD
Exports Required
11
* *Includes Canadian exports and exports of lightly processed condensate

Presentation Outline
• Evolving U.S. Crude Balance
• “Fit” Into Atlantic Basin Refineries
• Transportation Costs/Other Factors
• Final Analysis/Thoughts
12

Atlantic Basin Refining Environment
Latin America
9%
Europe 19%
U.S. 21%
Atlantic Basin: 49% Global
Refining Capacity Russia 6%
Asia-Pacific
29%
Middle East 9%
Africa 4%
13

European Region
Northwest Europe
12 Countries 56 Refineries 8.4 MMBPD
Mediterranean Europe 10 Countries 43 Refineries 5.5 MMBPD
Eastern Europe 9 Countries
28 Refineries 2.8 MMBPD
Total Europe 31 Countries
127 Refineries 16.7 MMBPD
• Three distinct regions: NW, Med, and Eastern Europe
• Total crude runs of 14.5 MMBPD in 2014;
• Limited and declining regional production; 60% is imported
• EU has over 70% imports
14

Designed for Lighter Crudes
0%
10%
20%
30%
40%
50%
60%
70%
Avg.
Nor
thw
est
Med
iterr
anea
n
East
ern
Avg.
PADD
I
PADD
III
Europe U.S.%
of C
rude
Cap
acity
% Coking % Cracking % Hydrocracking Total Upgrading
0%
20%
40%
60%
80%
100%
0.0
1.0
2.0
3.0
4.0
5.0
NorthernEurope
Eastern Europe Med Europe Ligh
t Cru
de, %
of T
otal
Impo
rts
Impo
rts,
Mill
ion
BPD
Total Light % Light
• European refiners less complex than U.S. counterparts – Even PADD I, the least
complex U.S. region, has significantly greater cracking capacity
• Almost all crude imports are light (>31 API)
15
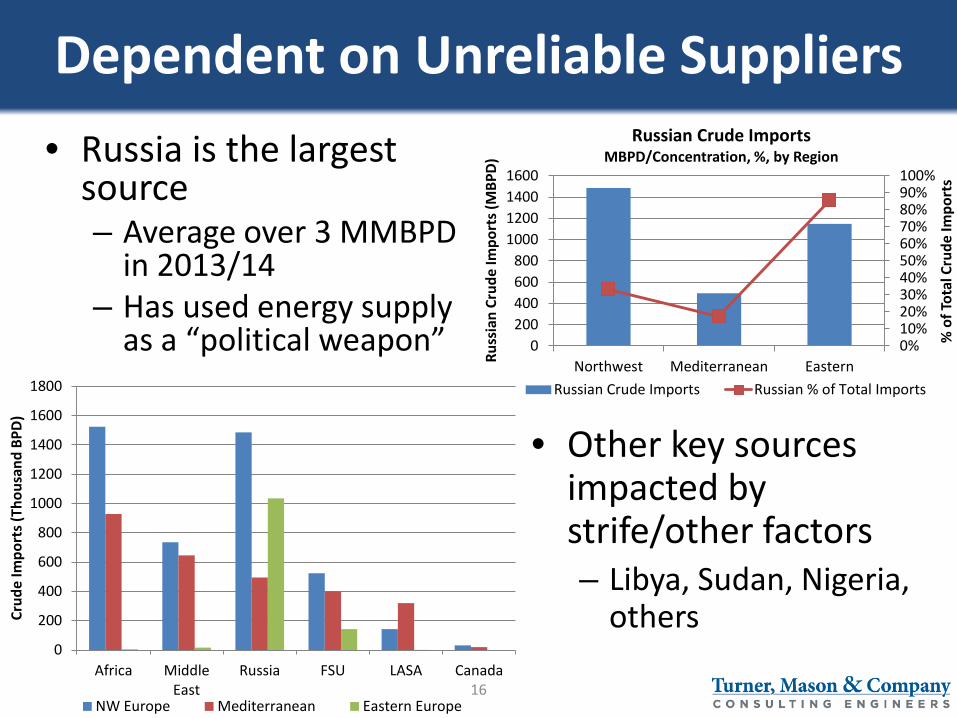
Dependent on Unreliable Suppliers
0
200
400
600
800
1000
1200
1400
1600
1800
Africa MiddleEast
Russia FSU LASA Canada
Crud
e Im
port
s (Th
ousa
nd B
PD)
NW Europe Mediterranean Eastern Europe
• Russia is the largest source – Average over 3 MMBPD
in 2013/14 – Has used energy supply
as a “political weapon” 0%10%20%30%40%50%60%70%80%90%100%
0200400600800
1000120014001600
Northwest Mediterranean Eastern
% o
f Tot
al C
rude
Impo
rts
Russ
ian
Crud
e Im
port
s (M
BPD)
Russian Crude Imports MBPD/Concentration, %, by Region
Russian Crude Imports Russian % of Total Imports
• Other key sources impacted by strife/other factors – Libya, Sudan, Nigeria,
others
16

Declining Volumes From Major Suppliers
-
2
4
6
8
10
12
1994
1995
1996
1997
1998
1999
2000
2001
2002
2003
2004
2005
2006
2007
2008
2009
2010
2011
2012
2013
2014
Crude Production - Africa
Libya Sudan + S. Sudan AngolaAlgeria Nigeria Rest of Africa
0
1
2
3
4
5
6
7
1994
1995
1996
1997
1998
1999
2000
2001
2002
2003
2004
2005
2006
2007
2008
2009
2010
2011
2012
2013
2014
Crud
e Pr
oduc
tion
(Mill
ion
BPD)
Crude Production – North Sea
Other U.K. Norway
17
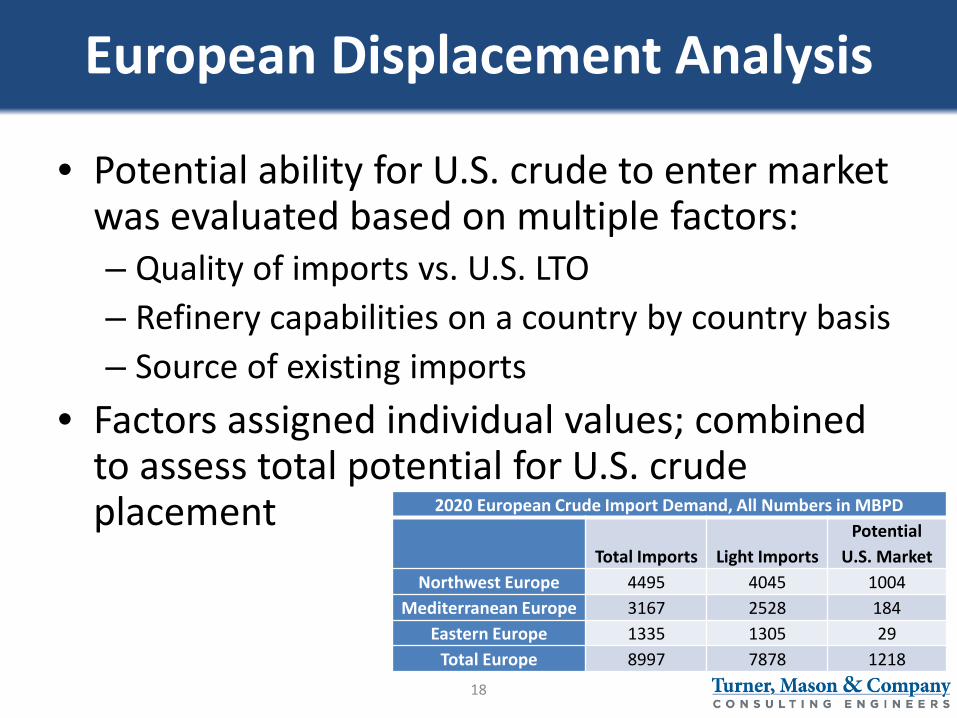
European Displacement Analysis
• Potential ability for U.S. crude to enter market was evaluated based on multiple factors: – Quality of imports vs. U.S. LTO – Refinery capabilities on a country by country basis – Source of existing imports
• Factors assigned individual values; combined to assess total potential for U.S. crude placement 2020 European Crude Import Demand, All Numbers in MBPD
Total Imports Light Imports Potential
U.S. Market Northwest Europe 4495 4045 1004
Mediterranean Europe 3167 2528 184 Eastern Europe 1335 1305 29
Total Europe 8997 7878 1218 18

Latin America
Brazil 13 Refineries 1.9 MMBPD
Mexico 6 Refineries 1.5 MMBPD
Rest of Latin America
20 Countries 51 Refineries 3.9 MMBPD
Total Latin America
22 Countries 70 Refineries 7.4 MMBPD
• Home to two OPEC members, Venezuela and Ecuador
• Region is net long crude; but quality is “mismatched” with refinery capability
• Have not been able to execute projects to fix “mismatch.”
• Light crude has market as diluent for blending with very heavy.
19

Refinery Complexity • Like European refiners,
Latin American facilities are less complex than U.S. – Avg. 40 MBPD larger – Avg. 26% more complex
• These refiners are well suited to process light crude
• Latin American crude production is increasingly heavy – Trend forecast to continue
0
2
4
6
8
10
12
2014 2015 2016 2017 2018 2019 2020 2021 2022 2023 2024 2025Crud
e Pr
oduc
tion
(Mill
ion
BPD)
Latin American Crude Production Forecast
Latin American Med+Hvy Latin American Lt.
0%
10%
20%
30%
40%
50%
60%
70%
Avg. Mexico Brazil Rest Avg. PADD I PADD III
Latin America U.S.
% o
f Cru
de C
apac
ity
% Coking % Cracking % Hydrocracking Total Upgrading
20

Latin American vs. U.S. Refiners Comparison of Latin American to U.S. Refiners
# of Refineries
Capacity (MMBPD)
Total Upgrading
Cat Cracking Coking
Hydro-cracking
U.S. 123 18.02 56% 31% 15% 11% ● PADD 1 9 1.24 48% 38% 6% 3% ● PADD 3 55 9.22 60% 31% 16% 13% Latin America 70 7.39 30% 21% 8% 2% ● Mexico 6 1.54 37% 25% 12% -- ● Brazil 13 1.92 32% 26% 6% -- ● Venezuela 5 1.28 29% 18% 11% -- ● Argentina 10 0.61 40% 22% 15% 3% ● Netherlands Antilles 1 0.32 16% 16% -- -- ● Cuba 4 0.30 5% 5% -- -- ● Colombia 5 0.29 31% 31% -- -- ● Chile 3 0.23 49% 22% 6% 22% *O&G Journal, As of Jan 1, 2015
21

Latin American Crude Balance • Overall crude demand increases as there is some
refinery expansion • Demand will primarily be for lighter crudes as
regional production of heavy grows/is exported
7%
27%
17%
49%
Latin American Crude Import Sources, 2014
Russia
Middle East
North Africa
West Africa
0
100
200
300
400
Mex
ico
Trin
idad
/Tob
ago
Jam
aica
Dom
inic
an R
epub
lic
Braz
il
Vene
zuel
a
Chile
Peru
Uru
guay
Caribbean/CentralAmerica
South America
Impo
rts (
MBP
D)
Latin America Crude Imports
2014
2020
22
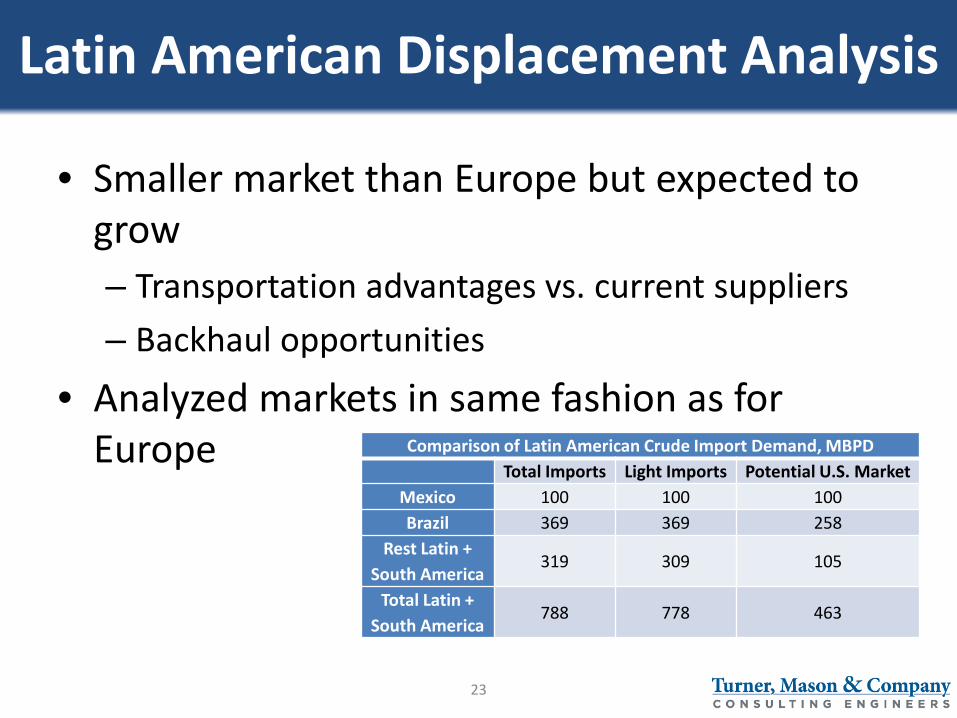
Latin American Displacement Analysis
• Smaller market than Europe but expected to grow – Transportation advantages vs. current suppliers – Backhaul opportunities
• Analyzed markets in same fashion as for Europe
Comparison of Latin American Crude Import Demand, MBPD Total Imports Light Imports Potential U.S. Market
Mexico 100 100 100 Brazil 369 369 258
Rest Latin + South America
319 309 105
Total Latin + South America
788 778 463
23
Presentation Outline
• Evolving U.S. Crude Balance
• “Fit” Into Atlantic Basin Refineries
• Transportation Costs/Other Factors
• Final Analysis/Thoughts
24

Worldwide Shipping Costs
• $2-3/bbl advantage to stay in Atlantic Basin
25

Worldwide Transit Times
• 10+ day advantage to stay in Atlantic Basin
26

• Middle East sees similar export costs and times to Europe vs. Asia/Pacific
• West Africa would see greatest impact from U.S. exports, as exports to Asia/Pacific $1-3/bbl higher, up to 15 days longer
Middle East/West Africa Costs & Times
27

Other Factors and Considerations • Relations between West and Russia on the “outs”
– Russia supplies over 3 MMBPD of oil to Europe – European dependency a potential political weapon
• U.S. a “secure” source of supply for Europe – Alternative sources subject to disruption
• China unlikely to want to be dependent on U.S. – China and U.S. are economic competitors – LTO from U.S. to Asia logistically disadvantaged
• U.S. potential supply source for Israel – Important Middle Eastern ally, imports about 250 MBPD – Russia has been a major source; Gulf producers not an option
• Synergies between LTO producers and their refineries – Several companies have LTO production in U.S. and European
refinery assets, potential supply chain optimization
28

Presentation Outline
• Evolving U.S. Crude Balance
• “Fit” Into Atlantic Basin Refineries
• Transportation Costs/Other Factors
• Final Analysis/Thoughts
29
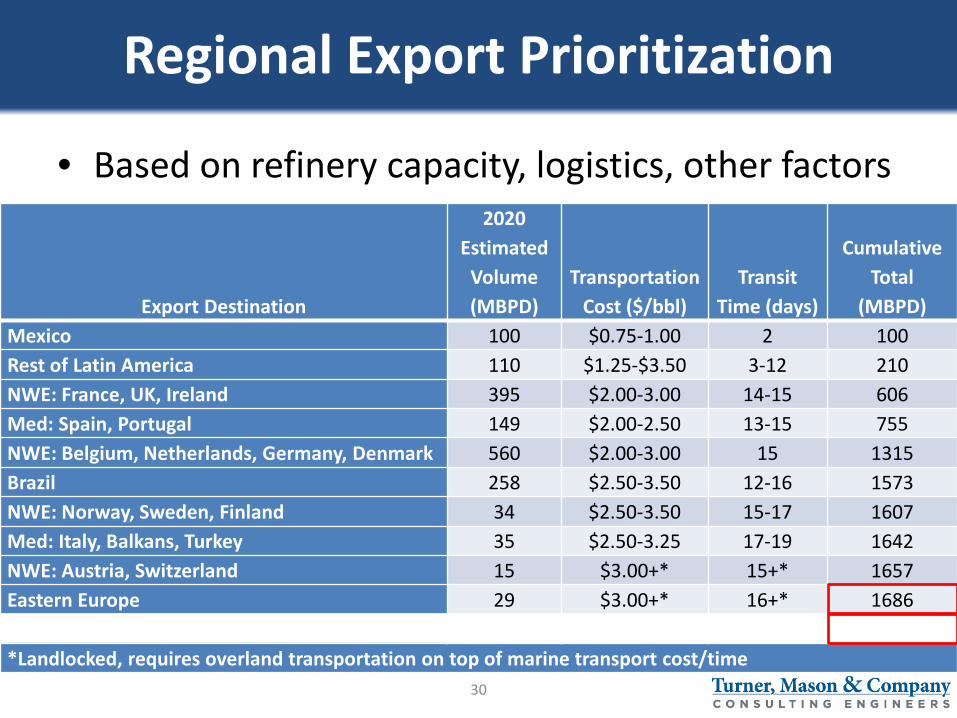
Regional Export Prioritization
• Based on refinery capacity, logistics, other factors
Export Destination
2020 Estimated
Volume (MBPD)
Transportation Cost ($/bbl)
Transit Time (days)
Cumulative Total
(MBPD) Mexico 100 $0.75-1.00 2 100 Rest of Latin America 110 $1.25-$3.50 3-12 210 NWE: France, UK, Ireland 395 $2.00-3.00 14-15 606 Med: Spain, Portugal 149 $2.00-2.50 13-15 755 NWE: Belgium, Netherlands, Germany, Denmark 560 $2.00-3.00 15 1315 Brazil 258 $2.50-3.50 12-16 1573 NWE: Norway, Sweden, Finland 34 $2.50-3.50 15-17 1607 Med: Italy, Balkans, Turkey 35 $2.50-3.25 17-19 1642 NWE: Austria, Switzerland 15 $3.00+* 15+* 1657 Eastern Europe 29 $3.00+* 16+* 1686 Israel 250 $3.00-3.50 20 1936 *Landlocked, requires overland transportation on top of marine transport cost/time
30

Recent Developments
• House approved oil export bill on October 9 – Bipartisan vote of 261 to 159 – President threatens veto; 29 votes short of 2/3rds
• Being Considered in Senate – Also unlikely to get 2/3rds majority – Possibility does exist for a “horse trade” – Strategy to attach to highway bill failed on 11/5
• Mexico swaps have been approved – 75 MBPD for next 12 months – Multiple applications for swaps to other countries
have been denied
31

Final Thoughts
• U.S. LTO exports “fit” well into Atlantic Basin
• Logistics favor Atlantic Basin over Asian markets
• Sources of light crude to Atlantic Basin declining • Country-by-country analysis shows room for > 1.5
MMBPD of light U.S. crude in Europe/LatAm • Geopolitical/other factors also support exports to
Atlantic Basin
• Exports will not go exclusively to Atlantic Basin • Significant need for exports not necessary until U.S.
production >10.5 MMBPD
32

Presenter
John R. Auers, P.E. Executive Vice President • Univ. of Nebraska Chem. Engr.
• Univ. of Houston MBA
• Formerly with Exxon
• Industry studies/analysis, forecasting, modeling
• Leads Outlook team
• Contact Info – [email protected] Office – 214-223-8887
33


