U.S. DEPARTMENT OF THE INTERIOR U.S. GEOLOGICAL SURVEY ESTIMATING LOS ANGELES DEGRADATION VALUE USING THE SCHMEDT REBOUND HAMMER ALONG THE FRONT RANGE, COLORADO by J.C. Davenport 1 and W.H. Langer1 OPEN-FILE REPORT 98-331 1998 This report is preliminary and has not been reviewed for conformity with U.S. Geological Survey editorial standards. Any use of trade, product, or firm names is for descriptive purposes and does not imply endorsement by the USGS. 1 U.S. Geological Survey, Denver, Colorado, 80225
Transcript
U.S. DEPARTMENT OF THE INTERIOR
U.S. GEOLOGICAL SURVEY
ESTIMATING LOS ANGELES DEGRADATION VALUE USING THE SCHMEDT REBOUND HAMMER ALONG THE FRONT
RANGE, COLORADO
by
J.C. Davenport1 and W.H. Langer1
OPEN-FILE REPORT 98-331
1998
This report is preliminary and has not been reviewed for conformity with U.S. Geological Survey editorial standards. Any use of trade, product, or firm names is for descriptive purposes and does not imply endorsement by the USGS.
1 U.S. Geological Survey, Denver, Colorado, 80225
CONTENTS
CONTENTS........................................................................................................................................................... i
LIST OF TABLES........................................................................^^
LIST OT FIGURES...................~................._^
IHupose and Scope......................................................~^^ 1Rock Types.....................................................................................................................................................2
Ix>s Angeles Degradation Test.......................,....................»^Schmidt Rebound Hammer Test...................................................................................................................... 3Previous Work................................................................................................................................................ 3
METHODS..............................^
Field Work..........................................................................^^Schmidt Rebound Hammer Test............................................................................................................... 5
Grid Pattern Sampling....................................................................................................................... 6Testmg an mdividiml Sample.,,.................,..........................^
Collection of the Sample.......................................................................................................................... 7Characterization of the Sample Site.......................................................................................................... 7Sample Sites......................................................,.^
Laboratory........................ .............................................................................................................................. 8Rock Description.....,..........................................................^Specific Ctovity..................................................^Crushing................................................................................................................................................ 14Los Angeles Degradation Test................................................................................................................ 14
Testing Schmidt Rebound Hammer Reliability at Control Sites..................................................................... 15Data Analysis................................................................................................................................................ 15
TestrngAr^oaches...........,.............................^ 15Testing Schmidt Rebound Hammer Reliability at Control Sites..................................................................... 15
Average............,...,.....................,..............,....^^ 16Correlation of Schmidt Rebound Number to Los Angeles Degradation Value................................................ 19
DISCUSSION OF RESULTS..................................~
Testing Approaches....................................................................................................................................... 25Schmidt Rebound Hammer Reliability at Control Sites.................................................................................. 25Correlation of Schmidt Rebound Number to Los Angeles Degradation Value................................................ 26
Effect of Specific Gravity ..............................................................................................................................27
CONCLUSIONS AND RECONINfENDATIONS................................................................................................. 30
APPENDIX A - DATA FOR ROCK SAMPLES.................................................................................................. 33
APPENDIX B - Method for Determining the Sdimidt Rebound Number and Preparing Samples for the Los Angeles Degradation Test for Potential Crushed-stone Aggregate Source Roc*:.................................................... 37
APPENDIX C - Common Questions Concerning the Schmidt Rebound Hammer Test......................................... 38
LIST OF TABLES
Table 1. - AASHTO aggregate specifications for Los Angeles degradation test...................................................... 3Table 2. - Weathering of bedrock (modified after Langer and Knepper, 1998)...................................................... 13Table 3. Distribution of rock samples tested....................................................................................................... 13Table 4. - "A" Grading for a Los Angeles degradation test................................................................................... 13Table 5. - Comparison of grid pattern to single sampling testing approaches to determine rebound number......... 16Table 6. - Statistical analysis for the two control locations.................................................................................... 16Table 7. - Summary of Los Angeles degradation values and Schmidt rebound numbers for samples collected...... 19Table 8. - Summary of weathering and texture for samples collected.................................................................... 19Table 9. - Summary descriptions of variation within each rock type collected....................................................... 20
LIST OF FIGURES
Figure 1. - Location of the Front Range Infrastructure Resources Project study areas.............................................. 2Figure 2. - Illustration of Schmidt rebound hammer test being performed.............................................................. 5Figure 3. - Illustration of alpha angle for testing.................................................................................................... 6Figure 4. - Grid pattern used to determine rock mass Schmidt rebound number..................................................... 6Figure 5. - Minimum sample size required for Schmidt rebound hammer test........................................................ 7Figure 6. - Location of sample sites in the Fort Collins area................................................................................... 9Figure 7. - Location of sample sites in the Boulder area....................................................................................... 10Figure 8. - Location of sample sites in the Denver area........................................................................................ 11Figure 9. - Location of sample sites in the Colorado Springs area......................................................................... 12Figure 10. - Particle size distribution after crushing a collected sample................................................................ 14Figure 11. - Illustration of Los Angeles degradation test machine (Barksdale, 19%)............................................ 14Figure 12. - Histogram of Sdimidt rebound numbers recorded for the control site at Table Mountain Ranch
Figure 13- Relationship of Los Angeles degradation value to Schmidt rebound number for the control site at TableMountain Ranch quarry (andesite)......................................................................................... 17
Figure 14. - Histogram of Schmidt rebound numbers recorded for the control site at Snyder Pit (limestone)......... 18Figure 15 - Relationship of Los Angeles degradation value to Schmidt rebound number for the control site at
Snyder Pit (limestone)............................................................................................................ 18Figure 16- Relationship of Los Angeles degradation value to Schmidt rebound number for all rock types............. 21Figure 17. - Relationship of Los Angeles degradation value to Schmidt rebound number for andesite classified by
degree of weathering.............................................................................................................. 21Figure 18. - Relationship of Los Angeles degradation value to Schmidt rebound number for granite classified by
degree of weathering..............................................................................................................21Figure 19. - Relationship of Los Angeles degradation value to Schmidt rebound number for granite classified by
texture................................................................................................................................... 21Figure 20. - Relationship of Los Angeles degradation value to Schmidt rebound number for granitic rocks
classified by composition........................................................................................................ 22Figure 21. - Relationship of Los Angeles degradation value to Schmidt rebound number for gneiss classified by
degree of weathering.............................................................................................................. 22Figure 22. - Relationship of Los Angeles degradation value to Schmidt rebound number for gneiss classified by
texture................................................................................................................................... 22Figure 23. - Relationship of Los Angeles degradation value to Schmidt rebound number for limestone classified by
degree of weathering.............................................................................................................. 22Figure 24. - Relationship of Los Angeles degradation value to Schmidt rebound number for limestone classified by
lithologic formation............................................................................................................... 23Figure 25. - Relationship of Los Angeles degradation value to Schmidt rebound number for sandstone classified by
degree of weathering.............................................................................................................. 23Figure 26. - Relationship of Los Angeles degradation value to Schmidt rebound number for sandstone classified by
texture................................................................................................................................... 23Figure 27. - Relationship of Los Angeles degradation value to Schmidt rebound number for schist (includes data
not included in analysis)........................................................................................................ 23Figure 28. - Relationship of Los Angeles degradation value to Schmidt rebound number for quartzite classified by
degree of weathering.............................................................................................................. 24Figure 29. - Relationship of Los Angeles degradation value to Schmidt rebound number for quartzite classified by
texture................................................................................................................................... 24Figure 30. - Relationship of Los Angeles degradation value to Schmidt rebound number for quartzite classified by
degree of metamorphism........................................................................................................24Figure 31.- Relationship of Los Angeles degradation value to Schmidt rebound number for quartz vein.............. 24Figure 32. - Relationship of Los Angeles degradation value to Schmidt rebound number for andesite classified by
specific gravity....................................................................................................................... 28Figure 33. - Relationship of Los Angeles degradation value to Schmidt rebound number of gneiss and granite
classified by specific gravity................................................................................................... 29
ill
ABSTRACT
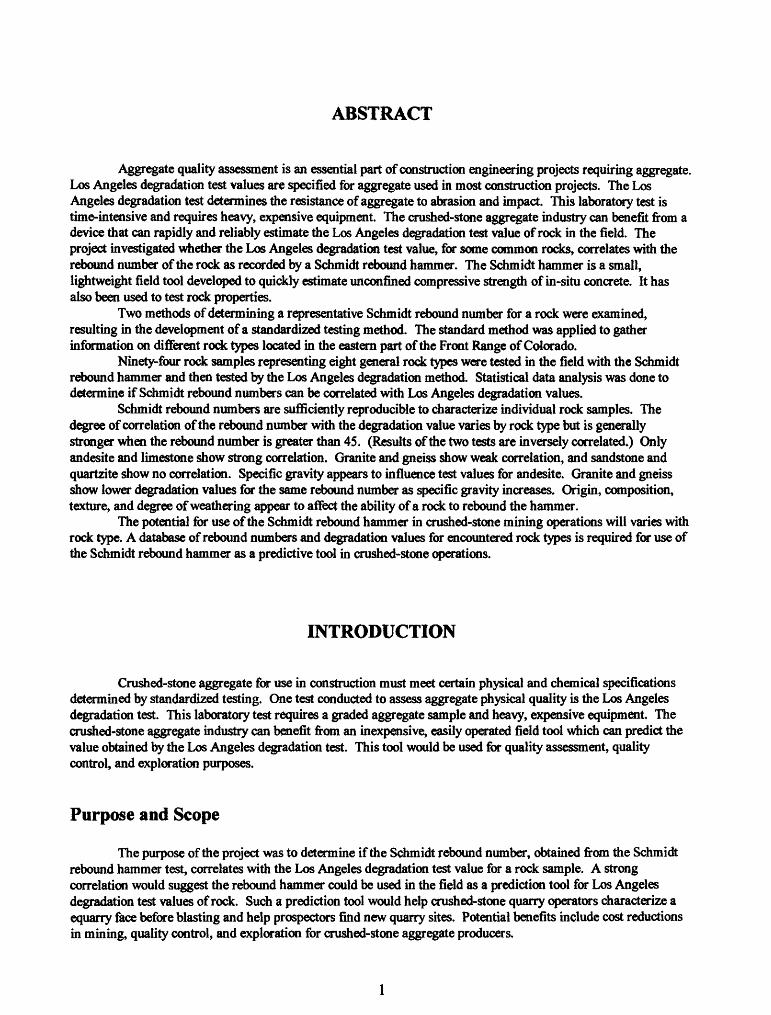
Aggregate quality assessment is an essential part of construction engineering projects requiring aggregate. Los Angeles degradation test values are specified for aggregate used in most construction projects. The Los Angeles degradation test determines the resistance of aggregate to abrasion and impact. This laboratory test is time-intensive and requires heavy, expensive equipment. The crushed-stone aggregate industry can benefit from a device that can rapidly and reliably estimate the Los Angeles degradation test value of rock in the field. The project investigated whether the Los Angeles degradation test value, for some common rocks, correlates with the rebound number of the rock as recorded by a Schmidt rebound hammer. The Schmidt hammer is a small, lightweight field tool developed to quickly estimate unconfined compressive strength of in-situ concrete. It has also been used to test rock properties.
Two methods of determining a representative Schmidt rebound number for a rock were examined, resulting in the development of a standardized testing method. The standard method was applied to gather information on different rock types located in the eastern part of the Front Range of Colorado.
Ninety-four rock samples representing eight general rock types were tested in the field with the Schmidt rebound hammer and then tested by the Los Angeles degradation method. Statistical data analysis was done to determine if Schmidt rebound numbers can be correlated with Los Angeles degradation values.
Schmidt rebound numbers are sufficiently reproducible to characterize individual rock samples. The degree of correlation of the rebound number with the degradation value varies by rock type but is generally stronger when the rebound number is greater than 45. (Results of the two tests are inversely correlated.) Only andesite and limestone show strong correlation. Granite and gneiss show weak correlation, and sandstone and quartzite show no correlation. Specific gravity appears to influence test values for andesite. Granite and gneiss show lower degradation values for the same rebound number as specific gravity increases. Origin, composition, texture, and degree of weathering appear to affect the ability of a rock to rebound the hammer.
The potential for use of the Schmidt rebound hammer in crushed-stone mining operations will varies with rock type. A database of rebound numbers and degradation values for encountered rock types is required for use of the Schmidt rebound hammer as a predictive tool in crushed-stone operations.
INTRODUCTION
Crushed-stone aggregate for use in construction must meet certain physical and chemical specifications determined by standardized testing. One test conducted to assess aggregate physical quality is the Los Angeles degradation test. This laboratory test requires a graded aggregate sample and heavy, expensive equipment. The crushed-stone aggregate industry can benefit from an inexpensive, easily operated field tool which can predict the value obtained by the Los Angeles degradation test. This tool would be used for quality assessment, quality control, and exploration purposes.
Purpose and Scope
The purpose of the project was to determine if the Schmidt rebound number, obtained from the Schmidt rebound hammer test, correlates with the Los Angeles degradation test value for a rock sample. A strong correlation would suggest the rebound hammer could be used in the field as a prediction tool for Los Angeles degradation test values of rock. Such a prediction tool would help crushed-stone quarry operators characterize a equarry face before blasting and help prospectors find new quarry sites. Potential benefits include cost reductions in mining, quality control, and exploration for crushed-stone aggregate producers.
The objectives of the project were to develop a standardized testing procedure with the Schmidt rebound hammer, test of different rock types in the Front Range of Colorado, determine Los Angeles degradation test values of those samples, and determine Schmidt rebound numbers are correlated with LA test values.
The scope of the project included development of a testing procedure for rock in the field with the Schmidt rebound hammer, application of this procedure to rock samples, collection of samples, description of the rocks and rock mass, conducting Los Angeles degradation tests on rocks, and statistical analyses of the data. The samples collected were primarily within the boundary of the USGS Front Range Infrastructure Resources Project demonstration area, extending from Denver, Colorado north to Fort Collins, Colorado (fig.l). Ten samples were taken south of the demonstration area near Manitou Springs, Colorado. Control sites were established to test the reproducibility of the rebound hammer data.
Figure 1. - Location of the Front Range Infrastructure Resources Project study areas.
Rock Types
The majority of the crushed stone produced in the study area comes from the igneous and metamorphic rock located in the "foothills" of the Front Range (Trimble and Fitch, 1974a and 1974b; Colton and Fitch, 1974). Tests and samples for this project primarily come from this area. However, rocks were sampled from other Front Range geologic formations that could be considered suitable sources of crushed stone. Potentially suitable sedimentary rocks include Pennsylvanian and Cretaceous sandstones and Ordovician, Permian, and Cretaceous carbonates. Potentially suitable igneous and metamorphic rocks include Tertiary andesite intrusions and flows as well as Precambrian granites, schists, and gneisses.
BACKGROUND
Natural aggregate is the main component in bituminous asphalt and Portland cement concrete. Two types of natural aggregate exist; 1) crushed stone and 2) sand and gravel. Crushed stone comes from bedrock, which is drilled, blasted, and crushed. Sand and gravel comes from natural fluvial, glaciofluvial, and marine deposits, which are mined. Aggregate used in construction is often required to meet specifications for physical and chemical properties, performance, size, and shape to insure proper engineering performance. A variety of tests have been developed to determine aggregate properties. This project focuses on the physical properties of aggregate, specifically to its strength and hardness.
Los Angeles Degradation Test
The Los Angeles degradation test is an American Society for Testing and Materials (ASTM) standardized test that evaluates the resistance of an aggregate to degradation through abrasion and impact The Municipal Testing Laboratory of the city of Los Angeles originally developed the test in the 1920s. This test is valuable in assessing the hardness and strength of aggregate material. Soft or weak aggregate is unsatisfactory in both cement concrete and bituminous asphalt mixes because the aggregate breaks down during processing and when subjected to traffic and weathering (Langer and Glanzman, 1993). The Los Angeles degradation test is a measure of degradation of aggregate of standard gradations resulting from abrasion, impact, and grinding in a rotating steel drum containing a specified number of steel spheres. After a prescribed number of revolutions, the contents are sieved to measure degradation as percent loss. Consequently, the higher the test value, the higher the percent loss, and tiie lower the strength of the rock.
American Association of State Highway and Transportation Officials (AASHTO) sets aggregate specifications for base course and pavement construction for Los Angeles degradation test values. Specifications are listed under AASHTO Standard Specification M-283 (Table 1) (Aggregate Handbook 1991). The state of Colorado requires a maximum Los Angeles degradation test value of 45 for its road projects (Kratten maker, 1998). Aggregate specifications for hardness and strength are similar for cement concrete and bituminous mixes (Langer, 1993). The test specifications are listed in ASTM C131, ASTM C535, and AASHTO T-96 (ASTM, 1996).
Table 1. - AASHTO aggregate specifications for Los Angeles degradation test. '
Maximum Los Angeles Degradation Test Value
Class A Aggregate
40
Class B Aggregate
45
Class C Aggregate
50
Schmidt Rebound Hammer Test
The Schmidt rebound hammer test is used primarily to estimate in-situ unconfined compressive strength of concrete. The standardized test procedure for the Schmidt rebound hammer is the Rebound Number of Hardened Concrete, ASTM C805-85. The hammer is a portable, lightweight hammer that is approximately 11 inches long and 2 inches in diameter. The Schmidt rebound hammer test has also been used to determined the toughness, elasticity, and freshness of rock (Barksdale, 1991).
Previous Work
Several papers have been published in which the Schmidt rebound hammer test was used in an attempt to determine physical properties of rock. A. Kazi and Z. R. Al-Mansour (1980) determined that a "reasonably consistent proportionality exists between the Los Angeles abrasion resistance of aggregates and the strength property of the parent rock materials." The strength properties were determined by the Schmidt hammer hardness
(designated by the SRN) and the unit weight of the rock types. The rock types tested, in order of decreasing abundance, were diorite, andesite, monzonite, tonalite, granite, gabbro, and dacite. These rock types came from aggregate near Jeddah, Saudi Arabia. Deer and Miller (1966) determined that there was a relationship between the degradation value determined by the Dorry abrasion test and unconfined compressive strength of rock. Kasim and Shakoor (19%) demonstrated a strong inverse relationships between degradation and compressive strength of igneous, metamorphic and sandstone rocks and that Los Angeles degradation test values were strongly correlated with the degradation determined by the Proctor test (ASTM D 698). West (1994) estimated aggregate properties by using the aggregate crushing value (ACV). The ACV approximates the Los Angeles degradation value as a function of the compressive strength of rock. Ariogul and Tokgoz (1991) correlated compressive rock strength with the Schmidt rebound hammer for a variety of rock types but did not record Los Angeles degradation test values. They concluded that various factors such as rock type, testing surface, size of mineral grains, and moisture conditions of a rock had an influence on the strength value determined by the hammer. Nesj and others (1994) showed the Schmidt rebound hammer was effective in dating rockfall deposits in Norway. They showed the weathering of rockfall deposits could be related to the recorded Schmidt rebound number by using dated rock avalanche events. Consequently, they could estimate the age of nearby rockfall events that were not dated previously.
METHODSFieldwork consisted of testing of the rock sample, collecting samples, and describing the sample site.
Laboratory work consisted of describing the collected sample, determining its specific gravity, crushing the sample, and conducting the Los Angeles degradation test Data analysis included analysis of the Schmidt rebound hammer test and correlation analysis of the rebound number and associated degradation value for the rock samples.
Field Work
The first stage of field work developed the field testing procedure for determining Schmidt rebound number for a given rock type at a specified area. A report by the Geological Society Engineering Group Working Party (1977) provides guidelines for the Schmidt rebound hammer test on rock. TTiis report suggested that a minimum often readings should be taken and averaged for each sample, with no more than five units deviation of the Schmidt rebound numbers from the mean. This report also suggests the tested surface should have coatings and unevenness removed prior to testing.
Two approaches were tested to determine the Schmidt rebound number. The first approach was to conduct numerous rebound hammer tests on a well-exposed rock face in a grid pattern. The reason for this approach was to get a representative Schmidt rebound number for the rock mass that would compensate for any heterogeneity in the physical properties of the rock mass.
The second approach was to test a single sample of the rock mass that was removed or easily removable from the rock face. There were three reasons for this approach: 1) to reduce the amount of testing time, 2) to allow for less difficult and dangerous testing of the rock face, and 3) to guarantee an appropriate Schmidt rebound number by eliminating the possible error created in sampling with a grid pattern. This error would occur when test locations were unsuitable for getting an accurate measurement due to fracturing or weathering directly behind the rock surface being tested.
Schmidt Rebound Hammer Test
The Schmidt rebound hammer used was an ELE International Model CT-320A Mechanical Concrete Test Hammer'. The hammer contains a piston that extends 3.5 inches at its full extent. When used to conduct a test, the piston enters inside the hammer as the operator slowly presses it perpendicular against a rock surface while holding it firmly (Figure 2). The piston is spring-loaded and will release when the piston has receded into the hammer a specified distance. Once the piston releases, it travels a fixed distance, and applies a known energy to the rock. The hammer rebounds away from the surface and a rebound reading is recorded on a scaled marker on the side of the hammer. This reading is the Schmidt rebound number.
Figure 2. - Illustration of Schmidt rebound hammer test being performed.
The amount of rebound varies with the angle at which the hammer is applied to the rock surface relative to horizontal. This angle is the alpha (a) angle of the test and produces significantly different Schmidt rebound numbers when varied (Figure 3). For a Schmidt rebound number greater than 40, the number will be approximately 10% higher when a = 0° than when a - -90°. This is due to the effect of gravity on the hammer.
a =-90°
1 Any use of trade, product, or firm name is for descriptive purposes only and does not imply endorsement by the USGS.
Figure 3. - Illustration of alpha angle for testing.
A calibration block was used to insure the reliability of the Schmidt rebound hammer used. The Schmidt rebound hammer was tested at the beginning and end of each field day for calibration.
Grid Pattern Sampling
Initial field work began on exposed south-facing road cuts on U. S. Highway 40 located approximately one mile west of the Interstate 70 Golden/Morrison exit and north-facing road cuts on Lookout Mountain Road southwest of downtown Golden, Colorado. These locations provided fresh to weak weathered rock faces adequate to conduct a grid pattern test using the Schmidt rebound hammer. The grid pattern covered an area of 75 ft2 (five ft vertical and fifteen ft horizontal) with test locations spaced every foot (Figure 4). The grid pattern was marked with chalk. If a test could not be conducted at a specific grid location, it would be performed at the nearest site or else no Schmidt rebound number was recorded for that site. This grid pattern produced 96 rebound numbers for the rock face. An average rebound number was determined from the tests.
'-
15 feet
Figure 4. - Grid pattern used to determine rock mass Schmidt rebound number.
The Schmidt rebound hammer was applied at a * 0 to unprepared smooth, competent surfaces. Noticeably loose material was removed by hand or rock hammer. One reading was taken at each designated testing site. During a test, if the rock fractured, or the hammer slipped, the test was redone at the nearest location, usually 5 to 10 cm away from the original spot.
Testing an Individual Sample
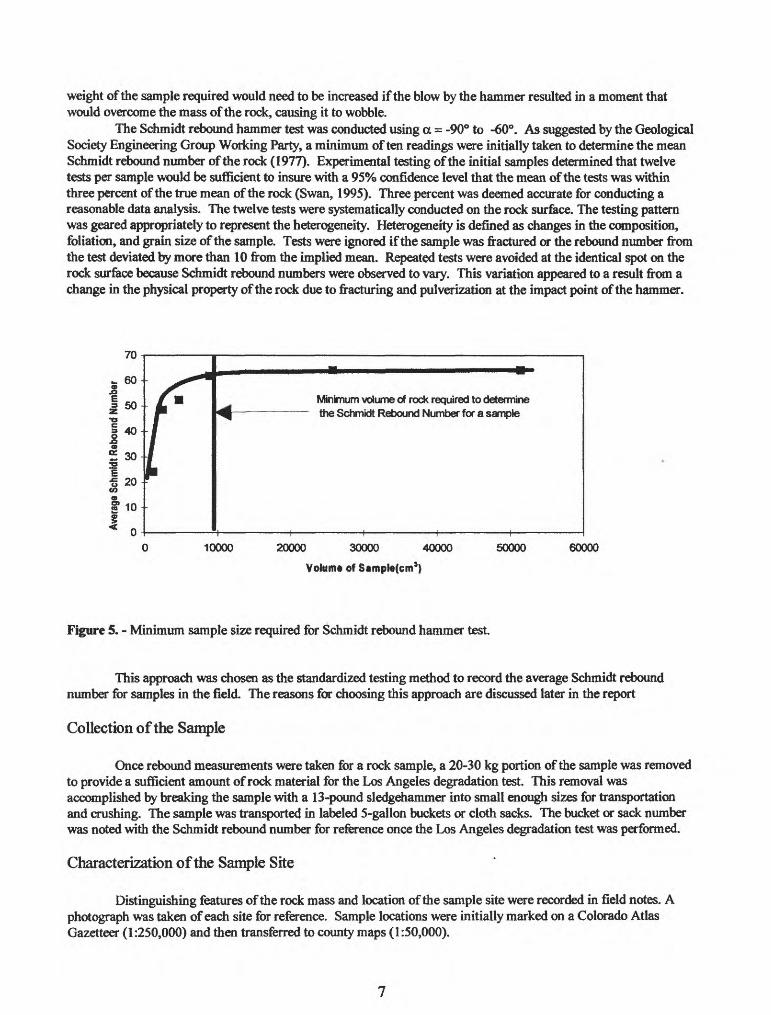
The second approach to determine the Schmidt rebound number for rock was to make numerous measurements on an individual sample from the rock mass. The Geological Society Engineering Group Working Party (1977) suggested this method of taking several measurements on the same sample. The sample required a minimum weight of 25 - 30 kg., or a volume of 10,000 cm3, to insure proper rebound of the Schmidt rebound hammer (Figure 5). This minimum weight was determined by experimenting with different sample sizes and determining the size for which the average Schmidt rebound number for the sample deviated from the true mean rebound number of the rock. The minimum weight and volume required varied with the shape of the sample. The
weight of the sample required would need to be increased if the blow by the hammer resulted in a moment that would overcome the mass of the rock, causing it to wobble.
The Schmidt rebound hammer test was conducted using a = -90° to -60°. As suggested by the Geological Society Engineering Group Working Party, a minimum often readings were initially taken to determine the mean Schmidt rebound number of the rock (1977). Experimental testing of the initial samples determined that twelve tests per sample would be sufficient to insure with a 95% confidence level that the mean of the tests was within three percent of the true mean of the rock (Swan, 1995). Three percent was deemed accurate for conducting a reasonable data analysis. The twelve tests were systematically conducted on the rock surface. The testing pattern was geared appropriately to represent the heterogeneity. Heterogeneity is defined as changes in the composition, foliation, and grain size of the sample. Tests were ignored if the sample was fractured or the rebound number from the test deviated by more than 10 from the implied mean. Repeated tests were avoided at the identical spot on the rock surface because Schmidt rebound numbers were observed to vary. This variation appeared to a result from a change in the physical property of the rock due to fracturing and pulverization at the impact point of the hammer.
Minimum volume of rock required to determine the Schmidt Rebound Number for a sample
This approach was chosen as the standardized testing method to record the average Schmidt rebound number for samples in the field. The reasons for choosing this approach are discussed later in the report
Collection of the Sample
Once rebound measurements were taken for a rock sample, a 20-30 kg portion of the sample was removed to provide a sufficient amount of rock material for the Los Angeles degradation test. This removal was accomplished by breaking the sample with a 13-pound sledgehammer into small enough sizes for transportation and crushing. The sample was transported in labeled 5-gallon buckets or cloth sacks. The bucket or sack number was noted with the Schmidt rebound number for reference once the Los Angeles degradation test was performed.
Characterization of the Sample Site
Distinguishing features of the rock mass and location of the sample site were recorded in field notes. A photograph was taken of each site for reference. Sample locations were initially marked on a Colorado Atlas Gazetteer (1:250,000) and then transferred to county maps (1:50,000).
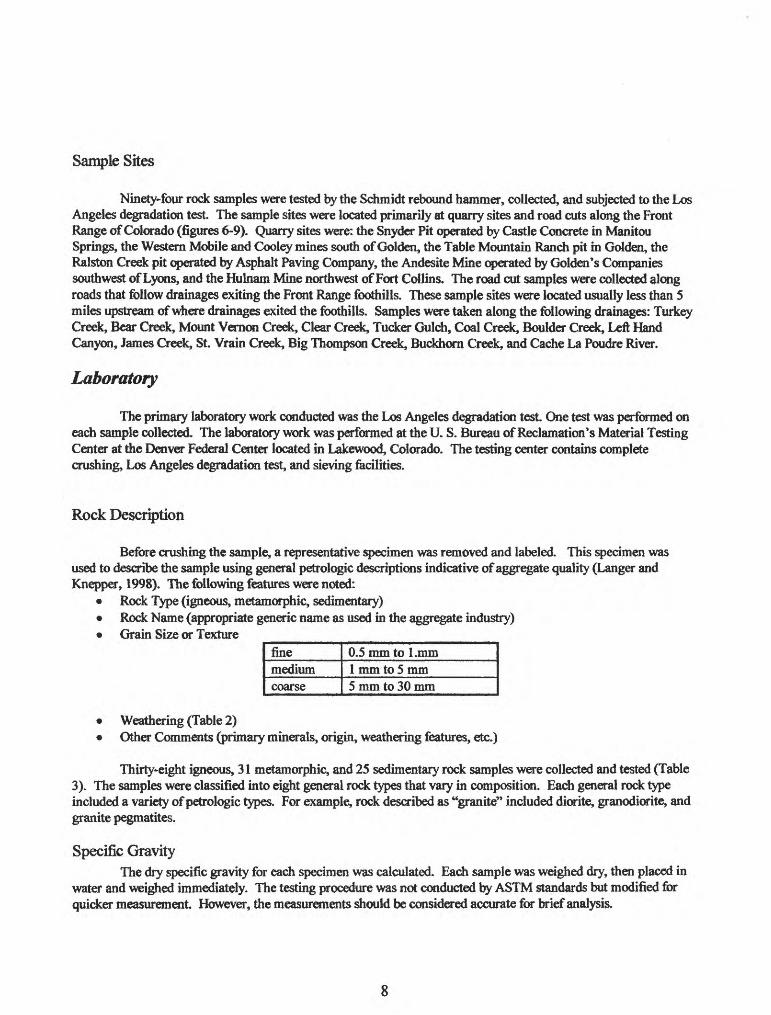
Sample Sites
Ninety-four rock samples were tested by the Schmidt rebound hammer, collected, and subjected to the Los Angeles degradation test. The sample sites were located primarily at quarry sites and road cuts along the Front Range of Colorado (figures 6-9). Quarry sites were: the Snyder Pit operated by Castle Concrete in Manitou Springs, the Western Mobile and Cooley mines south of Golden, the Table Mountain Ranch pit in Golden, the Ralston Creek pit operated by Asphalt Paving Company, the Andesite Mine operated by Golden's Companies southwest of Lyons, and the Hulnam Mine northwest of Fort Collins. The road cut samples were collected along roads that follow drainages exiting the Front Range foothills. These sample sites were located usually less than 5 miles upstream of where drainages exited the foothills. Samples were taken along the following drainages: Turkey Creek, Bear Creek, Mount Vernon Creek, Clear Creek, Tucker Gulch, Coal Creek, Boulder Creek, Left Hand Canyon, James Creek, St. Vrain Creek, Big Thompson Creek, Buckhoro Creek, and Cache La Poudre River.
Laboratory
The primary laboratory work conducted was the Los Angeles degradation test. One test was performed on each sample collected. The laboratory work was performed at the U. S. Bureau of Reclamation's Material Testing Center at the Denver Federal Center located in Lakewood, Colorado. The testing center contains complete crushing, Los Angeles degradation test, and sieving facilities.
Rock Description
Before crushing the sample, a representative specimen was removed and labeled. This specimen was used to describe the sample using general petrologic descriptions indicative of aggregate quality (Longer and Knepper, 1998). The following features were noted:
Rock Type (igneous, metamorphic, sedimentary) Rock Name (appropriate generic name as used in the aggregate industry) Grain Size or Texture
Thirty-eight igneous, 31 metamorphic, and 25 sedimentary rock samples were collected and tested (Table 3). The samples were classified into eight general rock types that vary in composition. Each general rock type included a variety of petrologic types. For example, rock described as "granite" included diorite, granodiorite, and granite pegmatites.
Specific GravityThe dry specific gravity for each specimen was calculated. Each sample was weighed dry, then placed in
water and weighed immediately. The testing procedure was not conducted by ASTM standards but modified for quicker measurement. However, the measurements should be considered accurate for brief analysis.
Figure 9. - Location of sample sites in the Colorado Springs area.
12
Table 2. - Weathering of bedrock (modified after Longer and Knepper, 1998).
Fresh
Faintly
Slightly
Moderately
Highly
No visible sign of rock weathering.
Discoloration on major discontinuity surfaces.
Discoloration indicates weathering of rock and discontinuity surfaces. All rock material may be discolored by weathering and may be somewhat weaker rock.
Less than half the rock is decomposed and/or disintegrated to a soil. Fresh or discolored rock is present as a continuous framework or as core stones.
More than half the rock is decomposed and/or disintegrated to a soil. Fresh or discolored rock is present as a continuous framework or as core stones.
Table 4. - "A" Grading for a Los Angeles degradation test.
Passing
37.5 mm (1 1/2 in)
25.0 mm (1 in)
19.0 mm (3/4 in.)
12.5 mm (1/2 in.)
Retained on
25.0 mm (1 in)
19.0 mm (3/4 in.)
12.5 mm (1/2 in.)
9.5 mm (3/8 in.)
Total
Weight of Size Fraction (grams)
1250 ± 25
1250 ± 25
1250 ± 10
1250 ± 10
5000 ± 10
13
Crushing
The collected sample was crushed in a 1.5 inch ribbed jaw crusher. Approximately 20 kilograms of the sample were required to obtain the proper amount of material for the Los Angeles degradation test (fig. 10).
1/2' 3/4" 1/2" 3/8"
Steve Retained On
-3/8"
Figure 10. - Particle size distribution after crushing a collected sample.
Los Angeles Degradation Test
The Los Angeles degradation test was performed by ASTM (C131) specifications using an "A** grading (Table 4). This is a common grading associated with construction projects requiring aggregate.
The graded sample was placed in the Los Angeles degradation machine drum with 12 steel balls weighing between 400-440 grams each. The drum of the machine was completely enclosed. The drum had a steel shelf opposite the door, which picked up the graded sample and the steel balls and dropped them 27 inches during rotation (Figure 11). The machine's rotation speed was approximately 33 RPM and completed 500 revolutions per sample. The action of the machine combined impact with surface wear on the aggregate, causing shattering and rubbing.
After removal from the machine, the sample was placed on the No. 12 (1.70 mm) sieve with an automatic shaker for 5 minutes. The remaining sample retained on this sieve was weighed and recorded. The amount of material passing through the sieve was calculated as the percent lost, or the Los Angeles degradation test value for the rock.
Figure 11. - Illustration of Los Angeles degradation test machine (Barksdale, 1996).
14
Testing Schmidt Rebound Hammer Reliability at Control Sites
Control testing sites were selected to determine the reproducibility of the Schmidt rebound number and associated Los Angeles degradation value. Ten samples were tested and collected at each controlled site. These test sites were located in homogeneous rock material expected to demonstrate the same physical characteristics.
Data Analysis
Schmidt rebound numbers, Los Angeles degradation test values, location, and rock descriptions for each rock sample were combined into a database (Appendix A). The data was analyzed both statistically and graphically using a statistical software package called STATVIEW v.4.51. Scatter plots were generated for comparing Schmidt rebound numbers to the corresponding Los Angeles degradation values. Plots were generated for each rock type, splitting out different characteristics: grain size, degree of weathering, formation or origin, or degree of metamorphism. This allowed for interpretation of the data based on characteristics within each rock type.
Some rock samples exhibited high variability for the hammer test. The resulting average rebound number was usually observed to be inconsistent with trends associated with average rebound numbers from low variability tests. To insured reasonable data for analysis, rock samples having high variability for the measurements by the hammer test were removed from the data set. This high variability threshold was defined as the average rebound number being greater than ±3.0% of the true sample mean for the 95% confidence level.
RESULTS
Testing Approaches
Five sample sites were chosen to analyze the two alternative testing approaches (grid pattern vs. single sample) for average rebound number of a rock. Table 5 summarizes and compares the two approaches. The single- sample testing approach was implemented as the standardized test for collecting rebound data in the field
Testing Schmidt Rebound Hammer Reliability at Control Sites
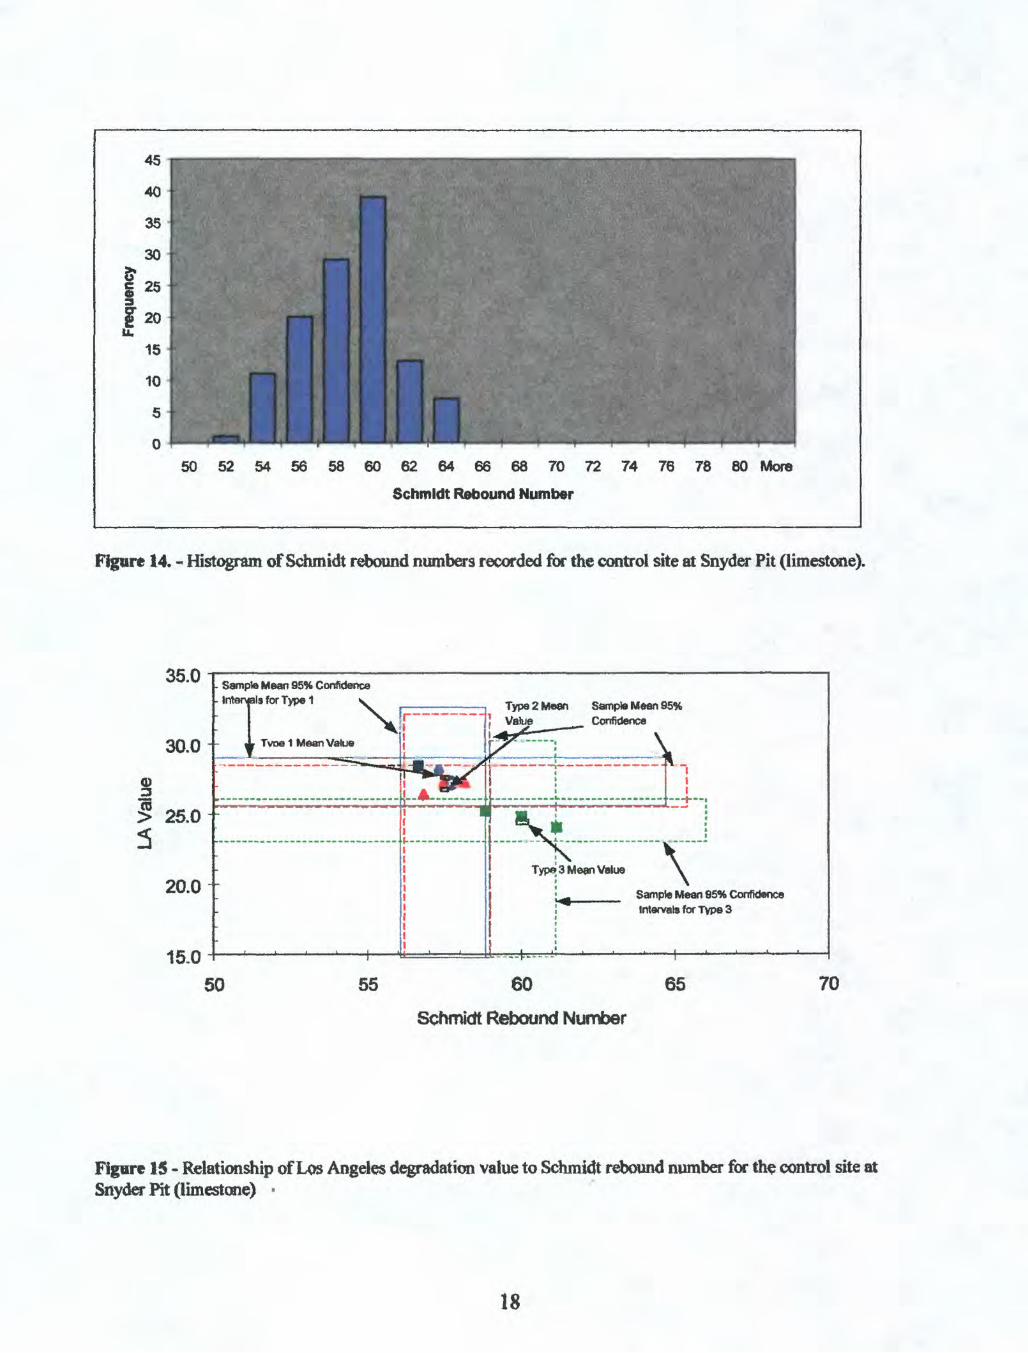
Two sites were selected to test the reproducibility of the Schmidt rebound hammer test values (using the standardized test approach) and Los Angeles degradation test values (Table 6) (figures 12-15). The sites consisted of homogeneous rock expected to demonstrate homogenous physical properties. The sites were the Table Mountain Ranch quarry located on the west side of North Table Mountain north of Golden, Colorado, and Castle Concrete's Snyder Pit located north of Manitou Springs, Colorado. The Table Mountain Ranch quarry contained a homogenous andesite lava flow rock. The Snyder Pit appeared to contain fairly homogeneous, massive fine grained limestone. Ten samples were tested and removed from each quarry. The sample sites at the Table Mountain Ranch pit were spaced about 100 ft apart. The sample sites at the Snyder Pit were spaced approximately 10-100 ft. apart. Once closely inspected, Snyder Pit samples were not as homogeneous as they appeared due to stratigraphic variability of lithology within the formation. Several limestone sequences were noted to have developed red altered zones in the outcrop, which significantly effected its homogeneity. The samples were divided into four group types based on color and texture.
15
Table 5. - Comparison of grid pattern to single sampling testing approaches to determine rebound number.
Comparison Sites
1
2
3
4
5
Average
Grid Pattern Approach Mean Range1 Std. Error
25.3 48 1.05
42.5 40 0.98
23.5 45 1.17
52 35 0.81
50.2 40 0.88
38.7 42 0.98
Single Sample Approach Mean Range1 Std. Error
55.6 6 0.7
57 8 0.7
63.1 18 1.66
65.5 8 0.72
60.8 16 1.54
60.4 11 1.06
Difference Between Approaches Mean Range1 Std. Error
30.3 -42 -O.35
14.5 -32 -0.28
39.6 -27 0.49
13.5 -27 -0.09
10.6 -24 0.66
21.7 -30 0.09
1 Golden Gate Canyon Road 2 Lookout Mtn. Rd.- Buffalo Bill's marker 3 Lookout Mtn. Rd.- Windy Saddle Trail Head 4 North Table Mountain Pit 5 U. S. Hwy40Goiden/MorTision
Range is the difference between maximum and minimum recorded values.
Table 6. - Statistical analysis for the two control locations.
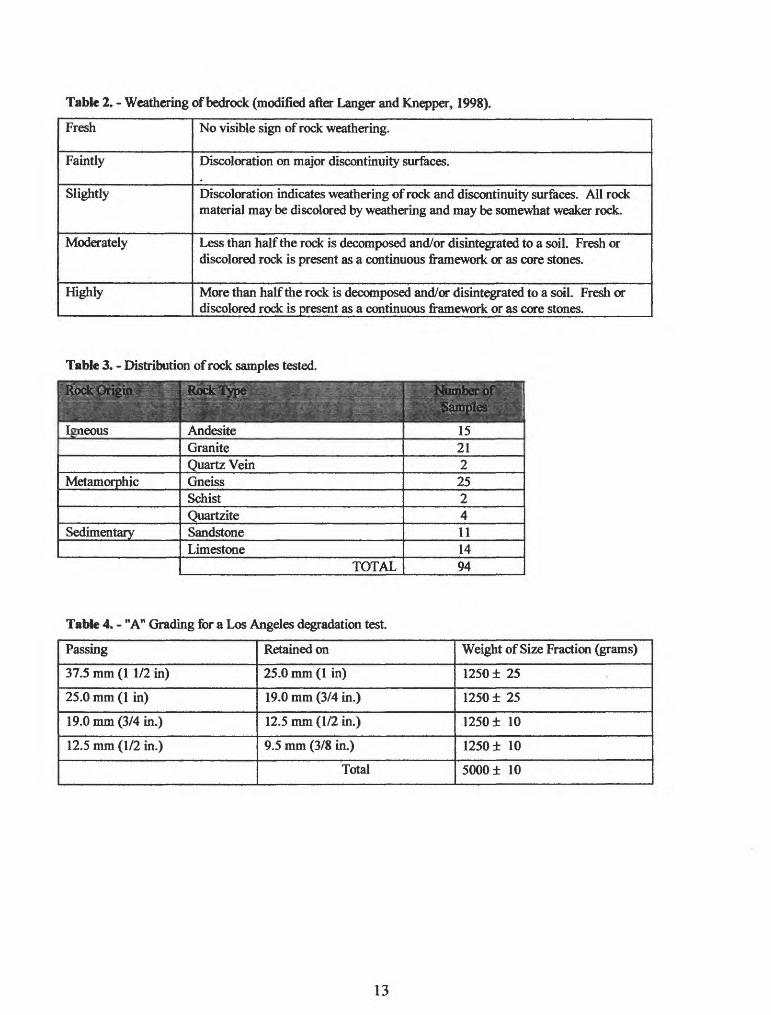
Figure 14. - Histogram of Schmidt rebound numbers recorded for the control site at Snyder Pit (limestone).
S
35.0
30.0
25.0
20.0
15.0
Sample Mean 95% Confidence ls for Type 1
50
Type 2 Mean Sample Mean 95% Confidence
Sample Mean 85% Confidence Intervals for Type 3
55 60 65
Schmidt Rebound Number
70
Figure 15 - Relationship of Los Angeles degradation value to Schmidt rebound number for the control site at Snyder Pit (limestone)
18
Correlation of Schmidt Rebound Number to Los Angeles Degradation Value
Average Schmidt rebound numbers and Los Angeles degradation values were obtained from all 94 samples collected (Table 7 and 8). A summary of the variation in rock type is provided in Table 99. Scatter plots for each rock type represent the data graphically (fig. 16-31).
Table 7* - Summary of Los Angeles degradation values and Schmidt rebound numbers for samples collected.
Rock TypeAndesiteGraniteQuartz VeinGneissSchistQuartziteSandstoneLimestone
No. of Samples
15212
25
2
4
11
14
No. of Tests
1515218
0
4
10
14
Schmidt Rebound Number Average Range
6555675648575456
61-6933-6964-7026-6746-5048-6532-6737-61
Los Angeles Degradation Average Range
2144323126396228
16-2524-9231-3417-6319-3326-3138-10024-38
Table 8. - Summary of weathering and texture for samples collected.
Rock TypeAndesiteGraniteQuartz VeinGneissSchistQuartziteSandstoneLimestone
Weatheringfresh
2
11
faint slight moderate13525224
12
25 3
7 6
251
Texture1F151210
1814
F/M M M/C
1 9 1
2 3
11
C
3
3
1
'F= Fine, M= Medium, C= Coarse
19
Table 9. - Summary descriptions of variation within each rock type collected.
Andesite
Granite
Gneiss
Limestone
Sandstone
Schist
Quartzite
Quartz Vein
Ten samples were taken from the Tertiary extrusive flows at North Table Mountain directly north of Golden, Colorado. These samples came from a control site. One sample came from South Table Mountain in Golden. Two samples came from Asphalt Paving's Ralston Creek Mine located north of North Table Mountain. One sample came from Golden's Company Andesite Mine southwest of Lyons, Colorado. One sample came from northwest of Loveland, Colorado. These samples varied in composition slightly, however they are all representative of andesite. The North and South Table Mountain samples are often identified as basalt, however, they contain large phenocrysts of mafic minerals characteristic of andesiteAll samples were taken from Precambrian formations. The composition, grain size, and degree of weathering varied greatly in these samples. Composition range from felsic, coarse grained, pink pegmatite to granitic rock, to intermediate/mafic granodiorite.All samples were taken from Precambrian formations. The composition, grain size, and degree of weathering varied greatly in the set of samples. Composition ranged from granitic gneiss to intermediate/mafic biotite gneiss.Ten of the samples were taken from the Ordovician Manitou Formation near Manitou Springs, Colorado, three from Cretaceous Niobrara formation, and one from the Permian Ingleside formation west of Fort Collins, Colorado. The Manitou and Ingleside samples were massive low-magnesium calcite limestone; the Niobrara samples were shaley and organic-rich.. The ten samples of the Manitou Formation were taken at the Snyder Pit as a control test.Six samples were taken in various locations of the Cretaceous Dakota formation. Four samples were taken in various locations for the Pennsylvanian and Permian Fountain Formation. One sample of the Cretaceous Fox Hills Sandstone was taken in Golden, Colorado. The Dakota samples consisted of fine-grained, quartzose sand that was well-cemented. The Fountain samples consisted of fine- to coarse-grain arkose sand and varied significantly in competency and cementation from sample to sample. The Fox Hills Sandstone consisted of a fine-grained, quartzose sand that was poorly cemented and crumbled readily.Two schist samples were collected from Precambrian formations.
These samples varied with age and composition. Two samples were low-grade contact metamorphosed samples associated with intrusions of Tertiary age that came into contact with Fountain Formation. The other two samples were metamorphosed quartzose sandstone of Permian age.These samples were collected from quartz veins in Precambrian metamorphic rock.
20
100'
90'
80'
! -e
| 5 60-
1
* 40"
30-
20-
10-
3
*
^
A
0
A * A
0
A * * 0 A*A
_ o°
* 0 A 0
V ^l 0 A O
A * V . *
O ***«»0
0 40 SO 60 Aviragt cfemldt Rtbouittf Numbtr
And..b
On.k.
OnillU
Llnmtton.
QlMltZ V«K
QuaittlU
S.nd»ton.
V
**
70 8 0
100'
90-
80-
70-
60-
so-
8-1 40"
30-
20-
10-
3
A
A
0 A
A
A
* 0«
0 ° '
0 40 SO 60 7
fmh
0 f.hUir
A .ttghtV
A motoratoly
} 80
Figure 16- Relationship of Los Angeles degradation Figure 18. - Relationship of Los Angeles degradation value to Schmidt rebound number for all rock types. value to Schmidt rebound number for granite classified
by degree of weathering.
Figure 17. - Relationship of Los Angeles degradation Figure 19. - Relationship of Los Angeles degradationvalue to Schmidt rebound number for andesite classified v^e to Schmidt rebound number for granite classifiedby degree of weathering. ty texture.
21
too-
DO-
80-
AnB«"*60- D» 80
V miatf onSO-Vkhi
40;
3D'
20-
10-3
" granite O granociorite* pegmabte
«
O
A
A
*
.
0 40 SO 60 70 80
90-
80-
.
« 70 '
60"
50-
40"
30-
20-
3
fh.
O fh./m.»ki«i
A radium
A co.r.o
A
A
A
°Q
A ,
*
0 40 SO 60 70 80
Av<r«f< 8 dint Ml M< ken lid Nil inker
Figure 20. Relationship of Los Angeles degradation Figure 22. - Relationship of Los Angeles degradationvalue to Schmidt rebound number for granitic rocks value to Schmidt rebound number for gneiss classifiedclassified by composition. by texture.
90-
80-
70"
60"
so-
40'
30-
20-
3
f.Mly
A m.d.f.l.ly
A
A
A
0 » A
0 o
e00
*A
0 40 SO 60 70 80
90"
80'
70-
60"
i
» S°
40'
30'
20'
3
fro.h
.Way
.
° d°ta«A °°0
0 40 SO 80 70 80
Figure 21. - Relationship of Los Angeles degradation Figure 23. - Relationship of Los Angeles degradationvalue to Schmidt rebound number for gneiss classified value to Schmidt rebound number for limestoneby degree of weathering. classified by degree of weathering.
22
100
BO'
80'
to 70Ang*l*s
«d ti-50
hi
40
30
20
10'
3l
Invade0 Mentou* Motnra
A
A °00
D 40 50 00 70 80AVWQV Sctwitidt Rtbound Nunriwr
50
5
Avcraga (ckMMt lUfcoaiid Mo
Figure 24. - Relationship of Los Angeles degradation Figure 26. - Relationship of Los Angeles degradationvalue to Schmidt rebound number for limestone value to Schmidt rebound number for sandstoneclassified by lithologic formation. classified by texture.
Figure 25. - Relationship of Los Angeles degradation Figure 27. - Relationship of Los Angeles degradationvalue to Schmidt rebound number for sandstone value to Schmidt rebound number for schist (includesclassified by degree of weathering. data not included in analysis).
23
80-
70-
80-
, :
50-
S ;<
sJ 40-
30-
20-
3
1 * f.htly
0 «ngwv
0
^
o
.
0 40 50 80 70 80
80-
80-
1 '«-
C
S
Ir:<sJ 40-
30-
20-
3
hfclifrad*!
O tow gr>4. I
0
0
.
0 40 SO 60 70 80
Figure 28. - Relationship of Los Angeles degradation Figure 30. - Relationship of Los Angeles degradationvalue to Schmidt rebound number for quartzite classified value to Schmidt rebound number for quartzite classifiedby degree of weathering. by degree of metamorphism.
90-
80-
70-
so-
so-
40"
30'
20-
3
fku
O mxrtim
A
A
0
0 40 50 60 70 80
80-
80-
c
«
1 »"
* 40"
30-
20-
3
0 40 50 80 70 80
Figure 29. - Relationship of Los Angeles degradation Figure 31. - Relationship of Los Angeles degradation value to Schmidt rebound number for quartzite classified value to Schmidt rebound number for quartz vein. by texture.
24
DISCUSSION OF RESULTS
Testing Approaches
The best method for determining the Schmidt rebound number of a rock was by selecting an individual sample to test numerous times. Testing an individual sample resulted in a representative Schmidt rebound number of the rock because the Schmidt rebound number was representative of the properties of the rock, not the rock outcrop. The grid pattern testing procedure produced an average Schmidt rebound number that reflected the properties of the rock outcrop rather than the rock itself. Outcrop properties are based on the physical nature of the rock as well as the fracturing or jointing of the rock mass. Testing individual samples is the only way to obtain Schmidt rebound numbers that can be compared to Los Angeles degradation values. The Los Angeles degradation test measures only the physical properties of the intact rock. Five comparison sites were used to analyze the two different testing methods (Table 5).
Testing the rock using a grid pattern over a 75 ft2 area (15 feet wide by 5 feet high) resulted in an average range of 42 Schmidt rebound numbers, a standard error of 0.98, and an overall Schmidt rebound number mean value 21.7 units lower than the single-sample test. Low Schmidt rebound numbers from grid sampling were caused by testing a rock mass that has unseen fractures and physical changes directly behind the tested rock surface.
Individual sample testing proved reliable in determining the true Schmidt rebound number of rocks. At the comparison sites, the range of Schmidt rebound numbers averaged 11. Standard error was 1.06, almost identical with that for the grid pattern. However, individual testing used only 12 tests compared to 96 for the grid pattern approach. The single-sample approach allowed the operator to view the sample in three dimensions, reducing error associated with fractures behind the rock surface. This approach was more time-efficient, taking approximately 10% of the time to determine an average Schmidt rebound number than that of the grid-pattern testing procedure.
Schmidt Rebound Hammer Reliability at Control Sites
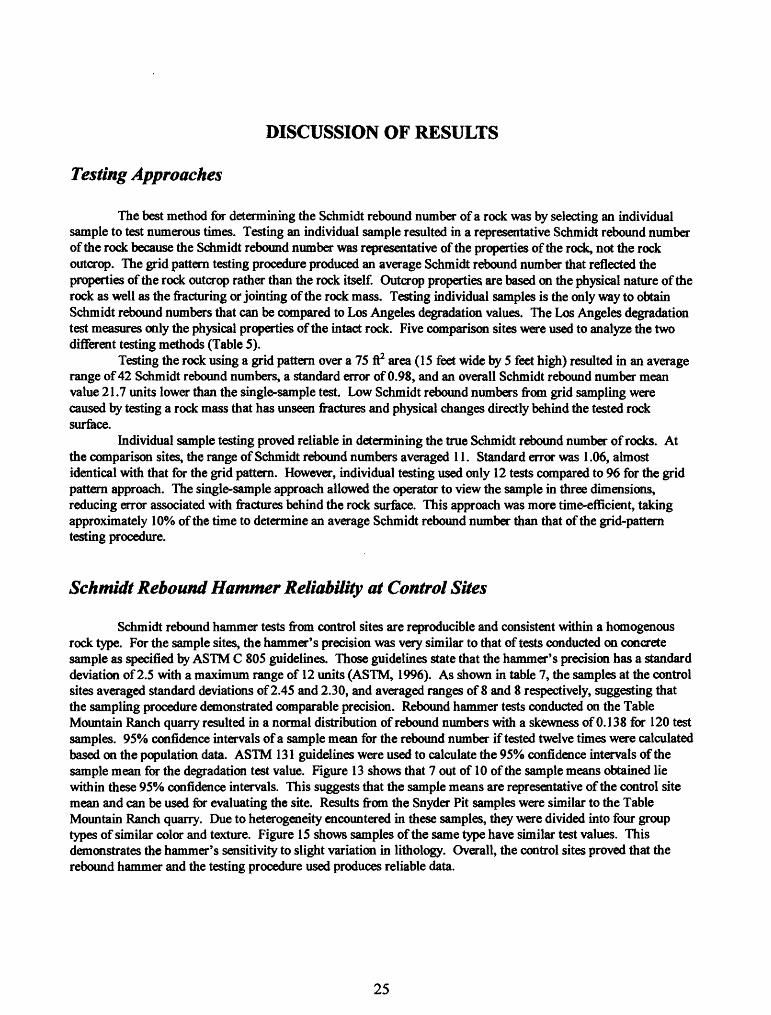
Schmidt rebound hammer tests from control sites are reproducible and consistent within a homogenous rock type. For the sample sites, the hammer's precision was very similar to that of tests conducted on concrete sample as specified by ASTM C 805 guidelines. Those guidelines state that the hammer's precision has a standard deviation of 2.5 with a maximum range of 12 units (ASTM, 1996). As shown in table 7, the samples at the control sites averaged standard deviations of 2.45 and 2.30, and averaged ranges of 8 and 8 respectively, suggesting that the sampling procedure demonstrated comparable precision. Rebound hammer tests conducted on the Table Mountain Ranch quarry resulted in a normal distribution of rebound numbers with a skewness of 0.138 for 120 test samples. 95% confidence intervals of a sample mean for the rebound number if tested twelve times were calculated based on the population data. ASTM 131 guidelines were used to calculate the 95% confidence intervals of the sample mean for the degradation test value. Figure 13 shows that 7 out of 10 of the sample means obtained lie within these 95% confidence intervals. This suggests that the sample means are representative of the control site mean and can be used for evaluating the site. Results from the Snyder Pit samples were similar to the Table Mountain Ranch quarry. Due to heterogeneity encountered in these samples, they were divided into four group types of similar color and texture. Figure 15 shows samples of the same type have similar test values. This demonstrates the hammer's sensitivity to slight variation in lithology. Overall, the control sites proved that the rebound hammer and the testing procedure used produces reliable data.
25
Correlation ofSchmidt Rebound Number to Los Angeles Degradation Value
In order to understand the relationship of the rebound number to the degradation value, the data were analyzed together and separately by rock type. Examination of the data by means of scatter plots is a good method to visualize correlation. Linear regression analysis was performed on the data but is insufficient for understanding the relationship between the two tests. Because data sets for each rock type are small, one deviant data point would significantly affect the coefficient of the regression equation and the values of the correlation coefficient. Interpretive qualitative analysis provided better understanding of correlation because weathering, texture, composition, and lithology could be assessed.
Ignoring the effect of rock type, no apparent strong correlation exists between the Schmidt rebound number and the Los Angeles degradation test value for all samples collected. A poorly defined inverse relationship may exist between the two test values. In general, sandstone showed higher Los Angeles degradation test values than other rock types for the same Schmidt rebound number. Schist showed lower Los Angeles degradation test values than other rock types for the same Schmidt rebound number. Los Angeles degradation test values vary consistently by 40 units for an average Schmidt rebound number within the range of 50 to 70. The large range deems the Schmidt rebound test hammer useless for estimating Los Angeles degradation if rock type is ignored. However, analysis of data for some rock types yields several trends.
Andesite
A strong inverse correlation trend between Schmidt rebound number and Los Angeles degradation test value is evident for the andesite samples (fig. 17). This trend is evident for rebound numbers from 60 to 70. Low standard deviation values for sample means suggest that the data for andesite is representative.
Granite
Values for the majority of granite samples exhibit a poorly defined inverse relationship (fig. 1S-20). Los Angeles degradation test values for slightly to moderately weathered rock are very unpredictable. Values probably are affected by intergranular weakness, especially in the coarse-grained rock. The distribution of data on the scatter plot based on texture confirms that coarse-grain granite shows more variability. The only correlation that may prove useful for granite is medium- to fine-grained rock that is fresh to faintly weathered. For this subset of granites reasonable correlation can be identified for rebound numbers ranging from 58 to 68.
Gneiss
Gneiss rock shows a poorly define inverse relationship (fig. 21,22). Los Angeles degradation test values for moderately weathered rock is very unpredictable with the average Schmidt rebound number. With an approximate average Schmidt rebound number of 55, the Los Angeles degradation test values varied by 15 units. Variation is probably a function of intergranular weakness, similarly in granites, especially in the coarser grain rock. Analysis of the distribution of data on the scatter plot based on grain size shows that fine grained rockhad consistent Los Angeles degradation test values while average Schmidt rebound numbers were variable. Fine/medium to medium grained rock showed an inverse relationship. Overall, the weak correlation of the data suggests that the hammer is unacceptable for quality control testing. However, a well-defined correlation does appear to exist for gneiss that is medium to fine grained and is fresh to faintly weathered.
Limestone
The limestone samples collected showed a well-defined correlation between the average rebound number and the degradation test value for rebound numbers ranging from 50-62 (fig. 23,24). The one outlying result was a shaley sample that was slightly weathered and showed an unexpectedly low Schmidt rebound number compared to the Los Angeles degradation test value. The shaley composition and degree of weathering of the sample could
26
have caused this anomalous result. If so, the Schmidt rebound number is strongly influenced by the degree of weathering and must be taken into consideration when predicting Los Angeles degradation test values for limestone. The data for fresh, nonshaley limestone indicate a well defined correlation.
Sandstone
No identifiable correlation existed among the sandstone samples between the average Schmidt rebound number and the Los Angeles degradation test value (fig. 25,26). Analysis of the samples did not identify any correlations based on weathering, grain size, or geologic formation. Grain size, cementation, mineralogy of the sand, and roundness of the sand particles may have had a significant effect on the rebounding ability of the hammer.
Schist
Only two schist samples were taken, which is not sufficient for conducting a correlation analysis. Each sample had a high error associated with the average rebound number. Therefore, the data was not considered statistically significant. The two samples collected do show an inverse relationship comparable to that seen in the majority of the data (fig. 27).
Quartzite
No correlation existed between the average Schmidt rebound number and the Los Angeles degradation test value for the quartzite samples (fig. 28-30). The average Schmidt rebound numbers had small error for each sample. However, the variation of composition, degree of metamorphism, and grain size created too much variability for assessing data for a correlation.
Quartz Vein
Only two quartz vein samples were taken, which is not sufficient for conducting a correlation analysis. However, the average Schmidt rebound number had little error and the data can be considered valid. As with the other rock samples, the two quartz samples show a distribution that suggest an inverse relationship (fig. 31).
Effect of Specific Gravity
Specific gravity appeared, to effect the recorded rebound number for andesite, granite, and gneiss samples. For andesite, the higher specific gravity rock gave higher rebound values and lower degradation values (fig. 32). For granite and gneiss, high specific gravity rock is associated with low degradation values for a given rebound number (fig. 33). Rock with specific gravity values greater than 2.7, gave degradation and rebound values showing the strongest correlation with rock type.
27
110
100 -
90 -
80 -
70 -
o> 60 o
50 -
40 -
30 -
20 -
10
2.7
O 2.8
Specific Gravity appears to effect rebound number and degradation value
30 35 40 45 50 55 60Average SchmkJt Rebound Number
65 70 75
Figure 32. * Relationship of Los Angeles degradation value to Schmidt rebound number for andesite classified by specific gravity.
Figure 33. - Relationship of Los Angeles degradation value to Schmidt rebound number of gneiss and granite classified by specific gravity.
29
CONCLUSIONS AND RECOMMENDATIONS
The Schmidt rebound hammer is an effective, reliable field tool for testing rock. However, the value of using the hammer alone to predict the Los Angeles degradation value for rock is limited. The standardized test developed in this study should be used for future work because of its precision and easy use in the field. This test requires that a sample tested must weigh more than 25 kg and not move while being tested. When the rebound number recorded is greater than 45, the user can assume the hammer has rebounded appropriately to the rock sample's physical properties. Hammer test values will deviate significantly when testing a rock face that is highly fractured and weathered
Some rock types in the Front Range of Colorado show an inverse relationship between the rebound number obtained by the Schmidt hammer test and the corresponding Los Angeles degradation value. However, the degree of correlation varies with rock type and rock properties. The rebound number strongly correlates with the degradation value for massive, fine-grained limestone and andesite. The rebound number does not correlate well with the degradation value for granite, gneiss, quartzite, and sandstone. Weathering, texture, composition, and specific gravity of the rock have a significant effect on the ability of these rock types to rebound the hammer. Data on schist and quartz vein rock were not sufficient to interpret.
The rebound number obtained from a rock sample often demonstrated significant variation based on the weathering of the surface being tested. Nesj and others (1994) demonstrated weathering variation was enough to adequately date rockfall deposits in Norway based on the degree of weathering that the material had undergone since the rockfall had occurred. The rockfalls that were dated were composed of the same homogeneous rock, however the rebound hammer test show lower values for the oldest deposits. Similarly, weathered samples produced erratic test results. Evidently testing weathered rock complicates identification of correlation between Schmidt rebound numbers and other tests. For andesite, granite and gneiss the specific gravity of the rock will affect rebound numbers.
The Schmidt rebound hammer can be used in tests for crushed-stone mining operations. However, its effectiveness as a prediction tool must be assessed prior to operational use. Data for the rock types expected to be encountered must be collected. A baseline of data points will define a correlation, if any, between the two tests. This study provides a database for reference, especially for andesite and limestone. Once a relationship is established, future rebound hammer tests can be compared to the baseline data for accurate prediction of degradation values. Baseline data must be collected from rock samples that show small error in repeated rebound hammer measurements.
The rebound hammer should be useful for testing fine-grained, unweathered rock, specifically andesite and limestone. Fine-grained, unweathered granite and gneiss test values may also be fairly predictable. However, deviation in these properties from the rocks tested here, or any other tested rock for that matter, requires obtaining additional baseline data. Specific gravity measurements of rock samples may be required to correct degradation values. If the correlation of Schmidt numbers with Los Angeles degradation values is not well defined, the rebound hammer should not be used for prediction.
The Schmidt hammer test should always be applied to unweathered, unfractured, competent samples of rock. If testing a quarry face, the operator must insure proper rebounding of hammer by testing several different spots containing the same homogeneous rock to verify mat rebound numbers are consistent.
30
REFERENCES CITED
Abacus Concepts, 1996, StatView: Abacus Concepts, Inc., Berkley, CA, 268p.
American Society for Testing and Materials, 1996, Annual Book of ASTM Standards 04.02, p. 74-77, p. 273-275.
Arioglu, E. and Tokgoz, N., 1991, Estimation of Rock Strength: Rapidly and Reliably by the Schmidt Hammer: Journal of Mines, Metals &Fuels 39(9), p.327-330.
Barksdale, R.D., 1991, ed., The Aggregate Handbook: Washington D.C., National Stone Association, p. 3-43 - 3- 54.
Colton, R.B., and Fitch, H.R., 1974, Map showing potential sources of gravel and crushed-rock aggregate in the Boulder-Fort Collins-Greeley Area, Front Range Urban Corridor, Colorado: U.S. Geological Survey Miscellaneous Investigations Map 1-856-A, scale 1:100,000.
Deer, D.U. and Miller, R.P., 1966, Engineering classification and index properties for intact rocks, Technical Report No. AFWL-TR 65-116, Air Force Weapons Laboratory, New Mexico.
Geological Society Engineering Group Working Party, 1977, The Description of Rock Masses for EngineeringPurposes, Report by the Geological Society Engineering Group Working Party: The Quarterly Journal of Engineering Geology 10, p. 372-373.
Kazi, A. and Al-Mansour, Z. R., 1980, Empirical Relationship Between Los Angeles Abrasion and Schmidt Hammer Strength tests with Application to Aggregates Around Jeddah: The Quarterly Journal of Engineering Geology 13(1), p. 45-52.
Langer, W.R and Knepper, Jr., D. R, 1998, Geologic Characterization of Natural Aggregate: A Field Geologist's Guide to Natural Aggregate Resource Assessment, in, Bobrowski, P.T, ed., .Aggregate Resources. A Global Perspective: Rotterdam, Netherlands, AA Balkema Publishers, p. 275-294.
Langer, W.R and Glanzman, V.M., 1993, Natural Aggregate Building America's Future: U.S. Geological Survey Circular 1110.
Krattenmaker, Jim, 1998, Interview: Control Manager, Asphalt Paving Company: February 17.
Kasim, M. and Shakoor, A., 1996, An Investigation of the Relationship Between Uniaxial Compressive Strength and Degradation for Selected Rock Types: Engineering Geology, 44(1-4), p. 213-227.
Nesje, A. et al, 1994, Dating Rockfall-Avalanche Deposits from Degree of Rock-Surface Weathering by Schmidt- Hammer Tests: A Study from Norangsdalen, Sunnmore, Norway: Norsk Geologisk Tidsskrift, 10(3): p. 108-112.
Swan, A.R.R and Sandi lands, 1995, Introduction to Geological Data Analysis: Oxford, England, Alden Press Ltd., p. 15-179.
31
Trimble, D.E., and Fitch, H.R., 1974a, Map showing potential sources of gravel and crushed-rock aggregate in the Greater Denver Area, Front Range Urban Corridor, Colorado: U.S. Geological Survey Miscellaneous Investigations Map I-856-A, scale 1:100,000.
Trimble, D.E., and Fitch, H.R., 1974b, Map showing potential sources of gravel and crushed-rock aggregate in the Colorado Srpings-Castle Rock Area, Front Range Urban Corridor, Colorado: U.S. Geological Survey Miscellaneous Investigations Map 1-857-A, scale 1:100,000.
West, Graham, 1994, Estimating Aggregate Properties from the Unconfined Compressive Strength of Rock: The Quarterly Journal of Engineering Geology, 27(3), p. 275-276.
APPENDIX B - Method for Determining the Schmidt Rebound Number andPreparing Samples for the Los Angeles Degradation Test for Potential
Crushed-stone Aggregate Source Rock
1. Determine what rock types will be mined. A baseline of data will need to be established for each rock type. The baseline data consists of an average Schmidt rebound number and a Los Angeles degradation value for several samples of the same rock type. This data should be plotted as a bivariant scatter plot, with degradation value on the y-axis and rebound number on the x-axis. A quality control technician will look at the data plotted to determine if a well-defined correlation exists for the two test values. If so, the technician can use the correlation to determine degradation value based on rebound numbers acquired from rock samples. The procedure for determining the rebound number is described below.
2. Perform Schmidt Rebound Hammer Testa) Perform hammer test on a calibration Mock to insure accuracy of the hammer before and after each day in
field.b) Select a rock sample to test that meets the following criteria:
Representative of rock of interest Fresh to faintly weathered surfaces. Competent with minimal fractures. Volume > 10,000 cm3 or mass > 25 kg (larger size sample needed if the geometry of the sample is not
blocky) Contains flat, smooth surfaces adequate for testing
c) Orient sample so that is on solid ground.d) Apply hammer as near to vertically down on sample as possible and perpendicular the surface being tested.
The angle of application can vary ± 30° from vertical When applying the hammer, insure that it is firmly held and applied slowly. The surface must be Sat and smooth. If not, prepare surface with rubbing stone usually provided with
test hammer. Ignore the rebound number if:
a) The hammer slips or fractures the surface of the rock.b) The rebound number deviates by more than 10 from the implied mean
e) Record the rebound numberf) Repeat the hammer tests on the rock sample until 12 rebound numbers are recorded, making sure the tests
are performed to represent the spatial heterogeneity of the rock sample, if it exists.g) Average the 12 rebound numbers. This will be the Schmidt rebound number for the rock.
3. Collect enough rock material from the tested sample for obtaining the appropriate "A" grading after being crushed.
4. Record the location and rock mass description of the sample site. For the rock mass description, note: Spacing of discontinuities Weathering of the rock mass Heterogeneity of the rock mass
5. Describe the collect rock sample.a) Rock Name (use classification that distinguishes this rock type from others in the quarry)b) Grain Size or Texture
fine 0.5 mm to I.mm medium 1 mm to 5 mm coarse 5 mm to 30 mm
c) Weathering Fresh No visible sign of rock weathering. Faintly Discoloration on major discontinuity surfaces.. Slightly Discoloration indicates weathering of rock and discontinuity surfaces. All rock material
may be discolored by weathering and may be somewhat weaker rock.
37
Moderately Less than half the rock is decomposed and/or disintegrated to a soil. Fresh or discolored rock is present as a continuous framework or as core stones.
Highly More than half the rock is decomposed and/or disintegrated to a soil. Fresh ordiscolored rock is present as a continuous framework or as core stones,
d) Other Comments (primary minerals, origin, weathering features, etc.) 6, Perform the Los Angeles degradation test on the collected rock sample.
APPENDIX C - Common Questions Concerning the Schmidt ReboundHammer Test
What if a large enough sample size for testing does not exist?
The hammer test will not perform properly and the results will not be correct.
What if the rebound hammer cannot be applied with an a & 90 °?
The test can still be performed, however a correction must be made for the rebound number recorded. Consult the user's guide for the particular correction factor based on the compressive strength curves given in the guide.
What if the sample surface is slightly to moderately weathered?
Try to create a fresh surface for testing using a hammer. If unable to, the user must decide on a correction factor based on experience for the rebound number obtained. The rebound number will be lower for a weathered surface,
What if the sample's composition and texture vary significantly within the rock sample?
Conduct rebound hammer tests on the sample which will represent the heterogeneity. If the hammer tests appear to have performed well, record the data, although it may appear to be statistically unreliable.
What if the sample's surface is not flat?
Use a rubbing stone, or hammer, to create a flat surface
Can the test be conducted when the sample is wet?
Sampling wet rock is not advisable. Some studies have shown that wet samples affect rebound properties for certain rock types. Test all samples dry to insure consistency.
Can the rebound number be determined by less than 12 tests?
Yes. However, the confidence level calculated for the rebound number will be affected if fewer tests are performed.