U.S. Department of Agriculture Forest Service National Technology & Development Program 7700—Transportation Mgmt 0877 1804—SDTDC September 2009 FO R E S T S E R VICE D E P A R T MENT OFAGRIC U L T U R E D E P A R T M E N T O F T R A N S P O R T A T I O N U N I T E D S T A T E S O F A M E R I C A Simplified User’s Guide to Time-Domain- Reflectometry Monitoring of Slope Stability
Simplified User’s Guide to Time-Domain-Reflectometry Monitoring of Slope Stability
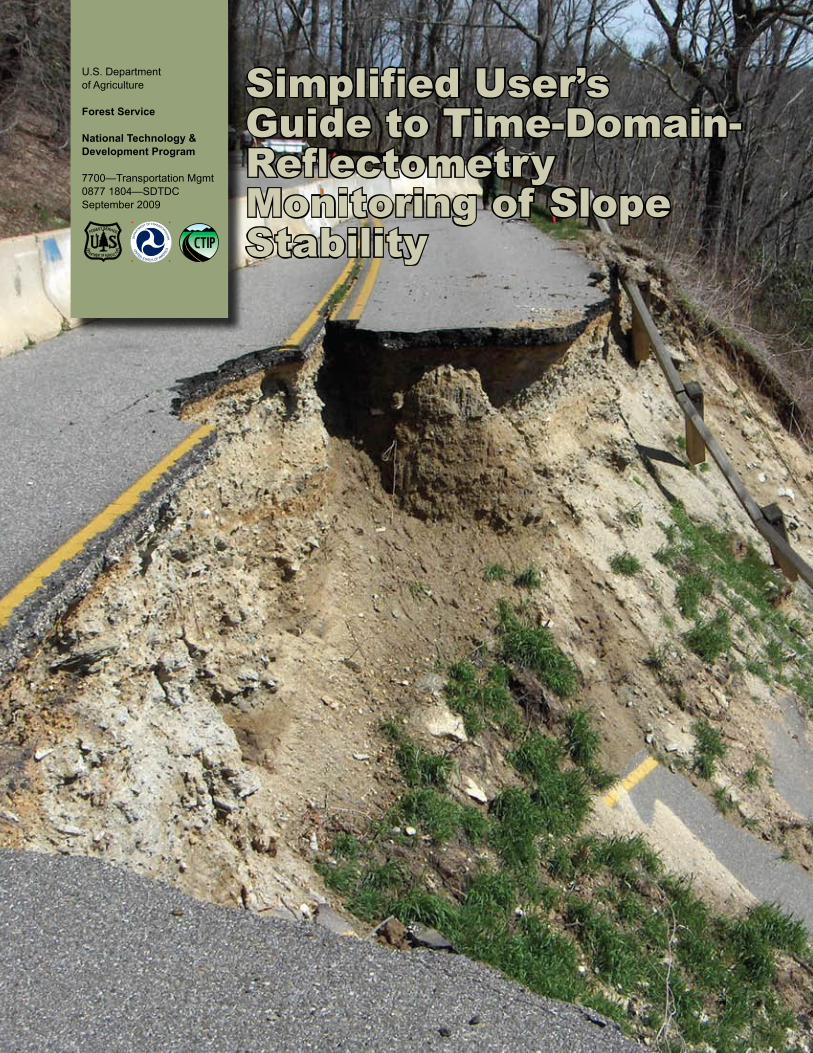
COVER PHOTO: Tom Collins, R8—Landslide along Blue Ridge Parkway on Grandfather RD, Pisgah NF, North Carolina
ACKNOWLEDGMENTS The authors would like to thank the National Technology and Development Program for funding the TDR technology and development project, and the Umpqua and Willamette National Forests for providing project testsites. We would also like to thank the Forest Service technical reviewers Pete Bolander, Bill Vischer, and Steve Romero, and the editors and publishers.
This publication is the result of a partnership between the Forest Service technology and development program and the U.S. Department of Transportation, Federal Highway Administration, Coordinated Federal Lands Highway Technology Improvement Program.
Information contained in this document has been developed for the guidance of employees of the U.S. Department of Agriculture (USDA) Forest Service, its contractors, and cooperating Federal and State agencies. The USDA Forest Service assumes no responsibility for the interpretation or use of this information by other than its own employees. The use of trade, firm, or corporation names is for the information and convenience of the reader. Such use does not constitute an official evaluation, conclusion, recommendation, endorsement, or approval of any product or service to the exclusion of others that may be suitable.
The U.S. Department of Agriculture (USDA) prohibits discrimination in all its programs and activities on the basis of race, color, national origin, age, disability, and where applicable, sex, marital status, familial status, parental status, religion, sexual orientation, genetic information, political beliefs, reprisal, or because all or part of an individual’s income is derived from any public assistance program. (Not all prohibited bases apply to all programs.) Persons with disabilities who require alternative means for communication of program information (Braille, large print, audiotape, etc.) should contact USDA’s TARGET Center at (202) 720-2600 (voice and TDD). To file a complaint of discrimination, write USDA, Director, Office of Civil Rights, 1400 Independence Avenue, S.W., Washington, D.C. 20250-9410, or call (800) 795-3272 (voice) or (202) 720-6382 (TDD). USDA is an equal opportunity provider and employer.
Simplified User’s Guide to Time-Domain-ReflectometryMonitoring of Slope Stability
Edel R. Cortez, P.E., PhD, U.S. Department of the Army, Corps of Engineers, U.S. Army Cold Regions Research and Engineering Laboratory, Hanover, New Hampshire
Gordon L. Hanek, Geotechnical Engineer, U.S. Forest Service, Pacific Northwest Region, Umpqua National Forest Mark A. Truebe, Geotechnical Engineer, U.S. Forest Service, Pacific Northwest Region, Willamette National Forest
Maureen A. Kestler, Geotechnical Engineer, U.S. Forest Service, San Dimas Technology & Development Center
INTRODUCTION Slope movement can be monitored by a number of methods and pieces of advanced equipment. However, using time domain reflectometry (TDR) is one of the least expensive methods.
This is a simplified guide for the implementation and use of a TDR cable system for monitoring the movement of known and potential landslides. For more detailed information, please refer to documents in the reference section, as well as the section on supplemental resources and appendix A. It provides a listing of practical papers on TDR technology for monitoring slope movement.
The purpose of this guide is to summarize basic information to assist field personnel in assembling and installing a TDR measurement system, as well as processing the TDR data. We (the authors) are not endorsing the specific equipment parts and manufacturers cited within the text. It is important to note that in all instances, we are simply recommending these parts or equivalent. A vendor list is included as appendix B.
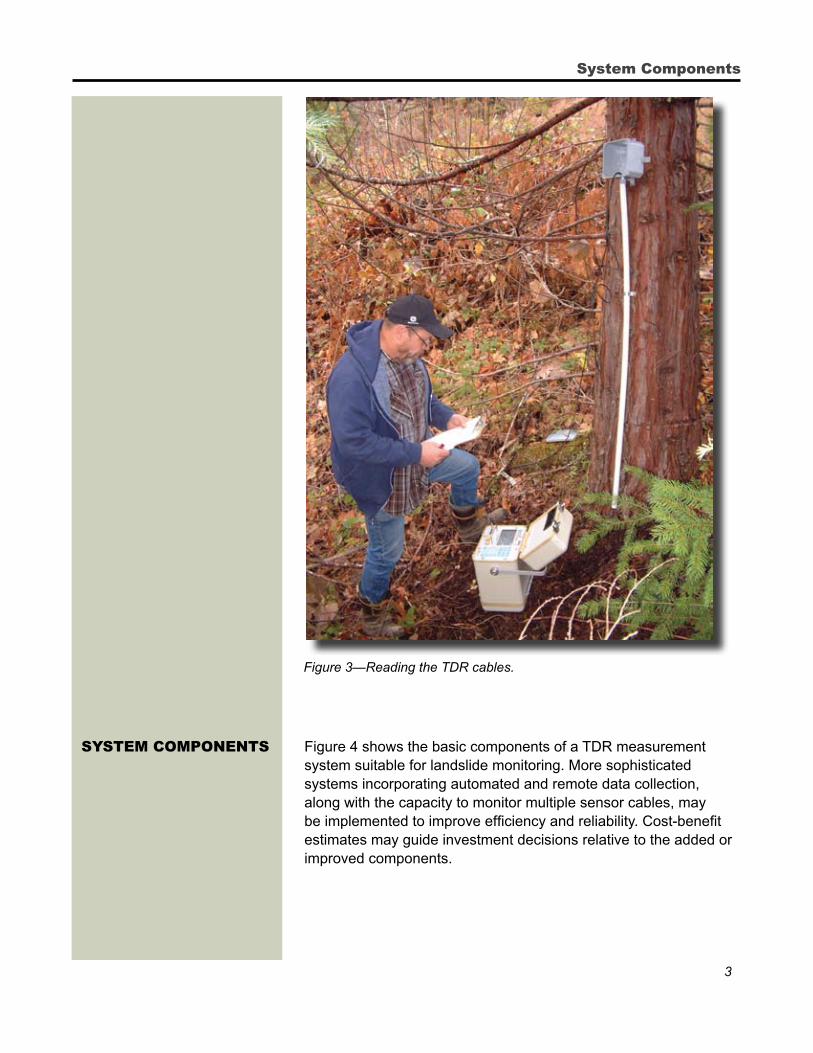
TDR FUNDAMENTALS A TDR cable system for monitoring ground deformations and movements (figure 1) consists of a coaxial cable that is embedded in a borehole in the ground (figure 2) and is connected to a special apparatus. This apparatus is called a “cable tester” because the technique originated as a method to detect discontinuities or damage in electric cables (figure 3). The discontinuities or damage that we are trying to detect in slope-stability applications are caused by movement of one portion of the soil or rock mass relative to another portion. The cable is installed such that the slide surface will intersect the TDR cable and bend it, stretch it, or shear it. The signal that we collect with the TDR cable tester will show changes compared to the signal obtained originally when the cable was undamaged, allowing us to determine the depth, progression, and general magnitude of movement.
Introduction
2
Simplified User’s Guide to Time-Domain-Reflectometry Monitoring of Slope Stability
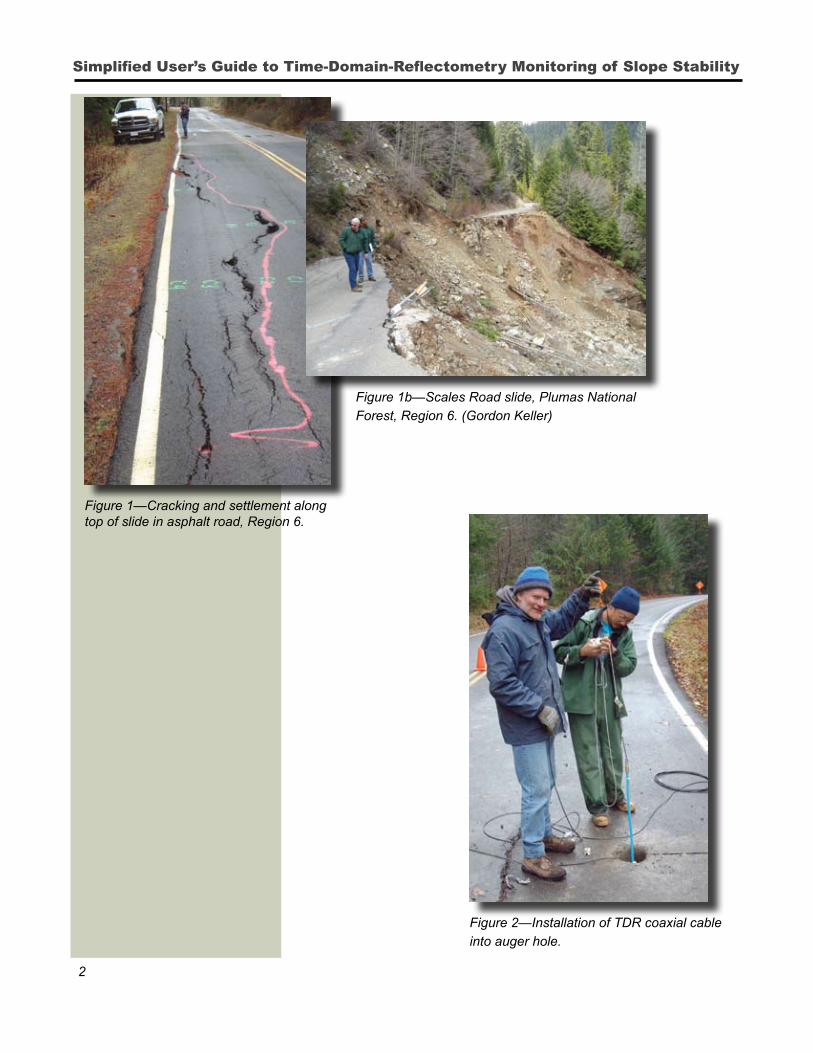
Figure 1—Cracking and settlement along top of slide in asphalt road, Region 6.
Figure 1b—Scales Road slide, Plumas National Forest, Region 6. (Gordon Keller)
Figure 2—Installation of TDR coaxial cable into auger hole.
3
SYSTEM COMPONENTS Figure 4 shows the basic components of a TDR measurement system suitable for landslide monitoring. More sophisticated systems incorporating automated and remote data collection, along with the capacity to monitor multiple sensor cables, may be implemented to improve efficiency and reliability. Cost-benefit estimates may guide investment decisions relative to the added or improved components.
Figure 2—Installation of TDR coaxial cable into auger hole.
System Components
Figure 3 —Reading the TDR cables.
4
Simplified User’s Guide to Time-Domain-Reflectometry Monitoring of Slope Stability
Figure 4—Basic TDR system components.
Cable Tester A cable tester that has been used successfully for slope stability TDR measurements is the Tektronix Metallic Time-Domain Reflectometer model 1502B. This model was first sold in 1996. Unfortunately, Tektronix discontinued this instrument and they do not produce any replacement models. This model was a step1 type of TDR, and the replacement must be similar to work well for this application.
TDR Cable Tester
Coaxial cable
Grout
Hose clamps
1-in diameter pvc pipe
Ground level
Directionoflandslidemovement
1There are two different technologies or types of operation on which TDRs are based: “step” and “pulse,” with step being the more advantageous technology to find a fault on a cable (DeWinter and Ashley). De Winter and Ashley compare pulse to AM radar, where short separate bursts of a sine wave are transmitted, and the receiver detects reflections, separated by dead zones or blind spots. Adjustments can be made to reduce this problem, but such adjustments also limit the TDR’s range. In contrast, step technology is compared to a Doppler radar, where the transmitter continuously emits energy, and the receiver simultaneously listens for returned signals, thus eliminating the dead zone drawback of pulse technology. The receiver looks at a constant signal so it can accurately detect information that pulse types cannot. Additionally, step technology enables noise to be reduced or eliminated. So overall, step TDR technology produces clearer and easier to interpret cable plots than pulse TDR units.
5
One example of a more current step TDR model of the cable tester is the 20/20B TDR® marketed by AEA Technology, Inc. (http://www.aeatechnology.com). This is a hand-held unit with a BNC (Bayonet Neill Concelman) connector suitable to connect a coaxial cable. It is sold packaged with a computer serial cable and software used to transfer the TDR signals to a computer. In August 2007, this unit was priced at $1,350. Figure 5 shows this hand-held unit.
Another suitable step option now available is a PCMCIA card that turns a notebook computer into a measuring apparatus. An electronic brochure and ordering address for an example of this system can be found at http://www.ecadusa.com/3127bro.pdf. In August 2007, the package including the card, software, a 40-foot coaxial cable, and computer connection cable cost $6,490. A related option includes a hand-held device that works the same as the PCMCIA card, but it gathers the data without a computer. This option costs $9,895. The price of this option is significantly higher than the option shown in figure 5 without appearing to offer an effective advantage over the hand-held unit. The reader also is encouraged to consult the vendor list in appendix B.
Simplified User’s Guide to Time-Domain-Reflectometry Monitoring of Slope Stability
TDR Cable An RG-58 coaxial cable (used for televisions) is the most common cable used for slope-stability TDR applications. A twist-on BNC connector connects the cable to the cable-reader apparatus. The literature also reports that the RG-59 coaxial cable has been used for TDR applications. Previous TDR slope monitoring (within the Forest Service) was done with a Belden 9913 RG-58 (manufacturer part number 9913 010100).
The RG-58 is a common cable and can be purchased from any cable supplier. A sample source for this cable is http://www.mouser.com, and the specific product can be found at http://www.mouser.com/search/refine.aspx?Msid=56610000&Mkw=Belden+9913.
In August 2007, a 100-foot spool of RG-58 cable cost $140. Buying longer spools results in a small price reduction.
Grout Grout is used to refill the borehole once a TDR cable is installed. The grout is made of type I Portland cement, bentonite, and water. Normally, bentonite is sold in 50-pound bags and Portland cement is sold in 94-pound bags. The approximate proportions by weight are: 1 pound cement, 0.45 pounds bentonite, and 2 pounds water. Table 1 shows the proportions and strengths obtained with several grout mixes that were used to refill TDR boreholes in the past. The stiffness of the grout is an important parameter: A grout that is too soft allows the cable to move and slip without registering the movement. A grout that is too strong and too stiff reinforces the soil around the TDR cable and remains less deformed than the soil mass around it. Targeting a range of 10 to 20 times the estimated unconfined compressive strength of the soil facilitates development of a discrete shear plane that produces a localized stressing of the TDR cable.
Table 1—Examples of grout proportions used in the past.
Grout Cement Bentonite Water 28-day Strength (psi)
One source for bentonite is http://www.deanbennett.com. Their bentonite products are found at http://www.deanbennett.com/bentonite-sealing-agents.htm.
In August 2007, a bag of bentonite cost $7.75 with discounts for larger orders. This, or an equivalent product, is recommended.
Accessories Coaxial cables can be strapped with common hose clamps onto a slope inclinometer casing or a 1-inch-diameter plastic pipe. The Umpqua and Willamette National Forests used the plastic-pipe method for their TDR installations (figure 6). Other installations reported in the literature consisted of only a coaxial cable embedded in grout without any other pipe or support. The plastic pipe provides a means of inserting the flexible cable into the borehole and holds the coaxial cable centered in the borehole during backfilling. In this case, we assume that the plastic pipe is weak enough to yield to a ground-mass movement.
Figure 6—Hose clamp used to secure TDR cable to fabric-wrapped PVC tubing.
Metal hose clamps also can be used to pinch the coaxial cable enough to cause a spike in the TDR signal at the clamp location. These spikes are used to help scale the TDR signals to determine the depth of any perceived ground movement.
Simplified User’s Guide to Time-Domain-Reflectometry Monitoring of Slope Stability
One source for the BNC connector at the end of a TDR cable is at http://www.cablestogo.com. This connector can be specified as an RG58 Male Twist-On Connector. In August 2007, it cost $4.49, plus shipping. Purchase hose clamps and PVC pipe at a local hardware store.
ANALYSIS PROCESS TDR data analysis can be complex and extensive, depending on the purpose of the investigation. However, for monitoring ground-mass movements related to slope stability, the analysis can be relatively simple.
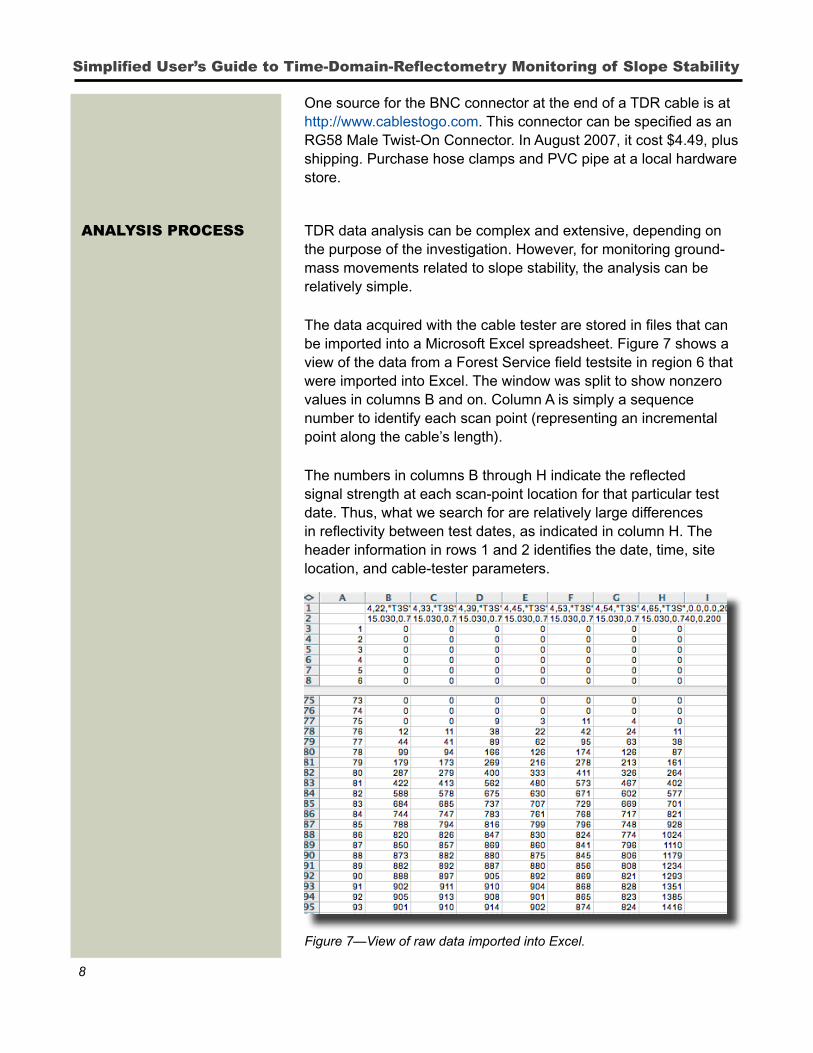
The data acquired with the cable tester are stored in files that can be imported into a Microsoft Excel spreadsheet. Figure 7 shows a view of the data from a Forest Service field testsite in region 6 that were imported into Excel. The window was split to show nonzero values in columns B and on. Column A is simply a sequence number to identify each scan point (representing an incremental point along the cable’s length).
The numbers in columns B through H indicate the reflected signal strength at each scan-point location for that particular test date. Thus, what we search for are relatively large differences in reflectivity between test dates, as indicated in column H. The header information in rows 1 and 2 identifies the date, time, site location, and cable-tester parameters.
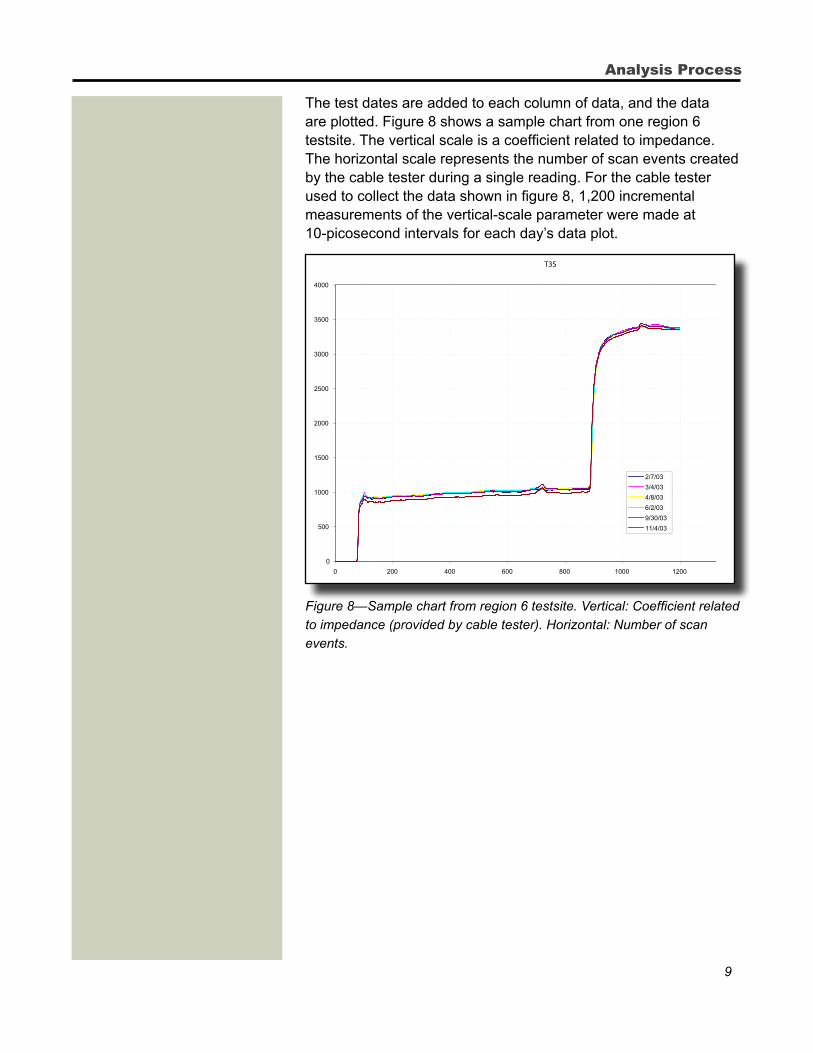
The test dates are added to each column of data, and the data are plotted. Figure 8 shows a sample chart from one region 6 testsite. The vertical scale is a coefficient related to impedance. The horizontal scale represents the number of scan events created by the cable tester during a single reading. For the cable tester used to collect the data shown in figure 8, 1,200 incremental measurements of the vertical-scale parameter were made at 10-picosecond intervals for each day’s data plot.
Figure 8—Sample chart from region 6 testsite. Vertical: Coefficient related to impedance (provided by cable tester). Horizontal: Number of scan events.
T3S
0
500
1000
1500
2000
2500
3000
3500
4000
0 200 400 600 800 1000 1200 1400
2/7/03
3/4/03
4/8/03
6/2/03
9/30/03
11/4/03
Analysis Process
10
Simplified User’s Guide to Time-Domain-Reflectometry Monitoring of Slope Stability
Figure 9 identifies the beginning and end of the cable. The beginning is where the signal becomes more or less stable. The end (or any break in the cable) is when the signal goes up dramatically.
Figure 9—Identification of the beginning and end of the cable. Vertical: Coefficient related to impedance (provided by cable tester). Horizontal: Number of scan events.
Next, plot the data at a scale that maximizes our view of the area of interest, i.e., only the cable part of the signal (beginning-to-end of cable) and at a vertical scale that spreads the curves the most while still containing them. Figure 10 shows the rescaled graph corresponding to figure 9.
T3S
0
500
1000
1500
2000
2500
3000
3500
4000
0 200 400 600 800 1000 1200 1400
2/7/03
3/4/03
4/8/03
6/2/03
9/30/03
11/4/03
Beginning of cable
End of cable
11
Figure 10—Rescaled version of figure 9. Vertical: Coefficient related to impedance (provided by cable tester). Horizontal: Number of scan events.
We are interested in the signal changes with time. In order to see these changes more clearly, we subtract the values at each point for later dates from the corresponding points on the first measurement (baseline). We then plot the differences as shown in figure 11, noting the peaks observed on the last two test dates at a horizontal scale of about 720.
Figure 11—Plot of the point-by-point differences in signal values relative to the initial measurements. Vertical: Difference in coefficient related to impedance (provided by cable tester). Horizontal: Number of scan events.
Simplified User’s Guide to Time-Domain-Reflectometry Monitoring of Slope Stability
By observing these two peaks we deduce that there was a ground movement. We want to know if it moved and stopped or if it continued moving. So, we subtract the point-by-point signals of subsequent dates from the first measurement that detected movement. Figure 12 shows this comparison for the September and November test dates. Because the variations are random and not concentrated on the same region where the peaks were found in figure 11, we conclude that the soil structure did not continue moving between these two dates.
Figure 12—Comparison of subsequent measurements to the one when movement was detected first. Vertical: Difference in coefficient related to impedance (provided by cable tester). Horizontal: Number of scan events.
Next we want to know how deep the slide plane is where the movement occurred. We use simple proportions between the number of scan points between the beginning and the end of the cable, and our previous knowledge of the cable length and the depth of the borehole. An example of the results is provided in figure 13. For this example, there are about 780 scan points (horizontal scale) between the beginning and end of the 40.4-foot-long cable. Thus, each point corresponds to a cable length of about 0.6215 inches. The observed peak occurs about 622 scan points from the beginning of the cable or 32.2 feet. So, the movement occurred 8.2 feet from the end of the cable. Because the last 11.5 feet of the cable are installed vertically in a drill hole, it can be determined that movement occurred 3.3 feet below the ground’s surface.
If the hose clamps are tightened correctly, and if accurate records are kept on the location of the clamps, the resulting small peaks can be used to more accurately scale-locate the depth where the new peaks are detected.
In summary, we are trying to detect changes in the TDR signals collected on several dates compared to a baseline signal collected on the initial survey. Cable deformations due to ground movement produce peaks, such as those shown in figure 11. The magnitude of the movement is difficult to establish, unless careful and extensive laboratory calibration was conducted prior to the cable installation, and the grout stiffness matches that of the surrounding soil. However, continued increases in the size of the peaks would indicate continued movement.
Figure 13—Example of TDR results. Vertical: Number of scan events. Horizontal: Difference in coefficient related to impedance (provided by cable tester).
Analysis Process
14
Simplified User’s Guide to Time-Domain-Reflectometry Monitoring of Slope Stability
A similar TDR method is used to detect the depth of ground water. The instrumentation is the same as that used for ground-movement monitoring, except that a section of a special coaxial cable is connected at the end of a normal coaxial cable. The special cable normally is thicker and, instead of a solid plastic material separating the center coaxial wire and the outer conductive shell, it contains a plastic spiral that allows the penetration of air and water in between the center wire and the outer conductive shell. When water penetrates this cable substituting air, the TDR signal shows a marked drop in value that suggests the depth of the water table. This special cable, Heliax® coaxial type HL4RP-50, is available from http://www.Andrew.com. In August 2007, it cost about $5 per foot. The associated connectors are types L4PNM RC and L4PNF-RC (the M stands for male; the F for female). These connectors cost about $40 each.
TDR data may be supplemented by slope-inclinometer measurements, by monitoring of surface cracks in paved areas, and by surveyed elevation measurements. To better understand the conditions at a site of interest, one should consider all the data.
SUPPLEMENTAL RESOURCES TDR technology for geotechnical purposes has been around since
the 1970s. Using it to monitor slope movement is far more recent, and advances in equipment are being made on a regular basis. The reader is encouraged to check the literature for further advances, and is strongly encouraged to seek added sources, such as those in appendix A.
Publications The reader is referred to GeoMeasurements by Pulsing TDR and Probes (O’Connor and Dowding 1999) for a comprehensive overview of TDR technology. The table of contents and chapter 1 are available online at http://www.iti.northwestern.edu/publications/dowding/book/index.html.
Appendix A lists numerous practical short papers by private consultants on using TDR for monitoring slope movement. Another practical paper by Denis et al (2006) is available at https://engineering.purdue.edu/TDR/Papers/41_Paper.pdf.
Papers from the TDR symposiums held every few years discuss TDR applications (monitoring moisture content, etc.), however, a few discuss slope monitoring. Symposium papers can be accessed at http://www.iti.northwestern.edu/tdr/tdr2001/proceedings/Final/TDR2001.pdf; and https://engineering.purdue.edu/TDR/Papers/.
Short Courses Courses are occasionally taught on automated and remote monitoring. They can be accessed at http://www.iti.northwestern.edu/tdr/tdr2001/courses.html.
TDR Listserver Finally (and a highly recommended method of learning about your particular needs and sharing lessons learned), information on signing up for an unmoderated forum for the “discussion and exchange of information regarding the use of time domain reflectometry in environmental, infrastructure and mining applications” is available at http://www.iti.northwestern.edu/tdr/listserv.html.
All of the above sites were accessed March 2008.
REFERENCES Dennis, Norman D.; Ooi, Chong Wei; Wong, Voon Huei. 2006. Estimating movement of shallow slope failures using time domain reflectometry. Paper ID 41. Proc. TDR 2006. West Lafayette, IN: Purdue University. 16 p. https://engineering.purdue.edu/TDR/Papers. (Accessed March 2008.)
Dowding, C. H.; Dussud, M. L.; Kane, W. F.; O’Connor, K. M. 2003. Geo monitoring deformation in rock and soil with TDR sensor cables. Geotechnical Instrumentation News. 21(2): 81-89.
Simplified User’s Guide to Time-Domain-Reflectometry Monitoring of Slope Stability
Kane, W. F.; Beck, T. J.; Hughes, J. J. 2001. Applications of time domain reflectometry to landslide and slope monitoring. Second International Symposium and Workshop on Time Domain Reflectometry for Innovative Geotechnical Applications. Evanston, IL: Northwestern University.
O’Connor, K.; Dowding, C. H. 1999. GeoMeasurements by pulsing TDR and probes. Washington, DC: CRC Press.
17
APPENDIX A
Practical Papers on Monitoring Slope Movement List (by date) provided by Kane GeoTech
Kane, W. F. 2000. Monitoring slope movement with time domain reflectometry (TDR) Geotechnical Field Instrumentation: Applications for Engineers and Geologists. Sponsored by: ASCE Seattle Section Geotechnical Group Spring Seminar and the University of Washington Department of Civil Engineering, Seattle, WA.
Kane W. F.; Beck, T. J. 2000. Instrumentation practice for slope monitoring. Engineering Geology Practice in Northern California, Association of Engineering Geologists, Sacramento and San Francisco Sections.
Kane, W. F.; Beck, T. J. 1999. Advances in slope stability instrumentation: integrating TDR with remote data acquisition systems. Proceedings, Fifth International Symposium on Field Measurements in Geomechanics; Singapore.
Kane, W. F.; Beck, T. J. 1999. Advances in highway slope stability instrumentation. Proceedings, 50th Highway Geology Symposium; Roanoke, VA. 328-337.
Kane, W. F. 1998. Embankment monitoring time domain reflectometry. Proceedings, 5th International Conference on Tailings and Mine Waste ’98; Fort Collins, CO. 223-230.
Kane, W. F.; Beck, T. J.; Anderson, N. O.; Perez, H. 1996. Remote monitoring of unstable slopes using time domain reflectometry. Proceedings, Eleventh Thematic Conference and Workshops on Applied Geologic Remote Sensing, ERIM, Ann Arbor, MI, II, 431-440.
Appendix A—Practical Papers
18
Simplified User’s Guide to Time-Domain-Reflectometry Monitoring of Slope Stability
Kane, W. F.; Beck, T. J. 1996. An alternative monitoring system for unstable slopes. Geotechnical News. 14(3): 24-26.
Beck, T. J.; Kane, W. F. 1996. Current and potential uses of time domain reflectometry for geotechnical monitoring. Proceedings, 47th Highway Geology Symposium, Cody, WY, Wyoming Department of Transportation, 94-103.
Anderson, N. O.; Gwinnup-Greeen, M. D.; Kane, W. F. 1996. Monitoring of embankment stability using embedded coaxial cables. Proceedings, 1996 Annual Conference, Association of State Dam Safety Officials, Seattle, WA.
Kane, W. F.; Perez, H.; Anderson, N. O. 1996. Development of a time domain reflectometry system to monitor landslides. Final Report, FHWA/CA/TL-96/09, submitted to California Department of Transportation, Sacramento, CA, Contract #65W019, 72 p. (HTML Version Available from Time Domain Reflectometry Clearinghouse)
Kane, W. F.; Beck, T. J. 1994. Development of a time domain reflectometry system to monitor landslide activity. Proceedings, 45th Highway Geology Symposium, Portland, OR, 163-173.
19
APPENDIX B
Vendors (as of January 18, 2005)Links to Web sites for many of these vendors are available at http://www.iti.northwestern.edu/tdr/vendors.html
Web sites for all companies that provided links were last accessed in March 2008. Those vendors whose sites were not accessible were removed by the authors.
Publications from the national technology and development program are available on the Internet at http://www.fs.fed.us/eng/pubs/
Forest Service and U.S. Department of the Interior, Bureau of Land Management employees also can view the national technology and development program’s videos, CDs, and individual project pages on their internal computer network at http://fsweb.sdtdc.wo.fs.fed.us/
For additional information on using TDR for landslide and slope monitoring, contact SDTDC. Phone: 909–599–1267.


![A laboratory extraction apparatus and its use in ...nvlpubs.nist.gov/nistpubs/jres/20/jresv20n1p83_A1b.pdf · Schicktanz] Laboratory E'J:traction Apparatus 85 II. APPARATUS AND EXPERIMENTAL](https://static.documents.pub/doc/80x56/5ab7b27e7f8b9a684c8bd2b9/a-laboratory-extraction-apparatus-and-its-use-in-laboratory-ejtraction-apparatus.jpg)


