68
Migratory bird hunting activity and harvest during the 201 3 -1 4 and 201 4-1 5 hunting seasons July 2015 U.S. Fish & Wildlife Service Hunter setting decoys. USFWS/Milton Friend

Migratory bird hunting activity and harvest during the 2013-14 and 2014-15 hunting seasonsJuly 2015
U.S. Fish & Wildlife Service
Hunter setting decoys. USFWS/Milton Friend

Migratory bird hunting activity and harvest during the 2013-14 and 2014-15 hunting seasons.
Suggested citation: Raftovich, R.V., S. C. Chandler, and K.A. Wilkins. 2015. Migratory bird hunting activity and harvest during the 2013-14 and 2014-15 hunting seasons. U.S. Fish and Wildlife Service, Laurel, Maryland, USA.
All Division of Migratory Bird Management reports are available on our web page at: http://www.fws.gov/birds/surveys-and-data/reports-and-publications.php

Table of Contents
Abstract ..................................................................................................................................................................... 1
Introduction ................................................................................................................................................................ 1
Design and Methods ................................................................................................................................................... 2
Survey Results ............................................................................................................................................................ 4
Acknowledgements .................................................................................................................................................... 5
References .................................................................................................................................................................. 6
Waterfowl harvest estimates Species, state, flyway ........................................................................................................................................... 7 Allocation of duck and goose harvests between Central and Pacific Flyways .................................................. 27 Special seasons................................................................................................................................................... 28 Canada harvest ................................................................................................................................................... 31 Long-term trend graphs ...................................................................................................................................... 33 Waterfowl age and sex ratios ................................................................................................................................... 35 Long-term trend graphs ...................................................................................................................................... 47 Dove and pigeon estimates ....................................................................................................................................... 51
Woodcock estimates ................................................................................................................................................. 53
Snipe, coot, gallinule, and rail estimates .................................................................................................................. 54
Species-specific rail estimates .................................................................................................................................. 60
List of Appendices Appendix A. Names and affiliations of people who coordinate the Harvest Information Program or help provide
hunter name and address data to the USFWS ......................................................................................... 61 Appendix B. Names and affiliations of waterfowl wingbee participants ................................................................ 63

List of Tables Table 1a: Preliminary estimates of waterfowl harvest and hunter activity in the Atlantic Flyway .......................... 7 Table 1b: Preliminary estimates of waterfowl harvest and hunter activity in the Mississippi Flyway ................... 13 Table 1c: Preliminary estimates of waterfowl harvest and hunter activity in the Central Flyway ......................... 18 Table 1d: Preliminary estimates of waterfowl harvest and hunter activity in the Pacific Flyway .......................... 22 Table 1e: Preliminary estimates of waterfowl harvest and hunter activity in the Alaska & the US ....................... 25 Table 2: Flyway-specific point estimates of duck and goose harvest in Colorado, Montana, New Mexico, and
Wyoming................................................................................................................................................. 27 Table 3: Preliminary estimates of sea duck harvest and hunter activity for states with special sea duck seasons
or sea duck permits ................................................................................................................................. 28 Table 4: Preliminary estimates of brant harvest and hunter activity along the Atlantic and Pacific coasts .......... 28 Table 5: Preliminary harvest estimates for special September teal/duck seasons ................................................. 29 Table 6: Preliminary estimates of the number of Canada geese harvested during the special September,
regular, and special late seasons ............................................................................................................. 30 Table 7: Waterfowl harvest estimates in Canada ................................................................................................. 31 Table 8: Preliminary weighted age ratios of mallards in state harvests ................................................................ 35 Table 9: Preliminary weighted age ratios of ducks by species and flyway ........................................................... 37 Table 10: Preliminary weighted sex ratios of mallards in state harvests ................................................................ 41 Table 11: Preliminary weighted sex ratios of ducks by species and flyway ........................................................... 43 Table 12: Preliminary weighted age ratios of geese by species and flyway ........................................................... 46 Table 13: Preliminary estimates of mourning dove harvest and hunter activity ..................................................... 51 Table 14: Preliminary estimates of white-winged dove harvest and hunter activity ............................................... 52 Table 15: Preliminary estimates of band-tailed pigeon harvest and hunter activity ............................................... 52 Table 16: Preliminary estimates of woodcock harvest and hunter activity ............................................................. 53 Table 17: Preliminary estimates of snipe harvest and hunter activity ..................................................................... 54 Table 18: Preliminary estimates of coot harvest and hunter activity ...................................................................... 56 Table 19: Preliminary estimates of gallinule harvest and hunter activity ............................................................... 58 Table 20: Preliminary estimates of rail harvest and hunter activity ........................................................................ 59 Table 21: Preliminary species-specific estimates of rail harvest ............................................................................. 60
List of Figures Figure 1: Number of ducks harvested by hunters in the United States ................................................................... 33 Figure 2: Number of geese harvested by hunters in the United States ................................................................... 34 Figure 3: Age ratios of mallards harvested in the United States ............................................................................ 47 Figure 4: Age ratios of northern pintails harvested in the United States ................................................................ 48 Figure 5: Age ratios of American black ducks and wood ducks harvested in the United States ............................ 49 Figure 6: Age ratios of lesser scaup harvested in the United States ....................................................................... 50

Abstract: National surveys of migratory bird hunters were conducted during the 2013 and 2014 hunting seasons. Hunters of the following types of migratory birds were surveyed: waterfowl (family Anatidae), doves (mourning [Zenaida macroura] and white-winged [Z. asiatica]), band-tailed pigeon (Patagioenas fasciata), American woodcock (Scolopax minor), Wilson’s snipe (Gallinago delicata), American coot (Fulica americana), gallinules (common gallinule [Gallinula galeata] and purple gallinule [Pophyrio martinica]), and rails (king rail [Rallus elegans], clapper rail [R. longirostris], Virginia rail [R. limicola], and sora [Coturnicops noveboracensis]). Over 1 million waterfowl hunters harvested 13,716,400 (±6%) ducks and 3,360,400 (±6%) geese in 2013, and over 1 million waterfowl hunters harvested 13,267,800 (±4%) ducks and 3,321,100 (±11%) geese in 2014. Mallard (Anas platyrhynchos), green-winged teal (A. crecca), gadwall (A. strepera), blue-winged/cinnamon teal (A. discors and A. cyanoptera), and wood duck (Aix sponsa) were the 5 most-harvested duck species in the U.S., and Canada goose (Branta canadensis) was the predominant goose species in the goose harvest. About 857,300 dove hunters harvested 14,529,800 (±7%) mourning doves in 2013 and 839,600 hunters harvested 13,809,500 (±6%) in 2014. Woodcock hunters numbered about 109,800 in 2013 and 90,600 in 2014, and harvested 243,100 (±15%) in 2013 and 200,100 (±18%) in 2014. About 24,700 people hunted snipe in 2013 and 21,600 in 2014, and they harvested 69,100 (±38%) and 94,900 (±55%) snipe in 2013 and 2014, respectively. Coot hunters (about 34,800 in 2013 and 38,400 in 2014) harvested 254,900 (±41%) coots in 2013 and 294,100 (±37%) in 2014. Gallinule hunters (about 6,300 in 2013 and 7,300 in 2014) harvested 21,300 (±78%) in 2013 and 5,200 (±92%) in 2014. About 6,900 rail hunters harvested 23,500 (±56%) rails in 2013 and 11,000 rail hunters harvested 18,000 (±65%) rails in 2014. __________________________________________________________________ Introduction Since the 1952-53 hunting season, the U.S. Fish and Wildlife Service (FWS) has conducted a survey of Federal Duck Stamp purchasers to estimate waterfowl hunter activity and harvest in the United States. That survey was conducted annually through the 2001-02 hunting season, after which it was replaced by a new migratory game bird harvest survey system. In 1992, the FWS and State Fish and Wildlife Agencies (States) established the Migratory Bird Harvest Information Program (HIP), which was fully operational nationwide by 1999 (Elden et al. 2002). This cooperative State-Federal program requires licensed migratory game bird hunters to register annually in each state in which they hunt. Each State is responsible for collecting the name, address, and date of birth from each migratory bird hunter, asking each of them a series of general screening questions about their his/her hunting success the previous year, and sending all of this information to the FWS. The States are also responsible for providing the migratory bird hunters with proof of compliance to carry while they are hunting. The FWS is responsible for using these data to conduct annual national migratory game bird hunter activity and harvest surveys. This report presents hunter activity and harvest estimates from the HIP surveys for the 2013-14 and 2014-15 hunting seasons. These estimates are preliminary, pending (1) final counts of the number of HIP registrants in each state each season, and (2) complete audits of all survey response data.
1

HIP Survey Design and Methods Sample Frame. The HIP sample frame consisted of people who identified themselves as potential migratory game bird hunters when they purchased State hunting licenses. The States forwarded the sample frame data to the FWS either weekly or twice a month, starting in August and continuing through the end of their migratory bird hunting seasons. People who hunted migratory birds in more than one state had to comply with the HIP requirement in each state in which they hunted. Thus, the sample frame was specific to each state. Stratification and Sample Selection. States asked each migratory bird hunter a series of short screening questions about the species they hunted and their hunting success the previous year. The list of species or species-groups involved (dependent on seasons in each state) included ducks, sea ducks, geese, brant, doves, band-tailed pigeons, woodcock, coots and/or snipe, rails and/or gallinules, and sandhill cranes (only in Alaska). The FWS used this prior-year information as a predictor of their current year hunting activity and success to assign each hunter to a success/activity stratum for each of the 10 species or species-groups based on his or her answers to the screening questions. From each State list the FWS selected stratified samples for each species or species-group, sampling the small group of active/very successful hunters at a high rate, the larger group of less successful hunters at a lower rate, and the very large group of hunters who rarely if ever hunt the species or species-group at a very low rate. The FWS conducted 5 separate harvest surveys to estimate hunter activity and harvest of: (1) waterfowl (ducks, sea ducks, geese, and brant), (2) doves and band-tailed pigeons, (3) woodcock, (4) snipe, rails, gallinules, and coots, and (5) sandhill cranes in Alaska. Survey Methodology. Contact before or early in the hunting season, and a daily hunting diary format were used in an effort to reduce memory and prestige bias, both of which result in overestimation (Atwood 1956). Hunters selected for the surveys were asked to record the date of each hunt, the state and county where they hunted, and how many birds of various species or species-groups they personally bagged that day. As a check on recording and for hunters who forgot to record their daily hunting information throughout the season, or did not receive the form until after the hunting season began, space was provided on the form to record season totals. Hunter response was voluntary. Soon after the initial batch of names and addresses was received from a State, stratified samples were selected according to predetermined sampling rates. All surveys were conducted using Dillman’s Total Design Method for mail surveys (Dillman 1978, Dillman 1991) to maximize survey response and ensure quality and timely responses. A survey packet including a cover letter and a survey form for recording daily hunting activity was sent to each selected hunter within one to two weeks after his/her name was received. The sample selection and initial mailing process continued with each subsequent batch of names and addresses (roughly twice per month), with the last initial mailing occurring on or shortly after the date the season closed in the state. Postcards were sent at the close of the season reminding sampled hunters to return their completed survey forms and thanking them for their help. About 3 weeks after this mailing, a follow-up packet with an additional form was sent to each hunter who had not yet responded. Finally, 3-4 weeks later, an additional follow-up packet was sent to the remaining non-respondents.
2

Analysis. Standard analyses for stratified samples (Cochran 1977, Steele and Torrie 1980) were used to obtain estimates of harvest and hunter activity for each state and species or species-group combination. The proportion of respondents who hunted (active hunters), their average days hunted and their average seasonal harvest were calculated and the corresponding totals estimated (active hunters, days hunted, birds bagged) at the state level. Variance estimates for these parameters were also calculated and converted to 95% confidence intervals. The number of days afield and the number of birds harvested were also estimated at the management unit and national levels, along with their corresponding 95% confidence intervals. However, the total number of active hunters (and any averages per active hunter) could not be estimated at the management unit or national levels because some people hunted migratory birds in more than one state. To get total numbers at larger geographic scales, we summed the number of active hunters in each state. This may overestimate the total number of active hunters because hunters are required to HIP register in each state in which they hunt migratory birds. Parts Collection Surveys The FWS has conducted a cooperative Waterfowl Parts Survey annually to estimate the species, age, and sex composition of the duck harvest since 1961 and the species and age composition of the goose harvest since 1962. Hunters who agreed to participate in this survey were provided with large, postage-paid “wing envelopes” and were asked to send us a wing from each duck, brant, and coot they shot and the tail feathers and primary feather tips from each goose they shot throughout the hunting season. They were also asked to report the state, county, and date of harvest for each specimen they submitted. After the waterfowl hunting seasons ended, FWS and State biologists examined the specimens to determine the species, age, and sex of the birds. Species composition estimates derived from the Waterfowl Parts Survey were combined with harvest estimates from the HIP waterfowl survey to calculate species-specific duck and goose harvest estimates. Similarly, date information provided by Waterfowl Parts Survey participants was combined with HIP survey results to estimate special September season duck and goose harvests. Estimates of the number of immatures per adult in the harvest (age ratio), and the number of males per female (sex ratio) were calculated for each species and state. Because sampling intensity varied among states, state ratios were weighted by harvest estimates from the HIP waterfowl survey to obtain flyway and U.S. ratios. The FWS has conducted a Woodcock Wing Survey annually since 1977, primarily to estimate the age and sex composition of the woodcock harvest. Age and sex ratio estimates obtained from the woodcock wings collected in 1963-2014 were reported in “American woodcock population status, 2015” (Cooper and Rau 2015). This survey was expanded in 1997 to include rail wings to determine the species composition of the rail harvest, and band-tailed pigeon wings to obtain age ratio estimates. Beginning in 2007, the FWS has performed a national Mourning Dove Parts Collection Survey to determine an index of recruitment. Selected hunters were asked to send in a wing from mourning doves harvested during the first two hunts of the season. Pooled age ratios from 2007-2014 were reported in “Mourning Dove population status, 2015” (Seamans 2015).
3

Survey Results Waterfowl Hunter Activity and Harvest (Tables 1-7, Figures 1-3). HIP waterfowl harvest survey sample sizes and response rates were 76,461 hunters and 41% for the 2013-14, and 103,485 hunters and 38% for the 2014-15 survey. Species-specific estimates for ducks and geese (Table 1A-E) are presented by flyway. We were unable to split the estimates for Colorado, Montana, New Mexico, and Wyoming into their Central and Pacific Flyway portions for this report, so we arbitrarily assigned all of Colorado, New Mexico, and Wyoming to the Central Flyway and all of Montana to the Pacific Flyway. However, the Waterfowl Parts Collection Survey enabled us to provide Flyway-specific point estimates of duck and goose harvest for those four states; those point estimates are shown in Table 2. Sea duck hunter activity and harvest were estimated separately from other ducks for states that had special sea duck seasons or regulations (Table 3). Likewise, brant hunter activity and harvest along the Atlantic and Pacific coasts was estimated separately and reported in Table 4. Sea duck and brant harvest estimates are also shown in the species-specific waterfowl estimates in Table 1, but the estimates of sea ducks and brant days afield and active hunters shown in Tables 3 and 4 are not included in the estimates duck and goose days afield, and active duck and goose hunters that are shown in Table 1. Estimates for special September duck seasons are given in Table 5, and Table 6 shows estimates of Canada goose harvest during special resident goose seasons compared to regular season harvest. Table 7 summarizes the waterfowl harvest in Canada; those data were provided by the Canadian Wildlife Service, which conducts annual surveys similar to those conducted in the U.S. Long-term trends duck harvest, and goose harvest since 1961 are shown in Figures 1-2. The curves are locally weighted regression (lowess) lines (Cleveland and Devlin 1988) that fit a pattern to the majority of the estimates and identify points that deviate from that pattern. These figures show one lowess line and point estimates for the Federal Duck Stamp-based survey’s estimates from 1961-2001 and a separate lowess line and point estimates for the HIP survey estimates for 1999-present. Waterfowl Age and Sex Ratios (Tables 8-12, Figures 3-6). The 2013-14 Waterfowl Parts Survey collected 74,693 duck wings and 16,422 goose tails and primary tips from 4,196 hunters; the 2014-15 sample consisted of 83,028 duck wings and 15,996 goose tails and primary wing tips from 4,341 hunters. State-specific mallard age ratios and flyway-level age ratios for other ducks species are reported in Tables 8 and 9, respectively, followed by state-specific mallard sex ratios (Table 10) and flyway-level sex ratios for other duck species (Table 11). Table 12 gives age ratios for geese. Figures 3-6 show the long-term trends in age ratios of mallards (Figure 3), northern pintails (Figure 4), American black ducks and wood ducks (Figure 5) and lesser scaup (Figure 6). Dove and Band-tailed Pigeon Hunter Activity and Harvest (Tables 13-15). The dove and band-tailed pigeon estimates were based on samples of 46,999 hunters in 2013-14 (46% response rate) and 51,682 hunters in 2014-15 (45% response rate). Estimated numbers of active hunters, days
4

afield, harvest and birds harvested per hunter are given in Table 13 for mourning doves, Table 14 for white-winged doves and Table 15 for band-tailed pigeons. Woodcock Hunter Activity and Harvest (Table 16). Results of the HIP woodcock harvest survey are presented in Table 16. The 2013-14 survey had a sample size of 17,357 hunters and a 51% response rate; the 2014-15 survey sample size and response rate were 19,120 hunters and 49%. Snipe, Coot, Gallinule, and Rail Hunter Activity and Harvest (Tables 17-21). The sample for the 2013-14 snipe, coot, gallinule, and rail harvest survey was 33,221 hunters (43% response rate) and 33,161 hunters (46% response rate) for the 2014-15 survey. Tables 17-20 give the estimates for Wilson’s snipe (Table 17), American coot (Table 18), gallinules (Table 19; all species combined) and rails (Table 20; all species combined). We believe that the number of rail wings collected each year is too small to provide reliable annual species composition estimates, even at the flyway and national levels. Therefore, we used 5-year running averages to obtain species-specific rail harvest estimates (Table 21). The 2013-14 estimates are based on the species composition of 2,478 rail wings collected from 135 hunters collected during 2009-2013, and the 2014-15 estimates are based on 2,459 rail wings collected from 122 hunters collected during 2010-2014. Alaska Sandhill Crane Hunter Activity and Harvest Estimates. The estimates presented below were derived from surveys of 833 (2013-14, 56% response rate) and 637 (2014-15, 58% response rate) Alaska migratory bird hunters. For Alaska’s 2013 season, we estimated that 1,000 active sandhill crane hunters spent 4,100 days hunting cranes and harvested 1,400 birds. In 2014, an estimated 1,100 active hunters spent 5,300 days hunting cranes and harvested 1,400 birds. Mid-continent sandhill crane hunting activity and harvest in the Central Flyway states are estimated in a separate annual survey. Results of that survey for the 2013 and 2014 seasons were reported in, “Status and harvests of sandhill cranes: Mid-continent, Rocky Mountain, Lower Colorado River Valley and Eastern populations” (Kruse and Dubovsky 2015). Acknowledgments The Branch of Harvest Surveys’ survey clerks (Tommy Ceaser II, Ellen Griffin-Pollard, Lamar Heckstall and Pamela Mathias), biological technicians (Brent West, Lyle Hancock, and Chris Cain), IT staff (Howard Spriggs and Sheri Williams) and secretary (Susane Finucane) were major contributors to this project. The HIP and Waterfowl Parts surveys could not be conducted without the close cooperation of participating States. We appreciate the efforts of all State personnel who were involved with the HIP at various levels, as well as all who helped with the Waterfowl Parts Surveys at one of the 4 “wingbees”. The names and affiliations of the people who were primarily responsible for coordinating the HIP program in each state are included in Appendix A. The names and affiliations of wingbee particpants are in Appendix B. We also would like to acknowledge
5
Victor Elam at the Flint Hills NWR for providing support for the Central Flyway wingbee and Debbie Anderson at the Coleman National Fish Hatchery for providing support for the Pacific Flyway wingbee. REFERENCES Atwood, E. L. 1956. Validity of mail survey data on bagged waterfowl. Journal of Wildlife
Management 20: 1-16. Cleveland, W. S., and S. J. Devlin. 1988. Locally weighted regression: an approach to
regression analysis by local fitting. Journal of the American Statistical Association 83: 596-610.
Cochran, W. G. 1977. Sampling Techniques. Wiley, New York. Cooper, T. R., and R.D. Rau. 2015. American woodcock population status, 2015. U.S. Fish and
Wildlife Service, Laurel, Maryland. 16 pp. Dillman, D. A. 1978. Mail and telephone surveys: the Total Design Method. Wiley & Sons,
New York, USA. Dillman, D. A. 1991. The design and administration of mail surveys. Annual Review of
Sociology 17: 225-249. Elden R.C., W.V. Bevill, P.I. Padding, J.E. Frampton, and D.L. Shroufe. 2002. Pages 7-16 in
J.M. Ver Steeg and R.C. Elden, compilers. Harvest Information Program: Evaluation and Recommendations. International Association of Fish and Wildlife Agencies, Migratory Shore and Upland Game Bird Working Group, Ad Hoc Committee on HIP, Washington, D.C.
Kruse, K.L., and J.A Dubovsky. 2015. Status and harvests of sandhill cranes: Mid-continent,
Rocky Mountain, Lower Colorado River Valley Populations and Eastern Populations. Administrative Report, U.S. Fish and Wildlife Service, Lakewood, Colorado. 14 pp.
Seamans, M. E. 2015. Mourning dove population status, 2015. U.S. Department of the Interior,
Fish and Wildlife Service, Division of Migratory Bird Management, Washington, D.C. Steele, R.G., and J.H. Torrie. 1980. Principles and procedures of statistics: a biometrical
approach. McGraw-Hill Book Company, New York, New York. 633 pp.
6

Table 1A. Preliminary estimates of waterfowl harvest and hunter activity in the Atlantic Flyway during the 2013 and 2014 hunting seasons.Connecticut Delaware Florida
Duck Species Composition 2013 2014 2013 2014 2013 2014Mallard 6,754 5,316 10,840 11,990 1,164 464Domestic Mallard 71 41 0 88 129 116Black Duck 1,884 1,785 4,635 3,763 0 116Mallard x Black Hybrid 249 81 374 88 259 0Mottled Duck 0 0 0 0 9,050 6,378Gadwall 355 122 2,916 2,451 646 3,479Wigeon 249 41 748 263 4,137 3,595Green-winged Teal 747 365 8,822 4,026 9,179 7,074Blue-winged/Cinnamon Teal 36 0 299 0 50,422 39,083Northern Shoveler 36 0 1,719 2,188 6,981 11,597Northern Pintail 107 81 748 875 517 2,551Wood Duck 2,204 1,380 4,411 4,814 5,042 13,221Redhead 0 0 449 0 11,765 7,654Canvasback 36 0 224 0 776 1,044Greater Scaup 498 446 374 350 1,034 232Lesser Scaup 142 41 598 88 8,145 18,208Ring-necked Duck 142 0 374 263 83,002 64,945Goldeneyes 71 41 0 0 129 232Bufflehead 249 243 1,869 0 2,456 2,088Ruddy Duck 249 0 75 0 4,913 4,639Long-tailed Duck 4,521 2,751 0 0 0 0Eiders 0 0 0 0 0 0Scoters 36 196 0 672 1,551 0Hooded Merganser 284 284 1,794 525 776 232Other Mergansers 284 284 75 0 388 116Other Ducks 0 0 0 0 10,214 4,755
Total Duck Harvest 19,200±41% 13,500±24% 41,300±12% 32,400±10% 212,700±28% 191,800±17%
Total Active Duck Huntersa 1,600±25% 1,400±24% 3,500±5% 3,100±5% 14,400±21% 13,600±18%
Total Duck Hunter Days Afielda 11,600±42% 9,100±24% 23,400±9% 21,500±9% 93,100±29% 75,200±15%
Seasonal Duck Harvest Per Huntera 9.3±48% 7.7±34% 11.7±13% 10.4±12% 14.8±35% 14.1±25%
Goose Species CompositionCanada Goose 8,648 11,439 17,894 17,807 1,695 5,743Snow Goose 0 0 8,947 1,242 0 0Blue Goose 0 0 286 0 0 0Ross' Goose 0 53 0 0 0 0White-fronted Goose 0 0 0 0 0 0Brant 0 248 239 12 0 0Other Geese 0 0 0 0 0 0
Total Goose Harvest 8,600±39% 11,700±56% 27,400±13% 19,100±16% 1,700±158% 5,700±77%
Total Active Goose Huntersb 1,600±26% 1,400±25% 3,500±6% 2,900±6% 900±87% 1,800±47%
Total Goose Hunter Days Afieldb 8,200±38% 8,500±32% 22,300±10% 18,500±10% 1,700±94% 6,400±60%
Seasonal Goose Harvest Per Hunterb 5.5±47% 8.3±62% 7.7±14% 6.5±17% 1.8±180% 6.5±17%
Active Waterfowl Huntersc 2,300±21% 2,100±18% 4,500±5% 3,800±5% 14,400±21% 13,600±18%
Sample SizesDuckWings 426 275 553 364 1,645 1,654GooseTails 315 222 286 139 1 1
7

Table 1A. Preliminary estimates of waterfowl harvest and hunter activity in the Atlantic Flyway during the 2013 and 2014 hunting seasons.Georgia Maine Maryland
Duck Species Composition 2013 2014 2013 2014 2013 2014Mallard 14,116 6,907 10,221 9,150 35,093 30,618Domestic Mallard 291 0 67 0 792 657Black Duck 146 0 3,474 2,288 9,499 4,597Mallard x Black Hybrid 146 0 267 0 792 493Mottled Duck 291 294 0 0 0 0Gadwall 9,459 4,115 134 127 7,652 8,127Wigeon 582 294 200 127 2,507 1,970Green-winged Teal 9,459 11,022 4,609 1,525 6,596 5,418Blue-winged/Cinnamon Teal 9,605 6,172 1,202 508 396 164Northern Shoveler 291 1,176 0 0 2,639 1,313Northern Pintail 437 441 267 381 1,187 2,463Wood Duck 60,247 72,596 6,547 3,241 14,776 12,477Redhead 2,619 1,910 0 0 132 903Canvasback 728 1,470 0 0 4,617 1,149Greater Scaup 0 147 67 0 5,673 493Lesser Scaup 582 1,910 67 64 8,311 1,231Ring-necked Duck 8,149 12,491 1,202 635 923 903Goldeneyes 0 0 668 508 132 246Bufflehead 873 588 601 445 13,984 6,649Ruddy Duck 437 2,792 0 0 792 493Long-tailed Duck 0 0 215 134 1,244 3,227Eiders 0 0 3,115 1,006 0 0Scoters 0 0 1,718 939 12,857 10,491Hooded Merganser 3,638 3,380 1,069 254 2,243 985Other Mergansers 0 147 267 254 923 739Other Ducks 0 0 0 0 0 0
Total Duck Harvest 122,100±33% 127,900±15% 36,000±31% 21,600±24% 133,800±15% 95,800±14%
Total Active Duck Huntersa 17,800±32% 16,300±16% 4,400±16% 4,100±17% 15,400±10% 13,200±9%
Total Duck Hunter Days Afielda 95,200±34% 84,800±15% 28,900±31% 18,100±18% 75,100±15% 58,000±11%
Seasonal Duck Harvest Per Huntera 6.9±46% 7.9±22% 7.0±35% 4.8±29% 7.8±18% 6.2±17%
Goose Species CompositionCanada Goose 32,157 51,768 8,759 8,943 152,535 113,968Snow Goose 0 404 43 0 10,176 5,909Blue Goose 0 0 0 0 217 94Ross' Goose 0 0 0 0 0 0White-fronted Goose 0 0 0 0 0 94Brant 0 0 0 0 116 0Other Geese 0 0 0 0 0 0
Total Goose Harvest 32,200±83% 52,200±26% 8,800±41% 8,900±32% 163,000±14% 120,100±11%
Total Active Goose Huntersb 8,300±51% 15,300±17% 3,000±21% 3,200±19% 21,800±8% 19,800±7%
Total Goose Hunter Days Afieldb 28,000±59% 72,100±26% 14,000±50% 12,300±27% 130,000±13% 99,800±9%
Seasonal Goose Harvest Per Hunterb 3.9±97% 3.4±31% 2.9±46% 2.8±37% 7.5±16% 6.1±13%
Active Waterfowl Huntersc 18,000±32% 16,500±15% 5,500±15% 5,100±15% 28,900±6% 25,600±6%
Sample SizesDuckWings 839 870 510 338 941 1,086GooseTails 163 129 205 150 1,506 1,281
8

Table 1A. Preliminary estimates of waterfowl harvest and hunter activity in the Atlantic Flyway during the 2013 and 2014 hunting seasons.Massachusetts New Hampshire New Jersey
Duck Species Composition 2013 2014 2013 2014 2013 2014Mallard 4,994 5,501 5,780 3,860 15,480 10,037Domestic Mallard 0 0 75 0 78 109Black Duck 2,669 2,523 2,177 744 12,196 8,019Mallard x Black Hybrid 132 0 150 47 1,407 109Mottled Duck 0 0 0 0 0 0Gadwall 106 41 0 0 2,971 4,255Wigeon 159 41 0 0 625 1,091Green-winged Teal 476 703 1,126 698 5,863 4,310Blue-winged/Cinnamon Teal 53 0 150 0 235 109Northern Shoveler 0 0 0 0 469 218Northern Pintail 26 124 75 0 469 1,200Wood Duck 2,563 2,358 6,681 5,674 5,942 4,746Redhead 0 83 0 0 0 0Canvasback 0 0 0 0 0 0Greater Scaup 159 124 0 0 938 709Lesser Scaup 79 124 75 0 1,329 491Ring-necked Duck 26 124 75 0 391 55Goldeneyes 106 165 75 93 0 273Bufflehead 1,004 2,151 375 326 15,870 10,365Ruddy Duck 26 0 0 0 313 382Long-tailed Duck 175 525 200 0 1,988 711Eiders 3,543 3,570 200 1,474 0 237Scoters 131 1,260 1,333 0 3,267 3,318Hooded Merganser 370 662 450 372 1,564 1,255Other Mergansers 555 827 75 47 1,564 546Other Ducks 0 0 0 0 0 0
Total Duck Harvest 17,400±20% 20,900±26% 19,100±23% 13,300±25% 73,000±18% 52,500±27%
Total Active Duck Huntersa 3,300±20% 2,200±24% 3,000±19% 2,100±17% 7,400±11% 5,600±15%
Total Duck Hunter Days Afielda 18,200±27% 12,300±20% 21,700±41% 12,300±26% 48,800±15% 35,000±24%
Seasonal Duck Harvest Per Huntera 4.1±28% 7.0±36% 5.8±29% 5.6±30% 9.2±21% 8.6±31%
Goose Species CompositionCanada Goose 7,107 7,504 6,022 5,829 51,666 29,703Snow Goose 15 0 0 0 1,265 1,763Blue Goose 0 0 0 0 0 0Ross' Goose 0 0 0 0 0 0White-fronted Goose 0 0 0 0 0 0Brant 131 533 0 21 4,611 1,545Other Geese 0 0 70 0 0 0
Total Goose Harvest 7,300±28% 8,000±42% 6,100±27% 5,900±26% 57,500±35% 33,000±36%
Total Active Goose Huntersb 2,400±22% 1,900±27% 2,100±22% 1,600±20% 6,500±12% 4,000±19%
Total Goose Hunter Days Afieldb 10,200±29% 9,900±34% 11,500±23% 9,500±23% 35,000±20% 16,800±24%
Seasonal Goose Harvest Per Hunterb 3.0±36% 3.9±49% 2.8±35% 3.5±32% 8.2±37% 7.9±40%
Active Waterfowl Huntersc 4,400±16% 3,400±21% 3,600±18% 2,500±17% 10,200±9% 6,800±12%
Sample SizesDuckWings 599 478 257 256 903 903GooseTails 486 211 88 92 332 254
9

Table 1A. Preliminary estimates of waterfowl harvest and hunter activity in the Atlantic Flyway during the 2013 and 2014 hunting seasons.New York North Carolina Pennsylvania
Duck Species Composition 2013 2014 2013 2014 2013 2014Mallard 91,543 78,181 24,439 34,163 38,476 28,741Domestic Mallard 440 205 0 985 297 363Black Duck 18,203 16,271 2,125 3,778 6,842 3,992Mallard x Black Hybrid 1,407 819 213 328 892 145Mottled Duck 0 0 0 0 0 0Gadwall 4,397 2,558 20,401 30,057 3,570 1,379Wigeon 5,364 3,991 16,151 22,830 397 363Green-winged Teal 10,728 10,131 22,101 39,255 5,851 2,540Blue-winged/Cinnamon Teal 1,671 2,354 5,738 7,063 397 435Northern Shoveler 1,231 1,126 6,588 14,125 0 363Northern Pintail 4,485 3,070 8,500 4,435 99 435Wood Duck 22,600 20,364 77,354 117,436 22,511 19,015Redhead 6,947 3,786 10,413 8,541 397 871Canvasback 176 307 2,338 328 99 0Greater Scaup 5,364 2,047 2,338 1,642 3,173 944Lesser Scaup 3,605 1,740 28,689 21,516 1,983 1,669Ring-necked Duck 2,990 2,558 14,663 16,260 793 2,032Goldeneyes 8,178 3,479 0 493 1,190 290Bufflehead 10,025 10,540 11,688 17,903 3,570 5,371Ruddy Duck 352 102 3,188 6,077 496 581Long-tailed Duck 6,753 3,487 213 0 99 218Eiders 357 6,539 0 0 0 0Scoters 9,274 2,123 5,738 1,971 297 73Hooded Merganser 2,286 3,479 15,088 9,526 2,677 2,105Other Mergansers 4,221 3,684 1,700 328 3,471 871Other Ducks 0 0 0 0 99 0
Total Duck Harvest 222,600±20% 182,900±13% 279,700±17% 359,000±15% 97,700±22% 72,800±27%
Total Active Duck Huntersa 20,500±10% 20,700±9% 26,400±17% 33,700±17% 20,200±21% 17,300±20%
Total Duck Hunter Days Afielda 117,400±13% 120,900±14% 165,000±17% 191,100±16% 98,500±22% 71,700±21%
Seasonal Duck Harvest Per Huntera 10.2±22% 8.3±15% 10.6±24% 10.7±22% 4.8±30% 4.2±34%
Goose Species CompositionCanada Goose 136,230 138,297 55,906 37,267 103,934 106,885Snow Goose 3,525 1,835 0 5,575 5,103 2,287Blue Goose 476 0 0 587 249 0Ross' Goose 0 0 0 0 0 0White-fronted Goose 0 0 0 0 124 0Brant 4,474 3,194 874 1,300 0 0Other Geese 0 432 0 0 0 0
Total Goose Harvest 144,700±21% 143,800±14% 56,800±44% 44,700±38% 109,400±26% 109,200±34%
Total Active Goose Huntersb 17,400±10% 17,000±8% 14,000±27% 16,000±24% 21,800±17% 20,900±17%
Total Goose Hunter Days Afieldb 101,300±16% 89,800±11% 56,600±36% 50,600±27% 114,200±20% 102,300±26%
Seasonal Goose Harvest Per Hunterb 8.1±23% 8.3±16% 4.0±52% 2.7±45% 5.0±31% 5.2±38%
Active Waterfowl Huntersc 26,200±8% 25,700±7% 27,700±17% 34,800±16% 36,000±16% 26,900±17%
Sample SizesDuckWings 2,415 1,742 1,316 2,186 985 1,003GooseTails 1,524 1,360 63 150 879 716
10

Table 1A. Preliminary estimates of waterfowl harvest and hunter activity in the Atlantic Flyway during the 2013 and 2014 hunting seasons.Rhode Island South Carolina Vermont
Duck Species Composition 2013 2014 2013 2014 2013 2014Mallard 1,477 517 18,052 18,107 12,659 8,268Domestic Mallard 0 0 792 179 0 0Black Duck 1,403 455 792 717 2,640 1,108Mallard x Black Hybrid 49 9 0 179 60 128Mottled Duck 0 0 792 896 0 0Gadwall 443 214 9,659 16,135 120 0Wigeon 246 116 1,584 1,972 60 43Green-winged Teal 98 18 14,885 20,975 4,200 1,492Blue-winged/Cinnamon Teal 0 0 3,484 5,378 720 43Northern Shoveler 0 9 6,334 6,633 60 0Northern Pintail 25 9 2,534 896 60 170Wood Duck 320 89 72,050 98,961 5,040 3,452Redhead 0 0 950 1,613 0 0Canvasback 0 0 158 538 0 0Greater Scaup 1,256 357 317 179 240 85Lesser Scaup 369 53 3,800 5,558 660 426Ring-necked Duck 49 0 17,102 12,370 720 213Goldeneyes 468 205 0 0 3,240 1,534Bufflehead 960 695 1,108 2,689 360 128Ruddy Duck 0 0 2,217 1,255 0 0Long-tailed Duck 20 0 0 0 0 0Eiders 563 646 0 0 0 0Scoters 261 174 0 0 300 0Hooded Merganser 542 241 4,276 5,199 360 341Other Mergansers 1,059 374 158 0 420 384Other Ducks 0 0 317 179 0 0
Total Duck Harvest 9,600±42% 4,200±30% 161,400±42% 200,600±20% 31,900±22% 17,800±20%
Total Active Duck Huntersa 900±14% 400±19% 16,700±22% 20,200±17% 4,000±16% 2,600±16%
Total Duck Hunter Days Afielda 6,600±23% 2,700±20% 121,400±41% 116,000±19% 22,400±22% 13,200±15%
Seasonal Duck Harvest Per Huntera 9.5±44% 8.2±36% 9.6±47% 9.9±27% 8.0±27% 6.8±25%
Goose Species CompositionCanada Goose 4,715 5,512 17,170 35,812 9,591 12,322Snow Goose 45 0 0 0 0 46Blue Goose 0 0 0 796 0 0Ross' Goose 0 0 0 0 0 0White-fronted Goose 0 0 0 0 0 0Brant 224 84 0 0 40 0Other Geese 0 0 0 0 0 0
Total Goose Harvest 5,000±55% 5,600±60% 17,200±60% 36,600±45% 9,600±31% 12,400±43%
Total Active Goose Huntersb 800±18% 400±20% 5,500±38% 11,000±23% 2,600±19% 2,000±18%
Total Goose Hunter Days Afieldb 4,900±23% 3,900±40% 38,700±79% 42,500±36% 12,500±27% 9,500±24%
Seasonal Goose Harvest Per Hunterb 6.2±58% 12.4±63% 3.1±71% 3.3±51% 3.7±36% 6.2±47%
Active Waterfowl Huntersc 1,100±12% 700±15% 17,100±22% 20,600±17% 4,600±15% 3,000±14%
Sample SizesDuckWings 398 462 1,019 1,119 532 418GooseTails 124 286 50 46 240 270
11

Table 1A. Preliminary estimates of waterfowl harvest and hunter activity in the Atlantic Flyway during the 2013 and 2014 hunting seasons.Virginia West Virginia Flyway Total
Duck Species Composition 2013 2014 2013 2014 2013 2014Mallard 33,191 41,274 3,750 968 328,029 294,063Domestic Mallard 108 216 68 0 3,208 2,958Black Duck 5,946 6,267 473 89 75,104 56,511Mallard x Black Hybrid 432 324 135 13 6,964 2,762Mottled Duck 0 0 0 0 10,133 7,569Gadwall 16,974 16,747 304 229 80,107 90,036Wigeon 1,946 2,269 68 89 35,022 39,094Green-winged Teal 8,000 5,726 372 25 113,113 115,303Blue-winged/Cinnamon Teal 1,189 1,297 68 13 75,663 62,618Northern Shoveler 1,514 756 0 0 27,862 39,505Northern Pintail 1,730 540 101 13 21,367 17,685Wood Duck 17,190 23,878 946 255 326,423 403,956Redhead 2,162 1,945 68 13 35,902 27,319Canvasback 3,892 756 68 38 13,111 5,630Greater Scaup 1,730 1,945 68 0 23,227 9,700Lesser Scaup 1,946 1,945 34 13 60,416 55,076Ring-necked Duck 12,865 4,970 34 13 143,503 117,832Goldeneyes 432 324 0 0 14,689 7,884Bufflehead 19,893 18,260 68 13 84,955 78,452Ruddy Duck 1,297 1,080 0 0 14,353 17,401Long-tailed Duck 874 0 0 0 16,302 11,053Eiders 0 0 0 0 7,778 13,473Scoters 2,184 9,258 0 0 38,947 30,475Hooded Merganser 3,892 1,513 101 25 41,411 30,378Other Mergansers 649 972 101 0 15,910 9,573Other Ducks 0 108 0 0 10,630 5,042
Total Duck Harvest 140,000±20% 142,400±17% 6,800±55% 1,800±78% 1,624,100±8% 1,551,300±6%
Total Active Duck Huntersa 14,400±18% 16,900±14% 800±28% 200±45% 174,700 173,600
Total Duck Hunter Days Afielda 83,800±20% 80,800±14% 5,200±49% 1,400±51% 1,036,100±8% 924,200±5%
Seasonal Duck Harvest Per Huntera 9.5±27% 7.9±22% 8.1±62% 8.0±90%
Goose Species CompositionCanada Goose 57,812 45,271 4,885 2,450 676,726 636,520Snow Goose 136 1,017 0 0 29,255 20,080Blue Goose 0 127 0 0 1,227 1,604Ross' Goose 0 0 0 0 0 53White-fronted Goose 0 0 0 0 124 94Brant 1,214 338 0 0 11,922 7,276Other Geese 0 0 0 0 70 432
Total Goose Harvest 59,200±24% 46,800±20% 4,900±52% 2,400±97% 719,300±9% 666,100±8%
Total Active Goose Huntersb 13,500±17% 12,200±16% 800±29% 300±45% 126,500 131,700
Total Goose Hunter Days Afieldb 58,900±21% 57,900±26% 3,700±41% 1,700±55% 651,700±8% 611,900±7%
Seasonal Goose Harvest Per Hunterb 4.3±29% 3.8±25% 6.1±59% 8.1±107%
Active Waterfowl Huntersc 19,700±15% 21,400±12% 900±27% 300±43% 224,900 212,700
Sample SizesDuckWings 1,295 1,264 202 142 14,835 14,560GooseTails 428 366 161 156 6,851 5,829
12

Table 1B. Preliminary estimates of waterfowl harvest and hunter activity in the Mississippi Flyway during the 2013 and 2014 hunting seasons.Alabama Arkansas Illinois
Duck Species Composition 2013 2014 2013 2014 2013 2014Mallard 22,040 8,545 422,951 530,131 177,474 192,265Domestic Mallard 212 0 260 0 0 0Black Duck 212 0 260 0 476 1,165Mallard x Black Hybrid 0 0 0 0 952 874Mottled Duck 0 0 0 335 0 0Gadwall 44,292 36,486 184,343 199,512 37,588 36,414Wigeon 2,755 1,899 12,463 13,748 4,758 3,787Green-winged Teal 13,139 8,952 123,328 226,001 32,830 41,658Blue-winged/Cinnamon Teal 15,470 9,630 4,673 25,819 17,129 25,927Northern Shoveler 4,238 2,035 70,881 84,499 23,790 15,731Northern Pintail 1,060 0 31,157 29,843 8,564 8,448Wood Duck 62,942 23,465 50,889 65,051 58,999 38,453Redhead 5,722 2,170 5,452 4,694 2,855 6,991Canvasback 5,934 3,120 3,895 1,341 4,282 4,078Greater Scaup 212 678 1,039 335 476 291Lesser Scaup 1,695 2,848 1,558 8,048 3,331 6,700Ring-necked Duck 9,749 9,088 13,242 30,849 11,419 12,526Goldeneyes 636 0 0 0 2,379 6,409Bufflehead 2,119 1,899 1,298 1,341 3,806 3,204Ruddy Duck 212 543 0 4,694 0 874Long-tailed Duck 0 0 260 0 0 0Eiders 0 0 0 0 0 0Scoters 212 136 260 0 0 583Hooded Merganser 2,331 2,170 5,193 4,359 3,806 1,748Other Mergansers 0 0 0 0 1,903 1,748Other Ducks 0 0 260 671 0 0
Total Duck Harvest 195,200±25% 113,700±25% 933,700±17% 1,231,300±14% 396,800±18% 409,900±23%
Total Active Duck Huntersa 17,000±19% 11,400±22% 44,900±11% 58,800±9% 28,500±12% 29,700±11%
Total Duck Hunter Days Afielda 98,900±32% 64,300±26% 305,200±15% 429,100±13% 248,600±17% 264,200±16%
Seasonal Duck Harvest Per Huntera 11.5±31% 10.0±34% 20.8±20% 20.9±16% 13.9±22% 13.8±26%
Goose Species CompositionCanada Goose 30,927 26,640 13,552 9,055 111,185 105,998Snow Goose 0 0 63,243 21,991 950 4,920Blue Goose 0 0 31,621 25,872 475 1,789Ross' Goose 0 0 3,614 7,762 0 0White-fronted Goose 0 0 72,278 71,149 5,227 8,050Brant 0 0 0 0 0 0Other Geese 0 0 0 0 0 0
Total Goose Harvest 30,900±96% 26,600±148% 184,300±54% 135,800±40% 117,800±23% 120,800±28%
Total Active Goose Huntersb 6,000±34% 3,500±44% 14,100±20% 18,900±12% 23,100±15% 22,200±13%
Total Goose Hunter Days Afieldb 30,100±54% 16,600±74% 73,100±26% 101,300±20% 173,100±21% 168,700±17%
Seasonal Goose Harvest Per Hunterb 5.1±102% 7.5±155% 13.1±58% 7.2±42% 5.1±27% 5.4±31%
Active Waterfowl Huntersc 17,300±19% 11,400±22% 45,700±11% 59,400±8% 34,100±11% 35,000±10%
Sample SizesDuckWings 921 838 3,596 3,672 834 1,407GooseTails 21 9 204 105 248 270
13

Table 1B. Preliminary estimates of waterfowl harvest and hunter activity in the Mississippi Flyway during the 2013 and 2014 hunting seasons.Indiana Iowa Kentucky
Duck Species Composition 2013 2014 2013 2014 2013 2014Mallard 63,029 46,515 66,628 59,968 71,651 57,649Domestic Mallard 275 129 0 0 0 294Black Duck 2,334 773 0 0 4,869 2,059Mallard x Black Hybrid 412 0 0 0 1,391 588Mottled Duck 0 0 0 0 0 0Gadwall 6,042 4,768 13,817 7,160 10,435 9,412Wigeon 1,099 773 3,685 2,238 696 1,471Green-winged Teal 6,591 2,835 19,344 17,453 2,783 4,412Blue-winged/Cinnamon Teal 3,433 7,989 42,679 56,612 696 3,235Northern Shoveler 1,785 1,289 5,527 2,685 1,391 1,471Northern Pintail 1,099 1,289 4,606 1,566 696 2,059Wood Duck 10,024 8,118 35,924 16,111 8,348 5,588Redhead 961 773 3,070 2,238 696 1,471Canvasback 549 258 921 1,119 0 294Greater Scaup 137 258 0 224 3,478 588Lesser Scaup 0 773 1,535 1,119 6,956 2,647Ring-necked Duck 961 2,190 2,456 2,909 696 6,177Goldeneyes 137 387 0 0 4,174 294Bufflehead 824 1,289 921 2,461 696 0Ruddy Duck 275 129 0 0 0 294Long-tailed Duck 0 0 0 0 0 0Eiders 0 0 0 0 0 0Scoters 0 0 0 0 0 0Hooded Merganser 412 773 1,228 0 5,565 1,177Other Mergansers 0 129 0 224 0 0Other Ducks 0 129 0 0 0 0
Total Duck Harvest 100,400±17% 81,600±17% 202,300±26% 174,100±24% 125,200±53% 101,200±72%
Total Active Duck Huntersa 9,000±13% 8,900±11% 14,400±18% 13,900±16% 10,700±37% 6,100±48%
Total Duck Hunter Days Afielda 71,200±15% 63,100±14% 128,500±30% 96,600±17% 68,500±53% 53,500±56%
Seasonal Duck Harvest Per Huntera 11.1±21% 9.1±20% 14.1±32% 12.5±29% 11.7±64% 16.6±86%
Goose Species CompositionCanada Goose 54,936 44,678 73,742 47,348 40,860 12,855Snow Goose 0 0 0 1,691 0 429Blue Goose 0 0 0 845 0 214Ross' Goose 0 0 0 0 0 643White-fronted Goose 0 0 0 0 0 3,000Brant 0 0 0 0 0 0Other Geese 0 0 0 0 0 0
Total Goose Harvest 54,900±20% 44,700±21% 73,700±35% 49,900±30% 40,900±71% 17,100±76%
Total Active Goose Huntersb 9,600±11% 8,000±12% 11,200±23% 13,600±17% 9,100±37% 5,500±48%
Total Goose Hunter Days Afieldb 68,000±15% 49,900±16% 99,100±35% 87,100±23% 84,200±63% 40,200±59%
Seasonal Goose Harvest Per Hunterb 5.7±23% 5.6±24% 6.6±42% 3.7±35% 4.5±80% 3.1±90%
Active Waterfowl Huntersc 10,200±12% 10,300±11% 15,900±18% 15,500±16% 11,600±35% 7,000±49%
Sample SizesDuckWings 731 633 659 778 180 344GooseTails 188 161 141 59 19 80
14

Table 1B. Preliminary estimates of waterfowl harvest and hunter activity in the Mississippi Flyway during the 2013 and 2014 hunting seasons.Louisiana Michigan Minnesota
Duck Species Composition 2013 2014 2013 2014 2013 2014Mallard 130,935 126,396 114,844 142,493 166,366 161,859Domestic Mallard 0 0 185 0 0 0Black Duck 775 276 8,150 4,560 0 1,465Mallard x Black Hybrid 387 0 556 285 0 0Mottled Duck 35,639 28,701 0 0 0 0Gadwall 484,615 468,050 6,483 8,835 15,254 12,451Wigeon 36,801 27,321 3,890 4,845 4,767 7,690Green-winged Teal 431,157 372,564 17,968 21,659 33,368 31,859Blue-winged/Cinnamon Teal 633,758 353,522 3,705 5,700 115,360 82,028Northern Shoveler 146,431 112,597 2,223 2,280 15,731 13,549Northern Pintail 66,630 34,497 7,409 4,275 8,104 2,563Wood Duck 158,439 114,253 28,341 37,333 149,681 114,620Redhead 46,486 19,318 17,968 29,924 19,544 25,268Canvasback 36,801 15,179 2,408 1,710 8,104 6,592Greater Scaup 1,162 3,312 8,335 8,265 3,814 366Lesser Scaup 20,919 94,383 11,855 8,550 10,011 2,563Ring-necked Duck 134,034 75,617 6,113 9,690 31,938 67,014Goldeneyes 775 552 7,409 12,539 1,430 1,099Bufflehead 3,099 1,380 34,268 20,804 14,777 15,014Ruddy Duck 1,162 4,416 1,297 4,560 0 2,197Long-tailed Duck 387 0 3,519 855 0 0Eiders 0 0 0 0 0 0Scoters 0 0 1,297 2,565 0 0Hooded Merganser 9,685 7,175 3,149 5,130 9,057 20,873Other Mergansers 2,324 828 4,816 4,560 0 1,465Other Ducks 8,135 1,104 0 0 477 732
Total Duck Harvest 2,390,500±21% 1,861,400±12% 296,200±26% 341,400±15% 607,800±14% 571,300±12%
Total Active Duck Huntersa 77,600±14% 77,200±6% 31,800±15% 32,800±12% 52,200±11% 65,300±9%
Total Duck Hunter Days Afielda 766,200±19% 561,000±11% 197,300±22% 212,300±13% 312,100±12% 349,400±11%
Seasonal Duck Harvest Per Huntera 30.8±25% 24.1±14% 9.3±30% 10.4±19% 11.6±18% 8.7±15%
Goose Species CompositionCanada Goose 0 245 148,002 140,669 191,577 148,496Snow Goose 8,389 5,640 244 0 0 0Blue Goose 5,942 8,338 0 0 0 0Ross' Goose 1,049 490 0 0 0 412White-fronted Goose 20,973 20,354 0 275 0 0Brant 0 0 0 0 0 0Other Geese 0 0 0 0 0 0
Total Goose Harvest 36,400±50% 35,100±31% 148,200±35% 140,900±16% 191,600±19% 148,900±15%
Total Active Goose Huntersb 7,200±45% 7,500±25% 26,400±18% 34,600±12% 42,400±14% 44,800±10%
Total Goose Hunter Days Afieldb 60,200±67% 28,000±32% 159,900±25% 199,100±15% 239,500±19% 219,300±13%
Seasonal Goose Harvest Per Hunterb 5.0±68% 4.7±40% 5.6±39% 4.1±20% 4.5±24% 3.3±18%
Active Waterfowl Huntersc 77,600±14% 77,900±6% 37,500±14% 40,100±12% 58,600±11% 70,500±9%
Sample SizesDuckWings 6,171 6,745 1,599 1,198 1,275 1,560GooseTails 104 143 608 513 264 361
15

Table 1B. Preliminary estimates of waterfowl harvest and hunter activity in the Mississippi Flyway during the 2013 and 2014 hunting seasons.Mississippi Missouri Ohio
Duck Species Composition 2013 2014 2013 2014 2013 2014Mallard 91,048 107,659 200,700 255,007 104,630 70,938Domestic Mallard 0 0 0 0 345 257Black Duck 245 0 0 0 5,525 2,827Mallard x Black Hybrid 0 0 290 0 1,381 0Mottled Duck 736 263 0 0 0 0Gadwall 61,844 68,439 67,769 34,359 9,323 3,598Wigeon 5,890 4,475 7,240 6,084 2,072 1,028Green-winged Teal 34,848 55,804 65,162 70,328 16,575 10,538Blue-winged/Cinnamon Teal 11,289 4,212 39,677 37,580 6,906 4,369Northern Shoveler 31,658 26,849 24,617 19,327 5,870 2,313Northern Pintail 3,190 9,476 11,005 10,558 5,525 4,626Wood Duck 50,555 39,484 13,612 25,232 19,683 12,594Redhead 491 790 2,027 5,548 3,108 1,028Canvasback 1,472 526 290 1,074 345 0Greater Scaup 0 0 290 179 2,072 771Lesser Scaup 982 263 5,503 2,326 7,597 4,112Ring-necked Duck 4,908 6,581 6,371 7,337 2,417 514Goldeneyes 0 526 0 716 1,036 3,341Bufflehead 245 0 290 895 3,798 7,968Ruddy Duck 0 0 579 358 2,763 1,028Long-tailed Duck 0 0 0 0 0 0Eiders 0 0 0 0 0 0Scoters 0 0 0 0 0 514Hooded Merganser 1,472 1,843 1,158 2,147 1,036 1,799Other Mergansers 0 0 0 895 691 514Other Ducks 0 263 0 179 0 0
Total Duck Harvest 300,900±17% 327,500±36% 446,600±23% 480,100±27% 202,700±18% 134,700±35%
Total Active Duck Huntersa 15,100±16% 15,800±16% 25,500±14% 32,700±13% 22,400±19% 13,800±19%
Total Duck Hunter Days Afielda 96,300±15% 99,800±24% 193,700±22% 224,900±17% 165,800±19% 133,700±31%
Seasonal Duck Harvest Per Huntera 19.9±23% 20.7±39% 17.5±27% 14.7±30% 9.1±26% 9.8±40%
Goose Species CompositionCanada Goose 7,181 15,084 35,094 45,690 128,515 79,648Snow Goose 3,590 4,114 9,172 2,932 0 0Blue Goose 0 2,742 7,976 2,199 0 0Ross' Goose 0 1,371 1,595 244 0 0White-fronted Goose 22,440 2,742 798 1,955 0 0Brant 0 0 0 0 0 0Other Geese 0 0 0 244 0 0
Total Goose Harvest 33,200±60% 26,100±54% 54,600±29% 53,300±28% 128,500±18% 79,600±25%
Total Active Goose Huntersb 4,800±32% 5,700±24% 11,400±19% 11,900±18% 23,500±18% 15,600±17%
Total Goose Hunter Days Afieldb 23,500±38% 41,300±42% 58,800±30% 66,400±26% 160,300±23% 131,900±22%
Seasonal Goose Harvest Per Hunterb 6.9±68% 4.6±59% 4.8±35% 4.5±33% 5.5±25% 5.1±30%
Active Waterfowl Huntersc 15,100±16% 15,800±16% 27,400±13% 34,500±12% 26,400±18% 17,400±17%
Sample SizesDuckWings 1,226 1,244 1,542 2,683 587 524GooseTails 37 19 137 218 337 267
16

Table 1B. Preliminary estimates of waterfowl harvest and hunter activity in the Mississippi Flyway during the 2013 and 2014 hunting seasons.Tennessee Wisconsin Flyway Total
Duck Species Composition 2013 2014 2013 2014 2013 2014Mallard 94,094 106,074 110,610 127,385 1,837,000 1,992,886Domestic Mallard 0 0 0 0 1,277 680Black Duck 1,045 617 1,058 2,143 24,951 15,885Mallard x Black Hybrid 0 0 265 0 5,633 1,747Mottled Duck 0 0 0 0 36,375 29,300Gadwall 49,138 45,020 18,523 12,861 1,009,467 947,364Wigeon 3,136 4,317 6,351 4,899 95,602 84,575Green-winged Teal 27,183 19,735 24,080 27,865 848,357 911,663Blue-winged/Cinnamon Teal 2,091 4,317 46,043 27,865 942,908 648,805Northern Shoveler 16,728 4,317 4,498 5,206 355,369 294,147Northern Pintail 2,091 1,850 3,969 4,593 155,104 115,644Wood Duck 23,001 25,902 104,524 76,247 774,961 602,451Redhead 1,045 0 12,172 22,660 121,598 122,872Canvasback 1,045 0 10,055 8,268 76,103 43,558Greater Scaup 0 0 28,049 22,660 49,064 37,927Lesser Scaup 0 1,233 25,932 20,516 97,873 156,083Ring-necked Duck 6,273 3,700 10,320 16,536 240,898 250,727Goldeneyes 2,091 617 9,526 6,430 29,593 32,910Bufflehead 0 0 22,228 14,392 88,370 70,647Ruddy Duck 0 0 2,646 1,837 8,933 20,930Long-tailed Duck 0 0 8,732 919 12,899 1,774Eiders 0 0 0 0 0 0Scoters 0 0 1,323 5,512 3,091 9,309Hooded Merganser 0 2,467 1,323 3,062 45,416 54,723Other Mergansers 0 0 3,440 2,450 13,174 12,811Other Ducks 0 0 0 306 8,871 3,384
Total Duck Harvest 229,000±56% 220,200±34% 455,700±16% 414,600±11% 6,882,900±8% 6,462,800±6%
Total Active Duck Huntersa 9,600±35% 12,800±26% 53,100±15% 53,900±11% 411,600 433,100
Total Duck Hunter Days Afielda 84,500±48% 113,800±37% 370,500±19% 316,000±11% 3,107,200±7% 2,981,900±5%
Seasonal Duck Harvest Per Huntera 23.9±66% 17.2±43% 8.6±22% 7.7±16%
Goose Species CompositionCanada Goose 11,966 14,429 85,831 90,438 933,368 781,274Snow Goose 499 2,886 0 0 86,087 44,602Blue Goose 997 0 256 0 47,268 42,000Ross' Goose 0 5,771 0 0 6,258 16,694White-fronted Goose 499 2,886 256 0 122,469 110,410Brant 0 0 0 0 0 0Other Geese 0 0 0 0 0 244
Total Goose Harvest 14,000±52% 26,000±59% 86,300±22% 90,400±15% 1,195,500±12% 995,200±9%
Total Active Goose Huntersb 4,600±49% 8,500±31% 30,000±16% 39,700±10% 223,400 240,100
Total Goose Hunter Days Afieldb 47,200±64% 49,300±44% 220,500±20% 220,600±14% 1,497,500±8% 1,419,800±6%
Seasonal Goose Harvest Per Hunterb 3.0±72% 3.0±67% 2.9±27% 2.3±18%
Active Waterfowl Huntersc 9,600±35% 13,000±26% 58,300±14% 64,300±11% 445,400 472,200
Sample SizesDuckWings 219 357 1,722 1,354 21,262 23,337GooseTails 28 9 337 224 2,673 2,438
17

Table 1C. Preliminary estimates of waterfowl harvest and hunter activity in the Central Flyway during the 2013 and 2014 hunting seasons.Colorado Kansas Nebraska
Duck Species Composition 2013 2014 2013 2014 2013 2014Mallard 44,511 63,700 94,432 114,417 82,415 75,797Domestic Mallard 0 0 0 0 0 0Black Duck 0 0 0 0 0 0Mallard x Black Hybrid 0 0 0 0 0 0Mottled Duck 0 0 0 0 0 0Gadwall 16,514 6,471 34,188 13,648 15,257 5,254Wigeon 10,936 4,889 9,460 4,975 8,737 3,697Green-winged Teal 13,889 7,909 35,184 24,873 28,037 15,179Blue-winged/Cinnamon Teal 11,921 10,065 48,627 47,961 35,340 40,477Northern Shoveler 11,593 1,150 12,945 4,592 6,259 1,751Northern Pintail 3,390 1,438 12,115 4,847 3,782 2,530Wood Duck 1,312 2,013 2,655 1,531 2,608 3,211Redhead 2,625 2,732 7,468 4,975 3,130 2,043Canvasback 109 288 1,494 1,148 0 389Greater Scaup 109 0 166 0 261 97Lesser Scaup 1,422 575 996 1,148 1,174 0Ring-necked Duck 2,734 1,150 4,149 2,679 1,304 487Goldeneyes 1,859 575 664 638 782 292Bufflehead 547 575 498 0 652 0Ruddy Duck 219 288 498 128 130 0Long-tailed Duck 0 0 0 0 0 0Eiders 0 0 0 0 0 0Scoters 0 0 0 0 0 0Hooded Merganser 109 144 332 765 391 97Other Mergansers 437 863 0 0 130 97Other Ducks 109 0 0 0 0 97
Total Duck Harvest 124,300±18% 104,800±17% 265,900±23% 228,300±21% 190,400±17% 151,500±12%
Total Active Duck Huntersa 11,900±14% 13,000±14% 16,800±16% 17,700±16% 13,000±15% 12,000±14%
Total Duck Hunter Days Afielda 77,100±19% 67,500±22% 105,300±19% 101,800±21% 101,200±16% 81,900±10%
Seasonal Duck Harvest Per Huntera 10.5±23% 8.1±22% 15.8±28% 12.9±26% 14.7±22% 12.6±18%
Goose Species CompositionCanada Goose 99,945 111,400 108,657 166,812 111,033 113,903Snow Goose 3,543 688 17,697 23,830 13,713 350Blue Goose 0 229 3,539 2,860 5,308 0Ross' Goose 1,492 0 6,017 5,719 2,875 350White-fronted Goose 559 0 15,927 19,064 664 0Brant 0 0 0 0 0 0Other Geese 0 0 0 0 0 0
Total Goose Harvest 105,500±16% 112,300±15% 151,800±29% 218,300±81% 133,600±22% 114,600±14%
Total Active Goose Huntersb 14,300±14% 14,600±13% 15,500±16% 13,700±17% 13,400±13% 13,200±10%
Total Goose Hunter Days Afieldb 89,600±19% 73,900±16% 88,400±21% 80,300±27% 95,900±15% 108,000±17%
Seasonal Goose Harvest Per Hunterb 7.4±21% 7.7±20% 9.8±33% 15.9±82% 10.0±25% 8.7±17%
Active Waterfowl Huntersc 19,000±12% 20,900±11% 21,700±14% 21,400±14% 17,600±12% 16,900±12%
Sample SizesDuckWings 1,137 729 1,602 1,790 1,460 1,557GooseTails 566 490 429 458 604 327
18

Table 1C. Preliminary estimates of waterfowl harvest and hunter activity in the Central Flyway during the 2013 and 2014 hunting seasons.New Mexico North Dakota Oklahoma
Duck Species Composition 2013 2014 2013 2014 2013 2014Mallard 13,892 20,915 178,721 213,079 134,470 148,826Domestic Mallard 0 0 0 236 0 0Black Duck 0 0 0 0 0 0Mallard x Black Hybrid 0 0 0 0 0 0Mottled Duck 0 0 0 0 0 0Gadwall 5,461 2,856 65,052 85,704 96,304 61,881Wigeon 6,826 3,010 13,792 20,186 32,175 17,112Green-winged Teal 3,694 4,322 26,320 30,929 33,728 30,768Blue-winged/Cinnamon Teal 3,614 5,711 58,271 36,831 13,092 7,951Northern Shoveler 1,847 2,547 30,227 29,866 17,086 6,568Northern Pintail 2,248 2,392 24,136 25,263 9,320 7,433Wood Duck 642 772 2,988 2,715 3,107 9,334Redhead 402 386 27,699 39,783 7,545 8,124Canvasback 161 309 7,471 9,798 3,107 2,247Greater Scaup 0 0 115 0 888 346Lesser Scaup 0 772 13,677 21,367 3,994 3,284Ring-necked Duck 241 540 6,206 13,458 13,314 8,816Goldeneyes 161 232 805 708 222 1,383Bufflehead 161 463 5,977 8,145 444 1,210Ruddy Duck 241 463 2,184 5,194 444 519Long-tailed Duck 0 0 0 0 0 0Eiders 0 0 0 0 0 0Scoters 0 0 0 236 0 0Hooded Merganser 80 154 3,103 1,535 1,331 1,210Other Mergansers 161 309 0 0 222 0Other Ducks 562 309 0 0 0 0
Total Duck Harvest 40,400±68% 46,500±41% 466,700±9% 545,000±8% 370,800±18% 317,000±22%
Total Active Duck Huntersa 2,100±42% 5,400±46% 32,100±8% 37,300±6% 18,800±12% 17,300±12%
Total Duck Hunter Days Afielda 13,500±46% 28,700±52% 161,200±8% 177,500±8% 127,800±17% 123,600±18%
Seasonal Duck Harvest Per Huntera 19.0±80% 8.7±62% 14.6±11% 14.6±10% 19.8±21% 18.3±26%
Goose Species CompositionCanada Goose 6,279 6,113 168,521 167,177 75,625 49,281Snow Goose 0 3,493 13,158 8,577 14,750 5,639Blue Goose 0 146 15,378 10,605 2,682 981Ross' Goose 0 1,747 951 2,027 3,486 2,452White-fronted Goose 0 0 1,585 1,715 3,218 2,452Brant 0 0 0 0 0 0Other Geese 0 0 0 0 0 0
Total Goose Harvest 6,300±97% 11,500±82% 199,600±15% 190,100±12% 99,800±41% 60,800±27%
Total Active Goose Huntersb 2,000±47% 3,000±53% 24,800±9% 26,700±6% 9,900±17% 9,400±16%
Total Goose Hunter Days Afieldb 8,400±77% 9,500±59% 117,500±11% 123,100±8% 49,400±24% 50,200±25%
Seasonal Goose Harvest Per Hunterb 3.1±108% 3.9±98% 8.0±18% 7.1±13% 10.1±44% 6.5±32%
Active Waterfowl Huntersc 3,100±38% 6,500±43% 36,200±7% 41,500±6% 20,200±12% 18,000±12%
Sample SizesDuckWings 503 602 4,061 4,617 1,671 1,834GooseTails 94 79 1,259 1,219 372 248
19
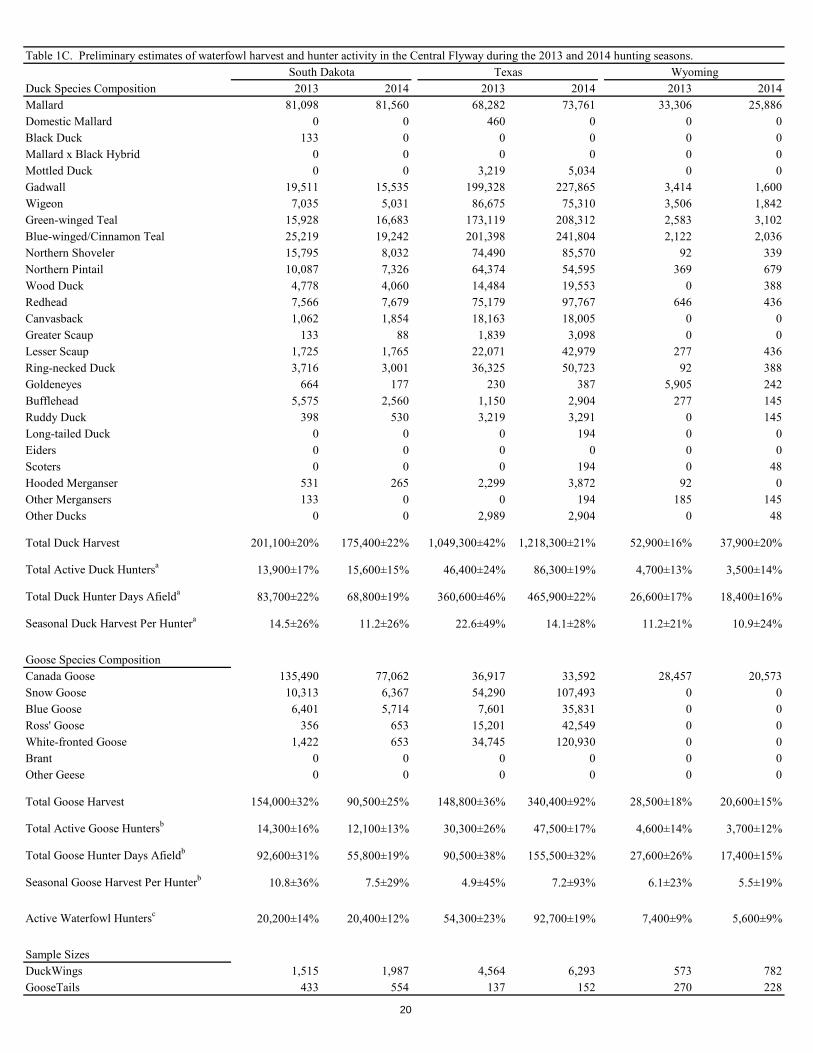
Table 1C. Preliminary estimates of waterfowl harvest and hunter activity in the Central Flyway during the 2013 and 2014 hunting seasons.South Dakota Texas Wyoming
Duck Species Composition 2013 2014 2013 2014 2013 2014Mallard 81,098 81,560 68,282 73,761 33,306 25,886Domestic Mallard 0 0 460 0 0 0Black Duck 133 0 0 0 0 0Mallard x Black Hybrid 0 0 0 0 0 0Mottled Duck 0 0 3,219 5,034 0 0Gadwall 19,511 15,535 199,328 227,865 3,414 1,600Wigeon 7,035 5,031 86,675 75,310 3,506 1,842Green-winged Teal 15,928 16,683 173,119 208,312 2,583 3,102Blue-winged/Cinnamon Teal 25,219 19,242 201,398 241,804 2,122 2,036Northern Shoveler 15,795 8,032 74,490 85,570 92 339Northern Pintail 10,087 7,326 64,374 54,595 369 679Wood Duck 4,778 4,060 14,484 19,553 0 388Redhead 7,566 7,679 75,179 97,767 646 436Canvasback 1,062 1,854 18,163 18,005 0 0Greater Scaup 133 88 1,839 3,098 0 0Lesser Scaup 1,725 1,765 22,071 42,979 277 436Ring-necked Duck 3,716 3,001 36,325 50,723 92 388Goldeneyes 664 177 230 387 5,905 242Bufflehead 5,575 2,560 1,150 2,904 277 145Ruddy Duck 398 530 3,219 3,291 0 145Long-tailed Duck 0 0 0 194 0 0Eiders 0 0 0 0 0 0Scoters 0 0 0 194 0 48Hooded Merganser 531 265 2,299 3,872 92 0Other Mergansers 133 0 0 194 185 145Other Ducks 0 0 2,989 2,904 0 48
Total Duck Harvest 201,100±20% 175,400±22% 1,049,300±42% 1,218,300±21% 52,900±16% 37,900±20%
Total Active Duck Huntersa 13,900±17% 15,600±15% 46,400±24% 86,300±19% 4,700±13% 3,500±14%
Total Duck Hunter Days Afielda 83,700±22% 68,800±19% 360,600±46% 465,900±22% 26,600±17% 18,400±16%
Seasonal Duck Harvest Per Huntera 14.5±26% 11.2±26% 22.6±49% 14.1±28% 11.2±21% 10.9±24%
Goose Species CompositionCanada Goose 135,490 77,062 36,917 33,592 28,457 20,573Snow Goose 10,313 6,367 54,290 107,493 0 0Blue Goose 6,401 5,714 7,601 35,831 0 0Ross' Goose 356 653 15,201 42,549 0 0White-fronted Goose 1,422 653 34,745 120,930 0 0Brant 0 0 0 0 0 0Other Geese 0 0 0 0 0 0
Total Goose Harvest 154,000±32% 90,500±25% 148,800±36% 340,400±92% 28,500±18% 20,600±15%
Total Active Goose Huntersb 14,300±16% 12,100±13% 30,300±26% 47,500±17% 4,600±14% 3,700±12%
Total Goose Hunter Days Afieldb 92,600±31% 55,800±19% 90,500±38% 155,500±32% 27,600±26% 17,400±15%
Seasonal Goose Harvest Per Hunterb 10.8±36% 7.5±29% 4.9±45% 7.2±93% 6.1±23% 5.5±19%
Active Waterfowl Huntersc 20,200±14% 20,400±12% 54,300±23% 92,700±19% 7,400±9% 5,600±9%
Sample SizesDuckWings 1,515 1,987 4,564 6,293 573 782GooseTails 433 554 137 152 270 228
20

Table 1C. Preliminary estimates of waterfowl harvest and hunter activity in the Central Flyway during the 2013 and 2014 hunting seasons.Flyway Total
Duck Species Composition 2013 2014Mallard 731,127 817,940Domestic Mallard 460 236Black Duck 133 0Mallard x Black Hybrid 0 0Mottled Duck 3,219 5,034Gadwall 455,029 420,814Wigeon 179,141 136,053Green-winged Teal 332,482 342,076Blue-winged/Cinnamon Teal 399,602 412,079Northern Shoveler 170,334 140,418Northern Pintail 129,821 106,502Wood Duck 32,575 43,577Redhead 132,258 163,925Canvasback 31,565 34,037Greater Scaup 3,511 3,629Lesser Scaup 45,336 72,326Ring-necked Duck 68,082 81,241Goldeneyes 11,291 4,634Bufflehead 15,279 16,003Ruddy Duck 7,332 10,557Long-tailed Duck 0 194Eiders 0 0Scoters 0 478Hooded Merganser 8,270 8,042Other Mergansers 1,268 1,608Other Ducks 3,660 3,358
Total Duck Harvest 2,761,800±17% 2,824,800±10%
Total Active Duck Huntersa 159,700 207,900
Total Duck Hunter Days Afielda 1,057,100±16% 1,134,000±10%
Seasonal Duck Harvest Per Huntera
Goose Species CompositionCanada Goose 770,924 745,913Snow Goose 127,463 156,438Blue Goose 40,909 56,365Ross' Goose 30,378 55,498White-fronted Goose 58,121 144,814Brant 0 0Other Geese 0 0
Total Goose Harvest 1,027,800±10% 1,159,000±31%
Total Active Goose Huntersb 129,200 143,900
Total Goose Hunter Days Afieldb 660,000±9% 673,700±9%
Seasonal Goose Harvest Per Hunterb
Active Waterfowl Huntersc 199,600 244,000
Sample SizesDuckWings 17,086 20,191GooseTails 4,164 3,755
21

Table 1D. Preliminary estimates of waterfowl harvest and hunter activity in the Pacific Flyway during the 2013 and 2014 hunting seasons.Arizona California Idaho
Duck Species Composition 2013 2014 2013 2014 2013 2014Mallard 13,720 6,672 127,977 106,370 212,538 169,105Domestic Mallard 148 0 607 190 874 399Black Duck 0 0 0 0 0 0Mallard x Black Hybrid 0 0 0 0 0 0Mottled Duck 0 0 0 0 0 0Gadwall 5,117 1,554 60,725 56,464 13,978 14,491Wigeon 7,490 3,108 153,026 162,264 21,716 17,150Green-winged Teal 15,351 4,473 258,838 240,591 16,973 10,237Blue-winged/Cinnamon Teal 6,304 417 22,013 18,156 2,870 133Northern Shoveler 7,713 2,502 197,355 155,134 5,366 3,324Northern Pintail 3,041 1,668 130,558 115,685 7,114 3,191Wood Duck 222 38 5,465 9,316 6,115 4,387Redhead 964 682 7,742 3,897 2,496 3,589Canvasback 222 303 30,059 15,589 749 133Greater Scaup 74 0 1,974 2,947 624 2,393Lesser Scaup 1,335 417 18,217 16,635 3,744 3,457Ring-necked Duck 2,521 1,289 20,343 17,110 3,494 5,717Goldeneyes 890 341 743 331 16,099 7,977Bufflehead 964 493 12,752 18,346 3,994 3,324Ruddy Duck 742 720 12,904 7,605 374 0Long-tailed Duck 0 0 0 0 0 0Eiders 0 0 0 0 0 0Scoters 0 0 306 89 125 0Hooded Merganser 0 76 304 1,711 749 532Other Mergansers 148 227 455 665 374 266Other Ducks 1,261 644 0 95 0 0
Total Duck Harvest 68,200±43% 25,600±16% 1,062,400±14% 949,200±9% 320,400±17% 249,800±20%
Total Active Duck Huntersa 4,700±22% 3,000±15% 47,000±11% 43,000±12% 19,400±11% 19,000±15%
Total Duck Hunter Days Afielda 23,200±30% 14,100±15% 403,200±11% 309,800±8% 127,200±13% 114,600±25%
Seasonal Duck Harvest Per Huntera 14.4±48% 8.6±22% 22.6±18% 22.0±15% 16.5±20% 13.2±25%
Goose Species CompositionCanada Goose 2,087 2,143 44,071 52,735 62,595 69,031Snow Goose 373 0 38,747 65,575 1,252 2,308Blue Goose 0 0 0 917 0 0Ross' Goose 149 159 13,310 18,343 0 0White-fronted Goose 75 0 65,071 74,976 6,260 2,098Brant 0 0 952 3,080 0 210Other Geese 0 0 0 0 209 0
Total Goose Harvest 2,700±62% 2,300±34% 162,200±19% 215,600±17% 70,300±15% 73,600±22%
Total Active Goose Huntersb 1,600±41% 1,900±21% 29,800±13% 38,100±10% 15,600±12% 15,200±15%
Total Goose Hunter Days Afieldb 9,500±56% 12,000±33% 201,800±16% 258,700±14% 81,300±16% 78,800±19%
Seasonal Goose Harvest Per Hunterb 1.6±74% 1.2±40% 5.4±23% 5.6±19% 4.5±19% 4.9±26%
Active Waterfowl Huntersc 4,900±21% 3,100±15% 49,200±11% 45,100±12% 23,100±11% 23,800±13%
Sample SizesDuckWings 920 676 7,039 10,066 2,567 1,879GooseTails 36 29 621 1,035 337 351
22

Table 1D. Preliminary estimates of waterfowl harvest and hunter activity in the Pacific Flyway during the 2013 and 2014 hunting seasons.Montana Nevada Oregon
Duck Species Composition 2013 2014 2013 2014 2013 2014Mallard 79,346 111,180 10,499 12,841 103,953 136,459Domestic Mallard 0 161 0 0 294 211Black Duck 0 0 0 0 0 0Mallard x Black Hybrid 0 0 0 0 0 0Mottled Duck 0 0 0 0 0 0Gadwall 9,723 5,801 4,584 6,222 8,902 10,459Wigeon 8,763 6,929 2,505 1,191 44,141 51,874Green-winged Teal 6,602 11,763 7,621 4,104 34,651 40,713Blue-winged/Cinnamon Teal 7,923 1,934 1,119 397 294 491Northern Shoveler 5,762 3,706 7,035 2,118 18,466 17,830Northern Pintail 2,641 3,867 2,238 927 37,299 42,679Wood Duck 1,320 322 266 0 9,196 11,021Redhead 3,241 3,061 640 265 0 491Canvasback 720 1,611 320 132 2,060 1,474Greater Scaup 0 0 53 0 1,545 3,089Lesser Scaup 2,521 1,128 107 132 3,973 5,756Ring-necked Duck 1,200 3,706 693 530 6,033 8,985Goldeneyes 3,601 21,108 213 0 155 231Bufflehead 1,080 1,450 213 662 3,531 5,545Ruddy Duck 0 161 160 530 368 211Long-tailed Duck 0 0 0 0 0 0Eiders 0 0 0 0 0 0Scoters 0 0 0 0 10 120Hooded Merganser 120 322 53 0 1,030 842Other Mergansers 120 1,128 0 0 515 913Other Ducks 0 0 0 0 74 0
Total Duck Harvest 134,700±32% 179,300±21% 38,300±22% 30,000±20% 276,500±26% 339,400±16%
Total Active Duck Huntersa 10,600±20% 17,500±13% 3,600±22% 2,700±19% 13,800±13% 18,300±10%
Total Duck Hunter Days Afielda 63,600±28% 79,800±17% 18,600±19% 15,000±17% 117,100±23% 125,900±14%
Seasonal Duck Harvest Per Huntera 12.6±37% 10.2±25% 10.6±31% 11.0±27% 20.1±29% 18.5±19%
Goose Species CompositionCanada Goose 42,099 67,614 6,177 4,343 48,653 42,441Snow Goose 555 831 0 99 2,409 1,547Blue Goose 0 0 0 0 0 0Ross' Goose 555 166 0 0 602 276White-fronted Goose 222 166 0 99 2,890 5,692Brant 0 0 0 0 0 17Other Geese 0 0 0 0 0 0
Total Goose Harvest 43,400±40% 68,800±21% 6,200±42% 4,500±29% 54,600±24% 50,000±17%
Total Active Goose Huntersb 6,600±28% 12,500±16% 1,900±27% 1,800±25% 7,500±16% 8,700±11%
Total Goose Hunter Days Afieldb 30,900±32% 56,000±20% 10,100±42% 8,000±26% 48,800±23% 52,200±14%
Seasonal Goose Harvest Per Hunterb 6.6±49% 5.5±26% 3.3±50% 2.5±39% 7.3±29% 5.7±20%
Active Waterfowl Huntersc 12,400±18% 21,200±12% 3,800±22% 3,100±19% 15,700±13% 20,300±9%
Sample SizesDuckWings 1,122 1,113 719 227 3,773 4,868GooseTails 391 414 52 46 454 905
23

Table 1D. Preliminary estimates of waterfowl harvest and hunter activity in the Pacific Flyway during the 2013 and 2014 hunting seasons.Utah Washington Flyway Total
Duck Species Composition 2013 2014 2013 2014 2013 2014Mallard 52,713 51,366 123,569 186,951 724,316 780,943Domestic Mallard 402 1,002 114 0 2,439 1,963Black Duck 0 0 0 0 0 0Mallard x Black Hybrid 0 0 0 0 0 0Mottled Duck 0 0 0 0 0 0Gadwall 19,479 21,298 7,182 7,081 129,689 123,371Wigeon 17,471 23,553 62,240 76,008 317,352 342,077Green-winged Teal 38,958 30,193 30,208 34,817 409,203 376,891Blue-winged/Cinnamon Teal 5,824 9,772 456 472 46,803 31,772Northern Shoveler 11,748 28,189 9,575 15,107 263,020 227,909Northern Pintail 15,161 23,553 24,395 34,581 222,447 226,151Wood Duck 100 376 4,218 4,131 26,904 29,590Redhead 2,510 3,508 2,850 2,124 20,443 17,619Canvasback 1,908 4,260 2,622 1,534 38,659 25,037Greater Scaup 100 0 1,710 2,124 6,080 10,553Lesser Scaup 4,418 1,754 7,524 8,734 41,838 38,013Ring-necked Duck 3,113 3,508 7,638 7,200 45,035 48,044Goldeneyes 5,322 2,756 1,104 589 28,127 33,333Bufflehead 2,309 376 8,549 10,150 33,394 40,346Ruddy Duck 1,004 2,130 114 826 15,666 12,182Long-tailed Duck 0 0 23 0 23 0Eiders 0 0 0 0 0 0Scoters 100 0 437 255 978 464Hooded Merganser 402 0 798 1,180 3,455 4,663Other Mergansers 1,104 1,879 798 1,062 3,516 6,141Other Ducks 201 0 0 134 1,535 873
Total Duck Harvest 184,300±20% 209,500±14% 296,100±17% 395,100±19% 2,380,900±8% 2,377,900±6%
Total Active Duck Huntersa 14,300±16% 16,900±15% 17,200±13% 21,300±10% 130,700 141,800
Total Duck Hunter Days Afielda 90,600±23% 99,100±17% 127,100±15% 152,700±16% 970,800±7% 911,100±6%
Seasonal Duck Harvest Per Huntera 12.9±26% 12.4±21% 17.1±21% 18.5±22%
Goose Species CompositionCanada Goose 17,618 26,239 48,301 49,458 271,601 314,004Snow Goose 647 0 4,383 4,297 48,365 74,656Blue Goose 0 0 0 0 0 917Ross' Goose 485 175 1,031 457 16,133 19,576White-fronted Goose 0 0 516 1,097 75,033 84,128Brant 0 0 767 37 1,719 3,344Other Geese 0 0 0 0 209 0
Total Goose Harvest 18,700±36% 26,400±24% 55,000±23% 55,300±14% 413,100±10% 496,600±9%
Total Active Goose Huntersb 7,800±22% 10,100±14% 10,200±15% 10,900±10% 80,900 99,200
Total Goose Hunter Days Afieldb 44,200±39% 50,200±19% 56,000±20% 58,000±15% 482,800±9% 574,000±7%
Seasonal Goose Harvest Per Hunterb 2.4±43% 2.6±28% 5.3±27% 5.1±18%
Active Waterfowl Huntersc 14,900±16% 17,700±15% 18,700±12% 23,100±10% 142,700 162,900
Sample SizesDuckWings 1,836 1,672 2,652 3,394 20,628 23,895GooseTails 116 151 635 611 2,642 3,542
24

Table 1E. Preliminary estimates of waterfowl harvest and hunter activity in the Alaska and the United States during the 2013 and 2014 hunting seasons.Alaska United States Total
Duck Species Composition 2013 2014 2013 2014Mallard 17,125 18,232 3,637,597 3,904,063Domestic Mallard 69 0 7,452 5,837Black Duck 0 0 100,187 72,396Mallard x Black Hybrid 0 0 12,597 4,509Mottled Duck 0 0 49,727 41,902Gadwall 480 1,211 1,674,771 1,582,795Wigeon 11,097 9,116 638,214 610,915Green-winged Teal 8,152 5,840 1,711,307 1,751,773Blue-winged/Cinnamon Teal 343 214 1,465,318 1,155,489Northern Shoveler 5,275 2,778 821,859 704,756Northern Pintail 9,727 5,484 538,467 471,466Wood Duck 0 0 1,160,864 1,079,574Redhead 0 0 310,201 331,736Canvasback 274 0 159,712 108,263Greater Scaup 343 285 82,224 62,093Lesser Scaup 822 427 246,285 321,925Ring-necked Duck 480 214 497,997 498,057Goldeneyes 2,946 3,134 86,645 81,894Bufflehead 1,987 641 223,984 206,089Ruddy Duck 0 0 46,285 61,070Long-tailed Duck 0 207 29,224 13,226Eiders 0 207 7,778 13,679Scoters 4,602 2,273 47,618 42,999Hooded Merganser 0 0 98,552 97,807Other Mergansers 1,255 2,273 35,123 32,406Other Ducks 1,742 620 26,438 13,278
Total Duck Harvest 66,700±16% 53,200±14% 13,716,400±6% 13,270,000±4%
Total Active Duck Huntersa 4,700±9% 5,100±9% 881,400 961,500
Total Duck Hunter Days Afielda 25,800±13% 20,500±13% 6,196,900±5% 5,971,700±3%
Seasonal Duck Harvest Per Huntera 12.7±18% 9.3±17%
Goose Species CompositionCanada Goose 5,142 7,365 2,657,761 2,485,077Snow Goose 0 0 291,171 295,778Blue Goose 0 0 89,404 100,886Ross' Goose 0 0 52,769 91,821White-fronted Goose 621 113 256,369 339,559Brant 725 2,434 14,366 13,054Other Geese 0 0 279 676
Total Goose Harvest 6,500±27% 9,900±36% 3,362,100±6% 3,326,900±11%
Total Active Goose Huntersb 1,800±16% 1,900±18% 561,900 616,700
Total Goose Hunter Days Afieldb 9,500±25% 7,600±25% 3,301,400±5% 3,287,000±4%
Seasonal Goose Harvest Per Hunterb 3.2±31% 4.0±40%
Active Waterfowl Huntersc 5,100±9% 5,500±8% 1,017,700 1,097,300
Sample SizesDuckWings 882 695 74,693 82,678GooseTails 93 90 16,423 15,654
25

a Duck hunter statistics do not include sea duck hunter statistics for states with special sea duck seasons or sea duck permits: Connecticut, Delaware, Maine, Maryland, Massachusetts, New Hampshire, New Jersey, New York, Rhode Island, Virginia, California, Oregon, and Alaska. (Refer to Table 3.)
b Goose hunter statistics do not include brant hunter statistics for coastal states with brant seasons: Connecticut, Delaware, Maryland, Massachusetts, New Jersey, New York, North Carolina, Rhode Island, Virginia, California, Oregon, Washington, and Alaska. (Refer to Table 4.)
c Hunter number estimates at the flyway and national levels may be biased high because the HIP sample frames are state-specific; therefore hunters are counted twice if they hunt in more than one state. Variance inestimable.
26

Central Flyway Pacific Flyway Central Flyway Pacific FlywayDuck Harvest Colorado 100,900 23,400 91,200 13,700 Montana 54,400 80,300 45,100 134,200 New Mexico 34,600 5,800 36,200 10,300 Wyoming 46,200 6,600 24,700 13,200
Goose Harvest Colorado 97,100 8,400 102,500 9,900 Montana 28,800 14,700 46,700 22,100 New Mexico 2,400 3,900 8,300 3,200 Wyoming 26,700 1,800 15,800 4,800
Table 2. Flyway-specific point estimates of duck and goose harvest in Colorado, Montana, New Mexico, and Wyoming during the 2013 and 2014 hunting seasons.
2013 2014
27

Stat
e / F
lyw
ay20
1320
1420
1320
1420
1320
1420
1320
14
Con
nect
icut
4,50
0 ±
60%
2,90
0 ±
75%
600
± 45
%40
0 ±
51%
2,10
0 ±
62%
2,40
0 ±
63%
7.4
± 75
%7.
4 ±
91%
D
elaw
are
1,10
0 ±
74%
700
± 67
%30
0 ±
58%
200
± 56
%80
0 ±
81%
1,00
0 ±
84%
4.4
± 94
%3.
2 ±
87%
M
aine
5,00
0 ±
67%
2,10
0 ±
68%
1,00
0 ±
47%
600
± 60
%3,
500
± 62
%1,
400
± 61
%4.
9 ±
82%
3.3
± 91
%
Mar
ylan
d14
,100
± 4
2%13
,600
± 2
7%2,
700
± 24
%2,
800
± 18
%7,
100
± 36
%5,
900
± 25
%5.
2 ±
48%
4.8
± 33
%
Mas
sach
uset
ts3,
800
± 47
%5,
400
± 42
%70
0 ±
43%
900
± 44
%1,
700
± 46
%2,
100
± 38
%5.
6 ±
64%
6.3
± 61
%
New
Ham
pshi
re1,
700
± 89
%1,
500
± 68
%20
0 ±
69%
200
± 55
%80
0 ±
74%
700
± 73
%9.
0 ±
112%
6.9
± 87
%
New
Jer
sey
5,30
0 ±
44%
4,30
0 ±
54%
1,10
0 ±
32%
1,20
0 ±
42%
3,30
0 ±
39%
2,20
0 ±
56%
4.7
± 54
%3.
7 ±
69%
N
ew Y
ork
13,6
00 ±
48%
10,7
00 ±
51%
2,00
0 ±
37%
1,40
0 ±
32%
8,60
0 ±
41%
8,60
0 ±
87%
6.7
± 61
%7.
8 ±
61%
R
hode
Isla
nd80
0 ±
50%
800
± 80
%20
0 ±
37%
100
± 34
%1,
100
± 63
%40
0 ±
59%
4.0
± 62
%8.
4 ±
87%
V
irgin
ia2,
900
± 67
%8,
600
± 56
%1,
000
± 58
%1,
500
± 41
%2,
100
± 55
%3,
500
± 50
%3.
0 ±
89%
5.8
± 70
% A
tlant
ic F
lyw
ay T
otal
53,0
00 ±
20%
50,5
00 ±
18%
9,80
09,
200
31,2
00 ±
18%
28,2
00 ±
29%
C
alifo
rnia
1,00
0 ±
73%
400
± 65
%10
0 ±
36%
100
± 34
%60
0 ±
54%
500
± 47
%8.
3 ±
81%
3.4
± 73
%
Ore
gon
200
± 98
%40
0 ±
65%
<50
± 70
%<5
0 ±
38%
100
± 82
%20
0 ±
52%
3.7
± 12
0%7.
2 ±
75%
Was
hing
ton
1,60
0 ±
87%
900
± 57
%10
0 ±
61%
100
± 65
%1,
200
± 10
8%40
0 ±
55%
14.0
± 1
06%
6.8
± 87
% P
acifi
c Fl
yway
2,80
0 ±
56%
1,60
0 ±
37%
300
300
1,90
0 ±
70%
1,10
0 ±
31%
Ala
ska
7,50
0 ±
33%
5,60
0 ±
36%
1,10
0 ±
27%
1,10
0 ±
27%
4,40
0 ±
34%
4,80
0 ±
43%
6.8
± 43
%5.
2 ±
45%
U.S
. Tot
al63
,300
± 1
7%57
,700
± 1
7%11
,200
10,6
0037
,600
± 1
6%34
,100
± 2
5%
Tabl
e 4.
Pre
limin
ary
estim
ates
of b
rant
har
vest
and
hun
ter a
ctiv
ity a
long
the
Atla
ntic
and
Pac
ific
coas
ts d
urin
g th
e 20
13 a
nd 2
014
hunt
ing
seas
ons.
1
Stat
e / F
lyw
ay20
1320
1420
1320
1420
1320
1420
1320
14
Con
nect
icut
020
0 ±
195%
100
± 19
5%10
0 ±
195%
900
± 19
5%70
0 ±
195%
03.
0 ±
276%
D
elaw
are
200
± 11
7%<5
0 ±
127%
100
± 82
%<5
0 ±
98%
400
± 97
%<5
0 ±
98%
3.3
± 14
3%1.
0 ±
160%
M
aryl
and
100
± 14
0%0
100
± 15
4%10
0 ±
122%
100
± 15
4%20
0 ±
119%
1.2
± 20
8%0
M
assa
chus
etts
100
± 11
6%50
0 ±
73%
100
± 10
3%30
0 ±
73%
300
± 12
3%60
0 ±
54%
1.3
± 15
5%2.
0 ±
103%
N
ew H
amps
hire
0<5
0 ±
191%
100
± 13
6%<5
0 ±
191%
300
± 14
9%<5
0 ±
191%
01.
0 ±
271%
N
ew J
erse
y4,
600
± 10
0%1,
500
± 55
%1,
100
± 31
%80
0 ±
43%
4,40
0 ±
57%
1,70
0 ±
44%
4.3
± 10
4%1.
8 ±
70%
N
ew Y
ork
4,20
0 ±
44%
3,10
0 ±
40%
1,50
0 ±
42%
1,30
0 ±
33%
4,90
0 ±
42%
4,40
0 ±
43%
2.8
± 61
%2.
4 ±
52%
N
orth
Car
olin
a90
0 ±
142%
1,00
0 ±
101%
600
± 11
6%1,
400
± 75
%2,
600
± 12
5%2,
300
± 80
%1.
5 ±
183%
0.7
± 12
5%
Rho
de Is
land
200
± 61
%10
0 ±
62%
100
± 43
%<5
0 ±
44%
500
± 55
%10
0 ±
59%
3.5
± 74
%2.
0 ±
75%
V
irgin
ia1,
200
± 10
8%30
0 ±
73%
700
± 70
%50
0 ±
55%
1,20
0 ±
71%
1,20
0 ±
49%
1.8
± 12
9%0.
7 ±
92%
Atla
ntic
Fly
way
Tot
al11
,600
± 4
6%6,
900
± 28
%4,
300
4,60
015
,500
± 3
3%11
,100
± 2
8%
C
alifo
rnia
1,00
0 ±
48%
2,20
0 ±
51%
300
± 92
%1,
100
± 56
%1,
000
± 43
%2,
900
± 66
%2.
8 ±
103%
2.1
± 76
%
Ore
gon
0<5
0 ±
154%
<50
± 96
%<5
0 ±
175%
<50
± 11
6%10
0 ±
167%
00.
4 ±
233%
W
ashi
ngto
n80
0 ±
85%
<50
± 10
9%40
0 ±
76%
<50
± 90
%1,
200
± 89
%<5
0 ±
95%
1.8
± 11
4%1.
3 ±
141%
Pac
ific
Flyw
ay T
otal
1,70
0 ±
46%
2,20
0 ±
50%
800
1,10
02,
300
± 51
%3,
100
± 64
%
A
lask
a 70
0 ±
55%
2,40
0 ±
42%
200
± 44
%50
0 ±
32%
1,00
0 ±
60%
2,00
0 ±
37%
3.6
± 70
%5.
2 ±
53%
U.S
. Tot
al14
,000
± 3
8%11
,500
± 2
1%5,
300
6,20
018
,800
± 2
8%16
,200
± 2
3%
1 Var
ianc
e es
timat
es p
rese
nted
as 9
5% c
onfid
ence
inte
rval
as p
erce
nt o
f the
poi
nt e
stim
ate.
Tabl
e 3.
Pre
limin
ary
estim
ates
of s
ea d
uck
harv
est a
nd h
unte
r act
ivity
for s
tate
s with
spec
ial s
ea d
uck
seas
ons o
r sea
duc
k pe
rmits
dur
ing
the
2013
and
201
4 hu
ntin
g se
ason
s.1
Sea
Duc
k H
arve
st 2
A
ctiv
e Se
a D
uck
Hun
ters
3Se
a D
uck
Hun
ter D
ays A
field
Seas
onal
Har
vest
Per
Hun
ter
3 Hun
ter n
umbe
r est
imat
es a
t the
man
agem
ent u
nit a
nd n
atio
nal l
evel
s may
be
bias
ed h
igh,
bec
ause
the
HIP
sam
ple
fram
es a
re st
ate
spec
ific;
ther
efor
e hu
nter
s are
cou
nted
mor
e th
an o
nce
if th
ey
hunt
in >
1 st
ate.
Var
ianc
e in
estim
able
.
1 Var
ianc
e es
timat
es p
rese
nted
as 9
5% c
onfid
ence
inte
rval
as p
erce
nt o
f the
poi
nt e
stim
ate.
2 H
unte
r num
ber e
stim
ates
at t
he m
anag
emen
t uni
t and
nat
iona
l lev
els m
ay b
e bi
ased
hig
h, b
ecau
se th
e H
IP sa
mpl
e fr
ames
are
stat
e sp
ecifi
c; th
eref
ore
hunt
ers a
re c
ount
ed m
ore
than
onc
e if
they
hu
nt in
>1
stat
e. V
aria
nce
ines
timab
le.
2 Sea
duc
ks in
clud
e lo
ng-ta
iled
duck
s, ei
ders
, and
scot
ers i
n th
e A
tlant
ic F
lyw
ay; l
ong-
taile
d du
cks,
scot
ers,
and
harle
quin
duc
ks in
Cal
iforn
ia a
nd O
rego
n; lo
ng-ta
iled
duck
s, sc
oter
s, ha
rlequ
in
duck
s, an
d go
lden
eyes
in W
ashi
ngto
n; a
nd lo
ng-ta
iled
duck
s, ei
ders
, sco
ters
, har
lequ
in d
ucks
, and
mer
gans
ers i
n A
lask
a.
Bra
nt H
arve
st
Act
ive
Bra
nt H
unte
rs 2
Bra
nt H
unte
r Day
s Afie
ldSe
ason
al H
arve
st P
er H
unte
r
28

Har
vest
Gre
en-w
inge
d Te
alB
lue-
win
ged
Teal
Woo
d du
cks
Oth
er d
ucks
Tota
l duc
k ha
rves
tSt
ate
2013
2014
2013
2014
2013
2014
2013
2014
2013
2014
2013
2014
Sept
embe
r Tea
l Sea
sons
Del
awar
e44
917
515
00
00
00
598
175
82
Geo
rgia
00
8,58
65,
437
00
00
8,58
65,
437
5937
Mar
ylan
d13
290
339
682
00
00
528
985
412
Nor
th C
arol
ina
850
063
832
80
063
80
2,12
532
810
2
So
uth
Car
olin
a0
179
1,74
22,
510
00
00
1,74
22,
689
1115
Virg
inia
064
832
443
20
021
60
541
1,08
05
10
Atla
ntic
Fly
way
Tot
al1,
431
1,90
611
,835
8,79
00
085
40
14,1
1910
,696
9778
Ala
bam
a21
213
612
,927
9,49
521
227
121
20
13,5
639,
901
6473
Ark
ansa
s0
1,67
74,
673
23,8
070
00
04,
673
25,4
8418
76
Ill
inoi
s0
291
11,4
1919
,518
00
00
11,4
1919
,809
2468
Indi
ana
549
258
2,19
76,
185
00
00
2,74
66,
443
2050
Iow
a0
2,90
90
45,8
710
00
00
48,7
800
218
Loui
sian
a4,
649
276
323,
077
220,
778
00
027
632
7,72
622
1,33
084
680
2
M
ichi
gan
05,
415
04,
275
00
00
09,
690
034
Mis
siss
ippi
00
9,32
62,
106
00
00
9,32
62,
106
388
Miss
ouri
1,44
81,
790
38,2
2928
,990
00
017
939
,677
30,9
5913
717
3
O
hio
5,87
04,
626
5,52
54,
369
00
025
711
,395
9,25
333
36
W
iscon
sin0
1,83
70
13,7
800
00
00
15,6
170
51
Miss
issip
pi F
lyw
ay T
otal
12,7
2819
,214
407,
373
379,
174
212
271
212
712
420,
525
399,
371
1,18
01,
589
Col
orad
o1,
312
1,00
74,
156
7,62
10
00
05,
468
8,62
850
60
K
ansa
s2,
323
2,80
628
,213
36,7
360
128
00
30,5
3739
,670
184
311
Neb
rask
a1,
174
1,94
611
,606
31,0
390
389
130
195
12,9
1033
,569
9934
5
N
ew M
exic
o40
238
62,
891
4,01
30
00
03,
292
4,39
941
57
O
klah
oma
1,55
30
12,4
266,
568
00
017
313
,980
6,74
163
39
Te
xas
4,59
82,
710
119,
781
162,
623
00
00
124,
379
165,
333
541
854
Cen
tral F
lyw
ay T
otal
11,3
628,
855
179,
073
248,
600
051
713
036
719
0,56
625
8,33
997
81,
666
Tota
l25
,521
29,9
7559
8,28
263
6,56
421
278
81,
196
1,07
962
5,21
166
8,40
62,
255
3,33
3
Sept
embe
r Tea
l/Woo
d D
uck
Seas
ons
Flor
ida
00
8,53
311
,017
905
2,55
10
09,
438
13,5
6973
117
Ken
tuck
y0
069
62,
941
5,56
52,
941
00
6,26
15,
883
920
Tenn
esse
e0
00
3,70
08,
364
5,55
00
08,
364
9,25
18
15
Tota
l0
09,
229
17,6
5914
,834
11,0
430
024
,063
28,7
0290
152
U.S
. Tot
al25
,521
29,9
7560
7,51
065
4,22
315
,046
11,8
311,
196
1,07
964
9,27
369
7,10
82,
345
3,48
5
Num
ber o
f w
ings
rece
ived
Tabl
e 5.
Pre
limin
ary
harv
est e
stim
ates
for s
peci
al S
epte
mbe
r tea
l and
teal
/woo
d du
ck se
ason
s dur
ing
the
2013
and
201
4 hu
ntin
g se
ason
s.
29

September Regular Late TotalState / Flyway 2013 2014 2013 2014 2013 2014 2013 2014 Connecticut 1,200 3,400 7,500 8,000 0 0 8,600 11,400 Delaware 900 400 17,000 17,400 0 0 17,900 17,800 Florida 0 0 1,700 5,700 0 0 1,700 5,700 Georgia 4,700 21,400 27,400 30,300 0 0 32,200 51,800 Maine 3,900 2,900 4,900 6,100 0 0 8,800 8,900 Maryland 5,800 8,200 146,700 105,800 0 0 152,500 114,000 Massachusetts 2,100 2,700 3,800 4,800 1,300 0 7,100 7,500 New Hampshire 1,500 2,000 4,500 3,800 0 0 6,000 5,800 New Jersey 6,000 3,300 42,300 26,400 3,400 0 51,700 29,700 New York 69,400 70,900 64,900 67,400 2,000 0 136,200 138,300 North Carolina 7,200 11,400 48,700 25,800 0 0 55,900 37,300 Pennsylvania 33,200 31,400 70,700 75,500 0 0 103,900 106,900 Rhode Island 100 400 4,600 5,100 0 0 4,700 5,500 South Carolina 9,300 5,600 7,900 30,200 0 0 17,200 35,800 Vermont 5,200 6,100 4,400 6,200 0 0 9,600 12,300 Virginia 10,700 7,500 47,100 37,800 0 0 57,800 45,300 West Virginia 600 500 4,300 1,900 0 0 4,900 2,400
Atlantic Flyway Total 161,700 178,100 506,600 452,700 6,700 0 675,000 630,800
Alabama 7,400 5,900 23,600 20,700 0 0 30,900 26,600 Arkansas 3,600 1,300 9,900 7,800 0 0 13,600 9,100 Illinois 15,700 27,700 95,500 78,300 0 0 111,200 106,000 Indiana 12,300 10,500 32,400 30,500 10,200 3,600 54,900 44,700 Iowa 0 0 73,700 47,300 0 0 73,700 47,300 Kentucky 10,800 3,000 30,100 9,900 0 0 40,900 12,900 Louisiana 0 0 0 200 0 0 0 200 Michigan 55,300 61,500 91,900 74,700 700 4,400 148,000 140,700 Minnesota 78,400 84,600 108,900 63,900 0 0 191,600 148,500 Mississippi 0 0 7,200 15,100 0 0 7,200 15,100 Missouri 0 0 35,100 45,700 0 0 35,100 45,700 Ohio 33,900 12,500 94,600 67,100 0 0 128,500 79,600 Tennessee 4,000 0 8,000 14,400 0 0 12,000 14,400 Wisconsin 27,900 22,600 57,900 67,800 0 0 85,800 90,400
Mississippi Flyway Total 249,300 229,700 668,800 543,500 11,000 8,000 933,400 781,300
Kansas 0 0 91,600 101,500 0 0 91,600 101,500 Nebraska 0 0 108,700 166,800 0 0 108,700 166,800 North Dakota 0 0 28,400 46,500 0 0 28,400 46,500 Oklahoma 0 0 111,000 113,900 0 0 111,000 113,900 South Dakota 0 0 2,400 2,900 0 0 2,400 2,900
Colorado 33,900 53,600 122,100 113,500 0 0 168,500 167,200 Oregon 0 0 75,600 49,300 0 0 75,600 49,300 Washington 54,100 25,500 78,900 51,600 0 0 135,500 77,100 Wyoming 0 0 36,900 33,600 0 0 36,900 33,600
Table 6. Preliminary estimates of the number of Canada geese harvested during the special September, regular, and special late seasons during the 2013 and 2014 hunting seasons.
30

Duc
k Sp
ecie
s Com
posi
tion
2013
2014
2013
2014
2013
2014
2013
2014
2013
2014
2013
2014
2013
2014
Mal
lard
01,
397
758
1,60
27,
500
3,00
09,
689
5,64
747
,579
56,0
9210
7,31
911
6,81
242
,549
30,9
27 B
lack
Duc
k18
,034
3,79
67,
296
12,8
1726
,773
12,9
9210
,661
10,7
3622
,433
21,4
1414
,436
10,8
7215
20
Gad
wal
l0
00
017
114
231
237
1,74
81,
504
4,19
13,
960
3,66
55,
434
Wig
eon
028
00
1,11
011
370
548
52,
231
1,56
48,
642
8,89
23,
098
2,95
3 G
reen
-win
ged
Teal
4,77
21,
792
471
03,
405
2,42
05,
244
3,93
126
,768
16,5
2216
,466
12,6
4013
,529
7,34
5 B
lue-
win
ged/
Cin
nam
on T
eal
00
384
018
724
656
11,
218
1,24
81,
639
3,88
25,
856
20,2
4210
,493
Nor
ther
n Sh
ovel
er0
00
00
6472
039
940
11,
071
06,
162
2,33
2 N
orth
ern
Pint
ail
612
8867
10
696
532
721
109
7,06
02,
729
4,85
03,
350
3,79
63,
903
Woo
d D
uck
00
00
320
598
3,14
03,
048
13,8
4217
,518
51,8
8458
,568
1,73
41,
316
Red
head
00
00
00
00
7235
83,
668
8,37
39,
409
13,6
93 C
anva
sbac
k0
00
00
00
00
01,
979
1,89
75,
318
11,3
44 G
reat
er S
caup
1,25
11,
151
234
010
548
692
1,34
92,
081
386
4,99
33,
484
156
2,55
1 L
esse
r Sca
up57
586
683
70
205
811,
404
407
2,06
01,
226
11,6
485,
715
8,96
414
,367
Rin
g-ne
cked
Duc
k2,
644
3,47
184
30
295
625
2,17
41,
456
5,94
46,
871
11,7
8011
,590
6,67
51,
456
Gol
dene
yes
4,10
737
355
20
1,38
621
12,
075
2,65
71,
773
2,60
24,
545
3,98
51,
065
1,39
5 B
uffle
head
00
550
620
430
01,
126
407
9,53
57,
036
1,50
01,
647
Rud
dy D
uck
00
00
00
00
00
01,
805
047
9 L
ong-
taile
d D
uck
183
269
00
361
980
065
738
81,
421
335
028
3 E
ider
s12
,531
5,51
40
035
584
164
30
1,68
32,
339
110
00
0 S
cote
rs36
822
40
080
198
911
00
2,78
22,
554
487
384
00
Hoo
ded
Mer
gans
er1,
472
8848
70
623
1,19
655
336
900
4,47
576
68,
193
031
5 O
ther
Mer
gans
ers
6,73
76,
797
539
01,
055
581
141
04,
030
1,22
55,
076
6,09
768
00
Oth
er D
ucks
00
00
00
00
134
00
00
0
Tota
l Duc
k H
arve
st53
,286
25,8
5413
,127
14,4
1945
,968
24,8
2038
,399
31,4
1614
6,55
014
2,21
426
8,74
928
0,68
812
8,69
411
3,92
2
Goo
se S
peci
es C
ompo
sitio
n C
anad
a G
oose
7,20
13,
659
14,3
7014
,766
12,6
168,
416
12,1
530
136,
417
135,
897
199,
784
222,
530
109,
547
82,8
94 S
now
Goo
se0
00
00
00
14,2
3057
,281
89,2
9252
90
2,52
86,
424
Blu
e G
oose
00
00
00
00
1,31
01,
248
489
04,
175
7,58
3 R
oss's
Goo
se0
00
00
00
00
023
10
1,44
886
5 W
hite
-fron
ted
Goo
se0
00
00
00
00
00
00
0 B
rant
00
00
00
00
00
00
00
Tota
l Goo
se H
arve
st7,
201
3,65
914
,370
14,7
6612
,616
8,41
612
,153
14,2
3019
5,00
822
6,43
720
1,03
322
2,53
011
7,69
898
,066
Mig
rato
ry B
ird P
erm
its S
old
17,5
4815
,953
1,74
21,
768
5,82
55,
289
6,18
25,
968
31,9
4332
,446
62,0
0961
,365
12,7
6512
,141
Tabl
e 7
. W
ater
fow
l har
vest
est
imat
es in
Can
ada
durin
g th
e 20
13 a
nd 2
014
hunt
ing
seas
ons (
estim
ates
cou
rtesy
of t
he C
anad
ian
Wild
life
Serv
ice)
.N
ewfo
undl
and
Prin
ce E
dwar
d Is
l.N
ova
Scot
iaN
ew B
runs
wic
kQ
uebe
cO
ntar
ioM
anito
ba
31

Duc
k Sp
ecie
s Com
posi
tion
2013
2014
2013
2014
2013
2014
2013
2014
2013
2014
2013
2014
2013
2014
Mal
lard
193,
591
163,
468
106,
935
93,7
3329
,986
26,9
960
092
30
044
054
6,82
950
0,11
4 B
lack
Duc
k0
00
00
00
00
00
099
,785
72,6
27 G
adw
all
18,8
6443
,710
10,7
0610
,261
237
758
00
00
00
39,8
9465
,806
Wig
eon
2,52
74,
316
2,71
011
,776
5,85
17,
970
00
461
00
027
,335
38,0
97 G
reen
-win
ged
Teal
6,96
93,
895
3,73
42,
768
1,62
64,
957
00
00
00
82,9
8456
,270
Blu
e-w
inge
d/C
inna
mon
Tea
l38
,943
25,2
7812
,572
6,37
732
854
00
00
00
078
,347
51,6
47 N
orth
ern
Shov
eler
15,4
5810
,943
7,05
16,
074
1,46
71,
248
00
00
00
31,6
8021
,906
Nor
ther
n Pi
ntai
l19
,243
30,7
1715
,786
20,9
962,
357
3,60
30
00
00
440
55,7
9266
,467
Woo
d D
uck
01,
387
00
2514
60
00
00
070
,945
82,5
81 R
edhe
ad5,
884
3,46
04,
106
3,51
775
00
00
00
023
,214
29,4
01 C
anva
sbac
k76
15,
703
6,05
124
80
115
00
00
00
14,1
0919
,307
Gre
ater
Sca
up0
00
00
00
00
00
09,
512
8,96
9 L
esse
r Sca
up1,
973
528
4,33
92,
411
134
524
00
00
00
32,1
3926
,134
Rin
g-ne
cked
Duc
k0
190
140
981,
050
00
00
00
30,4
5328
,358
Gol
dene
yes
1,59
016
01,
778
1,01
173
443
80
00
00
019
,605
12,8
32 B
uffle
head
358
389
1,75
54,
999
495
1,64
70
00
00
015
,444
16,1
97 R
uddy
Duc
k0
00
154
012
90
00
00
00
2,56
7 L
ong-
taile
d D
uck
00
00
00
00
00
00
2,62
21,
373
Eid
ers
00
00
00
00
00
00
15,3
228,
694
Sco
ters
00
00
00
00
00
00
4,54
84,
151
Hoo
ded
Mer
gans
er0
00
032
198
00
00
00
4,33
514
,801
Oth
er M
erga
nser
s0
00
021
316
40
00
00
018
,471
14,8
64 O
ther
Duc
ks0
00
00
00
00
00
013
40
Tota
l Duc
k H
arve
st30
6,16
129
3,93
717
7,52
316
4,46
543
,658
50,5
120
01,
384
00
880
1,22
3,49
91,
143,
163
Goo
se S
peci
es C
ompo
sitio
n C
anad
a G
oose
141,
655
161,
815
80,5
4610
0,40
811
,639
14,3
700
00
015
40
726,
082
757,
547
Sno
w G
oose
65,4
5265
,312
24,2
0538
,520
1,20
850
70
00
00
015
1,20
311
1,23
0 B
lue
Goo
se62
,383
55,7
795,
008
8,73
535
132
80
00
00
073
,716
73,6
73 R
oss's
Goo
se29
,478
30,2
693,
798
10,1
510
00
00
00
34,9
5541
,285
Whi
te-fr
onte
d G
oose
42,1
8165
,463
32,7
9921
,711
133
420
00
00
00
75,1
1387
,594
Bra
nt0
00
00
00
00
00
00
0
Tota
l Goo
se H
arve
st34
1,14
937
8,63
814
6,35
617
9,52
513
,331
15,6
250
00
015
40
1,06
1,06
91,
161,
892
Mig
rato
ry B
ird P
erm
its S
old
21,3
7620
,486
22,7
3623
,406
7,10
87,
473
4442
287
389
259
281
189,
844
187,
165
Tabl
e 7
(con
tinue
d).
Wat
erfo
wl h
arve
st e
stim
ates
in C
anad
a du
ring
the
2013
and
201
4 hu
ntin
g se
ason
s (es
timat
es c
ourte
sy o
f the
Can
adia
n W
ildlif
e Se
rvic
e).
Sask
atch
ewan
Alb
erta
Briti
sh C
olum
bia
Nun
avut
Nor
thw
est T
err.
Yuk
on T
errit
ory
Can
ada
Tota
l
32

33

34

Immatures per adult a
State and Flyway 2010 2011 2012 2013 2014Connecticut 1.5 1.2 1.0 0.9 1.1Delaware 0.9 1.2 1.2 2.0 1.8Florida --- --- --- --- ---Georgia 1.2 1.2 0.9 1.6 0.9Maine 2.7 1.9 2.5 1.4 1.4Maryland 1.1 1.5 1.4 1.1 1.2Massachusetts 1.1 1.0 1.4 0.9 1.3New Hampshire 1.1 1.2 1.9 2.3 1.6New Jersey 1.0 1.1 0.8 0.6 0.9New York 1.7 1.7 1.7 1.6 1.7North Carolina 1.4 1.1 1.3 1.5 1.6Pennsylvania 1.1 1.0 1.0 1.3 1.2Rhode Island 0.7 0.8 --- 1.2 0.9South Carolina 2.0 1.5 3.7 2.3 0.9Vermont 1.9 1.8 1.6 1.7 2.7Virginia 1.0 0.7 0.8 1.1 1.0West Virginia 1.2 1.4 1.2 0.7 0.6
Atlantic Flyway Total b 1.30 1.24 1.38 1.37 1.33
Alabama 1.2 1.2 1.6 1.0 1.1Arkansas 1.1 1.3 1.0 0.8 1.1Illinois 1.9 2.1 2.1 1.6 1.9Indiana 1.1 1.9 1.5 1.7 1.8Iowa 3.4 4.6 3.1 2.9 4.3Kentucky 1.2 1.3 1.3 1.7 1.4Louisiana 1.4 2.3 1.5 1.1 1.3Michigan 1.8 2.2 2.0 1.4 2.0Minnesota 2.9 4.7 4.5 3.5 5.4Mississippi 1.3 1.2 1.3 0.6 0.9Missouri 2.3 2.3 1.9 1.4 2.3Ohio 1.7 1.9 1.6 1.2 1.5Tennessee 1.6 1.3 1.5 0.9 1.3Wisconsin 2.9 3.5 2.9 2.6 2.6
Mississippi Flyway Total b 1.59 1.91 1.68 1.31 1.66
Table 8. Preliminary weighted age ratios of mallards in state harvests during the 2010-2014 hunting seasons as determined from Waterfowl Parts Collection Survey.
35

Immatures per adult a
State and Flyway 2010 2011 2012 2013 2014Colorado 0.9 1.6 0.9 1.0 1.1Kansas 1.3 1.2 0.7 0.9 1.1Montana 1.0 1.0 1.1 1.6 1.3Nebraska 1.3 1.2 1.0 1.1 1.5New Mexico 1.5 1.5 1.3 1.2 1.9North Dakota 2.4 3.7 3.2 2.6 3.2Oklahoma 0.6 0.7 0.4 0.6 0.7South Dakota 2.5 2.9 2.4 1.9 2.3Texas 0.9 0.9 0.7 0.8 1.0Wyoming 1.3 1.6 1.1 0.8 0.8
Central Flyway Total b 1.29 1.52 1.17 1.19 1.43
Arizona 1.4 2.4 1.7 1.3 1.6California 2.2 2.7 1.5 1.4 1.3Colorado 1.1 1.8 1.4 1.6 2.9Idaho 1.3 2.0 1.0 1.0 1.1Montana 1.2 2.2 1.0 1.2 0.9Nevada 3.2 3.7 1.3 1.3 1.7New Mexico 0.7 --- --- 0.9 1.8Oregon 1.5 2.1 1.5 1.3 1.5Utah 1.3 2.6 1.5 1.2 1.7Washington 1.4 2.0 1.4 1.6 1.2Wyoming 1.6 2.7 2.1 4.6 3.9
Pacific Flyway Total b 1.63 2.28 1.35 1.25 1.25
Alaska 3.2 4.0 3.8 2.4 3.7
U.S. Total b 1.53 1.85 1.46 1.28 1.50a Ratio not shown if based on a sample of less than 20 wings
Table 8 (continued). Preliminary weighted age ratios of mallards in state harvests during the 2010-2014 hunting seasons as determined from Waterfowl Parts Collection Survey.
b In estimating Flyway and U.S. ratios, the ratio for each state was weighed in proportion to the estimated harvest in that state as determined from the Harvest Information Program Waterfowl Harvest Survey.
36

Immatures per adult a, b
Species and Flyway 2010 2011 2012 2013 2014Mallard
Atlantic 1.30 1.24 1.38 1.37 1.33Mississippi 1.59 1.91 1.68 1.31 1.66Central 1.29 1.52 1.17 1.19 1.43Pacific 1.63 2.28 1.35 1.25 1.25
U.S. Total 1.53 1.85 1.46 1.28 1.50
Black duckAtlantic 1.43 1.23 1.44 1.43 1.07Mississippi 2.24 1.38 1.56 2.00 1.30
U.S. Total 1.58 1.27 1.47 1.56 1.12
Mottled duckAtlantic 0.69 1.20 0.80 2.45 1.12Mississippi 1.40 3.16 1.00 2.80 0.94Central 1.93 0.24 2.54 --- 2.71
U.S. Total 1.29 1.56 1.17 2.46 1.09
GadwallAtlantic 1.82 2.61 1.13 1.48 1.68Mississippi 1.72 1.82 1.21 1.25 1.32Central 1.68 1.38 0.95 1.25 1.29Pacific 1.34 1.46 0.84 1.13 1.32
U.S. Total 1.66 1.68 1.10 1.25 1.33
American wigeonAtlantic 1.79 1.43 0.99 1.03 0.68Mississippi 1.69 1.97 1.38 1.27 1.70Central 1.11 0.76 0.73 0.84 0.95Pacific 1.34 1.76 1.21 1.52 1.58
U.S. Total 1.41 1.48 1.08 1.24 1.35
Green-winged tealAtlantic 1.95 1.97 2.05 1.77 1.68Mississippi 1.61 2.00 1.60 1.80 1.48Central 1.68 1.81 1.39 1.71 1.53Pacific 0.87 1.28 0.93 1.35 1.30
U.S. Total 1.39 1.75 1.36 1.66 1.46
Blue-winged/Cinnamon tealAtlantic 0.97 1.97 1.25 0.98 0.85Mississippi 1.71 1.59 1.29 1.49 1.16Central 1.57 2.36 1.85 2.19 1.46Pacific 0.94 1.34 1.14 1.68 1.19
U.S. Total 1.52 1.79 1.39 1.62 1.24
Table 9. Preliminary weighted age ratios of ducks harvested during the 2010-2014 hunting seasons, by species and flyway.
37

Immatures per adult a, b
Species and Flyway 2010 2011 2012 2013 2014Northern shoveler
Atlantic 1.98 3.17 1.10 1.84 1.22Mississippi 1.57 1.89 1.10 1.69 1.61Central 2.28 2.05 1.14 2.38 1.83Pacific 1.51 2.21 0.79 1.29 1.35
U.S. Total 1.66 2.07 0.97 1.67 1.54
Northern pintailAtlantic 1.77 1.30 0.94 1.18 1.08Mississippi 2.03 1.67 0.89 1.71 1.11Central 1.31 0.90 0.79 1.06 1.13Pacific 1.24 1.44 0.71 0.98 1.10
U.S. Total 1.46 1.35 0.78 1.21 1.12
Wood duckAtlantic 1.20 0.90 1.09 1.45 1.33Mississippi 1.78 1.22 1.25 1.45 2.04Central 1.42 1.09 0.97 1.11 1.13Pacific 1.43 1.69 1.36 1.23 1.96
U.S. Total 1.54 1.12 1.19 1.43 1.69
RedheadAtlantic 1.93 2.30 0.92 1.46 1.94Mississippi 6.54 4.51 2.29 2.92 2.88Central 3.47 2.15 1.51 2.25 3.19Pacific 1.27 2.46 1.12 1.82 1.39
U.S. Total 3.69 3.03 1.62 2.32 2.80
CanvasbackAtlantic 0.58 1.24 0.45 0.80 1.72Mississippi 1.83 1.63 0.88 1.20 2.70Central 2.48 2.11 0.73 1.19 2.10Pacific 1.37 2.82 0.90 1.57 1.68
U.S. Total 1.51 1.91 0.83 1.24 2.17
Greater scaupAtlantic 0.57 0.86 0.79 1.85 1.15Mississippi 1.15 2.01 0.98 1.09 1.53Central --- --- --- --- ---Pacific 0.64 0.48 1.06 1.52 1.21
U.S. Total 0.80 1.22 0.95 1.38 1.45
Table 9 (continued). Preliminary weighted age ratios of ducks harvested during the 2010-2014 hunting seasons, by species and flyway.
38

Immatures per adult a, b
Species and Flyway 2010 2011 2012 2013 2014Lesser scaup
Atlantic 0.80 1.18 0.46 0.58 0.83Mississippi 1.54 1.55 0.66 1.15 0.86Central 1.23 1.29 1.09 2.22 0.78Pacific 1.07 1.29 2.07 1.41 1.82
U.S. Total 1.24 1.39 0.74 1.14 0.91
Ring-necked duckAtlantic 1.45 1.54 1.53 1.86 1.59Mississippi 2.37 2.15 1.97 2.21 2.40Central 1.09 1.42 1.03 1.49 1.24Pacific 1.75 1.90 2.17 1.61 2.14
U.S. Total 1.85 1.81 1.71 1.93 1.91
Common goldeneyeAtlantic 0.80 0.58 0.57 0.74 0.88Mississippi 0.94 1.39 1.06 1.26 1.41Central 0.84 0.98 1.24 1.23 0.81Pacific 0.83 1.16 1.11 0.91 0.64
U.S. Total 0.88 1.14 1.01 1.05 0.96
BuffleheadAtlantic 0.62 0.97 1.02 1.21 1.15Mississippi 0.94 1.49 0.96 0.80 2.05Central 0.45 0.94 0.81 0.62 0.76Pacific 1.02 1.31 1.18 0.73 1.10
U.S. Total 0.77 1.19 1.01 0.90 1.33
Ruddy duckAtlantic 0.63 2.64 1.39 1.50 2.36Mississippi 0.89 2.62 1.61 2.51 1.22Central 2.85 1.99 1.40 2.57 2.07Pacific 1.92 4.13 1.00 1.62 1.43
U.S. Total 1.16 2.68 1.37 1.84 1.64
Hooded merganserAtlantic 0.77 0.66 0.52 0.73 1.29Mississippi 1.09 1.06 0.60 1.22 2.18Central 0.75 0.83 0.66 0.65 1.59Pacific 3.83 1.74 1.17 0.95 1.20
U.S. Total 1.00 0.93 0.61 0.92 1.74
Table 9 (continued). Preliminary weighted age ratios of ducks harvested during the 2010-2014 hunting seasons, by species and flyway.
39

Immatures per adult a, b
Species and Flyway 2010 2011 2012 2013 2014Common merganser
Atlantic 1.51 1.62 1.39 1.28 1.33Mississippi --- 0.78 --- 2.26 1.31Central --- --- --- --- ---Pacific 1.03 1.86 0.39 0.90 1.06
U.S. Total 1.25 1.22 0.86 1.31 1.28
Red-breasted merganserAtlantic 1.27 1.17 0.56 1.38 2.76Mississippi --- 0.40 2.08 1.92 1.69
U.S. Total 1.33 0.89 1.01 1.72 1.96
Long-tailed duckAtlantic 0.77 0.34 1.03 1.52 0.40Mississippi 1.98 0.90 0.10 0.64 ---
U.S. Total 1.04 0.54 0.71 1.04 0.61
Common eiderAtlantic 0.30 0.21 0.38 0.18 0.29
U.S. Total 0.30 0.21 0.38 0.18 0.31
Black scoterAtlantic 0.66 0.59 0.67 1.27 0.30
U.S. Total 0.68 0.62 0.73 1.32 0.56
White-winged scoterAtlantic 0.76 2.02 --- 2.07 0.40Pacific --- 0.49 --- --- ---
U.S. Total 1.18 1.91 3.73 2.17 2.11
Surf scoterAtlantic 0.60 0.58 3.68 0.47 0.31Pacific --- 0.51 0.25 0.65 0.88
U.S. Total 1.08 0.71 2.52 0.55 0.50a Ratio not shown if based on a sample of less than 20 wings
Table 9 (continued). Preliminary weighted age ratios of ducks harvested during the 2010-2014 hunting seasons, by species and flyway.
b In estimating Flyway and U.S. ratios, the ratio for each state was weighed in proportion to the estimated harvest in that state as determined from the Harvest Information Program Waterfowl Harvest Survey.
40

Males per female a
State and Flyway 2010 2011 2012 2013 2014Connecticut 2.2 1.7 2.3 2.2 1.8Delaware 2.0 1.7 1.8 1.8 1.6Florida --- --- --- --- ---Georgia 1.3 2.1 1.7 1.9 2.1Maine 1.2 1.5 1.2 1.7 1.4Maryland 2.4 2.5 2.7 2.5 1.6Massachusetts 1.6 1.6 2.0 1.9 2.1New Hampshire 1.6 1.8 1.7 1.5 1.4New Jersey 1.7 2.5 1.7 1.6 1.6New York 1.8 1.7 1.9 1.9 1.8North Carolina 1.6 1.9 2.0 1.4 1.2Pennsylvania 2.2 2.2 1.8 2.1 1.8Rhode Island 2.3 1.8 --- 2.2 1.2South Carolina 2.0 2.3 1.2 2.1 2.5Vermont 1.4 1.5 2.0 1.7 1.7Virginia 2.1 2.2 1.9 1.6 1.6West Virginia 1.8 1.6 1.5 2.1 1.9
Atlantic Flyway Total b 1.84 1.95 1.83 1.87 1.67
Alabama 1.7 2.3 0.9 2.9 1.7Arkansas 2.3 2.4 2.3 2.6 2.2Illinois 2.1 2.6 1.8 2.5 1.8Indiana 2.3 2.4 2.5 2.0 2.3Iowa 2.5 2.2 2.4 2.6 2.0Kentucky 2.5 2.0 2.5 1.9 2.3Louisiana 1.9 1.2 1.7 1.5 1.8Michigan 2.0 2.0 2.1 2.5 1.4Minnesota 1.9 1.4 1.8 1.4 1.3Mississippi 2.1 2.1 2.3 3.0 3.3Missouri 3.1 2.3 2.9 2.6 2.7Ohio 3.0 2.6 2.3 3.0 2.8Tennessee 1.6 2.1 2.8 2.2 2.3Wisconsin 2.2 2.2 2.0 2.1 1.8
Mississippi Flyway Total b 2.20 2.12 2.16 2.26 2.04
Table 10. Preliminary weighted sex ratios of mallards in state harvests during the 2010-2014 hunting seasons as determined from Waterfowl Parts Collection Survey.
41

Males per female a
State and Flyway 2010 2011 2012 2013 2014Colorado 2.6 2.7 3.0 3.2 3.8Kansas 4.0 3.9 4.2 4.7 5.5Montana 3.7 3.3 3.2 4.9 3.7Nebraska 3.4 4.9 3.2 4.3 4.2New Mexico 4.3 3.1 6.0 3.8 2.1North Dakota 2.2 2.4 2.3 2.2 2.3Oklahoma 3.8 3.0 3.2 3.7 3.6South Dakota 3.4 3.0 2.5 3.1 4.0Texas 2.3 2.6 2.2 1.8 1.7Wyoming 4.0 2.9 2.8 2.5 3.5
Central Flyway Total b 3.04 3.03 2.77 3.03 3.12
Arizona 1.6 1.2 1.5 1.6 1.7California 2.2 2.1 2.2 2.5 2.5Colorado 2.9 2.7 2.1 2.6 2.2Idaho 3.1 2.6 3.1 2.9 2.9Montana 3.4 3.4 1.9 2.7 2.8Nevada 2.0 1.8 1.3 1.4 1.8New Mexico 3.1 --- --- 1.4 2.3Oregon 1.8 2.0 2.0 2.3 2.4Utah 2.9 2.4 2.1 2.1 1.7Washington 2.2 2.1 2.0 1.9 2.2Wyoming 2.4 1.6 1.6 2.1 1.5
Pacific Flyway Total b 2.30 2.17 2.22 2.38 2.39
Alaska 1.4 1.4 1.4 1.3 1.2
U.S. Total b 2.27 2.24 2.24 2.37 2.25a Ratio not shown if based on a sample of less than 20 wingsb In estimating Flyway and U.S. ratios, the ratio for each state was weighed in proportion to the estimated harvest in that state as determined from the Harvest Information Program Waterfowl Harvest Survey.
Table 10 (continued). Preliminary weighted sex ratios of mallards in state harvests during the 2010-2014 hunting seasons as determined from Waterfowl Parts Collection Survey.
42

Males per female a
Species and Flyway 2010 2011 2012 2013 2014Mallard
Atlantic 1.84 1.95 1.83 1.87 1.67Mississippi 2.20 2.12 2.16 2.26 2.04Central 3.04 3.03 2.77 3.03 3.12Pacific 2.30 2.17 2.22 2.38 2.39
U.S. Total 2.27 2.24 2.24 2.37 2.25
Black duckAtlantic 1.04 1.02 1.05 1.01 1.10Mississippi 0.67 1.70 1.11 1.32 1.00
U.S. Total 0.94 1.16 1.06 1.08 1.08
Mottled duckAtlantic 0.82 1.18 1.21 1.34 1.09Mississippi 1.18 0.78 1.10 1.38 1.07Central 0.96 1.14 1.71 --- 0.63
U.S. Total 1.07 0.91 1.22 1.31 1.01
GadwallAtlantic 1.77 1.15 1.33 1.90 2.17Mississippi 1.73 1.60 1.67 1.47 1.68Central 1.69 1.58 1.59 1.64 1.67Pacific 1.69 1.52 1.48 1.66 1.78
U.S. Total 1.72 1.57 1.62 1.55 1.71
American wigeonAtlantic 1.39 1.14 1.39 1.88 2.43Mississippi 1.85 1.52 1.63 1.42 1.19Central 1.85 1.90 1.99 1.94 1.73Pacific 1.62 1.41 1.48 1.54 1.57
U.S. Total 1.66 1.49 1.62 1.63 1.57
Green-winged tealAtlantic 1.14 1.35 1.28 1.21 1.39Mississippi 2.01 1.73 1.69 1.66 1.89Central 1.82 2.16 2.15 1.73 1.96Pacific 1.83 1.65 1.84 1.68 1.84
U.S. Total 1.84 1.74 1.78 1.64 1.84
Blue-winged/Cinnamon tealAtlantic 1.55 1.20 1.18 1.51 1.66Mississippi 1.51 1.58 1.46 1.68 1.79Central 1.58 1.53 1.38 1.47 1.63Pacific 1.72 1.04 1.47 1.26 1.22
U.S. Total 1.54 1.49 1.42 1.60 1.70
Table 11. Preliminary weighted sex ratios of ducks harvested during the 2010-2014 hunting seasons, by species and flyway.
43

Males per female a
Species and Flyway 2010 2011 2012 2013 2014Northern shoveler
Atlantic 1.32 1.52 1.50 1.44 1.84Mississippi 1.71 1.43 1.69 1.62 1.67Central 1.35 1.41 1.48 1.30 1.74Pacific 1.70 1.18 1.68 1.43 1.55
U.S. Total 1.63 1.33 1.64 1.47 1.65
Northern pintailAtlantic 2.43 1.78 1.13 2.36 2.02Mississippi 2.11 1.83 2.35 2.19 2.12Central 2.35 2.24 2.51 2.12 2.34Pacific 2.69 2.30 2.46 2.47 2.45
U.S. Total 2.40 2.12 2.39 2.25 2.30
Wood duckAtlantic 2.17 1.92 1.96 1.91 1.91Mississippi 1.86 1.98 1.83 1.93 1.81Central 2.05 2.15 2.09 2.20 2.27Pacific 1.77 1.64 1.88 1.58 2.09
U.S. Total 1.95 1.96 1.88 1.92 1.87
RedheadAtlantic 1.09 0.58 1.51 1.79 1.21Mississippi 1.14 1.22 1.84 1.69 1.50Central 1.38 1.50 1.50 1.62 1.61Pacific 1.16 1.68 1.41 1.57 1.83
U.S. Total 1.22 1.33 1.60 1.66 1.54
CanvasbackAtlantic 1.97 1.37 3.55 1.37 0.71Mississippi 1.72 0.99 1.12 1.22 1.32Central 1.16 0.74 1.40 1.42 1.49Pacific 1.03 0.91 1.17 1.16 1.02
U.S. Total 1.49 0.90 1.24 1.25 1.25
Greater scaupAtlantic 1.38 1.06 1.15 1.41 0.92Mississippi 0.73 1.18 0.89 0.94 0.97Central --- --- --- --- ---Pacific 1.61 2.14 1.33 1.98 1.30
U.S. Total 1.16 1.26 1.06 1.15 1.07
Table 11 (continued). Preliminary weighted sex ratios of ducks harvested during the 2010-2014 hunting seasons, by species and flyway.
44

Males per female a
Species and Flyway 2010 2011 2012 2013 2014Lesser scaup
Atlantic 2.32 2.24 3.58 2.87 2.66Mississippi 1.37 2.03 2.55 1.35 2.18Central 1.47 1.23 2.11 1.84 1.88Pacific 1.06 1.07 1.42 1.38 1.38
U.S. Total 1.52 1.74 2.49 1.70 2.05
Ring-necked duckAtlantic 1.18 1.11 1.55 1.65 1.35Mississippi 2.21 2.06 1.83 1.64 1.58Central 1.94 3.02 3.35 2.24 1.98Pacific 1.46 1.87 1.88 1.56 1.76
U.S. Total 1.82 1.79 1.87 1.70 1.60
Common goldeneyeAtlantic 1.35 2.58 1.94 2.24 0.88Mississippi 1.75 1.40 1.18 0.73 1.27Central 1.09 1.07 2.09 1.35 1.32Pacific 1.33 1.42 1.71 1.88 2.13
U.S. Total 1.44 1.48 1.59 1.31 1.46
BuffleheadAtlantic 1.74 1.90 1.37 1.67 1.76Mississippi 1.55 1.41 1.97 1.62 1.33Central 1.47 1.96 1.23 2.25 1.42Pacific 1.04 1.23 1.02 1.21 1.47
U.S. Total 1.52 1.59 1.41 1.60 1.51
Hooded merganserAtlantic 3.04 2.43 2.43 2.07 3.37Mississippi 2.82 1.54 1.60 3.03 2.25Central 5.40 1.77 5.42 1.24 2.44Pacific --- 1.99 3.17 --- 4.20
U.S. Total 3.00 1.86 2.10 2.20 2.63
Common merganserAtlantic 0.73 1.12 1.22 0.86 0.86Mississippi --- --- --- --- 0.81Central --- --- --- --- ---Pacific 0.88 1.34 1.20 0.82 0.65
U.S. Total 0.70 1.07 1.27 0.81 0.76a Ratio not shown if based on a sample of less than 20 wingsb In estimating Flyway and U.S. ratios, the ratio for each state was weighed in proportion to the estimated harvest in that state as determined from the Harvest Information Program Waterfowl Harvest Survey.
Table 11 (continued). Preliminary weighted sex ratios of ducks harvested during the 2010-2014 hunting seasons, by species and flyway.
45

Immatures per adult a, b
Species and Flyway 2010 2011 2012 2013 2014Canada goose
Atlantic 0.63 0.34 0.46 0.47 0.36Mississippi 0.55 0.52 0.40 0.39 0.37Central 0.60 0.64 0.56 0.36 0.47Pacific 0.45 0.50 0.45 0.60 0.59
U.S. Total 0.57 0.49 0.46 0.42 0.42
Snow gooseAtlantic 0.44 0.77 0.33 0.50 1.32Mississippi 0.30 0.62 0.22 0.99 0.45Central 0.42 0.31 0.37 0.23 0.48Pacific 0.59 0.84 0.74 0.35 0.49
U.S. Total 0.44 0.52 0.40 0.43 0.52
Blue gooseMississippi 0.54 0.64 0.36 0.64 0.27Central 0.59 0.89 0.51 0.46 0.74
U.S. Total 0.57 0.75 0.46 0.56 0.53
Ross' gooseMississippi --- --- --- --- ---Central 0.93 1.22 0.89 1.06 0.85Pacific 0.19 0.31 0.15 0.36 0.32
U.S. Total 0.60 0.74 0.56 0.79 0.86
Greater white-fronted gooseMississippi 0.46 1.06 0.35 0.48 0.52Central 0.70 0.87 0.70 0.76 0.67Pacific 0.94 0.71 0.77 0.43 0.52
U.S. Total 0.66 0.87 0.56 0.53 0.58
BrantAtlantic 0.52 0.68 0.27 0.05 0.26Pacific 0.51 1.01 0.39 0.12 0.53
U.S. Total 0.44 0.70 0.28 0.08 0.30a Ratio not shown if based on a sample of less than 20 wingsb In estimating Flyway and U.S. ratios, the ratio for each state was weighed in proportion to the estimated harvest in that state as determined from the Harvest Information Program Waterfowl Harvest Survey.
Table 12. Preliminary weighted age ratios of geese harvested during the 2010-2014 hunting seasons, by species and flyway.
46
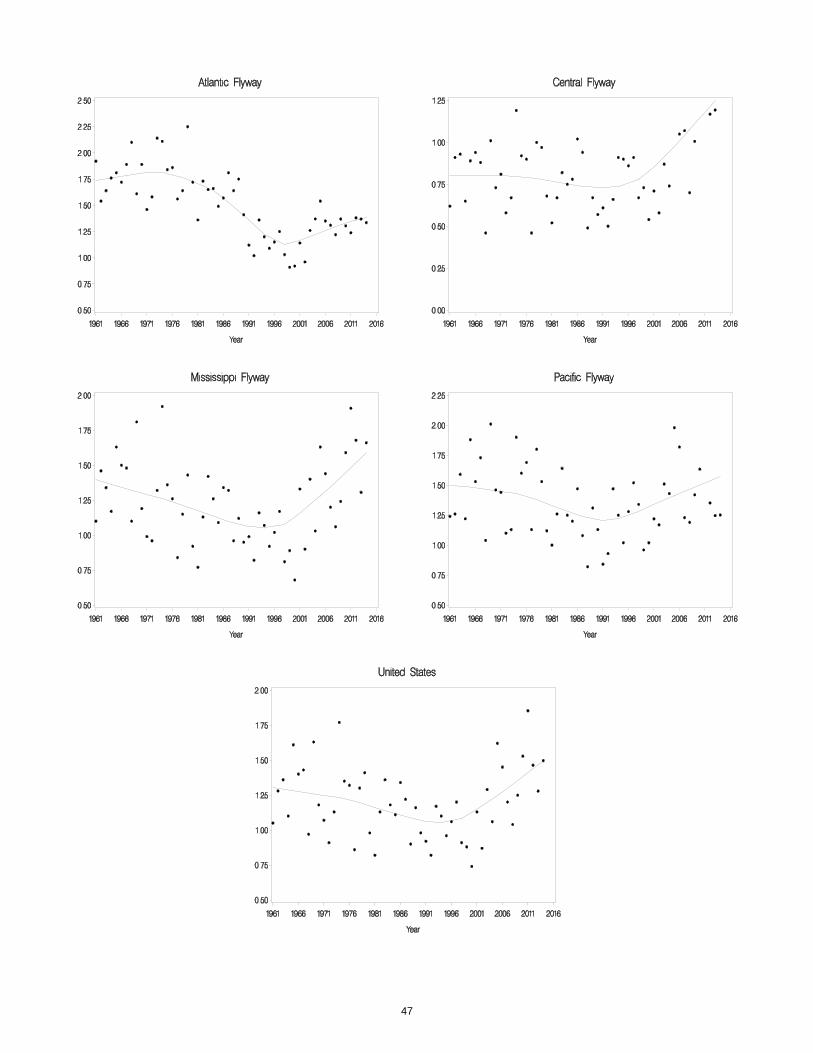
47

48

49

50

Stat
e an
dM
anag
emen
t Uni
t20
1320
1420
1320
1420
1320
1420
1320
14
Ala
bam
a63
4,20
0 ±
15%
467,
200
± 17
%36
,800
± 1
1%30
,600
± 1
2%91
,400
± 2
7%65
,900
± 1
4%17
.2 ±
19%
15.3
± 2
1%
Del
awar
e33
,100
± 5
7%13
,600
± 6
7%1,
800
± 42
%1,
100
± 52
%4,
500
± 48
%2,
400
± 65
%18
.1 ±
71%
12.8
± 8
5%
Flo
rida
200,
700
± 56
%15
5,40
0 ±
27%
10,9
00 ±
36%
9,30
0 ±
33%
31,9
00 ±
35%
28,0
00 ±
27%
18.4
± 6
6%16
.7 ±
42%
G
eorg
ia85
1,60
0 ±
46%
661,
600
± 14
%47
,600
± 2
2%39
,700
± 1
3%12
5,00
0 ±
35%
94,6
00 ±
14%
17.9
± 5
1%16
.7 ±
19%
Il
linoi
s42
6,60
0 ±
23%
380,
800
± 25
%24
,400
± 1
8%20
,200
± 1
6%67
,200
± 2
3%56
,600
± 2
1%17
.5 ±
29%
18.9
± 3
0%
Indi
ana
160,
100
± 20
%14
7,50
0 ±
38%
7,70
0 ±
21%
7,30
0 ±
18%
24,4
00 ±
18%
24,8
00 ±
32%
20.8
± 2
9%20
.1 ±
42%
K
entu
cky
632,
900
± 30
%25
5,00
0 ±
62%
29,5
00 ±
33%
14,2
00 ±
48%
82,3
00 ±
36%
33,2
00 ±
53%
21.5
± 4
5%17
.9 ±
78%
L
ouis
iana
625,
400
± 62
%17
2,20
0 ±
48%
24,8
00 ±
56%
15,2
00 ±
33%
74,7
00 ±
61%
38,3
00 ±
48%
25.2
± 8
3%11
.4 ±
58%
M
aryl
and
85,0
00 ±
22%
86,5
00 ±
25%
6,00
0 ±
22%
6,00
0 ±
21%
16,5
00 ±
30%
14,4
00 ±
22%
14.2
± 3
2%14
.5 ±
33%
M
issi
ssip
pi33
6,20
0 ±
24%
293,
400
± 25
%17
,200
± 1
5%13
,800
± 1
6%40
,500
± 2
2%39
,600
± 2
6%19
.5 ±
29%
21.2
± 3
0%
Nor
th C
arol
ina
555,
200
± 24
%62
6,10
0 ±
27%
43,5
00 ±
18%
39,8
00 ±
19%
93,8
00 ±
20%
90,6
00 ±
21%
12.8
± 3
0%15
.7 ±
33%
O
hio
37
1,60
0 ±
29%
168,
800
± 24
%19
,900
± 1
7%12
,000
± 1
9%65
,600
± 2
3%37
,100
± 2
0%18
.6 ±
33%
14.0
± 3
0%
Pen
nsyl
vani
a25
0,70
0 ±
61%
147,
200
± 27
%17
,700
± 2
4%19
,700
± 2
4%60
,300
± 3
1%57
,600
± 2
4%14
.2 ±
66%
7.5
± 36
%
Rho
de Is
land
1,30
0 ±
122%
1,20
0 ±
166%
200
± 55
%10
0 ±
80%
500
± 54
%40
0 ±
94%
6.9
± 13
4%13
.0 ±
184
%
Sou
th C
arol
ina
372,
200
± 32
%68
1,50
0 ±
28%
20,4
00 ±
25%
30,0
00 ±
18%
68,8
00 ±
30%
87,7
00 ±
28%
18.2
± 4
1%22
.7 ±
34%
T
enne
ssee
474,
500
± 29
%41
3,00
0 ±
27%
27,4
00 ±
19%
27,6
00 ±
20%
64,2
00 ±
26%
59,4
00 ±
24%
17.4
± 3
5%15
.0 ±
33%
V
irgin
ia25
1,50
0 ±
19%
160,
700
± 13
%16
,900
± 1
4%15
,600
± 1
5%40
,600
± 1
7%36
,000
± 2
4%14
.8 ±
24%
10.3
± 2
0%
Wes
t Virg
inia
15,0
00 ±
38%
7,00
0 ±
54%
1,30
0 ±
28%
500
± 35
%2,
300
± 34
%1,
300
± 48
%11
.5 ±
47%
13.5
± 6
4%
Wis
cons
in72
,800
± 3
5%51
,100
± 2
7%9,
000
± 31
%7,
500
± 29
%33
,600
± 3
4%23
,500
± 3
0%8.
1 ±
47%
6.8
± 40
% E
aste
rn U
nit T
otal
6,35
0,60
0 ±
11%
4,88
9,80
0 ±
8%36
3,10
031
0,20
098
7,90
0 ±
9%79
1,30
0 ±
7%0
0
Ark
ansa
s15
5,90
0 ±
46%
347,
900
± 29
%8,
900
± 41
%19
,900
± 2
0%30
,100
± 5
7%47
,900
± 2
8%17
.5 ±
62%
17.5
± 3
6%
Col
orad
o17
6,90
0 ±
25%
173,
100
± 19
%15
,600
± 1
5%14
,400
± 1
4%36
,900
± 1
9%27
,800
± 1
6%11
.3 ±
29%
12.0
± 2
4%
Iow
a21
4,30
0 ±
16%
130,
000
± 13
%12
,900
± 9
%9,
200
± 9%
49,4
00 ±
14%
27,1
00 ±
12%
16.6
± 1
8%14
.2 ±
16%
K
ansa
s50
4,40
0 ±
18%
485,
300
± 18
%31
,900
± 1
2%26
,200
± 1
1%93
,000
± 1
6%70
,700
± 1
4%15
.8 ±
22%
18.5
± 2
1%
Min
neso
ta53
,500
± 3
0%54
,800
± 2
9%7,
700
± 55
%6,
900
± 51
%17
,000
± 4
0%20
,200
± 5
9%7.
0 ±
62%
8.0
± 58
%
Mis
sour
i58
7,60
0 ±
28%
374,
200
± 17
%36
,400
± 1
1%24
,100
± 1
2%10
4,50
0 ±
18%
62,2
00 ±
15%
16.2
± 3
0%15
.5 ±
21%
M
onta
na12
,000
± 4
1%8,
500
± 37
%1,
700
± 46
%1,
400
± 40
%2,
900
± 41
%2,
900
± 44
%7.
1 ±
62%
6.0
± 54
%
Neb
rask
a23
9,80
0 ±
24%
172,
900
± 15
%13
,500
± 1
5%9,
700
± 13
%39
,300
± 1
9%26
,700
± 1
3%17
.7 ±
28%
17.7
± 2
0%
New
Mex
ico
123,
000
± 15
%11
5,20
0 ±
15%
6,50
0 ±
10%
7,60
0 ±
10%
23,7
00 ±
13%
24,1
00 ±
15%
18.9
± 1
8%15
.1 ±
18%
N
orth
Dak
ota
88,2
00 ±
37%
47,6
00 ±
22%
6,30
0 ±
29%
3,90
0 ±
26%
16,4
00 ±
28%
11,9
00 ±
30%
14.1
± 4
7%12
.2 ±
34%
O
klah
oma
421,
200
± 25
%41
7,90
0 ±
21%
23,3
00 ±
14%
19,1
00 ±
14%
69,4
00 ±
24%
56,9
00 ±
24%
18.1
± 2
8%21
.9 ±
25%
S
outh
Dak
ota
118,
300
± 31
%10
6,80
0 ±
25%
6,20
0 ±
22%
6,40
0 ±
20%
17,5
00 ±
26%
17,5
00 ±
23%
19.0
± 3
8%16
.7 ±
32%
T
exas
3,50
6,70
0 ±
18%
5,19
9,40
0 ±
14%
178,
900
± 13
%27
6,80
0 ±
10%
677,
900
± 16
%93
4,30
0 ±
13%
19.6
± 2
2%18
.8 ±
17%
W
yom
ing
34,2
00 ±
19%
21,1
00 ±
25%
3,10
0 ±
17%
1,50
0 ±
22%
7,20
0 ±
20%
3,50
0 ±
22%
10.9
± 2
6%13
.6 ±
33%
Cen
tral U
nit T
otal
6,23
6,00
0 ±
11%
7,65
4,70
0 ±
10%
353,
000
427,
100
1,18
5,30
0 ±
10%
1,33
3,60
0 ±
9%
A
rizon
a77
4,80
0 ±
18%
370,
000
± 10
%36
,300
± 1
6%24
,200
± 7
%13
4,30
0 ±
21%
65,6
00 ±
9%
21.3
± 2
4%15
.3 ±
12%
C
alifo
rnia
828,
300
± 11
%67
7,10
0 ±
13%
63,6
00 ±
8%
52,6
00 ±
9%
163,
200
± 9%
136,
000
± 13
%13
.0 ±
13%
12.9
± 1
6%
Idah
o15
7,30
0 ±
42%
111,
000
± 28
%13
,300
± 2
1%9,
900
± 19
%39
,100
± 3
2%25
,700
± 2
4%11
.9 ±
47%
11.2
± 3
4%
Nev
ada
31,9
00 ±
30%
24,8
00 ±
29%
3,80
0 ±
24%
2,70
0 ±
21%
9,90
0 ±
31%
6,60
0 ±
26%
8.4
± 39
%9.
1 ±
36%
O
rego
n28
,400
± 4
3%19
,600
± 3
1%3,
400
± 35
%3,
600
± 30
%10
,500
± 4
3%8,
800
± 36
%8.
3 ±
55%
5.5
± 43
%
Uta
h80
,200
± 8
0%34
,000
± 2
5%16
,000
± 3
3%5,
800
± 19
%31
,200
± 4
5%12
,200
± 3
2%5.
0 ±
87%
5.9
± 31
%
Was
hing
ton
42,5
00 ±
41%
28,4
00 ±
28%
4,80
0 ±
29%
3,40
0 ±
23%
11,5
00 ±
43%
6,90
0 ±
25%
8.8
± 50
%8.
3 ±
36%
Wes
tern
Uni
t Tot
al1,
943,
300
± 10
%1,
265,
000
± 8%
141,
200
102,
300
399,
800
± 9%
261,
800
± 8%
U.S
. Tot
al14
,529
,800
± 7
%13
,809
,500
± 6
%85
7,30
083
9,60
02,
572,
900
± 6%
2,38
6,70
0 ±
6%
2 Hun
ter n
umbe
r est
imat
es a
t the
man
agem
ent u
nit a
nd n
atio
nal l
evel
s may
be
bias
ed h
igh,
bec
ause
the
HIP
sam
ple
fram
es a
re st
ate
spec
ific;
ther
efor
e hu
nter
s are
cou
nted
mor
e th
an o
nce
if th
ey h
unt i
n >1
stat
e. V
aria
nce
ines
timab
le.
Tabl
e 13
. Pr
elim
inar
y es
timat
es o
f mou
rnin
g do
ve h
arve
st a
nd h
unte
r act
ivity
dur
ing
the
2013
and
201
4 hu
ntin
g se
ason
s 1 .M
ourn
ing
Dov
e H
arve
stA
ctiv
e H
unte
rs 2
Mou
rnin
g D
ove
Day
s Afie
ldSe
ason
al H
arve
st P
er H
unte
r
1 Var
ianc
e es
timat
es p
rese
nted
as 9
5% c
onfid
ence
inte
rval
as p
erce
nt o
f the
poi
nt e
stim
ate.
51

Stat
e an
dM
anag
emen
t Uni
t20
1320
1420
1320
1420
1320
1420
1320
14A
laba
ma
4,90
0 ±
67%
3,70
0 ±
87%
1,70
0 ±
66%
1,20
0 ±
61%
5,00
0 ±
63%
3,00
0 ±
71%
2.9
± 94
%3.
1 ±
106%
Del
awar
e0
00
00
00
0Fl
orid
a19
,500
± 5
0%8,
300
± 10
5%3,
900
± 70
%3,
000
± 75
%14
,500
± 6
9%6,
500
± 62
%5.
0 ±
86%
2.8
± 12
9%G
eorg
ia4,
300
± 18
7%1,
800
± 10
1%1,
600
± 17
2%1,
100
± 84
%4,
300
± 18
7%2,
100
± 71
%2.
7 ±
253%
1.6
± 13
1%Lo
uisia
na0
12,5
00 ±
124
%0
3,10
0 ±
75%
013
,900
± 1
10%
04.
0 ±
145%
Mar
ylan
d0
00
00
00
0M
ississ
ippi
1,70
0 ±
110%
1,50
0 ±
125%
600
± 10
4%40
0 ±
75%
1,30
0 ±
93%
1,30
0 ±
81%
2.9
± 15
1%3.
5 ±
146%
Nor
th C
arol
ina
00
00
00
00
Penn
sylv
ania
010
0 ±
194%
070
0 ±
147%
02,
100
± 15
2%0
0.1
± 24
4%R
hode
Isla
nd0
00
00
00
0So
uth
Car
olin
a<5
0 ±
194%
300
± 11
8%60
0 ±
183%
700
± 13
8%1,
400
± 16
0%1,
400
± 10
5%0.
1 ±
266%
0.4
± 18
2%V
irgin
ia30
0 ±
140%
010
0 ±
116%
050
0 ±
142%
02.
6 ±
182%
0Ea
stern
Uni
t Tot
al30
,600
± 4
3%28
,200
± 6
5%8,
400
10,3
0027
,000
± 5
0%30
,400
± 5
4%
Col
orad
o2,
300
± 73
%1,
500
± 57
%1,
700
± 50
%1,
900
± 45
%2,
800
± 42
%4,
200
± 49
%1.
3 ±
89%
0.8
± 72
%K
ansa
s2,
600
± 93
%2,
300
± 76
%1,
600
± 69
%1,
300
± 62
%4,
300
± 80
%4,
900
± 80
%1.
6 ±
115%
1.7
± 98
%N
ew M
exic
o33
,800
± 2
0%60
,900
± 2
4%3,
100
± 14
%4,
300
± 14
%13
,100
± 1
9%15
,600
± 2
0%10
.8 ±
24%
14.3
± 2
8%O
klah
oma
5,30
0 ±
86%
7,20
0 ±
85%
3,90
0 ±
45%
1,90
0 ±
52%
11,4
00 ±
61%
9,90
0 ±
95%
1.4
± 97
%3.
9 ±
100%
Texa
s1,
299,
700
± 28
%1,
767,
900
± 18
%93
,800
± 1
9%13
0,40
0 ±
14%
360,
000
± 22
%47
2,80
0 ±
17%
13.8
± 3
4%13
.6 ±
23%
Cen
tral U
nit T
otal
1,34
3,70
0 ±
28%
1,83
9,70
0 ±
17%
104,
300
139,
700
391,
500
± 21
%50
7,50
0 ±
16%
00
00
Ariz
ona
100,
000
± 35
%83
,800
± 1
8%18
,400
± 2
6%13
,300
± 1
0%60
,500
± 2
7%34
,800
± 1
2%5.
4 ±
43%
6.3
± 21
%C
alifo
rnia
48,9
00 ±
33%
54,4
00 ±
34%
12,7
00 ±
22%
13,0
00 ±
22%
31,8
00 ±
24%
36,7
00 ±
38%
3.8
± 40
%4.
2 ±
40%
Nev
ada
3,30
0 ±
111%
300
± 91
%60
0 ±
78%
200
± 73
%2,
500
± 10
8%40
0 ±
60%
6.0
± 13
5%1.
2 ±
117%
Uta
h0
200
± 79
%1,
100
± 18
1%30
0 ±
76%
1,10
0 ±
181%
2,10
0 ±
159%
00.
7 ±
109%
Wes
tern
Uni
t Tot
al15
2,20
0 ±
25%
138,
700
± 17
%32
,800
26,9
0095
,900
± 1
9%74
,000
± 2
0%
U.S
. Tot
al1,
526,
500
± 24
%2,
006,
600
± 16
%14
5,50
017
6,80
051
4,40
0 ±
16%
611,
900
± 14
%
Tabl
e 15
. Pr
elim
inar
y es
timat
es o
f ban
d-ta
iled
pige
on h
arve
st a
nd h
unte
r act
ivity
dur
ing
the
2012
and
201
3 hu
ntin
g se
ason
s 1 .
Stat
e an
dM
anag
emen
t Uni
t20
1320
1420
1320
1420
1320
1420
1320
14A
rizon
a90
0 ±
125%
700
± 83
%40
0 ±
137%
1,00
0 ±
43%
800
± 12
6%1,
900
± 49
%2.
3 ±
185%
0.8
± 93
%C
olor
ado
<50
± 14
0%40
0 ±
96%
200
± 39
%30
0 ±
35%
500
± 48
%80
0 ±
45%
0.2
± 14
5%1.
4 ±
102%
New
Mex
ico
200
± 30
%20
0 ±
67%
100
± 16
%20
0 ±
32%
400
± 26
%30
0 ±
36%
1.7
± 34
%1.
4 ±
75%
Uta
h50
0 ±
196%
100
± 17
2%30
0 ±
196%
100
± 75
%30
0 ±
196%
400
± 10
4%2.
0 ±
277%
2.0
± 18
8%In
terio
r Tot
al1,
600
± 92
%1,
500
± 52
%1,
000
1,50
02,
000
± 60
%3,
300
± 32
%
Cal
iforn
ia4,
700
± 50
%10
,700
± 7
5%2,
700
± 46
%2,
400
± 50
%4,
600
± 42
%7,
500
± 61
%1.
7 ±
68%
4.4
± 90
%O
rego
n1,
600
± 40
%1,
200
± 34
%40
0 ±
19%
400
± 14
%1,
200
± 29
%1,
100
± 22
%3.
8 ±
45%
2.9
± 37
%W
ashi
ngto
n50
0 ±
166%
200
± 52
%10
0 ±
0%10
0 ±
31%
400
± 10
7%20
0 ±
41%
3.6
± 16
6%2.
5 ±
61%
Paci
fic C
oast
Tota
l6,
700
± 38
%12
,000
± 6
6%3,
300
2,90
06,
200
± 33
%8,
800
± 52
%
U.S
. Tot
al8,
300
± 35
%13
,500
± 5
9%4,
300
4,40
08,
200
± 29
%12
,100
± 3
9%
1 Var
ianc
e es
timat
es p
rese
nted
as 9
5% c
onfid
ence
inte
rval
as p
erce
nt o
f the
poi
nt e
stim
ate.
2 Hun
ter n
umbe
r esti
mat
es a
t the
man
agem
ent u
nit a
nd n
atio
nal l
evel
s may
be
bias
ed h
igh,
bec
ause
the
HIP
sam
ple
fram
es a
re st
ate
spec
ific;
ther
efor
e hu
nter
s are
cou
nted
mor
e th
an o
nce
if th
ey h
unt i
n >1
stat
e. V
aria
nce
ines
timab
le.
2 Hun
ter n
umbe
r esti
mat
es a
t the
man
agem
ent u
nit a
nd n
atio
nal l
evel
s may
be
bias
ed h
igh,
bec
ause
the
HIP
sam
ple
fram
es a
re st
ate
spec
ific;
ther
efor
e hu
nter
s are
cou
nted
mor
e th
an o
nce
if th
ey h
unt i
n >1
stat
e. V
aria
nce
ines
timab
le.
Ban
d-ta
iled
Pige
on H
arve
stA
ctiv
e H
unte
rs2
Ban
d-ta
iled
Pige
on D
ays A
field
Seas
onal
Har
vest
Per H
unte
r
1 Var
ianc
e es
timat
es p
rese
nted
as 9
5% c
onfid
ence
inte
rval
as p
erce
nt o
f the
poi
nt e
stim
ate.
Tabl
e 14
. Pr
elim
inar
y es
timat
es o
f whi
te-w
inge
d do
ve h
arve
st a
nd h
unte
r act
ivity
dur
ing
the
2013
and
201
4 hu
ntin
g se
ason
s 1 .W
hite
-win
ged
Dov
e H
arve
stA
ctiv
e H
unte
rs 2
Whi
te-w
inge
d D
ove
Day
s Afie
ldSe
ason
al H
arve
st Pe
r Hun
ter
52

State andManagement Region 2013 2014 2013 2014 2013 2014 2013 2014 Connecticut 1,200 ± 52% 1,000 ± 45% 800 ± 31% 600 ± 32% 3,600 ± 33% 2,600 ± 42% 1.5 ± 61% 1.6 ± 55% Delaware 200 ± 103% 100 ± 105% <50 ± 93% 200 ± 155% 200 ± 109% 300 ± 119% 4.3 ± 139% 0.4 ± 187% Florida 1,000 ± 148% 500 ± 192% 1,800 ± 184% <50 ± 192% 3,800 ± 119% 300 ± 192% 0.6 ± 236% 18.0 ± 272% Georgia 800 ± 97% 1,900 ± 131% 800 ± 79% 3,700 ± 106% 2,500 ± 89% 8,100 ± 106% 1.0 ± 126% 0.5 ± 168% Maine 5,800 ± 43% 10,400 ± 61% 2,200 ± 46% 2,300 ± 45% 8,800 ± 35% 9,600 ± 47% 2.6 ± 63% 4.6 ± 76% Maryland 1,900 ± 107% 500 ± 48% 1,200 ± 96% 1,100 ± 99% 2,000 ± 81% 3,200 ± 94% 1.6 ± 143% 0.4 ± 110% Massachussetts 2,400 ± 44% 2,100 ± 28% 900 ± 39% 1,100 ± 28% 4,800 ± 34% 5,400 ± 33% 2.6 ± 59% 1.9 ± 40% New Hampshire 8,000 ± 29% 5,600 ± 40% 2,600 ± 29% 1,700 ± 35% 13,000 ± 25% 9,000 ± 40% 3.0 ± 41% 3.3 ± 53% New Jersey 7,400 ± 71% 3,600 ± 119% 2,000 ± 37% 400 ± 94% 11,000 ± 48% 3,800 ± 137% 3.7 ± 80% 9.4 ± 151% New York 11,700 ± 38% 8,400 ± 30% 3,900 ± 31% 4,700 ± 24% 15,300 ± 29% 22,300 ± 32% 3.0 ± 49% 1.8 ± 39% North Carolina 1,400 ± 95% 8,200 ± 174% 1,900 ± 134% 3,200 ± 125% 8,200 ± 106% 11,500 ± 135% 0.7 ± 164% 2.6 ± 215% Pennsylvania 8,200 ± 42% 6,600 ± 52% 6,400 ± 37% 5,000 ± 38% 29,600 ± 41% 20,000 ± 44% 1.3 ± 56% 1.3 ± 65% Rhode Island 300 ± 58% 400 ± 118% 100 ± 27% 200 ± 70% 400 ± 40% 900 ± 70% 4.0 ± 64% 1.6 ± 137% South Carolina 2,100 ± 177% 4,400 ± 130% 3,000 ± 109% 3,800 ± 93% 13,000 ± 127% 8,000 ± 94% 0.7 ± 208% 1.1 ± 160% Vermont 4,100 ± 39% 3,000 ± 32% 1,400 ± 34% 1,200 ± 27% 8,600 ± 56% 5,800 ± 32% 3.0 ± 51% 2.4 ± 42% Virginia 5,700 ± 80% 1,900 ± 67% 2,200 ± 65% 1,400 ± 80% 11,300 ± 112% 8,200 ± 91% 2.5 ± 103% 1.4 ± 105% West Virginia 300 ± 58% 200 ± 84% 200 ± 92% 300 ± 74% 600 ± 60% 800 ± 85% 1.6 ± 109% 0.7 ± 112% Eastern Region Total 62,500 ± 17% 58,600 ± 31% 31,400 31,000 136,700 ± 20% 119,700 ± 21% Alabama 1,400 ± 129% 800 ± 124% 1,000 ± 175% 100 ± 91% 1,500 ± 121% 400 ± 125% 1.4 ± 217% 15.0 ± 154% Arkansas 100 ± 195% 200 ± 139% 100 ± 137% 200 ± 96% 300 ± 140% 400 ± 102% 0.5 ± 238% 1.3 ± 169% Illinois 1,000 ± 142% 300 ± 132% 1,600 ± 128% 800 ± 169% 3,400 ± 119% 2,600 ± 162% 0.7 ± 191% 0.3 ± 214% Indiana 1,400 ± 84% 700 ± 43% 700 ± 77% 300 ± 100% 1,600 ± 58% 900 ± 88% 2.0 ± 114% 2.5 ± 109% Iowa 4,200 ± 80% 100 ± 92% 1,800 ± 85% 500 ± 137% 8,300 ± 118% 1,000 ± 134% 2.3 ± 117% 0.3 ± 165% Kansas <50 ± 183% <50 ± 183% 400 ± 192% 1,000 ± 111% 1,100 ± 193% 1,000 ± 107% <0.1 ± 265% <0.1 ± 214% Kentucky 2,800 ± 196% 100 ± 188% 1,000 ± 193% <50 ± 188% 1,900 ± 194% <50 ± 188% 3.0 ± 275% 5.0 ± 266% Louisiana 7,400 ± 169% 9,400 ± 132% 2,500 ± 165% 2,700 ± 87% 2,500 ± 165% 5,800 ± 95% 2.9 ± 236% 3.5 ± 158% Michigan 79,300 ± 28% 53,500 ± 29% 30,000 ± 19% 19,400 ± 21% 123,700 ± 24% 87,500 ± 19% 2.6 ± 34% 2.8 ± 36% Minnesota 18,600 ± 57% 23,900 ± 45% 10,900 ± 37% 13,500 ± 34% 74,700 ± 62% 47,500 ± 32% 1.7 ± 68% 1.8 ± 56% Mississippi 2,600 ± 164% 800 ± 113% 1,200 ± 127% 1,600 ± 109% 2,600 ± 131% 5,400 ± 135% 2.2 ± 207% 0.5 ± 157% Missouri 7,700 ± 176% 600 ± 66% 2,900 ± 91% 1,300 ± 123% 8,500 ± 117% 2,200 ± 112% 2.6 ± 198% 0.5 ± 139% Nebraska 0 1,400 ± 196% 600 ± 196% 400 ± 196% 600 ± 196% 1,100 ± 196% 0 4.0 ± 277% Ohio 8,600 ± 85% 300 ± 90% 3,000 ± 63% 1,600 ± 85% 8,600 ± 64% 4,500 ± 94% 2.9 ± 106% 0.2 ± 124% Oklahoma 300 ± 129% 100 ± 88% <50 ± 68% <50 ± 64% 200 ± 121% 100 ± 78% 8.4 ± 146% 2.8 ± 109% Tennessee 1,300 ± 185% 100 ± 192% 1,200 ± 192% 100 ± 94% 1,300 ± 179% 400 ± 117% 1.0 ± 267% 0.5 ± 214% Texas 5,500 ± 174% <50 ± 192% 4,900 ± 194% 100 ± 73% 5,200 ± 182% 200 ± 99% 1.1 ± 260% 0.4 ± 205% Wisconsin 38,400 ± 24% 49,300 ± 45% 14,500 ± 27% 16,200 ± 25% 60,000 ± 31% 66,400 ± 27% 2.6 ± 36% 3.1 ± 52% Central Region Total 180,600 ± 20% 141,500 ± 23% 78,400 59,600 306,100 ± 20% 227,600 ± 14%
U.S. Total 243,100 ± 15% 200,100 ± 18% 109,800 90,600 442,800 ± 15% 347,400 ± 12%
2 Hunter number estimates at the management unit and national levels may be biased high, because the HIP sample frames are state specific; therefore hunters are counted more than once if they hunt in >1 state. Variance inestimable.
Table 16. Preliminary estimates of woodcock harvest and hunter activity during the 2013 and 2014 hunting seasons 1.Woodcock Harvest Active Hunters 2 Woodcock Days Afield Seasonal Harvest Per Hunter
1 Variance estimates presented as 95% confidence interval as percent of the point estimate.
53

Stat
e an
dM
anag
emen
t Uni
t20
1320
1420
1320
1420
1320
1420
1320
14
Con
nect
icut
<50
± 17
6%10
0 ±
194%
100
± 16
8%<5
0 ±
194%
300
± 18
0%20
0 ±
194%
0.4
± 24
3%2.
0 ±
274%
D
elaw
are
100
± 11
2%10
0 ±
164%
<50
± 68
%10
0 ±
163%
400
± 82
%30
0 ±
153%
1.4
± 13
1%1.
0 ±
231%
F
lorid
a26
,100
± 6
6%44
,300
± 9
0%3,
400
± 80
%3,
200
± 80
%8,
200
± 55
%25
,800
± 1
42%
7.6
± 10
4%13
.9 ±
120
%
Geo
rgia
01,
300
± 18
8%0
100
± 11
0%0
300
± 12
6%0.
011
.0 ±
218
%
Mai
ne<5
0 ±
193%
600
± 16
0%<5
0 ±
193%
600
± 17
9%<5
0 ±
193%
3,60
0 ±
192%
1.0
± 27
2%1.
1 ±
240%
M
aryl
and
100
± 13
8%50
0 ±
196%
100
± 10
9%50
0 ±
196%
400
± 12
8%1,
000
± 19
6%2.
7 ±
176%
1.0
± 27
7%
Mas
sach
uset
ts10
0 ±
87%
100
± 17
1%20
0 ±
67%
<50
± 11
9%60
0 ±
81%
100
± 12
6%0.
6 ±
110%
10.5
± 2
08%
N
ew H
amps
hire
<50
± 18
6%10
0 ±
195%
<50
± 18
6%10
0 ±
195%
<50
± 18
6%10
0 ±
195%
1.0
± 26
3%1.
0 ±
276%
N
ew Je
rsey
00
<50
± 18
5%0
<50
± 18
5%0
0.0
0.0
N
ew Y
ork
100
± 13
5%10
0 ±
191%
100
± 11
0%30
0 ±
141%
200
± 11
4%90
0 ±
156%
0.7
± 17
5%0.
2 ±
238%
N
orth
Car
olin
a1,
200
± 19
6%1,
500
± 19
6%40
0 ±
196%
500
± 19
6%1,
600
± 19
6%1,
000
± 19
6%3.
0 ±
277%
3.0
± 27
7%
Pen
nsyl
vani
a0
3,20
0 ±
196%
080
0 ±
190%
02,
400
± 19
4%0.
03.
9 ±
273%
R
hode
Isla
nd0
00
<50
± 19
3%0
<50
± 19
3%0.
00.
0
Sou
th C
arol
ina
3,50
0 ±
112%
2,00
0 ±
94%
700
± 16
7%1,
300
± 12
6%1,
600
± 15
1%1,
500
± 11
7%5.
0 ±
201%
1.5
± 15
7%
Ver
mon
t<5
0 ±
127%
500
± 17
7%20
0 ±
180%
300
± 10
9%40
0 ±
175%
800
± 12
1%0.
2 ±
220%
1.8
± 20
8%
Virg
inia
1,70
0 ±
158%
1,00
0 ±
160%
300
± 14
9%30
0 ±
123%
1,50
0 ±
131%
900
± 13
6%6.
6 ±
218%
2.8
± 20
2%
Wes
t Virg
inia
00
<50
± 18
6%0
<50
± 18
6%0
0.0
0.0
Atla
ntic
Fly
way
Tot
al33
,000
± 5
4%55
,200
± 7
4%5,
500
8,30
015
,200
± 4
2%39
,000
± 9
7%0
00
00
0
Ala
bam
a1,
300
± 16
2%50
0 ±
165%
2,80
0 ±
132%
<50
± 13
3%3,
200
± 11
8%10
0 ±
136%
0.5
± 20
9%10
.0 ±
212
%
Ark
ansa
s3,
300
± 19
6%0
1,60
0 ±
196%
01,
600
± 19
6%0
2.0
± 27
7%0.
0
Illin
ois
00
00
00
0.0
0.0
In
dian
a20
0 ±
59%
1,30
0 ±
171%
100
± 36
%1,
200
± 93
%30
0 ±
48%
7,00
0 ±
126%
2.8
± 69
%1.
1 ±
194%
Io
wa
600
± 17
1%20
0 ±
84%
1,10
0 ±
132%
100
± 46
%2,
500
± 13
4%30
0 ±
59%
0.6
± 21
6%2.
9 ±
96%
K
entu
cky
00
00
00
0.0
0.0
L
ouis
iana
5,00
0 ±
127%
6,90
0 ±
105%
1,00
0 ±
138%
2,00
0 ±
106%
2,60
0 ±
109%
4,10
0 ±
94%
5.1
± 18
7%3.
5 ±
149%
M
ichi
gan
2,50
0 ±
147%
1,20
0 ±
164%
2,10
0 ±
160%
300
± 81
%18
,300
± 1
83%
900
± 12
3%1.
2 ±
217%
3.6
± 18
3%
Min
neso
ta5,
200
± 95
%0
2,80
0 ±
88%
1,40
0 ±
123%
6,10
0 ±
92%
2,10
0 ±
126%
1.9
± 12
9%0.
0
Mis
siss
ippi
00
070
0 ±
196%
01,
500
± 19
6%0.
00.
0
Mis
sour
i0
00
600
± 19
6%0
1,70
0 ±
196%
0.0
0.0
O
hio
050
0 ±
194%
0<5
0 ±
194%
020
0 ±
194%
0.0
10.0
± 2
74%
T
enne
ssee
00
00
00
0.0
0.0
W
isco
nsin
3,00
0 ±
163%
100
± 19
3%1,
400
± 17
5%1,
100
± 18
6%11
,400
± 1
71%
10,8
00 ±
193
%2.
2 ±
239%
0.1
± 26
8% M
issi
ssip
pi F
lyw
ay T
otal
21,2
00 ±
58%
10,7
00 ±
74%
13,0
007,
500
46,0
00 ±
86%
28,8
00 ±
82%
2 Hun
ter n
umbe
r est
imat
es a
t the
man
agem
ent u
nit a
nd n
atio
nal l
evel
s may
be
bias
ed h
igh,
bec
ause
the
HIP
sam
ple
fram
es a
re st
ate
spec
ific;
ther
efor
e hu
nter
s are
cou
nted
mor
e th
an o
nce
if th
ey h
unt i
n >1
stat
e. V
aria
nce
ines
timab
le.
1 Var
ianc
e es
timat
es p
rese
nted
as 9
5% c
onfid
ence
inte
rval
as p
erce
nt o
f the
poi
nt e
stim
ate.
Tabl
e 17
. Pr
elim
inar
y es
timat
es o
f sni
pe h
arve
st a
nd h
unte
r act
ivity
dur
ing
the
2013
and
201
4 hu
ntin
g se
ason
s 1 .
Snip
e H
arve
stA
ctiv
e H
unte
rs 2
Snip
e D
ays A
field
Seas
onal
Har
vest
Per
Hun
ter
54

Tabl
e 17
(con
tinue
d).
Prel
imin
ary
estim
ates
of s
nipe
har
vest
and
hun
ter a
ctiv
ity d
urin
g th
e 20
13 a
nd 2
014
hunt
ing
seas
ons 1 .
Stat
e an
dM
anag
emen
t Uni
t20
1320
1420
1320
1420
1320
1420
1320
14
Col
orad
o0
1,40
0 ±
195%
010
0 ±
195%
070
0 ±
195%
0.0
20.0
± 2
75%
K
ansa
s<5
0 ±
131%
0<5
0 ±
124%
<50
± 17
1%<5
0 ±
139%
<50
± 17
1%1.
5 ±
180%
0.0
N
ebra
ska
500
± 19
6%2,
200
± 14
5%50
0 ±
196%
800
± 12
9%50
0 ±
196%
2,00
0 ±
130%
1.0
± 27
7%2.
8 ±
194%
N
ew M
exic
o40
0 ±
194%
020
0 ±
192%
<50
± 17
9%40
0 ±
194%
<50
± 17
9%2.
0 ±
273%
0.0
N
orth
Dak
ota
200
± 56
%20
0 ±
58%
600
± 16
1%50
0 ±
165%
1,80
0 ±
164%
3,00
0 ±
177%
0.3
± 17
0%0.
3 ±
175%
O
klah
oma
500
± 13
1%<5
0 ±
188%
900
± 17
9%<5
0 ±
129%
2,60
0 ±
181%
300
± 15
8%0.
5 ±
222%
1.0
± 22
8%
Sou
th D
akot
a10
0 ±
126%
200
± 12
9%<5
0 ±
101%
<50
± 69
%10
0 ±
109%
200
± 13
1%4.
0 ±
161%
6.3
± 14
7%
Tex
as20
0 ±
137%
900
± 11
9%10
0 ±
133%
200
± 63
%10
0 ±
141%
600
± 83
%4.
0 ±
191%
3.9
± 13
5%
Wyo
min
g10
0 ±
84%
100
± 72
%<5
0 ±
53%
100
± 11
1%10
0 ±
62%
200
± 87
%2.
9 ±
99%
0.5
± 13
2% C
entra
l Fly
way
Tot
al1,
900
± 72
%5,
100
± 87
%2,
300
1,80
05,
600
± 10
3%7,
000
± 87
%
Ariz
ona
100
± 18
9%20
0 ±
126%
<50
± 13
4%10
0 ±
94%
300
± 18
0%10
0 ±
104%
3.5
± 23
2%4.
5 ±
158%
C
alifo
rnia
2,40
0 ±
77%
15,8
00 ±
190
%70
0 ±
133%
600
± 15
0%1,
400
± 77
%2,
500
± 16
5%3.
3 ±
154%
28.3
± 2
43%
Id
aho
7,90
0 ±
188%
4,70
0 ±
196%
800
± 18
5%40
0 ±
196%
3,90
0 ±
140%
900
± 19
6%9.
8 ±
264%
11.0
± 2
77%
M
onta
na30
0 ±
141%
100
± 11
6%10
0 ±
72%
400
± 18
5%20
0 ±
83%
1,70
0 ±
192%
3.7
± 15
8%0.
3 ±
218%
N
evad
a<5
0 ±
102%
200
± 11
4%10
0 ±
171%
200
± 12
8%10
0 ±
171%
800
± 16
5%0.
2 ±
199%
1.3
± 17
1%
Ore
gon
500
± 18
0%1,
000
± 16
2%80
0 ±
126%
200
± 85
%1,
000
± 10
7%70
0 ±
111%
0.6
± 22
0%5.
8 ±
182%
U
tah
700
± 11
2%50
0 ±
113%
300
± 96
%1,
200
± 69
%90
0 ±
151%
5,00
0 ±
86%
2.5
± 14
8%0.
5 ±
132%
W
ashi
ngto
n50
0 ±
70%
600
± 67
%20
0 ±
35%
400
± 13
3%80
0 ±
86%
1,10
0 ±
112%
3.1
± 78
%1.
4 ±
149%
Pac
ific
Flyw
ay T
otal
12,4
00 ±
122
%23
,300
± 1
36%
3,00
03,
500
8,60
0 ±
69%
12,8
00 ±
57%
A
lask
a60
0 ±
143%
600
± 18
0%1,
000
± 12
1%60
0 ±
184%
1,50
0 ±
127%
5,70
0 ±
192%
0.6
± 18
8%1.
0 ±
258%
U.S
. Tot
al69
,100
± 3
8%94
,900
± 5
5%24
,700
21,6
0076
,900
± 5
3%93
,200
± 5
0%
2 Hun
ter n
umbe
r est
imat
es a
t the
man
agem
ent u
nit a
nd n
atio
nal l
evel
s may
be
bias
ed h
igh,
bec
ause
the
HIP
sam
ple
fram
es a
re st
ate
spec
ific;
ther
efor
e hu
nter
s are
cou
nted
mor
e th
an o
nce
if th
ey h
unt i
n >1
stat
e. V
aria
nce
ines
timab
le.
Snip
e H
arve
stA
ctiv
e H
unte
rs 2
Snip
e D
ays A
field
Seas
onal
Har
vest
Per
Hun
ter
1 Var
ianc
e es
timat
es p
rese
nted
as 9
5% c
onfid
ence
inte
rval
as p
erce
nt o
f the
poi
nt e
stim
ate.
55

Tabl
e 18
. Pr
elim
inar
y es
timat
es o
f coo
t har
vest
and
hun
ter a
ctiv
ity d
urin
g th
e 20
13 a
nd 2
014
hunt
ing
seas
ons 1 .
Stat
e an
dM
anag
emen
t Uni
t20
1320
1420
1320
1420
1320
1420
1320
14
Con
nect
icut
00
100
± 19
4%0
100
± 19
4%0
0.0
0.0
D
elaw
are
100
± 12
5%1,
600
± 16
2%10
0 ±
60%
100
± 11
7%30
0 ±
91%
2,40
0 ±
181%
1.7
± 13
9%16
.3 ±
200
%
Flo
rida
2,80
0 ±
144%
42,1
00 ±
92%
200
± 13
7%3,
700
± 79
%60
0 ±
144%
18,4
00 ±
123
%15
.0 ±
199
%11
.5 ±
121
%
Geo
rgia
500
± 14
5%0
200
± 13
7%0
400
± 16
0%0
3.0
± 20
0%0.
0
Mai
ne0
100
± 19
2%<5
0 ±
193%
<50
± 19
2%<5
0 ±
193%
<50
± 19
2%0.
05.
0 ±
271%
M
aryl
and
200
± 17
4%50
0 ±
196%
100
± 93
%50
0 ±
196%
400
± 12
2%50
0 ±
196%
2.8
± 19
7%1.
0 ±
277%
M
assa
chus
etts
100
± 81
%20
0 ±
136%
<50
± 70
%<5
0 ±
72%
100
± 76
%10
0 ±
120%
1.3
± 10
7%10
.6 ±
154
%
New
Ham
pshi
re10
0 ±
157%
0<5
0 ±
124%
010
0 ±
124%
06.
5 ±
200%
0.0
N
ew Je
rsey
100
± 15
8%50
0 ±
192%
100
± 16
7%<5
0 ±
192%
300
± 13
1%<5
0 ±
192%
1.0
± 23
0%21
.0 ±
271
%
New
Yor
k2,
100
± 12
0%70
0 ±
125%
1,00
0 ±
92%
400
± 12
1%4,
200
± 11
7%1,
300
± 11
5%2.
2 ±
151%
1.7
± 17
4%
Nor
th C
arol
ina
11,7
00 ±
130
%1,
500
± 19
6%3,
400
± 11
1%50
0 ±
196%
6,90
0 ±
122%
500
± 19
6%3.
4 ±
171%
3.0
± 27
7%
Pen
nsyl
vani
a0
5,00
0 ±
185%
090
0 ±
180%
01,
900
± 16
4%0.
05.
8 ±
258%
R
hode
Isla
nd0
100
± 13
7%0
<50
± 14
4%0
<50
± 14
4%0.
02.
3 ±
199%
S
outh
Car
olin
a2,
500
± 19
2%4,
000
± 11
5%60
0 ±
190%
1,30
0 ±
133%
2,80
0 ±
173%
1,40
0 ±
122%
4.0
± 27
0%3.
1 ±
176%
V
erm
ont
<50
± 17
6%<5
0 ±
175%
200
± 19
0%<5
0 ±
175%
400
± 18
5%<5
0 ±
175%
0.1
± 25
9%2.
0 ±
247%
V
irgin
ia3,
400
± 17
7%80
0 ±
103%
300
± 12
8%20
0 ±
138%
1,50
0 ±
108%
1,10
0 ±
121%
11.5
± 2
19%
3.8
± 17
3%
Wes
t Virg
inia
00
<50
± 18
6%0
<50
± 18
6%0
0.0
0.0
Atla
ntic
Fly
way
Tot
al23
,600
± 7
5%57
,200
± 7
1%6,
300
7,70
018
,100
± 6
1%27
,800
± 8
4%
Ala
bam
a30
0 ±
116%
18,0
00 ±
143
%10
0 ±
92%
2,40
0 ±
134%
100
± 92
%4,
800
± 15
1%2.
3 ±
148%
7.4
± 19
6%
Ark
ansa
s1,
600
± 19
6%0
1,80
0 ±
177%
01,
800
± 17
7%0
0.9
± 26
4%0.
0
Illin
ois
100
± 19
5%20
0 ±
195%
1,10
0 ±
181%
100
± 19
5%10
,300
± 1
94%
100
± 19
5%0.
1 ±
266%
2.0
± 27
6%
Indi
ana
4,60
0 ±
185%
800
± 85
%60
0 ±
168%
400
± 16
0%3,
100
± 18
3%50
0 ±
123%
8.2
± 25
0%2.
2 ±
181%
Io
wa
500
± 52
%5,
300
± 16
0%10
0 ±
36%
600
± 14
8%50
0 ±
59%
1,80
0 ±
142%
3.4
± 63
%9.
2 ±
218%
K
entu
cky
00
00
00
0.0
0.0
L
ouis
iana
151,
700
± 66
%11
0,40
0 ±
82%
5,10
0 ±
59%
5,50
0 ±
65%
24,6
00 ±
81%
13,6
00 ±
63%
29.8
± 8
8%20
.1 ±
104
%
Mic
higa
n2,
300
± 19
6%9,
600
± 15
5%40
0 ±
134%
1,40
0 ±
168%
2,10
0 ±
145%
3,90
0 ±
179%
5.5
± 23
7%6.
8 ±
228%
M
inne
sota
7,30
0 ±
109%
11,4
00 ±
126
%1,
500
± 11
3%2,
500
± 94
%2,
100
± 93
%33
,600
± 1
47%
4.7
± 15
7%4.
6 ±
158%
M
issi
ssip
pi1,
400
± 19
6%0
700
± 19
6%0
2,80
0 ±
196%
02.
0 ±
277%
0.0
M
isso
uri
2,90
0 ±
196%
060
0 ±
196%
600
± 19
6%2,
900
± 19
6%60
0 ±
196%
5.0
± 27
7%0.
0
Ohi
o5,
200
± 11
7%80
0 ±
173%
2,30
0 ±
129%
800
± 16
4%4,
000
± 12
1%1,
300
± 13
0%2.
2 ±
174%
0.9
± 23
8%
Ten
ness
ee0
00
00
00.
00.
0
Wis
cons
in8,
700
± 90
%15
,900
± 1
24%
1,60
0 ±
155%
3,50
0 ±
102%
12,6
00 ±
154
%16
,300
± 1
34%
5.5
± 17
9%4.
5 ±
160%
Mis
siss
ippi
Fly
way
Tot
al18
6,50
0 ±
55%
172,
300
± 57
%16
,000
17,8
0066
,900
± 5
4%76
,400
± 7
3%
2 Hun
ter n
umbe
r est
imat
es a
t the
man
agem
ent u
nit a
nd n
atio
nal l
evel
s may
be
bias
ed h
igh,
bec
ause
the
HIP
sam
ple
fram
es a
re st
ate
spec
ific;
ther
efor
e hu
nter
s are
cou
nted
mor
e th
an o
nce
if th
ey h
unt i
n >1
stat
e. V
aria
nce
ines
timab
le.
1 Var
ianc
e es
timat
es p
rese
nted
as 9
5% c
onfid
ence
inte
rval
as p
erce
nt o
f the
poi
nt e
stim
ate.
Coo
t Har
vest
Act
ive
Hun
ters
2C
oot D
ays A
field
Seas
onal
Har
vest
Per
Hun
ter
56

Tabl
e 18
(con
tinue
d).
Prel
imin
ary
estim
ates
of c
oot h
arve
st a
nd h
unte
r act
ivity
dur
ing
the
2013
and
201
4 hu
ntin
g se
ason
s 1 .
Stat
e an
dM
anag
emen
t Uni
t20
1320
1420
1320
1420
1320
1420
1320
14
Col
orad
o2,
800
± 13
7%1,
600
± 13
3%1,
300
± 91
%60
0 ±
123%
6,50
0 ±
126%
1,90
0 ±
140%
2.1
± 16
5%2.
8 ±
181%
K
ansa
s1,
000
± 19
6%40
0 ±
186%
500
± 19
6%40
0 ±
192%
500
± 19
6%2,
500
± 19
5%2.
0 ±
277%
1.0
± 26
7%
Neb
rask
a1,
400
± 19
6%0
500
± 19
6%0
500
± 19
6%0
3.0
± 27
7%0.
0
New
Mex
ico
100
± 11
0%<5
0 ±
114%
<50
± 67
%<5
0 ±
79%
<50
± 84
%10
0 ±
87%
2.8
± 12
9%1.
6 ±
139%
N
orth
Dak
ota
1,90
0 ±
106%
1,20
0 ±
78%
700
± 14
8%60
0 ±
143%
1,60
0 ±
129%
2,80
0 ±
156%
2.9
± 18
2%2.
0 ±
162%
O
klah
oma
3,80
0 ±
102%
5,70
0 ±
145%
2,50
0 ±
109%
1,30
0 ±
135%
5,00
0 ±
133%
3,20
0 ±
158%
1.6
± 14
9%4.
4 ±
198%
S
outh
Dak
ota
1,30
0 ±
120%
300
± 75
%70
0 ±
133%
100
± 49
%1,
100
± 13
8%30
0 ±
98%
1.8
± 17
9%5.
0 ±
89%
T
exas
600
± 13
3%1,
800
± 85
%10
0 ±
89%
200
± 70
%30
0 ±
117%
900
± 96
%6.
0 ±
160%
8.7
± 11
0%
Wyo
min
g60
0 ±
120%
300
± 12
3%10
0 ±
108%
100
± 12
8%30
0 ±
98%
400
± 13
2%4.
0 ±
161%
3.2
± 17
8% C
entra
l Fly
way
Tot
al13
,500
± 5
2%11
,500
± 7
7%6,
400
3,30
015
,800
± 7
0%12
,100
± 7
2%
A
rizon
a30
0 ±
136%
1,30
0 ±
148%
100
± 94
%1,
200
± 16
7%50
0 ±
160%
1,40
0 ±
143%
5.0
± 16
5%1.
1 ±
223%
C
alifo
rnia
13,2
00 ±
58%
11,1
00 ±
93%
2,50
0 ±
77%
1,90
0 ±
87%
4,60
0 ±
49%
4,00
0 ±
77%
5.3
± 97
%5.
8 ±
127%
Id
aho
6,10
0 ±
194%
1,70
0 ±
154%
800
± 18
5%90
0 ±
138%
4,70
0 ±
144%
900
± 13
8%7.
6 ±
268%
2.0
± 20
7%
Mon
tana
100
± 14
8%30
0 ±
92%
<50
± 10
6%<5
0 ±
73%
200
± 11
5%30
0 ±
111%
2.7
± 18
2%6.
0 ±
117%
N
evad
a70
0 ±
80%
3,30
0 ±
177%
200
± 10
6%20
0 ±
101%
400
± 98
%1,
000
± 14
4%3.
2 ±
132%
13.6
± 2
04%
O
rego
n80
0 ±
117%
7,50
0 ±
115%
500
± 14
4%80
0 ±
117%
800
± 10
8%3,
300
± 11
9%1.
6 ±
185%
8.9
± 16
4%
Uta
h6,
400
± 80
%23
,300
± 7
6%1,
500
± 61
%3,
800
± 37
%2,
600
± 63
%13
,200
± 5
3%4.
4 ±
100%
6.2
± 85
%
Was
hing
ton
3,70
0 ±
76%
4,60
0 ±
165%
600
± 12
2%80
0 ±
109%
2,10
0 ±
78%
5,40
0 ±
164%
6.2
± 14
4%6.
1 ±
198%
Pac
ific
Flyw
ay T
otal
31,3
00 ±
49%
53,1
00 ±
46%
6,20
09,
600
15,8
00 ±
48%
29,4
00 ±
43%
U.S
. Tot
al25
4,90
0 ±
41%
294,
100
± 37
%34
,800
38,4
0011
6,70
0 ±
34%
145,
700
± 43
%
2 Hun
ter n
umbe
r est
imat
es a
t the
man
agem
ent u
nit a
nd n
atio
nal l
evel
s may
be
bias
ed h
igh,
bec
ause
the
HIP
sam
ple
fram
es a
re st
ate
spec
ific;
ther
efor
e hu
nter
s are
cou
nted
mor
e th
an o
nce
if th
ey h
unt i
n >1
stat
e. V
aria
nce
ines
timab
le.
Coo
t Har
vest
Act
ive
Hun
ters
2C
oot D
ays A
field
Seas
onal
Har
vest
Per
Hun
ter
1 Var
ianc
e es
timat
es p
rese
nted
as 9
5% c
onfid
ence
inte
rval
as p
erce
nt o
f the
poi
nt e
stim
ate.
57

Tabl
e 19
. Pr
elim
inar
y es
timat
es o
f gal
linul
e ha
rves
t and
hun
ter a
ctiv
ity d
urin
g th
e 20
13 a
nd 2
014
hunt
ing
seas
ons 1 .
Stat
e an
dM
anag
emen
t Uni
t20
1320
1420
1320
1420
1320
1420
1320
14D
elaw
are
0<5
0 ±
179%
<50
± 10
5%10
0 ±
177%
200
± 12
1%20
0 ±
141%
0.0
0.1
± 25
1%Fl
orid
a2,
100
± 19
5%2,
700
± 15
0%10
0 ±
195%
700
± 17
1%10
0 ±
195%
900
± 14
2%30
.0 ±
275
%3.
6 ±
228%
Geo
rgia
00
00
00
0.0
0.0
New
Jers
ey0
00
00
00.
00.
0N
ew Y
ork
080
0 ±
187%
050
0 ±
128%
03,
100
± 14
4%0.
01.
6 ±
226%
Nor
th C
arol
ina
00
00
00
0.0
0.0
Penn
sylv
ania
00
070
0 ±
196%
070
0 ±
196%
0.0
0.0
Sout
h C
arol
ina
600
± 19
1%0
<50
± 19
1%0
200
± 19
1%0
30.0
± 2
70%
0.0
Virg
inia
100
± 18
3%0
<50
± 18
3%<5
0 ±
181%
100
± 18
3%10
0 ±
181%
11.0
± 2
58%
0.0
Wes
t Virg
inia
00
<50
± 18
6%0
<50
± 18
6%0
0.0
0.0
Atla
ntic
Fly
way
Tot
al2,
800
± 15
3%3,
500
± 12
2%10
02,
000
700
± 84
%4,
900
± 98
%A
laba
ma
00
00
00
0.0
0.0
Ark
ansa
s0
00
00
00.
00.
0K
entu
cky
00
00
00
0.0
0.0
Loui
sana
13,2
00 ±
110
%1,
500
± 13
8%1,
300
± 10
4%20
0 ±
110%
4,60
0 ±
77%
1,10
0 ±
128%
10.2
± 1
51%
6.7
± 17
6%M
ichi
gan
00
010
0 ±
195%
010
0 ±
195%
0.0
0.0
Min
neso
ta10
0 ±
195%
010
0 ±
195%
100
± 19
5%10
0 ±
195%
100
± 19
5%1.
0 ±
275%
0.0
Mis
siss
ippi
00
00
00
0.0
0.0
Ohi
o0
00
00
00.
00.
0Te
nnes
see
00
00
00
0.0
0.0
Wis
cons
in2,
100
± 19
6%0
1,10
0 ±
191%
800
± 19
6%1,
200
± 17
9%8,
500
± 19
6%2.
0 ±
274%
0.0
Mis
siss
ippi
Fly
way
Tot
al15
,400
± 9
8%1,
500
± 13
8%2,
400
1,20
05,
800
± 71
%9,
800
± 17
0%
New
Mex
ico
0<5
0 ±
178%
0<5
0 ±
125%
0<5
0 ±
140%
0.0
1.0
± 21
8%O
klah
oma
00
800
± 19
6%60
0 ±
196%
800
± 19
6%2,
900
± 19
6%0.
00.
0Te
xas
2,80
0 ±
196%
02,
800
± 19
6%2,
600
± 19
6%2,
800
± 19
6%10
,500
± 1
96%
1.0
± 27
7%0.
0C
entra
l Fly
way
Tot
al2,
800
± 19
6%<5
0 ±
178%
3,60
03,
200
3,60
0 ±
160%
13,4
00 ±
159
%A
rizon
a0
200
± 16
0%0
800
± 18
3%0
5,10
0 ±
192%
0.0
0.2
± 24
3%C
alifo
rnia
200
± 12
1%<5
0 ±
185%
<50
± 10
5%<5
0 ±
130%
200
± 12
3%<5
0 ±
133%
8.3
± 16
1%1.
5 ±
226%
Nev
ada
100
± 19
4%0
100
± 13
7%10
0 ±
194%
100
± 13
7%30
0 ±
194%
0.5
± 23
8%0.
0Pa
cific
Fly
way
Tot
al30
0 ±
104%
200
± 13
9%20
080
030
0 ±
92%
5,50
0 ±
179%
U.S
. Tot
al21
,300
± 7
8%5,
200
± 92
%6,
300
7,30
010
,300
± 6
8%33
,700
± 8
7%
2 Hun
ter n
umbe
r est
imat
es a
t the
man
agem
ent u
nit a
nd n
atio
nal l
evel
s may
be
bias
ed h
igh,
bec
ause
the
HIP
sam
ple
fram
es a
re st
ate
spec
ific;
ther
efor
e hu
nter
s are
cou
nted
mor
e th
an o
nce
if th
ey h
unt i
n >1
stat
e. V
aria
nce
ines
timab
le.
Gal
linul
e H
arve
stA
ctiv
e H
unte
rs 2
Gal
linul
e D
ays A
field
Seas
onal
Har
vest
Per
Hun
ter
1 Var
ianc
e es
timat
es p
rese
nted
as 9
5% c
onfid
ence
inte
rval
as p
erce
nt o
f the
poi
nt e
stim
ate.
58

Tabl
e 20
. Pr
elim
inar
y es
timat
es o
f rai
l har
vest
and
hun
ter a
ctiv
ity d
urin
g th
e 20
13 a
nd 2
014
hunt
ing
seas
ons 1 .
Stat
e an
dM
anag
emen
t Uni
t20
1320
1420
1320
1420
1320
1420
1320
14
Con
nect
icut
<50
± 17
3%<5
0 ±
154%
100
± 18
2%<5
0 ±
154%
100
± 18
8%<5
0 ±
154%
0.1
± 25
1%19
.0 ±
217
%
Del
awar
e0
<50
± 14
7%<5
0 ±
105%
<50
± 12
6%20
0 ±
121%
100
± 15
2%0.
02.
5 ±
194%
F
lorid
a1,
100
± 14
8%<5
0 ±
194%
200
± 10
8%<5
0 ±
194%
500
± 14
2%<5
0 ±
194%
5.3
± 18
3%1.
0 ±
274%
G
eorg
ia0
1,60
0 ±
171%
01,
400
± 19
2%0
1,40
0 ±
188%
0.0
1.1
± 25
7%
Mai
ne0
1,00
0 ±
196%
050
0 ±
196%
03,
600
± 19
6%0.
02.
0 ±
277%
M
aryl
and
1,90
0 ±
194%
050
0 ±
187%
01,
200
± 16
4%0
3.9
± 26
9%0.
0
Mas
sach
uset
ts<5
0 ±
120%
0<5
0 ±
152%
<50
± 19
4%10
0 ±
137%
400
± 19
4%0.
5 ±
194%
0.0
N
ew Je
rsey
1,50
0 ±
87%
400
± 19
0%20
0 ±
115%
<50
± 19
0%40
0 ±
113%
<50
± 19
0%7.
3 ±
144%
21.0
± 2
69%
N
ew Y
ork
020
0 ±
191%
200
± 19
6%50
0 ±
128%
900
± 19
6%1,
800
± 13
1%0.
00.
4 ±
230%
N
orth
Car
olin
a0
00
00
00.
00.
0
Pen
nsyl
vani
a0
00
700
± 19
6%0
700
± 19
6%0.
00.
0
Rho
de Is
land
00
00
00
0.0
0.0
S
outh
Car
olin
a3,
000
± 70
%80
0 ±
134%
800
± 15
5%10
0 ±
107%
1,00
0 ±
125%
100
± 12
4%3.
9 ±
170%
12.0
± 1
71%
V
irgin
ia2,
000
± 79
%4,
100
± 49
%30
0 ±
131%
500
± 89
%40
0 ±
105%
800
± 63
%6.
9 ±
153%
7.9
± 10
2%
Wes
t Virg
inia
00
<50
± 18
6%0
<50
± 18
6%0
0.0
0.0
Atla
ntic
Fly
way
Tot
al9,
600
± 53
%8,
200
± 51
%2,
300
3,80
04,
800
± 63
%9,
000
± 90
%
Ala
bam
a0
00
00
00.
00.
0
Ark
ansa
s0
00
00
00.
00.
0
Illin
ois
00
00
00
0.0
0.0
In
dian
a20
0 ±
160%
400
± 14
1%40
0 ±
131%
200
± 16
6%50
0 ±
116%
300
± 15
1%0.
6 ±
207%
2.5
± 21
7%
Iow
a0
00
00
00.
00.
0
Ken
tuck
y0
00
00
00.
00.
0
Lou
isia
na7,
600
± 14
5%4,
700
± 17
5%50
0 ±
76%
800
± 17
8%3,
000
± 85
%1,
300
± 13
9%15
.8 ±
164
%6.
1 ±
250%
M
ichi
gan
400
± 13
4%3,
600
± 19
6%40
0 ±
134%
1,30
0 ±
186%
1,20
0 ±
134%
2,50
0 ±
186%
1.0
± 18
9%2.
8 ±
270%
M
inne
sota
00
100
± 19
5%70
0 ±
177%
100
± 19
5%1,
300
± 17
7%0.
00.
0
Mis
siss
ippi
00
00
00
0.0
0.0
M
isso
uri
1,10
0 ±
196%
060
0 ±
196%
060
0 ±
196%
02.
0 ±
277%
0.0
O
hio
900
± 19
6%0
900
± 19
6%<5
0 ±
193%
900
± 19
6%<5
0 ±
193%
1.0
± 27
7%0.
0
Ten
ness
ee0
00
00
00.
00.
0
Wis
cons
in10
0 ±
192%
010
0 ±
136%
900
± 19
0%40
0 ±
148%
8,60
0 ±
194%
1.5
± 23
5%0.
0 M
issi
ssip
pi F
lyw
ay T
otal
10,4
00 ±
110
%8,
600
± 12
5%2,
900
3,80
06,
500
± 57
%14
,100
± 1
24%
C
olor
ado
030
0 ±
194%
010
0 ±
194%
050
0 ±
194%
0.0
5.0
± 27
5%
Kan
sas
200
± 17
1%<5
0 ±
166%
<50
± 17
1%<5
0 ±
166%
<50
± 17
1%<5
0 ±
166%
55.0
± 2
42%
3.0
± 23
4%
Neb
rask
a0
600
± 19
4%0
100
± 13
6%0
400
± 13
7%0.
05.
5 ±
237%
N
ew M
exic
o20
0 ±
195%
<50
± 17
8%20
0 ±
195%
<50
± 12
5%20
0 ±
195%
<50
± 14
0%1.
0 ±
276%
0.5
± 21
8%
Okl
ahom
a3,
100
± 13
5%<5
0 ±
181%
1,50
0 ±
136%
600
± 19
4%3,
000
± 15
4%2,
900
± 19
4%2.
0 ±
192%
<0.1
± 2
65%
T
exas
030
0 ±
192%
<50
± 19
1%2,
700
± 19
4%<5
0 ±
191%
15,8
00 ±
195
%0.
00.
1 ±
273%
W
yom
ing
<50
± 16
7%0
<50
± 11
7%<5
0 ±
168%
<50
± 12
8%<5
0 ±
168%
1.5
± 20
4%0.
0 C
entra
l Fly
way
Tot
al3,
500
± 11
9%1,
200
± 11
6%1,
700
3,40
03,
300
± 14
3%19
,700
± 1
60%
U.S
. Tot
al23
,500
± 5
6%18
,000
± 6
5%6,
900
11,0
0014
,600
± 4
6%42
,700
± 8
6%
2 Hun
ter n
umbe
r est
imat
es a
t the
man
agem
ent u
nit a
nd n
atio
nal l
evel
s may
be
bias
ed h
igh,
bec
ause
the
HIP
sam
ple
fram
es a
re st
ate
spec
ific;
ther
efor
e hu
nter
s are
cou
nted
mor
e th
an o
nce
if th
ey h
unt i
n >1
stat
e. V
aria
nce
ines
timab
le.
Rai
l Har
vest
Act
ive
Hun
ters
2R
ail D
ays A
field
Seas
onal
Har
vest
Per
Hun
ter
1 Var
ianc
e es
timat
es p
rese
nted
as 9
5% c
onfid
ence
inte
rval
as p
erce
nt o
f the
poi
nt e
stim
ate.
59

Sora Virginia Clapper KingFlyway 2013 2014 2013 2014 2013 2014 2013 2014Atlantic 1,700 1,400 100 <50 7,800 6,900 0 0Mississippi 9,500 8,000 100 <50 800 600 <50 <50Central 3,400 1,100 100 <50 0 0 0 0
U.S. Total 14,500 10,500 300 100 8,600 7,500 <50 <50
Table 21. Preliminary estimates of rail harvest during the 2013 and 2014 hunting seasons. Species-specific estimates were derived from 5-year running averages of species composition estimates from the Migratory Bird Wing Collection Survey.
60

Appendix A. Names and affiliations of people who coordinate the Harvest Information Program or help provide hunter name and address data to the USFWS. Jim Robertson, Alabama Department of Conservation and Natural Resources Robert Bowles, Alaska Department of Fish and Game Anis Aoude, Arizona Game and Fish Department Susan Porter, Arkansas Game and Fish Commission Tony Straw, California Department of Fish and Game Ed Gorman, Colorado Parks and Wildlife Min Huang, Connecticut Department of Environmental Protection Matthew DiBona, Delaware Department of Natural Resources and Environmental Control Jamie Feddersen, Florida Fish and Wildlife Conservation Commission Michael Spencer, Georgia Department of Natural Resources Craig Weidmeier, Idaho Department of Fish and Game Don Bricker, Illinois Department of Natural Resources Adam Phelps, Indiana Department of Natural Resources Matthew VanGundy, Iowa Department of Natural Resources Mary Becker, Kansas Department of Wildlife, Parks, and Tourism Denise Boebinger, Kentucky Department of Fish and Wildlife Resources Michelle Rayburn, Louisiana Department of Wildlife and Fisheries Bill Swan, Maine Department of Inland Fisheries and Wildlife Brent Evans, Maryland Wildlife and Heritage Service Rick Kennedy and H Heussman, Massachusetts Division of Fisheries and Wildlife Kristen Shuler, Michigan Department of Natural Resources Margaret Dexter, Minnesota Department of Natural Resources Jason Thompson, Mississippi Department of Wildlife, Fisheries and Parks Julie Fleming, Missouri Department of Conservation Hank Worsech, Montana Fish, Wildlife and Parks Mark Vrtiska, Nebraska Game and Parks Commission Paula Lannen, Nevada Department of Wildlife Susan Perry, New Hampshire Fish and Game Department Barbara Stoff, New Jersey Division of Fish and Wildlife Kristin Madden, New Mexico Department of Game and Fish Vicky Wagenbaugh, New York Department of Environmental Conservation Bobby Dunn, North Carolina Wildlife Resources Commission Jerry Gulke, North Dakota Game and Fish Department Andrew Burt, Ohio Department of Natural Resources Rodney Derrick, Oklahoma Department of Wildlife Conservation Brandon Reishus, Oregon Department of Fish and Wildlife Terry Heckrote, Pennsylvania Game Commission Ed Ferris, Rhode Island Division of Fish and Wildlife Boyd Braxton, South Carolina Department of Natural Resources Corey Huxoll, South Dakota Game, Fish, and Parks Gary Clouse, Tennessee Wildlife Resources Agency Kevin Kraii, Texas Parks and Wildlife Department Heather Bernales, Utah Division of Wildlife Resources
61

Kris Nolan, Vermont Fish and Wildlife Department Bob Ellis and Gary Costanzo, Virginia Department of Game and Inland Fisheries Andrew Duff, Washington Department of Fish and Wildlife Michael Peters, West Virginia Division of Natural Resources Brian Dhuey, Wisconsin Department of Natural Resources Matthew Barnes, Wyoming Game and Fish Department
62

Appendix B. Names and affiliations of waterfowl wingbee participants.
Atlantic Flyway Wingbee, Laure, MD January 26 to 30, 2015 B. Bales, MD DNR; J. Bennett, MD DNR; A. Bessler, USFWS; P. Bosco, USFWS; A. Burdette, MD DNR; S. Cass, WV DNR; S. Chandler, USFWS; D. Collins, USFWS-OLE; L. Fenstermacher, PA Game Commission; C. Ferguson, Retired FWS ; E. Holmes, USFWS-OLE; A. Hunter, NC WRC; M. McBride, FWC; K. McCargo, NC WRC; F. McGilvery, Retired FWS; L. Ortiz, USFWS; P. Padding, USFWS; T. Pittman, University of MD; B. Raftovich, USFWS; B. Rau, USFWS; T. Roberts, USFWS; F. Rodnsuez, USFWS; B. Rosamond, USFWS; N. Sagwitz, MD DNR; B. Sharick, Retired NY DEC; J. Stempka, PA Game Commission; A. Stewart, USFWS; T. Sutter, NY DEC; M. Szymanski, ND Game & Fish; R. Trimbath, University of Akron; C. Tucker, AACRI; Walt Rhodes, USFWS; B. West, USFWS; C. Wicker, USFWS; K. Wilkins, USFWS; S. Yates, USFWS; Pam Garrettson, USFWS Mississippi Flyway Wingbee, Carbondale, IL; February 2 to 6, 2015 J. Ballard, USFWS; C. Bryan, USFWS; J. Carbaugh, AR Game and Fish; S. Chandler, USFWS; J. Coffman, OH Division of Wildlife; R. Colvis, KY DFW; J. Elbert, IA DNR; M. Ervin, OH Division of Wildlife; S. Ferrell, KY DFW; G. Fretueg, IL DNR; D. Fronczak, USFWS; D. Fuqua, TWRA; W. Futch, USFWS; C. Gaspard, LDWF; J. Hanks, LDWF; J. Hartleb, USFWS; H. Havens, MS DWFP; J. Hayer, MO DOC; J. Heise, MI DNR; M. Kapsch, USFWS; G. Knutsen, USFWS; A. Landon, OH Division of Wildlife; C. Light, MO DOC; A. Novarra, Retired USFWS; S. Pariseau, USFWS; D. Paulus, IA DNR; R. Peak, MN DNR; T. Perfer, USFWS; D. Rave, MN DNR; M. Richardson, MI DNR; L. Shupert, USFWS; A. Stetter, USFWS; S. Stoneski, AMERICORPS/USFWS; R. Vinson, USDA; J. Whitaker, LDWF; K. Wilkins, USFWS Central Flyway Wingbee, Emporia, KS; February 17 to 20, 2015 J. Andreasen, NE Game & Parks; L. Baker, TX P&W; Kevin Kraii, TX P&W; T. Bidrowski, KDWPT; J. Black, KDWPT; J. Bruffy, USFWS; S. Chandler, USFWS; V. Cikanek, KDWPT; D. Collins, USFWS; J. Dehoux, KDWP; J. Dubovsky, USFWS; M. Ealy, TPWD; B. Ferguson, NM DGF; A. Friesen, KDWPT; J. Gammomley, CO P&W; M. Grovijahn, SD GFP; L. Hancock, USFWS; D. Haneke, KDWP&T; A. Heyer, NE Game & Parks; A. Jackson, KDWP; J. Job, ND GFD; M. Johnson, ND GFD; J. Jones, USFWS; K. Kreigel, TX P&W; K. Kruse, USFWS; J. Laing, TX P&W; T. Liddick, USFWS; K. Madden, NM DGF; M. McGinnis, KDWPT; T. Menard, USFWS; R. Murano, SD GFP; J. Neal, OK Dept. of Wildlife; J. Richardson, OK Dept. of Wildlife; L. Roberts, WY G&F; N. Saake, Retired NV Dept of Wildlife; P. Schmidt, USFWS; K. Schoonover, OK Dept. of Wildlife; R. Schultheis, KDWPT; R. Stutheit, NE Game & Parks; M. Szymanski, ND GFD; P. Thorpe, USFWS; M. Vrtiska, NE Game & Parks; B. Walker, OK Dept. of Wildlife; R. Warhurst, Ducks Unlimited Pacific Flyway Wingbee, Anderson, CA; February 23 to 27, 2015 A. Anderson, USFWS; D. Base, WA DFW; C. Cain, USFWS; S. Chandler, USFWS; B. Czulinski, USFWS; C. Dau, USFWS; O. Duvuvuei, WA DFW; G. Gerstenberg, CA F&W; B. Gullett, IDFG; L. Haller, USFWS; J. Hunter, USFWS; J. Juarez, CA F&W; J. Kohl, USGS; J. Krueger, USFWS; J. Laughlin, USDA-APHIS-WS; B. Lowe, IDFG; B. Melton, USFWS; K. Neill, NV Dept. of Wildlife; S. Olson, USFWS; R. Prince, OR DFW; D. Rehse, CA F&W; B. Reishus, OR DFW; W. Rhodes, USFWS; K. Rogers, CA F&W; N. Saake, Retired NV Dept. of Wildlife; T. Sanders, USFWS; B. Sedinger, University of NV-Reno; B. Shults, USFWS; K. Smith, AK Dept. of Fish and Game; L. Souza, CA F&W; C. Terry, UNR; T. Thornton, OR DFW; A. Vande Voort, UT Division of Wildlife; K. Walton, OR DFW; M. Wilson, WA DFW
63

U.S. Fish and Wildlife ServiceDivision of Migratory Bird ManagementBranch of Harvest Surveys11510 American Holly DriveLaurel, Maryland, 20708-4002
http://www.fws.gov
July 2015
For State Transfer Relay Services: TTY/Voice: 771


