NBER WORKING PAPER SERIES U.S. FOREIGN TRADE AND ThE BALANCE OF PAYMENTS, 1800-1913 Robert E. Lipsey Working Paper No. 4710 NATIONAL BUREAU OF ECONOMIC RESEARCH 1050 Massachusetts Avenue Cambridge, MA 02138 April 1994 This paper was prepared, under the Bureau's program in International Trade and Investment, for eventual publication in the Cambridge Economic History of the United States. I am indebted to Robert Galiinan and Stanley Engerman for helpful comments and suggestions on the manuscript, and to Karl Widerquist and Qing Zhang for able research assistance. The opinions expressed are those of the author and do not necessarily represent those of the City University of New York or the National Bureau of Economic Research. This paper is part of NBER's research programs in International Trade and Investment and the Development of the American Economy.
Transcript
NBER WORKING PAPER SERIES
U.S. FOREIGN TRADE AND ThEBALANCE OF PAYMENTS, 1800-1913
Robert E. Lipsey
Working Paper No. 4710
NATIONAL BUREAU OF ECONOMIC RESEARCH1050 Massachusetts Avenue
Cambridge, MA 02138April 1994
This paper was prepared, under the Bureau's program in International Trade and Investment,for eventual publication in the Cambridge Economic History of the United States. I amindebted to Robert Galiinan and Stanley Engerman for helpful comments and suggestions onthe manuscript, and to Karl Widerquist and Qing Zhang for able research assistance. Theopinions expressed are those of the author and do not necessarily represent those of the CityUniversity of New York or the National Bureau of Economic Research. This paper is part ofNBER's research programs in International Trade and Investment and the Development of theAmerican Economy.
NBER Working Paper #4710April 1994
U.S. FOREIGN TRADE AND THEBALANCE OF PAYMENTS, 1800-1913
ABSTRACT
This paper reviews the main developments in U.S. trade and the balance of payments from
the first years of the 19th century to the first decade of the 20th.
American export trade was dominated by agricultural and other resource products long
after the majority of the labor force had shifted out of agriculture. The shift out of agriculture
was more rapid among the major trading partners of the United States because the American land
area increased in the first half of the nineteenth century and agricultural land increased
throughout the century. The rise in agricultural land area and a rapid decline in transport cost
increased the supply of U.S. agricultural products to Europe and further displaced European
agriculture and encouraged migration from Europe.
The existence of the large world market, relatively open to the products of American
comparative advantage and with a high price elasticity of demand for American exports,
encouraged the expansion of U.S. land, agriculture, capital inflows, immigration, and the western
migration of population.
Robert E. LipseyQueens College and the Graduate CenterC.U.N.Y.Flushing, NY 11367and NBER
1
U.S. TRADE AROUND 1800
Trade was on the minds of the entrepreneurs who financed the first
settlements in the Americas. They dreamt of riches -- the kind that could
come only from exploiting the natural resources of areas newly opened to
European settlement and exporting the products. They did not envisage
financing subsistence farmers or artisans, or manufacturing settlements
serving local markets.
As it turned out, the American colonies were, in their early days,
heavily involved in exporting. They probably exported something like a
quarter of their production in the early years of the 18th Century (Gallman
and Lipsey, in Davis, Easterlin, and Parker, 1972). By the end of the 18th
Century that export propensity had been cut in half. Thus, around 1800,
something like ten to fifteen per cent of U.S. output was exported (j.j and
Shepherd and Walton 1972, p. 44). To some extent, that decline in the export
propensity could be attributed simply to population growth - - larger countries
tend to trade less in proportion to their output than smaller countries - - but
the decline in exporting was too large for much of it to be attributed to that
cause.
Exports of domestic merchandise by the United States at the beginning of
the 19th century were about 3 per cent of world exports and five per cent of
Europe's exports at a time when the population of the United States was only
about 1/2 of 1 per cent of the world's population and 2 1/2 per cent of
Europe's (U.S. Bureau of the Census, 1975 and Bairoch, 1976a, Table 2, p. 18).
Thus in terms of exports of its own products per capita, excluding re-exports
of products made by others, the United States was twice as trade-oriented as
Europe, and more than five times as export-oriented as the world as a whole.
2
The United States was also heavily engaged as an intermediary in a variety of
indirect "triangular" trades, especially with the nearby European colonies.
If we measured the trade propensity by total exports, including re-exports,
the U.S. ratios would be about twice as high.
American exports in the early l800s were almost all natural resource
products. More than three quarters were the output of agriculture in 1803-07
and almost another fifth the output of forests and of the sea. Less than 5
per cent was the product of manufacturing industries (U.S. Congress, 1884,
Table 3). The industry origin of American exports in these years was similar
to that of 35 years earlier.
This almost total concentration of exports on natural resource products
at the beginning of the 19th Century, and the fact that it almost duplicated
the export trade pattern of the mid-18th Century. contrasts with indications
that the structure of production had already started to shift away from
primary products. If Bairoch's (1982) very rough estimates are to be believed,
the United States (or the area that was to become the United States) moved
from a level of per capita industrial output far below the world level, and
that of even China and India, in 1750, to a level above the average of
developed countries and of Europe as a whole around 1800, behind only the UK,
by a large margin, and Belgium and Switzerland by narrow margins. Thus, the
structure of production seemed to be changing faster than that of other
countries without altering the comparative advantage of the United States.
Most of the exports from the United States were destined for Europe
(over 60 per cent), about a quarter to Great Britain and Ireland. Those
shares represented a considerable decline from the period around 1770 (over 70
per cent to Europe, 57 per cent to Great Britain and Northern Ireland alone).
3
Almost all the exports not bound for Europe were destined for the West Indies
(29 per cent in 1768-72). New England's exports were largely to the West
Indies, as were half the exports of the middle colonies, while exports from
the southern colonies, the producers of cotton and tobacco, went over-
whelmingly to Great Britain. The southern colonies dominated exports to Great
Britain in 1768-72 (almost 90 per cent), the middle colonies, exports to
Southern Europe (over half), and New England and the middle colonies, exports
to the West Indies (three quarters) (U.S. Bureau of the Census, 1975, and
Shepherd and Walton, 1972, pp. 94-95).
The southern colonies were the most dependent on exporting before the
American Revolution. Their exports per capita were roughly twice as high as
those of New England and the middle colonies. Imports per capita were much
more similar among the regions, almost identical between New England and the
Middle Colonies on the one hand, and the southern colonies on the other
(Shepherd and Walton, p. 113).
A distinctive feature of U.S. trade at the turn of the century was the
exceptionally high share of re-exports in total exports. Over half of exports
consisted of re-exports, as opposed to exports of U.S. merchandise, in almost
every year from 1796 through 1808, until the embargo (U.S. Bureau of the
Census, 1975, Series 190-192).
This enormous re-exporting activity was a consequence of the European Wars
following the early l790s, in which Great Britain and France each attempted to
block the other's trade with its colonies. The effect "... was to throw into
our hands the greater part of the colonial carrying trade of the world - an
economic prize for which European nations had been fiercely struggling for
nearly two centuries" (Callender, Introduction to Chapter VI)." The valuable
4
articles of colonial produce, such as sugar, coffee, spirits, cocoa, indigo,
pepper, and spices of all kind, were carried by them, either directly to
Europe, or brought to the United States, and from thence exported in American
vessels. ... The manufactures of Europe, and particularly those of Great
Britain, as well as the manufactures and produce of the East Indies and China,
were, also, imported, and again exported in large quantities, to the West
Indies, South America and elsewhere. (Pitkin, as quoted in Callender, pp. 240-
241).
The United States not only accounted for a disproportionate share of
merchandise trade but also was heavily involved in the export of shipping
services. Earnings on ocean freight were about 30 per cent of export earnings
during the five years around 1800. The revenue from shipping was larger than
from exports of any commodity.
Imports of merchandise almost always exceeded exports at the beginning
of the nineteenth century. The negative trade balance was more than offset by
large freight earnings, but the U.S. had negative net balances on account of
other services, such as insurance and interest. The interest item reflected
the accumulated net current account deficit of earlier years, although during
the quinquennium around 1800, there was a small net outflow of capital from
the U.S. (North, 1960).
Wilkins (1989) estimated that America's long-term foreign obligations in
1803 were $65.70 million or more. These included foreign holdings of federal
debt (almost $5 million) plus over $15 million in holdings of corporate stock,
particularly stock in the Bank of the United States (pp. 48 and 646). If
Wilkins is correct that North had underestimated the foreign debt of the
United States, the estimates of interest payments and the current account
deficit mentioned above are also too low.
S
THE GROWTH OF TOTAL U.S. TRADE
The U.S. share of world trade
As the 19th century began, U.S. trade was a minor part of world trade.
Over the course of the century, that part grew, until in 1900 U.S. exports
were 15 per cent of world exports (Table 1). Some of that increase simply
reflected the growth of the U.S. population from about a half per cent of that
of the world in 1800 to around 5 per cent in 1900 and 1910.
The share of American domestic exports in the total of world export
trade was far above the U.S. population share and probably well above the U.S.
share in world output throughout the 19th Century. In other words, the U.S.
was more export-oriented than the average country. The export
U.S. domestic exports plus imports for consumption(imports passing through customs directly from abroadplus imports passing through customs from bond).For years when imports for consumption are not available,we use general imports minus exports of foreign merchandise(re-exports) as a substitute, assuming no change in inven-tories in bond.
Source: Rostow (1978), Table B-i, with data in £ multi-plied by 4.495, and U.S. Bureau of the Census (1975), Series U191through U194.
imports were not rising as fast as U.S. exports, as the U.S. reduced its
foreign borrowing relative to its trade, the combined share levelled off
earlier, before the end of the century. At its peak, the U.S. trade share was
something around twice the U.S. share of the world's population.
Whatever the measure used, the trend of U.S. trade during the 19th
century was one of increasing importance in the world market, particularly for
U.S. exports. That growth in importance in trade reflected in large part the
7
rising size of the U.S. in terms of population and production, particularly
the latter as U.S. growth in output per capita outpaced that of the rest of
the world.
Total Trade and Output
The proportion of U.S. output that was destined for foreign markets went
through some wide annual swings before the European peace settlement in 1815.
However, aside from a few years of embargo and war, the main trend in the
ratio of exports to aggregate U.S. output in current prices was a decline from
the 10-15 per cent of the 1790s and the much higher levels of the end of the
colonial period (Table 3). For the 100 years following the Napoleonic Wars
the average decade ratios ranged only from about 5 1/2 to 7 per cent. The
lowest export proportions were around 1830 and in the 1850s and the highest.
after the early period, were in the 20 years after 1890. The ratios for 1793
to 1860 are lower than those of the colonial period not only because trade
declined in importance but also because these national output measures in the
denominator include more non-market output - farm improvements and home
manufacturing - than earlier and later output measures. By their nature,
these forms of output are not likely to be exported. They declined from 15-20
percent to 7 or 8 per cent of conventionally measured output between 1800 and
1860. Thus a conventional output measure would show some continued decline in
the trade share in the early 1800s.
The ratio of exports to GNP in constant dollars tells something of the
8
Table 3
U.S. Merchandise Exports and Imports as Percent of CNP
Current Dollars 1860 Prices
Exports Imports Exports ImportsEarly Years1770 15-20 NA NA NA1790-1800 10-15 15-20 NA NA
aGDp data are the "broad concept" from Weiss. Trade data are 5-yearaverages around the reported year, except for 1810, which is a 3-yearaverage, 1809-1811, and 1860, which is a 3-year average, 1858-1860.
bGallman GNP data, 1834-1908, and Kuznets CNP data, 1899-1.913.CNP estimates from Rower (1989) and Gordon (1989) do not alter these trendssubstantially.
Sources: Trade data are from U.S. Bureau of the Census (1975), Series U19l,192, 193, and 194, and Lipsey (1972). Data are for exports of domesticmerchandise and imports for consumption. For 1790-1820 imports forconsumption are estimated as general imports minus reexports. National outputdata are from Galiman (1966), Lipsey (1963), for Kuznets data, and Weiss(1992) and (1993).
9
same story of lower dependence on export markets in the 19th century than
earlier. In any case, the greatest dependence on export markets for the U.S.
economy as a whole had ended before the 19th century began, and certainly
before the l820s.
The U.S. dependence on import trade was even greater than on export
trade in the period around 1770, perhaps a third of the colonies' production
or consumption. During the first half of the 19th century the import ratio
was above the export ratio, especially in the early years, but imports fell
below exports after the 1870s as the U.S. turned from capital importer to
capital exporter.
In real terms, imports fell even more than exports relative to the GNP,
but they followed the same path of decline to 1829-38 and then a recovery.
The highest dependence on imports, in real terms, was just before the Civil
War, after which the ratio fell by about a third.
One way to interpret the trade/output ratios is to think of growth in
trade that is no faster than growth in output as representing Npassive trade
behavior. Growth in trade more rapid than that in output, leading to a rise
in the trade/output ratio, can be thought of as "activeTM or even "aggressive"
trade behavior. Most of the period appears to be characterized by passive
trade behavior in this sense, but there was a fairly long stretch of years,
from the 1850s through the 1890s when American exporting became more
aggressive, and each decade saw some rise in the export ratio. However, no
such trend appears in the constant price series; the trend in the current
price ratios reflects a rise in export prices relative to domestic prices in
these decades.
10
THE U.S. BALANCE OF PAYMENTS AND CAPITAL FLOWS
For most of the period from the inauguration of George Washington to the
end of the 19th Century, the United States imported more merchandise than it
exported. Only in the last three decades of the century did exports exceed
imports, and that export surplus continued into the 20th Century (Table 4).
Table 4
Balance of Merchandise Trade and International Freight,and Interest Payments of the United States
Sources: Lewis (1938), pp. 445 and 560; U.S. Bureau of the Census(1975), Series U40, taken from North (1960) and Simon (1960),extended by cumulating Series Ul8 to U23. Estimates by Wilkins(1989), Tables 3.1 (pp. 50-52) and 5.4 (pp. 147-150) suggestsomewhat larger net liabilities in 1803, by perhaps $15million, and in 1914 by about $340 million.
13
These figures on net U.S. liabilities say that foreigners had some net
claim on part of the wealth of the United States throughout the 19th Century.
That is, foreigners' claims on U.S. wealth were larger than U.S. claims on
foreign wealth. One comparison of foreign claims with reproducible wealth
suggests that the net foreign claims amounted to almost 14 per cent of wealth
at the beginning of the century. That share fell to about 7 per cent by 1850,
4 per cent by 1900, and only two per cent on the eve of World War I (Davis.
1972, Table 8.12). More recent calculations by Callman (1992) that raise the
estimated value of reproducible wealth, but put a rather low figure on foreign
claims in comparison to Lewis (1938) and Wilkins (1989), are summarized in
Table 7. They describe a fall in the foreign claims from 13 per cent of
domestic capital, excluding land, in 1774 to 9 per cent at the end of the 18th
century, and then some sharp fluctuations through the 19th century. These
reflect not only inflows and outflows of capital and the rate of U.S. capital
formation, but also the effects of U.S. inflation, which tended at times to
reduce the ratio by raising the nominal value of U.S. capl.tal.
There are several ways to view the role of these flows of financial
capital in American development. One is as a source of financing for
aggregate capital formation, permitting faster accumulation of capital than
would have taken place if only domestic financing had been available. On this
basis, it is hard to suppose that imports of capital had a great influence on
the rate of development during most of the nineteenth century. The capital
inflows or changes in net foreign obligations were rarely more than 6 percent
of gross capital formation or of changes in the domestic capital stock of the
United States (Table 8). The major exceptions were 1815 to 1840 and the
period including the Civil War, 1860 to 1870, when the main foreign investment
Table 7
Net Foreign Claims as Per Cent of Value of Domestic Capitalin Current and 1860 Prices, 1774-1900
1869-78 81.5 131b 166C 49 40.2 4.0 NA 15.81879-88 78.0 14.1 30.9 2.7 28.9 3.4 NA 13.71889-98 72.5 16.8 27.6 2.5 24.6 3.9 NA 16.21899-1908 59.7 14.4 20.0 2.0 23.2 4.8 NA 23.31904-13 52.9 11.5 14.4 2.0 25.5 5.3 NA 27.3
5NAinly products of mines
bMeats and meat products only. The corresponding figure for 1879-88 is 10.0 percent.
cWheat and wheat flour only. Th. corresponding figure for 1879-1888 is 20.6
percent
Sources: 1770: U.S. Bureau of the Census (1975), Series Z 294. Data refer toBritish Continental Colonies.
1803-1850: U.S. Congress. House of Representatives (1884), Table 2.
1851-1860: U.S. Treasury Department (1860), Table 25, p. 401.
1869-1913: Lipsey (1963), Tables A-6, A-7, B-S. and C-S. Meats areIntermediate Class 106; animal products, 107 plus 114; vegetablefoods. 104 plus 113 minus 107. Tobacco is minor class 025.U.S. Bureau of the Census (1975), Vol. II, Series U 274-294.Meats and meat products ar, series U 285; wheat and wheat flouris series U 281, products of the forest an, series U 286,U 288, and U 289.
22
23
Within agriculture, the first half of the century saw the decline of
tobacco, the great colonial staple, and its replacement by cotton, which alone
accounted for half or more of exports from the 1830s to the beginning of the
Civil War. Cotton remained important for the rest of the century, and in the
years up to World War I, was still around a quarter of the value of all
exports.
A different view of changes in the composition of trade is provided by
broad economic classes of goods. Before the Civil War, the United States was
mainly an exporter of raw materials and foods. Raw materials alone were 60
per cent or more of exports, food exports were about 20-25 per cent, and semi-
manufactures and finished manufactures accounted for the rest, with the
finished goods rising in importance and the semi-manufactures declining
(Table 11).
The period after the Civil War saw very different trends. The share of
raw materials fell to around 30 per cent and food exports increased to replace
them, reaching a peak importance of over 40-45 per cent in the last two
decades of the 19th century and then declining to about a quarter just before
World War I. Thus raw materials and foods together remained overwhelmingly
predominant in exports almost until the eve of World War I, at 80 per cent or
close to it through the 1880s, and three quarters of the total through 1908.
The changing comparative advantage of the United States can be described
by a comparison of the role of resource products in exports as compared with
imports. By Vanek's (1963) definition of resource products (crude materials
and crude foods) the share of these products in exports fell from four times
that in imports to less than that in imports between 1820 and 1904-13, with
the sharpest drop coming between the beginning and end of the Civil War. By a
Table 11
Coiiposition of U.S. Exports and Iaports by Econoiaic Classes
Sourc.: U.S. Sureau of the Census (1975), Vol.11, Pp. 889-890.
24
25
broader definition of resource products that includes manufactured foods such
as flour and mat, the decline in the resource share was only about half as
large and the Civil War played less of a role. Since the value added in
manufacturing is relatively small in these industries the broader definition
seems more appropriate. Nevertheless, the shift away from U.S. comparative
advantage in resource products is very substantial, from an export share over
twice the share in imports to virtual equality.
All this is not to say that manufactured goods other than foods played
no role in exports. The share of finished manufactures started very low: a
little over 5 per cent in 1820 and still less than 10 per cent in 1840, but
reached over a quarter in the first two periods of the twentieth century, over
40 per cent for finished manufactures and semimanufactures together. Their
steady growth in importance was interrupted in the period from the Civil War
through the l880s as crude food exports pushed them aside for a time. As a
result, the share of finished manufactures in U.S. exports in the 1880s and
l890s (15 and 17 per cent) was not very high compared to that of "third world"
countries around 1900, about 11 per cent according to Bairoch and Etemad
(1985, Table 2.1), if we remove nonferrous metals from their manufactured
category for comparability.
On the import side, the United States began its existence as an importer
of finished manufactures, more than half the total at first. As these
products grew in importance among exports, they declined among imports. By
the beginning of the 20th century the United States was no longer a net
importer of finished manufactures from the rest of the world. The
manufactures share in exports grew from a tenth of that in imports in 1820-21
to more than the share in imports by 1904-13.
26
The Irtdustrv Distribution of Trade Relative to Outout and EmDloyment
The share of agriculture in American exports throughout the 19th century
did not reflect the transformation that was taking place more generally in the
American economy. In the economy as a whole, agriculture was shrinking in
importance throughout the 19th century. The share of agricultural output in
conventionally defined CDP fell from almost half in 1800 to a third in 1860
(Weiss, 1993). If farm improvement is included in agricultural output and it
and home manufacturing are included in CDP the decline appears more gradual
and concentrated in the period from 1840 to 1860. The general story of the
period, strongly influenced by the assumptions made in calculating GDP, is
that agriculture was already much more dependent on exports than other sectors
of the U.S. economy and that this dependence, as measured by the ratio of
exports to output, increased substantially up to the beginning of the Civil
War.
After the Civil War, farm gross product in current prices fell from
forty per cent or so of CNP in 1869 to twenty per cent in 1900 and only a
little over fifteen per cent in 1913, when the agricultural share in American
exports was still over half.
Estimates of the industrial distribution of the U.S. labor force also
show the shift out of agriculture, particularly after 1810 or 1820. The
contrast between the stability of agriculture's share in exports and the
decline in agriculture's share of the labor force is not quite as Strong in
Weiss' (1992) estimates - the agricultural share fell from 74 per cent in 1800
to 56 per cent in 1860 as in those of Lebergott (1966) and David (1967) - 83
per cent to 53 per cent over the same period. All tell a similar story,
however, of a large rise in the ratio of exports per worker in agriculture
27
relative to other sectors. Agriculture's share of the labor force continued
to fall in the second half of the century, from a little over half at the
beginning of the Civil War, to forty per cent in 1900 and a little over thirty
per cent by 1910, according to Lebergott (1966). Rapid as the decline in the
agricultural share of the U.S. labor force was from before the Civil War to
the beginning of World War I, the fall was even steeper in some other
countries. For example, in Great Eritain, the largest market by far for U.S.
exports, the share of the labor force in agriculture, forestry, and fishing
fell by more than half between 1861 and 1911 (Mitchell, 1978, p. 61), and the
share of agriculture alone fell by 60 per cent from 1841 to 1901, after a
decline of a third in the previous forty years (Kuznets, 1966, Table 3.2).
The combination of the falling importance of agriculture in production
and the labor force with its stubbornly high share in exports meant that
American agriculture was becoming increasingly dependent on exporting.
Agricultural exports were about a tenth of agricultural gross income in the
early 1800s, reached more than a fifth and at times almost a quarter in the
late 19th century, and were still close to a fifth through the beginning of
World War I (Table 12).
Thus the export dependence (exports/output) of the agricultural sector,
always high relative to that of the country as a whole, went from being twice
as high in the early 19th century to three and a half times as high during the
late nineteenth and early twentieth centuries.
The United States retained much of its comparative advantage in
agricultural products far into the period of industrialization and far into
the era when the United States was becoming a major industrial power. One
reason for this was that, in contrast to European countries, the United States
Table 12
Export Dependence (Exports/Output) of the U.S. and U.S. Agriculture
Source: 1810-1860: Table 3 and sources cited in Tables 3 and 10.
28
1869-1913: Lipsey, 1972. Tables 14.1 and 14.2. All these ratios areoverstated because the denominators are gross productoriginating, net of purchases of inputs from otherindustries, but the numerators are export values with nodeductions for purchased inputs.
aFood products, Tobacco products, Petroleum and coal products, and Forestproducts.
Source: Unpublished compilations by Phyllis A. Wallace. See National Bureauof Economic Research, Thirty-third Annual Retort, 1953 (New York,NBER, 1953). These ratios are lower than those of Table 12 becauseno deductions have been made here in the denominators for thepurchase of inputs from other industries.
Thus, in both agriculture and resource-oriented manufacturing industries, for
which export trade was relatively important - over ten per cent of production
at times - the importance of export markets was declining. Resources were
becoming less of a basis for American exports. In other manufacturing
industries, on the other hand, for which the resource base was less important,
36
exports rose as a per cent of production. That was particularly notable in
metal products, machinery, and transport equipment (Table 14).
Table 14
Export/Output Ratios for Selected Manufacturing Industries, 1869 and 1909(Per Cent)
1869 1909
Iron and steel products 1.7 4.2Nonferrous metal products 1.7 9.3
Machinery 3.2 7.7
Transportation equipment .8 3.2
Source: Same as Table 13
On the import side, the opposite changes were taking place. The shares
of imports in domestic consumption were declining sharply for manufacturing as
a whole and for almost every manufacturing group, the main exception being
forest products (Table 15).
Table 15
Import/Consumption Ratios (Per Cent), 1869 and 1909
The import share of goods consumed generally increased for the resource
industries, agriculture, fishing, and mining. In manufacturing, imports
provided sharply decreasing shares of most products. Thus the import data
give clear indications of the shift in American comparative advantage toward
manufacturing and away from natural resource products.
The Commodity Composition of tJ.S. Trade in Relation to World Trade
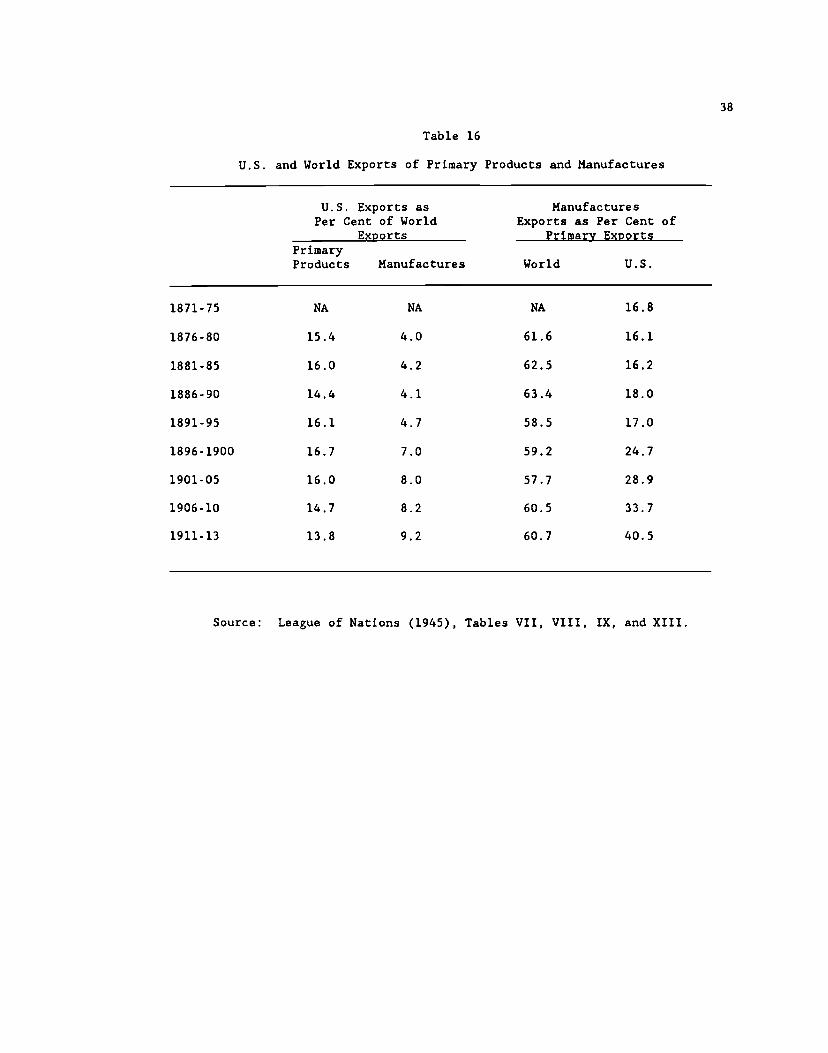
The changes in U.S. comparative advantage after the Civil War can be
illustrated by the comparison of the composition of U.S. exports with that of
world exports. The U.S. share of world exports of primary products fluctuated
over a fairly narrow range from the l870s through the first years of the
twentieth century and only fell somewhat in the decade or so before World War
I (Table 16). The U.S. share of world manufactured exports remained at about
4 per cent through the 1880s and then rose rapidly. Thus the shift in
comparative advantage on the export side took place only at the end of the
century despite the large shifts in U.S. production and employment mentioned
above.
Another way of seeing this change is by comparing the composition of
U.S. exports with that of world exports. The world ratio of manufactured
product to primary product exports was quite stable at around sixty percent
from the late 1870s through 1913. The U.S. ratio was far lower, reflecting
the U.S.comparative advantage as a primary product exporter, remaining at
about sixteen to eighteen per cent from the l870s through the early l890s.
Then, in the next twenty years, it rose to forty per cent, as the shift in
production and employment from primary products to manufacturing finally began
to be reflected in the composition of U.S. exports.
Table 16
U.S. and World Exports of Primary Products and Manufactures
U.S. Exports asPer Cent of World
Exports
ManufacturesExports as Per Cent of
Primary Exvorts
PrimaryProducts Manufactures World U.S.
1871-75 NA NA NA 16.8
1876-80 15.4 4.0 61.6 16.1
1881-85 16.0 4.2 62.5 16.2
1886-90 14.4 4.1 63.4 18.0
1891-95 16.1 4.7 58.5 17.0
1896-1900 16.7 7.0 59.2 24.7
1901-05 16.0 8.0 57.7 28.9
1906-10 14.7 8.2 60.5 33.7
1911-13 13.8 9.2 60.7 40.5
Source: League of Nations (1945), Tables VII, VIII, IX, and XIII.
38
39
THE DIRECTION OF U.S. TRADE
Changes in the Destination of Exvorts and the Origin of Imoorts
American exports were directed mainly to Europe from the country's
earliest days, and almost all that did not go to Europe were shipped to
European colonies in the West Indies (Table 17). Since much of the trade
pattern in these years reflected the effects of the Napoleonic Wars and the
British blockade of Europe, some of the West Indies trade may have been
disguised trade with Europe or a temporary substitute for European trade.
The concentration of American exports on Europe increased over most of
the 19th century, despite the growth of the industrial economy of the U.S.
That growth was presumably giving the United States the capability of being
more of a competitor to Europe in manufacturing, and less of a supplier of raw
materials and foods, but the increasing focus on Europe as a market lasted
through the l880s, and was only sharply reversed after the l89Os. The same
was true for the role of the U.K., which grew as a destination of U.S. exports
from less than a quarter at the beginning of the 18th century. despite the
ties of language and tradition, to over half in the l870s and 1880s before
falling back rather steeply after 1900. Some of the former UK share went to
Germany in the late 19th century and some of it went to the Western
Hemisphere, as U.S. exports began shifting to less developed areas of the
world.
Europe was about as important as a source of imports as it was as a
destination for exports in the early decades of the 19th century (Table 18).
However, for imports the trend in the European share was steadily downward,
from two thirds or so to about half before World War I. The decline in the
British share, and also in the French share, was steeper, while the German
40
Table 17
Distribution of U.S. Exports (Including Re-Exports), by Destination1790-1913
Europe Axnerica
Total Total UK Germany Total Canada
Per Cent
1790-98 100 62 21 16 38' NA
1799-1808 100 62 22 8 38' NA
1809-18 100 69 28 3 31' NA1819-28 100 64 34 3C
1829-38 100 71 43 - 27 3
1839-48 100 73 47 - 24 5
1849-58 100 73 48 - 23 8
1860 100 75 51 4 21 7
1869-78 100 81 54 9 17 6
1879-88 100 81 52 8 14 5
1889-98 100 79 48 11 16 6
1899-1908 100 72 36 14 19 8
1904-1913 100 66 30 14 25 12
- — less than 0.5 per cent.
'Total minus Europe
bTotal minus Europe, 36 per cent, Asia, 2 per cent.
Cl82l28
Source: U.S. Bureau of the Census (1975), Series U 317-334. Accordingto Pitkin (1816), pp. 215-217, almost all the exports to •/erica' in 1795-1802 (36 per cent of the total, excluding exports to 'Florida and Louisiana')were to the West Indies.
Table 18
Distribution of U.S. General Imports, by Origin1795-1913
Total
Eurooe America bJ.jg
TotalTotal UK Franc. Germany Total Canada Cuba Brazil
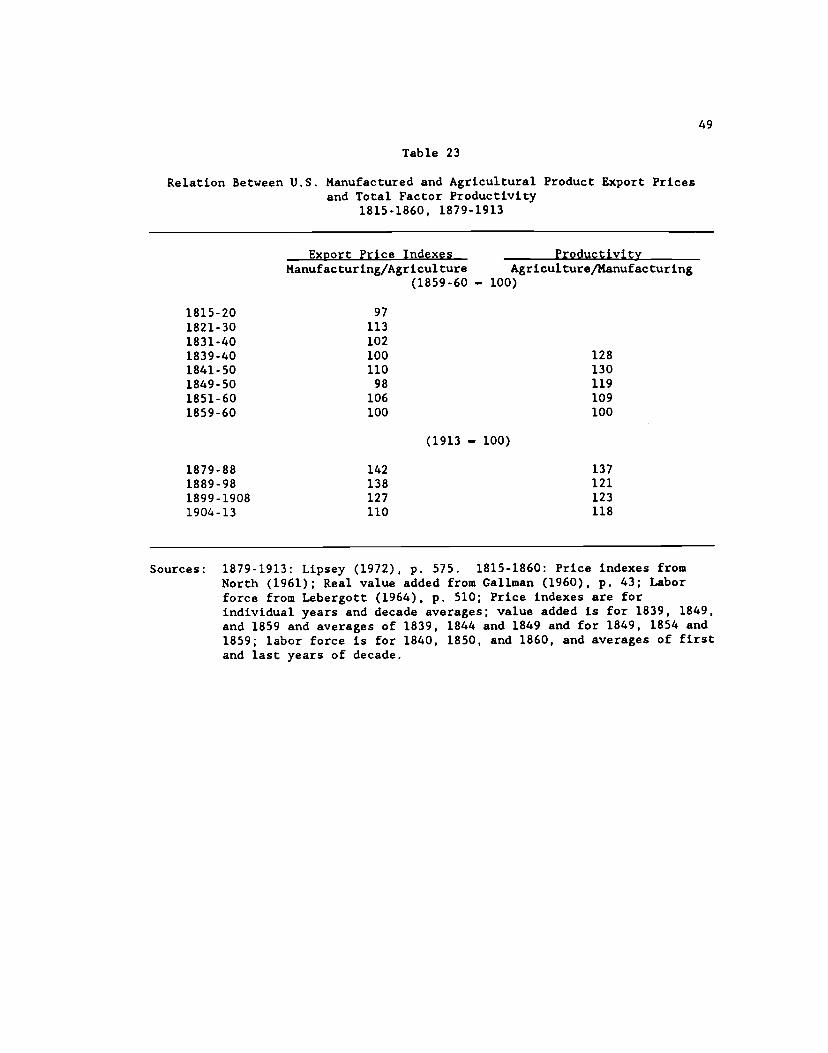
Sources: 1879-1913: Lipsey (1972), p. 575. 1815-1860: Price indexes fromNorth (1961); Real value added from Galiman (1960), p. 43; Laborforce from Lebergott (1964), p. 510; Price indexes are forindividual years and decade averages; value added is for 1839, 1849,and 1859 and averages of 1839, 1844 and 1849 and for 1849, 1854 and1859; labor force is for 1840, 1850, and 1860, and averages of firstand last years of decade.
50
change accounted for about sixty per cent of the relative export price change.
In the twenty years before the Civil War, a similar relative growth in
manufacturing productivity did not have any counterpart in export price
developments; the export price ratio for manufactured goods rlative to
agricultural products was quite stable. In the earlier period also, from
1815-20 to 1839-40 there was little change in the export price ratio. In this
earlier period too, a comparison of Sokoloff's (1986) productivity measures
for selected manufacturing industries with the Towne and Rasmussen (1960)
productivity measures for agriculture suggests that manufacturing productivity
was growing much faster than agricultural productivity.
There are several possible reasons why the productivity and price ratios
do not match before 1860. After 1830, North's (1961 Appendix II, Table IV)
export price index is dominated by cotton manufactures and to a much smaller
extent, tobacco manufactures, both of which enjoyed productivity growth more
rapid than that in agriculture (tobacco manufactures only after 1850,
according to Sokoloff). However, both industries' outputs included large
elements of agricultural input and that may explain why North's manufactures
price index rises by an amount identical to that of the raw material price
index, dominated by cotton and tobacco.
Before 1830, the products in North's manufactures price index do not
match Sokoloff's list well, the largest item in the price index being soap,
not included by Sokoloff, and the second being tobacco manufactures, which not
only include a large agricultural input content but also did not enjoy rapid
productivity gains before 1850.
The price and productivity movements of the post-Civil War period reveal
the changes in the rewards to the factors of production in the two sectors.
51
Just as the agricultural export price indicates the money return per unit of
agricultural commodities sold, the ratio of the agricultural to the
manufacturing price is one measure of the purchasing power of these
agricultural commodities, assuming that manufactured exports are
representative of U.S. manufacturing production in general. The product of
the relative price and the agricultural productivity index indicates the
course of returns to factors of production, or inputs, in agriculture: the
purchasing power over manufactures of an hour of agricultural labor or a unit
of capital employed in agriculture.
Agricultural factors of production did very well indeed after the 1890s,
by this measure (Table 24). Productivity in manufacturing increased much
faster than in agriculture. Agricultural export prices rose rapidly, much
faster than prices of manufactured goods. The purchasing power of
agricultural factors over manufactured goods grew at a fast pace while the
purchasing power of manufacturing factors of production over agricultural
products actually fell. The gains from growing productivity in manufacturing
went largely to agricultural factors of production and, of course to foreign
purchasers of U.S. manufacturing exports.
THE EFFECTS OF WARS AND OF TRADE POLICIES
The Navigation Acts
Most of what we have described here as the development of American trade
in the nineteenth century could be thought of as being outside the realms of
both chance events or conscious policy. We have attributed trade developments
mainly to income levels, productivity changes, factor endowments and changes
in endowments. One possible exception to the unimportance of government
Table 24
Agricultural and Manufactured Export Price Indexes andPurchasing Power of Agricultural and Manufactured Products
52
1879-881889-981899-19081904-1913
1913
83.667.877.089.8100.0
AgriculturalProductivity
Index
93.795.6106.6106.3100.0
ManufacturingProductivity
Index
Agricultural Factors'Purchasing Power OverManufactured Exports
66.069.284.196.3100.0
Manufacturing Factors'Purchasing Power Over
Agricultural Exports
98.2108.8110.199.4
100.0
Source: Lipsey (1963), Appendix Tables A-I and A-3
AgriculturalAgricultural Manufactured
70.472.478.990.6100.0
Manufactured
Manufacturing Agricultural
1879-88 118.5 142.1 69.1
1889-98 93.1 138.2 78.7
1899-1908 97.0 126.8 86.8
1904-1913 98,2 110.4 90.0
53
policies is the influence of the Navigation Acts on the trade pattern of the
American colonies, the pattern with which the country began its existence.
The British government in the colonial period was no believer in leaving
trade to the operation of the invisible hand. As Adam Smith described the
exemptions from the Navigation Laws, their purpose was to exploit the
incentives provided by access to foreign markets to encourage the cultivation
of grain, the clearing and use of forests, and the raising of cattle beyond
what would otherwise be feasible in •'... a thinly populated country." The key
to the success of the policy was the fact that access to "extensive markets"
would cause the prices of these products to be high, as they would not be in a
country cut off from trade. These high prices would encourage the extension
of cultivation and improvement of the breed of cattle.
The other side of the Navigation Acts, and their main purpose, was to
give home (British) purchasers of some colonial raw materials a monopoly on
the output of the colonies, to keep prices low, and to severely restrict the
growth in the colonies of manufacturing industries that might compete with
British sellers.
The initial pattern of colonial trade fit well with these plans, since
the exports were so largely crude materials and foods and imports were mainly
manufactured products. However, the same pattern could be explained by the
factor proportions and technological backwardness of the colonies. The fact
that the evolution of the pattern of trade after independence was gradual, and
the fact that the United States moved toward greater concentration on trade
with the U.K. after independence, when the earlier restrictions were absent,
suggest that economic forces, rather than the Navigation Acts were the main
determinants of both the commodity and country patterns of U.S. trade.
54
A similar conclusion, minimizing the effects of British imperial policy
on the welfare of the colonies and on the nature of their economies was
arrived at by North (1974). He dismissed restrictions on manufacturing as
inconsequential, given the colonies' factor proportions, which did not point
to any comparative advantage in that field. That view was shared by many
contemporary observers. For example, Benjamin Franklin (quoted in Callender
1909, pp. 35 and 36), "...while there is land enough in America for people,
there can never be manufactures of any amount of value.. .the colonies are so
little suited for establishing of manufacture, that they are continually
losing the few branches they accidentally gain. There was a burden placed on
American producers of tobacco, particularly, as measured by the difference
between prices received and those available outside the U.K. And there were
also burdens on consumers in the colonies from the artificially inflated
prices of goods imported from other European countries. However, they were
counterbalanced, to a considerable degree, by the advantages of British
military protection (North, 1974, pp. 54-55).
North's analysis, treating 1785-1793 as the norm representing the
situation without British restrictions, implies that if there were any effects
from the restrictions they were short-lived and did not deflect the United
States from its long-term growth path.
The Napoleonic Wars ad the Trade Embargo
There is no doubt that the Napoleonic Wars and the accompanying trade
embargo before the War of 1812 provided both great opportunities for trade and
shipping, as is described in the earlier quotation from Callender, and also
large negative shocks to the young U.S. economy. It is harder to say whether
55
any of the effects were permanent, in the sense that the U.S. gained new
industries that survived successfully after the period, or gained or lost
footholds in world markets.
Most of the analyses of this period have focussed on the immediate
advantages of American neutrality at a time when almost all potential rivals
were swept from the trade scene. North describes the years 1793 through 1807
as "extraordinarily prosperous ones. . . a a characterization confirmed by
"...nuuierous literary descriptions..." (p. 72). The prosperity came from
shipping earnings (which on net balance grew from $5 - 8 billion to $38 - 40
billion), and from increases in export prices and terms of trade.
Once the embargo on trade began in 1808 and especially with the entry of
the U.S. into the war in 1812, these gains were reversed. Shipping earnings
and exports fell drastically and the terms of trade turned against the United
States. The embargo did have some effect in promoting manufacturing in the
United States, but the path of development did not match American comparative
advantage at the time, according to North, and the artificially induced
industrialization quickly withered under postwar competition. Thus the net
balance of the war period, despite the prosperity of its early stages, does
not seem to have propelled American economic development in any substantial
way.
A later review of even the prosperous part of the Napoleonic War period
by Coldin and Lewis (1980) attempted to deflate the "legendary importance" of
the neutrality period by estimating effects on the rate of growth of per
capita income. The estimated gains, while perhaps not of legendary
dimensions, were substantial -- increases in the annual growth rate of per
capita income of something between 30 and 40 per cent. Although the authors
56
refer to these income gains as not dramatic they do suggest that there were
more permanent gains to development - - the growth of port cities and inland
towns, additions to shipping tonnage, and the spread of banking and of
commercialization in general.
The Civil War
The Civil War was the bloodiest of American history, was fought entirely
on American Soil, and divided the country on economic lines to a large extent.
Despite these factors, there has always been some belief that the northern
states experienced economic gains from the war. However, North (1966, p. 149)
judged that the war ". . .was not a major impetus to accelerated industrial
growth..." and presumably was not a major setback either. The basis for the
statement was that the acceleration of industrial growth and the development
of manufacturing had taken place before the war. Gailman (1972) pointed to
the heavy manpower losses during the war, the decrease in immigration, and the
smallness of the industrial requirements of the military •forces in that
period. What the Civil War did do was to alter the relation between the
northern and southern states, greatly reducing the per capita income level of
the South, and widening the income differential between the South and other
areas. There was also a major shift in the balance of political power that
was relevant to trade policy, since the southern states, more dependent on
exports and more oriented to free trade, lost to the northern states, which
were more import dependent and more favorable to protectionist legislation.
The negative effects of the war on the United States as a whole are
reflected in the earlier description of U.S. shares in world trade, which fell
between 1860 and 1870 in an unusual interruption of the long-term upward
57
trend. The net indebtedness of the U.S. tripled between the beginning of the
war and the end.
The distribution of exports did not change in a way that would suggest
that the war violently altered the American industrial structure. The share
of finished manufactures grew, but not to a degree that suggested a major
break in the upward trend. The share of cotton exports declined, but no
faster than it did between the 1830s and 1840s, and less than from the 1870s
to the l880s.
On the whole, the Civil War appears more as an interruption to the
changes in the composition of production and exports that were taking place
than as a spur to them.
Effects of Tariff Policy
The extent to which protectionist legislation promoted manufacturing
industry by restricting foreign competition in the U.S. market has been a
perennial subject for dispute. North (1966) mentions the possibility that the
Tariff Acts of 1816, 1824, and 1828 helped revive some parts of the textile
industry after the 1808 embargo and the War of 1812 severely damaged the
industry, but suggests that by 1830 the industry, having become a net
exporter, had no need for protection. He also suggested that the iron
industry, so regulated by the British Navigation Laws,2 was protected by the
high transport cost of its products.
The era after the Civil War is sometimes cited as a period in which the
2 While Great Britain encourages in America the manufacture of pig andbar iron, by exempting them from duties.., she imposes an absolute prohibitionupon the erection of steel furnaces and slit-mills in any of her American
plantations." Smith (1776), Book 4, Chapter 7.
58
United States used high tariffs successfully to encourage infant industries
that eventually became giants. In 1869, imports were 14 per cent of the
consumption of manufactured goods, and by 1909 that ratio had fallen to 6 per
cent. In every manufacturing industry in which the import share was 10 per
cent or more in 1869, that share fell to half or less in 1909. The iron and
steel industry was an extreme case, with imports falling from 12 to about 1½
per cent. These declines suggest that some of the rapid growth in U.S.
manufacturing involved import substitution: the replacement of imports by
domestic production. That was obviously the case for shares of the market,
but there were also a couple of examples of import substitution in the
absolute sense, with declines in the amount of imports in an industry.
Two cases of import substitution in this absolute sense stand out in the
nineteenth century, and both involve industries in which protection was
increased. One was the large fall in imports of textiles before the Civil
War. In this case the domestic industry had expanded under the embargo, which
was, in effect, a prohibitive tariff, although it was never put in those
terms. Taussig (1931) concluded that the embargo itself, rather than the
tariffs adopted to preserve the industry, provided the main impetus to growth.
Imports of iron and steel also fell between 1879 and 1899, in a period
when domestic consumption of these products more than doubled. Since the
decline in imports was insignificant relative to the growth of production, it
cannot have been the main impetus to such growth. Most appraisals of the
history of the industry have concluded that, while protection and the decline
of imports may have hastened the growth of some elements of the industry,
particularly tin plate, they were not the major influence in the long run for
the industry as a whole (Taussig, 1931; Teinin, 1964).
59
A study of the tariff on pig iron (Baack and Ray, 1974) concluded that
the tariff on that product did raise the level of domestic production. Part
of that effect was through the impact on the quality of imports. Since the
tariff on pig iron was a specific duty, framed in terms of dollars per ton, it
weighed much more heavily on cheap grades of pig iron than on expensive
grades. The result was a decline in imports of low quality pig iron, and
encouragement to domestic production at the low end of the quality scale.
In general, the historical studies of protection have attempted to learn
whether protection was successful, in the sense of encouraging the production
of the protected item. They do not, however answer the more important policy
question as to whether the growth and welfare of the country was enhanced,
rather than only that of the protected industries and the factors of
production employed in them.
TRADE AND U.S. ECONOMIC GROWTH
The United States, through much of its history, has been pointed to as a
country for which international trade was unimportant. At least it was a
country that, until recently, considered international trade unimportant, gave
little thought to it in policy making, and in which most branches of economics
were taught as if the country were isolated from the rest of the world. One
reason was the relatively low and, at times declining ratio of U.S. trade to
U.S. output described earlier.
These low ratios have affected the recurrent debate about the importance
of trade for U.S. economic growth, particularly growth in the 19th century. A
relatively modest role for international trade was assigned by Kravis (1972),
partly on the argument that trade was too unimportant, in terms of its share
60
of total output, to account for much of the growth in GNP or GNP per capita.
A view of the economy as governed by some type of economy-wide production
function in which inputs of factors of production lead to predictable outputs
of product tends to find little room for any influence of trade. Output
growth is assigned as far as possible to growth in the amounts of inputs or in
their quality, to technological progress, and often to some unexplainable
residual. What is missing from these analyses is the question of why the
inputs of resources grew at the rate they did, and the role played not only by
the actual exports and imports, but also by the broader trading
circumstances - - the existence of markets and the ability of producers and
traders to have access to them.
The view that assigns a more crucial level to trade, and to the growth
of foreign demand, has been associated with the work of Douglass North on U.S.
economic growth. North described the role of growth in foreign demand for
cotton in leading to the westward expansion of cotton farming and, in its
wake, more general expansions in settlement and cultivation.
A review of these controversies by Jeffrey Williamson shifted the
emphasis to a more general influence of trade: the existence of foreign
demand, rather than its growth, and the likelihood, or almost certainty, that
the price elasticity of demand in foreign markets was higher than that in the
domestic market - - probably much higher. That high elasticity meant that
rapid expansions of production, such as from the spread of cultivation to new
areas, could take place without causing drastic reductions in the prices
received by producers. Without the highly elastic demand of the foreign
market, expansions of production would quickly face the effects of the low
domestic demand elasticities, prices would fall quickly, and the expansion
61
would be cut off. It is not implied that the elasticity of foreign demand for
a product as a whole was necessarily different from that in the U.S. The
higher foreign elasticity of demand for an American export arose from the fact
that it was, typically, a much smaller element of foreign supply than of
American supply. Therefore the American export could substitute for foreign
exports or local production of the same product. If there were efficiencies
to be gained from concentrating an expansion in production in a short period,
they might well be lost if trade were cut off or reduced.
A corollary of this effect of the international market is that the ratio
of exports to production should increase when production grows most rapidly.
As described earlier, that was the case for cotton production in the United
States, and it was also true of the surges in middle-western grain and meat
production in the second half of the nineteenth century. Thus the
existence of a high-elasticity market, in combination with the factors that
initiated the surges in production, may have been crucial to the westward
expansion of the country.
On a more speculative note, one might consider that the advice now being
given to most developing countries urges policies that are outward- rather
than inward-oriented, and favor neutrality or export promotion over import
substitution. Since many currently developing countries are much smaller than
the U.S. was during the early stages of its industrialization, the trade
orientation may be more necessary than it was for a large, continental,
developing country such as the U.S. already was during most of the century.
On the other hand, an outward-oriented trade policy that encourages trade may
have ramifications for many other aspects of government policy. It may affect
investment, competition, monetary, and fiscal policies. It may affect the
62
choice of industries by investors, and the productivity of domestic producers.
These broader influences could go far beyond what is suggested by the amounts
of goods actually traded.
63
References
Baack, Bennett D., and Edward John Ray (1974), "Tariff Policy and Comparative
Advantage in the Iron and Steel Industry: 1870-1929," ExDlorations in
Economic History, Vol. 11, No. 1, January.
Bairoch, Paul (1973). "European Foreign Trade in the XIX Century: The
Development of the Value and Volume of Exports (Preliminary
Results)." The Journal of Eurotean Economic History, Vol. 2, No.
1, Spring, pp. 5-36.
____________ (1976a), Commerce Exterieur et Dévelotpement Economiaue de
l'Europe au XIX. Siècle, Paris, Mouton & Co. and École des Hautes
Etudes en Sciences Sociales.
____________ (l976b), "Europe's Gross National Product: 1800-1975,"
Journal of European Economic History, Vol. 5, No. 2, Fall.
____________ (1982), "International Industrialization Levels from 1750 to
1980," Journal of Eurorean Economic History, Vol. 11, No. 2.
Bairoch, Paul, and Bouda Etemad (1985), Structure Par Produits des
Exportations du Tiers-Monde. 1830-1937, Geneva, Librairie Droz.
Berry, Thomas Senior (1978), Revised Annual Estimates of American Gross
National Product: Preliminary Annual Estimates of Four Malor
Components of Demand, 1789-1889, Richmond, The Bostwick Press.
Ejork, Gordon C. (1963), "Stagnation and Growth in the American Economy,
1784-1792," University of Washington Ph.D. Dissertation, 1963.
Ann Arbor, Michigan, University Microfilms.
______________ (1964), "The Weaning of the American Economy:
Independence, Market Changes, and Economic Development," Journal
of Economic History, Vol. 24, December.
64
Blornström, Magnus, Robert E. Lipsey, and Lennart Ohisson (1988), Economic
Relations Between the United States and Sweden. Stockholm, Svenska
Handeisbanken and the Federation of Swedish Industries.
Bogart, Ernest Ludlow (1920), The Economic History of the United States,
Third Edition, New York, Longmans, Green and Co.
__________________ and Charles Manfred Thompson (1919), Readings in
the Economic History of the United States, New York, Longmans,
Green and Co.
Callender, Guy Stevens (1909), Selections from the Economic History of the
Untted States, 1765-1860, with introductory essays, Boston Ginn and Co.
David, Paul (1967), "The Growth of Real Product in the United States before
1840: New Evidence, Controlled Conjectures," .Journal of Economic
History, 27, pp. 151-97.
Davis, Lance E. (1972), "Capital and Growth," Chapter 8 in Davis, Easterlin,
and Parker, Eds. (1972).
Davis, Lance E., Richard A. Easterlin, and William N. Parker, editors
(1972). American Economic Growth: An Economists History of the
United States, New York, Harper & Row, 1972.
Davis, Lance E., and Jonathan R.T. Hughes (1960). "A Dollar-Sterling
Exchange, 1803-95," Economic History Review, Vol. XIII, No. 1,
August, pp. 52-78. Reprinted in Purdue Faculty Papers in Economic
History. 1956-1966, Homewood, Illinois, Richard D. Irwin, 1967.
Deane, Phyllis, and A.W. Cole (1969), British Economic Growth. 1688-1959,
Second Edition, University of Cambridge, Department of Applied
Economics, Monographs, No. 8, Cambridge, Cambridge University Press.
Edelstein, Michael (1982), Overseas Investment in the Me of High Imnerialism:
65
The United Kingdom. 1850-1914, New York, Columbia University Press.
Galiman, Robert E. (1960), "Commodity Output, 1839-1899," in NBER Conference
on Research in Income and Wealth, Trends in the American Economy in the
Nineteenth Century, Studies in Income and Wealth, Vol. 24, Princeton,
Princeton University Press for the NEER.
Gallman, Robert E. (1960), "Commodity Output, 1839-1899," in NBER
Conference on Research in Income and Wealth, Trends in the
American Economy in the Nineteenth Century, Studies in Income and
Wealth, Vol. 24, Princeton University Press for the NBER.
_________________ (1966), "Cross National Product in the United States: 1834-
1909," in NBER Conference on Research in Income and Wealth, OutDut.
Employment. and Productivity in the United States After 1800, Studies in
Income and Wealth, Vol. 30, New York, NBER.
________________ (1972), "The Pace and Pattern of American Economic Growth,"
in Davis, Easterlin, and Parker (1972).
________________ (1992), "American Economic Growth before the Civil War: The
Testimony of the Capital Stock Estimates," in Robert E. Gailman and John
Joseph Wallis, Eds, American Economic Growth and Standards of Livinz
before The Civil War, Chicago, University of Chicago Press.
Coldin, Claudia D., and Frank D. Lewis (1980), "The Role of Exports in
American Economic Growth during the Napoleonic Wars, 1793 to 1807,"
Explorations in Economic History, Vol. 17, pp. 6-25.
Gordon, Robert J. (1989), "The Estimation of Prewar Gross National Product,"
Journal of Political Economy, February.
Kravis, Irving B. (1970), "Trade as a Handmaiden of Growth: Similarities
Between the 19th and 20th Centuries," Economic Journal, Vol. 80,
66
December, pp. 850-872.
_______________ (1972), "The Role of Exports in Nineteenth-Century United
States Growth," Economic Develot'ment and Cultural Change, Vol. 20,
Number 3, April, pp. 387-405.
Kuznets, Simon (1961). Catital in the American Economy: Its Formation and
Financing, Princeton University Press for the NBER.
____________ (1966), Modern Economic Growth: Rate. Structure. and Spread,
Studies in Comparative Economics, No. 7, New Haven, Yale University
Press.
League of Nations (1945), Industrialization and Foreign Trade, by Folke
Hilgerdt, Geneva, League of Nations.
Lebergott, Stanley (1964), Manpower in Economic Growth: The American Record
Since 1800, New York, McGraw-Hill Book Co.
________________ (1966), "Labor Force and Employment, 1800-1960," in NEER
Conference on Research in Income and Wealth, Output. Employment, and
Productivity .n the United States After 1800, Studies in Income and
Wealth, Vol. 30, New York, NBER.
Lewis, Cleona (1938), America's Stake in International Investments,
Washington, D.C., The Brookings Institution.
Lipsey, Robert E. (1963), Price and Ouantitv Trends in the Foreign Trade of
the United States, Princeton, Princeton University Press for the
National Bureau of Economic Research.
________________ (1972), "Foreign Trade," in Davis, Easterlin, and
Parker (1972).
Maddison, Angus (1962), "Growth and Fluctuations in the World Economy, 1870-
67
1960" Banca Naiona1e del Lavoro quarterly Review, No. 61, June, Pp. 3-
71.
______________ (1982), Phases of Capitalist Development, Oxford, Oxford
University Press.
Mill, John Stuart (1909), Principles of Political Economy, from the Fifth
London Edition, New York, D. Appleton & Co.
Mitchell, B. R. (1978), European Historical Statistics. 1750-1970, Abridged
Edition, New York, Columbia University Press.
Neal, Larry, and Paul Uselding (1972), "Iinziiigration, A Neglected Source of
American Economic Growth: 1790-1912." Oxford Economic Pagers (New
Series), Vol. 24, Number 1, March.
North, Douglass C. (1960), "The United States Balance of Payments, 1790-1860"
in NBER Conference on Research in Income and Wealth, Trends in the
American Economy in the Nineteenth Century, Studies in Income and
Wealth, Vol. 24, Princeton, Princeton University Press for the NBER.
_________________ (1961), The Economic Growth of the United States. 1790 to
12.Q Englewood Cliffs, New Jersey, Prentice-Hall.
________________ (1966), Growth and Welfare in the American Past, Englewood
Cliffs, New Jersey, Prentice-Hall.
________________ (1974), Growth and Welfare in the American Past, Second
Edition, Englewood Cliffs, New Jersey, Prentice-Hall.
Pitkin, Timothy (1816), A Statistical View of the Commerce of the United
States. Reprints of Economic Classics, New York, Augustus M. Kelley,
1967.
Raiser, Christina (1989), "The Prewar Business Cycle Reconsidered: New
Estimates of Gross National Product, 1869-1908," Journal of Political
68
Economy, February.
Rostow, Walt W. (1978), The World Economy: History and Prospect, Austin,
University of Texas Press.
Shepherd, James F., and Gary M. Walton (1972), Shiving. Maritime Trade, and
the Economic Development of Colonial North American, Cambridge,
Cambridge University Press.
Simon, Matthew (1960), "The United States Balance of Payments, 1861-
1900," in NBER Conference on Research in Income and Wealth, Trends
in the American Economy in the Nineteenth Century, Studies in
Income and Wealth, Vol. 24, Princeton, Princeton University Press
for the NBER.
Smith, Adam (1776), An Inquiry Into the Nature and Causes of the Wealth of
Nations, New York, Modern Library, 1937.
Smith, Walter Buckingham, and Arthur Harrison Cole (1935), Fluctuations
in American Business. 1790-1860, Cambridge, Mass., Harvard
University Press, 1935.
Sokoloff, Kenneth (1986), "Productivity Growth in Manufacturing During Early
Industrialization: Evidence From the American Northeast: 1820-1860," in
Stanley L. Engerman and Robert E. Cailman, Editors, Long-Term Factors in
American Economic Growth, Studies in Income and Wealth, Vol. 51.
Chicago, University of Chicago Press for the NBER.
Taussig, Frank W. (1931), The Tariff History of the United States, New York
and London, G.P. Putnam's Sons
Towne, Marvin W. and Wayne D. Rasmussen (1960), "Farm Gross Product and
Gross Investment in the Nineteenth Century," in NBER Conference on
Research in Income and Wealth, Trends in the American Economy in
69
the Nineteenth Century, Studies in Income and Wealth, Vol. 24,
Princeton, Princeton University Press for the NBER.
U.S. Bureau of the Census (1975), Historical Statistics of the United States.
Colonial Times to 1970. Bicentennial Edition, Washington, D.C.
U.S. Congress, House of Representatives (1884), Domestic ExDorts. 1789-1883,
House Miscellaneous Document No. 2236, 48th Congress, 1st Session (1883-
84), compiled by C.H. Evans.
Vanek, Jaroslav (1963), The Natural Resource Content of United States Foreign
Trade. 1870-1955, Cambridge, Mass., M.I.T. Press.
Weiss, Thomas (1992), "U.S. Labor Force Estimates and Economic Growth,
1800-1860," in Robert E. Galiman and John Joseph Wallis, Eds.,
American Economic Growth and Standards of Living Before the Civil
, Chicago, University of Chicago Press.
Weiss, Thomas (1993), "Estimates of Cross Domestic Output for the United
States, 1800 to 1860," Mimeo, University of Kansas.
Wilkins, Mira (1989), The History of Foreign Investment in the United States
to 1914, Cambridge, Mass., Harvard University Press.
Williamson, Jeffrey (1964), American Growth and the Balance of Payments. 1820-
12.U Chapel Hill, University of North Carolina Press.