Paleoecological and Floristic Heterogeneity in the Plant-Fossil Record An Analysis Based on the Eocene of Washington OGY LIB'n&v U.S. GEOLOGICAL SURVEY BULLETIN 2085-B S^^ ^^^« o.* APj vi\ 1W >v^ ^*- -c _ - «*-- l*3sF **r' -. «yp.» ,^t^
Transcript
Paleoecological and Floristic Heterogeneity in the Plant-Fossil Record An Analysis Based on the Eocene of Washington
OGY LIB'n&v
U.S. GEOLOGICAL SURVEY BULLETIN 2085-B
S^^^^^«
o.*
APj
vi\ 1W>v^ ^*- -c _
- «*--
l*3sF **r' -.«yp.»
,^t^
Cover. Steeply dipping beds (fluvial channel deposits) of the Eocene Puget Group in the upper part of the Green River Gorge near Kanaskat, southeastern King County, Washing ton. Photograph by Samuel Y. Johnson, July 1992.
Paleoecological and Floristic Heterogeneity in the Plant-Fossil Record An Analysis Based on the Eocene of Washington
By Robyn J. Burnham
EVOLUTION OF SEDIMENTARY BASINS CENOZOIC SEDIMENTARY BASINS IN SOUTHWEST WASHINGTON AND NORTHWEST OREGON
Samuel Y. Johnson, Project Coordinator
U.S. GEOLOGICAL SURVEY BULLETIN 2085-B
A multidiscipUnary approach to research studies of sedimentary rocks and their constituents and the evolution of sedimentary basins, both ancient and modern
UNITED STATES GOVERNMENT PRINTING OFFICE, WASHINGTON : 1994
U.S. DEPARTMENT OF THE INTERIOR
BRUCE BABBITT, Secretary
U.S. GEOLOGICAL SURVEY «'
Gordon P. Eaton, Director
For sale by U.S. Geological Survey, Map DistributionBox 25286, MS 306, Federal Center
Denver, CO 80225
Any use of trade, product, or firm names in this publication is for descriptive purposes only and does not imply endorsement by the U.S. Government
Library of Congress Cataloging-in-Publication Data
Burnham, Robyn J.Paleoecological and floristic heterogeneity in the plant-fossil record : an analysis based
on the Eocene of Washington / by Robyn J. Burnham.p. cm. (U.S. Geological Survey bulletin ; 2085)
Evolution of sedimentary basins Cenozoic sedimentary basins in southwest Washington and northwest Oregon ; B)
Includes bibliographical references.Supt.ofDocs.no.: I 19.3:2085-81. Paleobotany Eocene. 2. Plants, Fossil Washington (State)-King
County. 3. Paleoecology Washington (State) KingCounty. I. Title. II. Series. III. Series: Evolution of sedimentary basins Cenozoic sedimentary basins in southwest Washington and northwest Oregon : B. QE75.B9 no. 2085-B [QE927.2]557.3 s dc20 94-1627 [560.178] CIP
CONTENTS
Abstract.......................................................................................................................... BlIntroduction.................................................................................................................... 1Stratigraphy of the Puget Group..................................................................................... 2Description of the Field Area......................................................................................... 4Data Collection............................................................................................................... 5
Stratigraphic Sections........................................................................................... 5Plant-Fossil Collections........................................................................................ 6Adjustments to the Data Set................................................................................. 6
General Characteristicsof the Upper Ravenian Flora..................................................... 8Analysis of Plant Distribution Presence-Absence Data.............................................. 9
Species Richness.................................................................................................. 10Species Diversity.................................................................................................. 10Leaf Margins of AngiospermTaxa...................................................................... 10Leaf Size of AngiospermTaxa............................................................................. 12Conifers, Pteridophytes, and Sphenopsids........................................................... 12Comparison of Floristic Assemblages.................................................................. 13Summary of Data on Presence-Absence of Species............................................. 13
Analysis of Plant Data Taxon Abundance .................................................................. 15Ordination of Localities ....................................................................................... 15
Methods.......................................................................................................... 15Results and Discussion................................................................................... 15
Cluster Analysis................................................................................................... 16Methods.......................................................................................................... 16Results and Discussion................................................................................... 16
Environmental Heterogeneity in the Puget Group......................................................... 17Discussion...................................................................................................................... 17
Species Distribution in the Upper Ravenian Puget Group................................... 17Anomalous Localities and their Use in Interpreting Paleoecology...................... 20
Conclusions.................................................................................................................... 20Depositional Environments Implications for their Use in Paleobotany...................... 21
Recommendations for Cenozoic Paleobotanical Investigations ...........................:........ 22References Cited............................................................................................................ 22Appendix 1. Matrix of Abundance Data for 20 Plant-Fossil Localities from the
Puget Group................................................................................................................ 28Appendix 2. Matrix of Sorenson's Index of Similarity for Comparisons Between 20
Plant-Fossil Localities from the Puget Group............................................................ 30Appendix 3. Matrix of Spearman's Rank-Order Correlation Coefficients for 20
Plant-Fossil Localities from the Puget Group............................................................ 30Appendix 4. Abbreviations and Taxonomic Citations for Plant-Fossil Taxa from
the 20 Localities Examined in the Puget Group......................................................... 31
III
IV CONTENTS
FIGURES
1. Map showing outcrop area of the Eocene Puget Group, Washington...................................................................... B22. Stratigraphic type section of the Eocene Puget Group............................................................................................. 33. Diagram showing discrepancies between radiometric and paleobotanical ages of rock units from the
Eocene Puget Group ................................................................................................................................................. 44. Map showing location of study area and plant localities.......................................................................................... 55. Stratigraphic sections of the Eocene Puget Group, L-Bar silica quarry................................................................... 76. Diagram showing relationships of depositional environments of the Eocene Puget Group..................................... 8
7-15. Graphs showing:7. Numbers of specimens and taxa by locality..................................................................................................... 88. Species richness by locality ............................................................................................................................. 109. Shannon-Weiner diversity index by locality.................................................................................................... 11
10. Percentage of species having entire-margined leaves by locality.................................................................... 1111. Leaf-size index by locality............................................................................................................................... 1212. Species richness of selected plant groups by locality...................................................................................... 1313. Sorenson's Index of Similarity of localities..................................................................................................... 1414. Detrended Correspondence Analysis of localities........................................................................................... 1515. Cluster Analysis of localities ........................................................................................................................... 16
16. Drawing showing plan view of hypothetical landscape heterogeneity..................................................................... 19
TABLES
1. Depositional environment, species richness, and height above base of section for plant-fossil localities used inpaleoecological analysis, Eocene Puget Group, Washington................................................................................... B6
2. Comparison of flora of the Ravenian Puget Group with other Oligocene and Eocene floras from the PacificNorthwest and Alaska............................................................................................................................................... 9
3. Leaf-size classes........................................................................................................................................................ 124. Dominant taxa (5 percent or greater relative abundance) at 20 plant-fossil localities from the Eocene
Paleoecological and Floristic Heterogeneity in thePlant-Fossil Record An Analysis Based on the
Eocene of Washington
By Robyn J. Burnham 1
ABSTRACT
The late Ravenian (Eocene) flora from the Puget Group of Washington State is characterized by a wide variety of deltaic depositional environments. The flora is strongly con trolled by the facies in which the plants are preserved. Lacus trine-fill assemblages are extremely variable from site to site and can only be used as a group to reconstruct paleoclimate and floristics. Channel-margin assemblages are depauperate relative to the regional flora and consistently underestimate paleotemperature. Floodbasin assemblages tend to contain a larger proportion of the whole flora and give a much more consistent estimate of the paleotemperature. Combining these floras from distinct depositional environments allows reconstruction of heterogeneity on the floodplain. Floras contributing to channel margins are similar because of the conduit nature of the channel itself. Lacustrine-fill assem blages are derived from lakeside floras, which vary from site to site because of the random colonization of lake margins from the surrounding floodplain habitats. Floodbasin floras are species rich and are composed of a greater cross section of the floodplain plant dominants than any of the other flo- ristic assemblages. When used to reconstruct the floodplain landscape, floras distinguished by depositional environ ments become a powerful tool in paleoecology.
INTRODUCTION
The plant species composition at any particular site on a floodplain is dependent on the topography, substrate, and frequency and depth of flooding (Shelford, 1954; Bedinger, 1971; Bell and del Moral, 1977; Nixon and others, 1977;
'Museum of Paleontology, University of Michigan, Ann Arbor, Mich igan 48109-1079
Frye and Quinn, 1979; Hupp, 1982, 1983; Yanosky, 1982; Hupp and Osterkamp, 1985; Johnson and others 1985). The differential response of species to physical heterogeneity creates a mosaic of partly distinct vegetation zones within the floodplain of a river. Plant litter (leaves, fruits, flowers, branches) is likely to reflect the patchiness or zonation of the source vegetation. Differences in floristic composition, rich ness, biomass, diversity, and foliar physiognomy are reflected in the forest litter (Whitten, 1982; Proctor and oth ers, 1983; Burnham, 1989; Greenwood, 1991).
Forest litter serves as the basis for reconstruction of the characteristics of fossil forests. Detailed knowledge of the spatial patterns in fossil vegetation can be gained by study of plant assemblages from different sedimentary facies depos ited during a short time interval. In addition, the ecological preferences of extinct plants can be inferred from the restric tion of plant organs to specific depositional environments (DiMichele and Phillips, 1985; Wnuk, 1985; Gastaldo, 1987; Wnuk and Pfefferkorn, 1987). Plant-based biostrati- graphic correlation can be hampered, however, by ecologi cally mediated, nonuniform distribution of plant species and litter among deltaic or floodplain sites. Compositional dif ferences between stratigraphically superposed floras may be ecologically controlled, the result of evolutionary change, or due to climatic change. Independent data on the depositional environments represented can greatly improve the separa tion of ecological signals from evolutionary or climatic signals.
Recent developments in plant taphonomy (the study of the conditions under which paleontological records are pre served; Efremov, 1940) have focused attention on the depo sitional and degradative processes that can distort leaf and propagule assemblages in the fossil record (Spicer, 1980, 1981; Collinson, 1983; Scheihing and Pfefferkorn, 1984; Ferguson, 1985; Greenwood 1992). The goal of taphonomic investigation is to provide a means to infer source vegetation from fossil deposits in spite of the distortion caused by pre- retrieval processes. From the insights provided by
Bl
B2 EVOLUTION OF SEDIMENTARY BASINS SOUTHWEST WASHINGTON AND NORTHWEST OREGON
taphonomic investigations, it is possible to use the patterns in the fossil record to provide clues about the biology of extinct organisms. It is this paleoecological application of taphonomy that has pervaded paleontology and that will per sist, long after the practical questions in taphonomy have been resolved.
Plant-assemblage data from the Cenozoic fossil record have been used in two fundamental ways: (1) for paleoenvi- ronmental reconstructions, including details of forest struc ture, climate, and species distribution, and (2) for biostratigraphy, in which taxa, scored as present or absent, are used to define concurrent range zones. A few well-col lected plant-fossil assemblages commonly form the basis for Tertiary paleoecological reconstructions, and these are rou tinely augmented by smaller assemblages (MacGinitie, 1969; Hickey, 1977; Axelrod, 1985). The effect of source- vegetation heterogeneity (patchiness or zonation) on the resulting interpretation of micro- and mega-fossil assem blages rarely has been investigated in the ancient or the mod ern record of plant litter (however, see Parker, 1976; Wing, 1981; Gastaldo, 1987; Spicer and Wolfe, 1987; Burnham, 1989).
The research presented here has four major objectives. The first objective is to provide an updated characterization of the upper Ravenian (Eocene) flora of the Puget Group of Washington State. This characterization is based on 18 plant-fossil assemblages from a limited geographic area encompassing a variety of deltaic depositional environ ments. The second objective is to determine the relative importance of (1) stratigraphic position and (2) environment of deposition on the floristic composition, abundance, and dominance of each of the Ravenian assemblages. The floris tic composition and environmental implications of each assemblage are compared with those of the whole flora to determine the deviation from the regional vegetation repre sented by each subset. The third objective is to summarize the paleoecology of the upper Ravenian plant communities in terms of spatial relationships and presumed environment of deposition, and the fourth objective is to make recommen dations about methodologies for Cenozoic paleoecological analyses of more limited exposures.
Acknowledgments. I would like to thank the follow ing individuals for their comments on the manuscript in var ious forms: William A. DiMichele, Estella B. Leopold, Joanne Bourgeois, Alan Kohn, Melinda Denton, Jack A. Wolfe, Samuel Y. Johnson, and Richard G. Olmstead. For access to private land I thank Glenda McLucas and the Palmer Coking Coal Company. For guidance throughout the project I am grateful to William A. DiMichele. For financial support I thank the Geological Society of America, the Achievement Awards for College Scientist Foundation, and the National Science Foundation Pre-doctoral Fellowship Program.
122°15' 122°00' 121°45'
OUTCROP AREA OF THE PUGETGROUP
47°15' -
20 KltOMETERS
Figure 1. Generalized outcrop area of the Eocene Puget Group (dark shaded area), King and Pierce Counties, Washington. Modi fied from descriptions by Wolfe (1968), Vine (1969), and Mul- lineaux(1970).
STRATIGRAPHY OF THE PUGET GROUP
Outcrops of the Eocene Puget Group are exposed west of the Cascade Mountains in Washington State in a roughly rectangular area extending from near Morton on the south to the Newcastle Hills on the north, covering an area of about 40 by 90 km (fig. 1). The Puget Group comprises arkosic sandstone, shale, and coal and locally abundant volcanic debris (Vine, 1969). The northern section of the Puget Group (in the area of Renton) has been divided into three forma tions that include (from bottom to top) sedimentary rocks of the Tiger Mountain Formation, dominantly volcanic rocks of the Tukwila Formation, and sedimentary rocks of the Renton Formation. The formational names have not been extended to the southern part of the basin, near the Green River, where the entire exposed sequence is sedimentary in character and the Tukwila Formation is missing. Six quadrangles compris ing the major outcrops of the Puget Group were mapped and described by Vine (1969), Mullineaux (1970), and Yount and Gower (1991). Correlation between rocks from the two areas was made on the basis of plant fossils (Wolfe, 1968; Vine, 1969) and refined by Armentrout and others (1983).
HETEROGENEITY IN THE PLANT-FOSSIL RECORD B3
METERS FLORAL STAGES
Kummer Sandstone"
Section Studied
Gem and Harris Coals J
McKay -! Coal
-1,800
J ,200
-600
Lower
Upper
Middle
Lower
UpperLower
c o>CO
QC
Fultonian
3Zc CO
EXPLANATIONE3 Silt and clay g| Sandstone
Coal Es3 Igneous sill
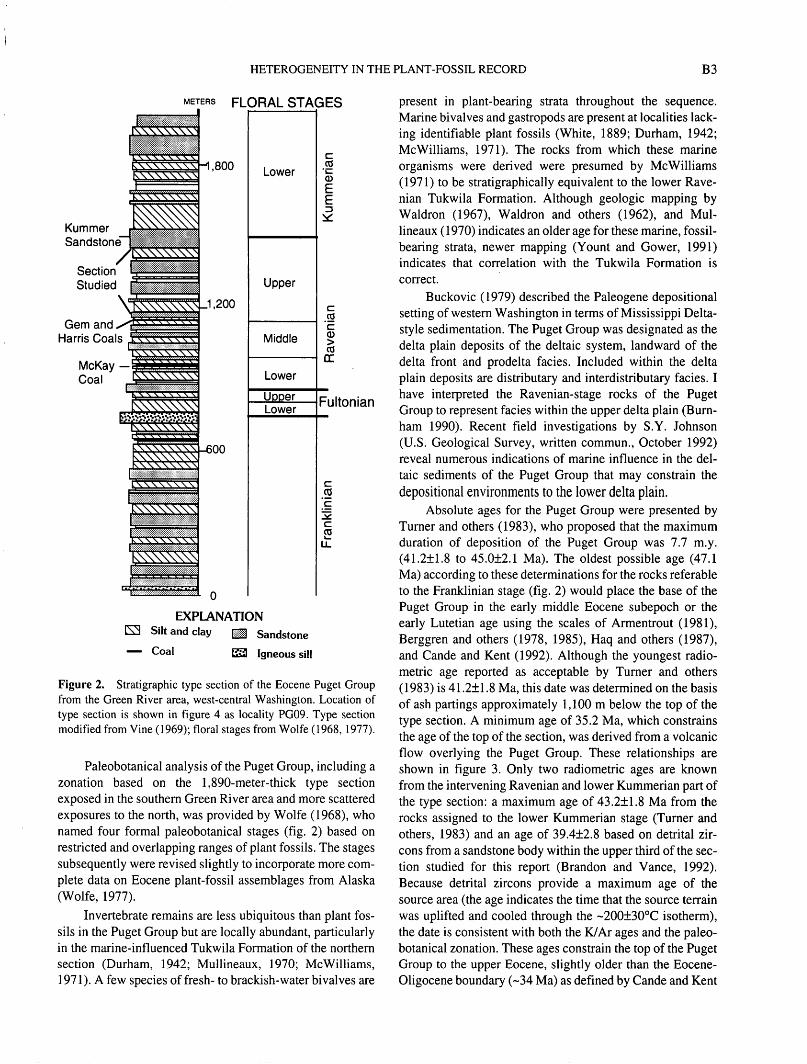
Figure 2. Stratigraphic type section of the Eocene Puget Group from the Green River area, west-central Washington. Location of type section is shown in figure 4 as locality PG09. Type section modified from Vine (1969); floral stages from Wolfe (1968, 1977).
Paleobotanical analysis of the Puget Group, including a zonation based on the 1,890-meter-thick type section exposed in the southern Green River area and more scattered exposures to the north, was provided by Wolfe (1968), who named four formal paleobotanical stages (fig. 2) based on restricted and overlapping ranges of plant fossils. The stages subsequently were revised slightly to incorporate more com plete data on Eocene plant-fossil assemblages from Alaska (Wolfe, 1977).
Invertebrate remains are less ubiquitous than plant fos sils in the Puget Group but are locally abundant, particularly in the marine-influenced Tukwila Formation of the northern section (Durham, 1942; Mullineaux, 1970; McWilliams, 1971). A few species of fresh- to brackish-water bivalves are
present in plant-bearing strata throughout the sequence. Marine bivalves and gastropods are present at localities lack ing identifiable plant fossils (White, 1889; Durham, 1942; McWilliams, 1971). The rocks from which these marine organisms were derived were presumed by McWilliams (1971) to be stratigraphically equivalent to the lower Rave- nian Tukwila Formation. Although geologic mapping by Waldron (1967), Waldron and others (1962), and Mul lineaux (1970) indicates an older age for these marine, fossil- bearing strata, newer mapping (Yount and Gower, 1991) indicates that correlation with the Tukwila Formation is correct.
Buckovic (1979) described the Paleogene depositional setting of western Washington in terms of Mississippi Delta- style sedimentation. The Puget Group was designated as the delta plain deposits of the deltaic system, landward of the delta front and prodelta facies. Included within the delta plain deposits are distributary and interdistributary facies. I have interpreted the Ravenian-stage rocks of the Puget Group to represent facies within the upper delta plain (Burn- ham 1990). Recent field investigations by S.Y. Johnson (U.S. Geological Survey, written commun., October 1992) reveal numerous indications of marine influence in the del taic sediments of the Puget Group that may constrain the depositional environments to the lower delta plain.
Absolute ages for the Puget Group were presented by Turner and others (1983), who proposed that the maximum duration of deposition of the Puget Group was 7.7 m.y. (41.2±1.8 to 45.0±2.1 Ma). The oldest possible age (47.1 Ma) according to these determinations for the rocks referable to the Franklinian stage (fig. 2) would place the base of the Puget Group in the early middle Eocene subepoch or the early Lutetian age using the scales of Armentrout (1981), Berggren and others (1978, 1985), Haq and others (1987), and Cande and Kent (1992). Although the youngest radio- metric age reported as acceptable by Turner and others (1983) is 41.2±1.8 Ma, this date was determined on the basis of ash partings approximately 1,100 m below the top of the type section. A minimum age of 35.2 Ma, which constrains the age of the top of the section, was derived from a volcanic flow overlying the Puget Group. These relationships are shown in figure 3. Only two radiometric ages are known from the intervening Ravenian and lower Kummerian part of the type section: a maximum age of 43.2±1.8 Ma from the rocks assigned to the lower Kummerian stage (Turner and others, 1983) and an age of 39.4±2.8 based on detrital zir cons from a sandstone body within the upper third of the sec tion studied for this report (Brandon and Vance, 1992). Because detrital zircons provide a maximum age of the source area (the age indicates the time that the source terrain was uplifted and cooled through the ~200±30°C isotherm), the date is consistent with both the K/Ar ages and the paleo botanical zonation. These ages constrain the top of the Puget Group to the upper Eocene, slightly older than the Eocene- Oligocene boundary (~34 Ma) as defined by Cande and Kent
B4 EVOLUTION OF SEDIMENTARY BASINS SOUTHWEST WASHINGTON AND NORTHWEST OREGON
RADIOMETRIC AGES Turner and others (1983)
29 ,
33
36
39
42
45
48
51
54 '
MEGA-ANNUM
PALEOBOTANICAL STAGES, GREEN RIVER AREA
PALEOBOTANICAL AGES Wolfe (1981a, written commun., January 1993)
. 29
33
36
39
42
45
48
51
54
MEGA-ANNUM
Figure 3. Discrepancies between radiometric (K/Ar) and paleobotanical ages of rock units from the Eocene Puget Group, Washington. Diagonal-lined areas indicate the age-duration indicated by the two types of analy ses. Shaded areas and dashed correlation lines are inferred from the studies cited. Base of the Puget Group is based on paleobotanical evidence and has been revised from written communication with J.A. Wolfe (January 1993).
(1992) and Berggren and others (1992). The age estimates are in partial conflict with those of Wolfe (1978, 1981a), whose zonation puts the base of the Puget Group in the mid dle Eocene and the top of the group in the early Oligocene. Even the minimum estimate of the duration of the Puget Group based on the paleobotanical evidence (about 12 m.y.) does not allow concordance with the radiometric ages. Addi tional radiometric ages based on Ar-Ar analysis may help to resolve the age.
DESCRIPTION OF THE FIELD AREA
A section within the southern Puget Group was chosen to determine whether stratigraphic position or depositional environment had a stronger influence on the taxonomic com position of plant-fossil assemblages. The section is 40 km southeast of Seattle in the L-Bar Products silica quarry (fig. 4). In this area, postdepositional folding and faulting has
produced a series of north- and east-trending anticlines and synclines. Beds dip 30°-80° W. along the axes of these structures; long stratigraphic sections can be measured easily along west-flowing rivers, quarries, and surface mines. The quarry section exposes more than 200 m stratigraphically (see fig. 2) in about 1 km of lateral exposure. The 200-meter section represents most of the upper Ravenian floral stage as designated by Wolfe (1977) (fig. 2). Based on average sedi ment accumulation rates for the Green River section, the 200-meter section may represent as much as 3.5 m.y. (based on Wolfe, 198 la) or as little as 0.4 m.y. (based on Turner and others, 1983). The average sediment accumulation rates are 0.06 m/1,000 years and 0.25 m/1,000 years, respectively. Both rates fit within the estimates reported by Sadler (1981) for fluvial environments, and the later rate is within the rate (0.4-0.6 m/1,000 years) recently estimated by S.Y. Johnson (written commun., October 1992) based on revisions of ages and stratigraphic correlations of the Puget Group. These sed iment accumulation rates supersede those proposed for the Puget Group by Johnson (1985).
HETEROGENEITY IN THE PLANT-FOSSIL RECORD B5
122°15' 122°
47°30' -
T23N
T22N
T21N
R5E R6E R7E
Figure 4. Location of L-Bar silica quarry (18 plant localities) and two plant-fossil localities (PG04 and PG34) from road-cut exposures, west-central Washington. Locality PG09 is location of stratigraphic section shown in figure 2.
Eighteen plant-fossil localities were excavated within the quarry, and two additional localities (one early Ravenian and one Kummerian) were established at road cuts in the northern part of the Puget Group (fig. 4). The exposures, par ticularly those within the quarry, were chosen for analysis because stratigraphic relationships between plant localities could be observed directly in the field and because lateral facies relationships of individual beds could be traced for as much as 800 m.
DATA COLLECTION
STRATIGRAPHIC SECTIONS
Vertical sections were measured in the quarry and at both of the northern localities (localities 04 and 34, table 1). The lateral relationships between localities and the general
facies relationships within the quarry are shown in figure 5. Sedimentological features such as dominant grain size, vari ation in grain size, sedimentary structures, bioturbation (including rooting by plants), density of organic layering, and position in a local stratigraphic section were noted at each plant locality and were used to group localities into dep- ositional facies (Burnham, 1990). The designation of facies types for each locality was thus independent of the taxo- nomic composition of the plant assemblages. The indepen dence of the two data sets allows hypotheses about plant habitat preference and about depositional setting to be tested using the alternate data set.
Three major plant-bearing facies are present in the localities from the L-Bar quarry: lacustrine cutoff, floodba- sin, and channel margin. Both floodbasin and lacustrine-cut off facies can be subdivided further into what probably are higher- and lower-energy subenvironments. These subenvi- ronments are distal crevasse splay (floodbasin), overbank floodbasin, low-energy lacustrine cutoff, and intermittently
B6 EVOLUTION OF SEDIMENTARY BASINS SOUTHWEST WASHINGTON AND NORTHWEST OREGON
Table 1. Depositional environment, species richness, and height above base of section for plant-fossil localities used in paleoecological analysis, Eocene Puget Group, Washington. [Localities are listed in stratigraphic sequence, from oldest to youngest]
Locality Depositional Meters above base no. environment of section3421191822170732293630272433312625352304
*Excluding all species for which there are fewer than two specimens.
active lacustrine cutoff. The five plant-bearing facies types (shown diagrammatically in fig. 6) have distinctive sedimen- tological attributes and have been described in detail (Burn- ham, 1990).
Lacustrine-cutoff deposits are of two types: low-energy and intermittently active. Both types of deposits are charac terized by fine grain size, flat-lying laminations, and rela tively thick layers of leaf material. In addition, laminae in the intermittently active deposits include coarser grain sizes transported by the occasional flooding of the subenviron- ment. This type of depositional setting is interpreted to rep resent abandoned (or partly abandoned) cutoff lakes.
Floodbasin deposits are divided into two types: over- bank flood and distal crevasse splay (Burnham 1990). Both types of deposits are characterized by generally coarsening upward sequences of silt, sand, and clay commonly associ ated with plant-bearing layers. Lamination is not common, and bioturbation is abundant. The crevasse-splay deposits incorporate larger grain sizes and bear some ripple lamina tion. Both types of deposits are interpreted to represent floodbasin environments; the overbank flood deposits gener ally preserve litter from forest floor in finer sediments, and the crevasse-splay deposits preserve plants in the coarser sediment from the toe of a crevasse splay.
Channel-margin deposits generally contain larger grain sizes and more abundant ripple lamination than either of the other two main deposition types. Plant material is less abun dant, and leaves are incorporated generally as isolated individuals. The deposits represent a range of environments
including proximal parts of crevasse splays, levees, upper point bars, and bar tops (Burnham, 1990).
PLANT-FOSSIL COLLECTIONS
Plant-fossil localities were designated as areas extend ing no more than 0.5 m vertically and 2 m laterally. At each locality, orientation of leaves on the bedding planes, pres ence of cuticle, density of leaves, and quality of preservation were noted. An average of 680 individual fossil leaf, fruit, and flower specimens were collected from each locality (table 1) and taken to the laboratory for analysis. All speci mens were coated with acrylic spray coating to reduce desic cation of carbon films. Each specimen was assigned an individual locality and specimen number so that all speci mens of each taxon could be referenced for taxonomic pur poses. The number of specimens and number of taxa up to 800 specimens per locality are summarized in figure 7 for all localities. The leveling of the curves indicates that, for most localities, the number of specimens collected represents an adequate sample of the taxonomic composition of the locality.
Specimens were assigned to morphological groups; in almost all cases, each group comprises a single species. Fea tures of leaves such as size, shape, thickness, tooth type and size, major and minor vein patterns, presence or absence of drip tip, and arrangement of leaves and other organs on an axis were used to characterize each morphotype (taxon). Specimens of taxa previously reported from the Puget Group (Wolfe, 1968) were assigned to the previously named genus and species, but I give many previously unnamed taxa infor mal names related to some aspect of their morphology (abbreviations in appendix 1). An explanation of the mor photype abbreviations, formal names, and references for each of the taxa previously described, as well as brief infor mal descriptions for all taxa bearing morphotype names, is presented in appendix 4.
ADJUSTMENTS TO THE DATA SET
Taxa represented by only one specimen at a given local ity were eliminated from all analyses presented here because the probability of misidentification of single leaves is high in angiosperm floras. Although some specimens that are clearly distinct were eliminated by this adjustment, the effect on the data set is minor. Only 95 specimens were eliminated. Of these 95, 22 were present as a single specimen at a single locality. For most analyses described here, only leaf taxa are included because of the marked variability in preservation of more fragile fruits, flowers, and seeds. All organ taxa were included in statistics on species richness, but only leaf taxa were included in statistics on diversity, leaf margins, and leaf size and in all multivariate analyses.
^
Lea
ves
()
Biv
ales
Bio
turb
atio
n
Coa
l be
d
EX
PLA
NA
TIO
N
|"^
=^
| P
lana
r la
min
atio
n
Rip
ples
Roo
ted
hor
izon
Tro
ugh
cros
sbed
ding
[ **|
Coa
l or
sha
le c
last
s
^^^
-i2Sx
( *<t
v «*
^
?
<>
I I
' '
I
cla
y si
lt sa
ndI
I '
' i
cla
y si
lt sa
nd
600
me
ters
100
mete
rs
SO
UT
H
cla
y si
lt sa
nd
7 C
NO
RT
H
Fig
ure
5.
Stra
tigra
phic
sec
tions
of
the
Eoc
ene
Puge
t Gro
up, L
-Bar
sili
ca q
uarr
y, w
est-
cent
ral
Was
hing
ton,
sho
win
g lo
catio
n of
pla
nt-b
eari
ng b
eds
and
supe
rpos
ition
al r
e
latio
nshi
ps o
f fac
ies.
Coa
l bed
s ar
e la
belle
d a
thro
ugh
h on
lef
t sid
e of
col
umn
A.
Loc
atio
n of
L-B
ar s
ilica
qua
rry
is s
how
n in
fig
ure
4.
O
O w z m H m 3 on
on I O 130
B8 EVOLUTION OF SEDIMENTARY BASINS SOUTHWEST WASHINGTON AND NORTHWEST OREGON
LACUSTRINE CUTOFF
WELL-DRAINED LEVEE
SWAMP
FLOODBASIN
DISTAL SPLAY
Figure 6. Relationships of depositional environments in the upper delta plain, Eocene Puget Group, west-central Washington.
70
js
60
50
40-
30PQ
10-1
00 100 200 300 400 500 600 700 800
NUMBER OF SPECIMENS IDENTIFIED
Figure 7. Numbers of specimens and taxa for 20 plant-fossil lo calities from the Eocene Puget Group, west-central Washington. Locality is identified by two-digit number. Mean number of speci mens censused per locality is 680; census data for as many as 800 specimens are shown.
GENERAL CHARACTERISTICS OF THE UPPER RAVENIAN FLORA
Vegetational characteristics of the late Ravenian sub- stage may be inferred best by grouping all localities together. This grouping provides a general framework against which environmental data derived from single localities or from different types of depositional environments may be com pared. Localities 04 and 34 were eliminated from the analy ses described in the following three paragraphs because they both clearly represent strata assigned by Wolfe (1968) to dif ferent substages of the Eocene than that represented by the 18 L-Bar quarry localities.
A total of 10,199 specimens was evaluated for the char acterization of the upper Ravenian leaf flora. The 92 taxa present include 74 dicotyledonous angiosperms, 8 monocot- yledonous angiosperms, 7 ferns, 2 conifers, and 1 sphenop- sid. Fifty percent of the dicots are entire-margined. The dicotyledonous leaf-size index (Wolfe, 1978) of 51 indicates a flora dominated by notophyllous-leaved (2,025-4,500 mm2, after Webb, 1959) species. The proportion of the flora represented by evergreen species is difficult to determine from the data because many of the leaves cannot be assigned to an extant family (for which leaf abscission cycle would be
HETEROGENEITY IN THE PLANT-FOSSIL RECORD B9
known). Even some leaves assignable to an extant family cannot be designated as evergreen or deciduous because the extant family includes both evergreen and deciduous genera (Oleaceae, Fagaceae, Rosaceae, Euphorbiaceae, Tiliaceae), and the fossil is not clearly chartaceous (thin textured, typi cal of deciduous leaves) or sclerophyllous (thick textured, more typical of evergreen leaves). A rough estimate of 50 percent evergreen taxa can be made, based on the thickness of the carbonaceous film or the thickness of the impression of the fossils. These foliar physiognomic parameters indi cate that the 18 localities from the quarry section represent a Notophyllous Broad-Leaved Evergreen Forest (oak-laurel type forest) whose modern analog in Japan and China today grows under mesic conditions having mean annual tempera tures of greater than 13°C and equable temperatures on a yearly basis (Wolfe, 1979). The relatively large leaf size indicates that summer mean temperatures may have been greater than 20°C.
In comparison, upper Ravenian assemblages from Alaska (Wolfe, 1977) are composed of 20 percent entire- margined species that were predominantly (75 percent) deciduous (table 2). These data indicate that late Ravenian Alaskan forests represented the warm end of the Mixed Mes ophytic zone of Wolfe (1977, 1978). The lower and middle Ravenian assemblages from Alaska have entire-margin per centages of 65 percent and 54 percent, respectively, and are inferred to represent Paratropical Rainforest and Notophyl lous Broad-Leaved Evergreen Forests (table 2) (Wolfe, 1977). In comparison to the Puget Group, the Alaskan leaf assemblages suggest that deterioration of climate during the Eocene was more pronounced at high latitudes than at the coastal position and paleolatitude of the Puget Sound.
Other upper Ravenian floral localities from North America include the Copper Basin flora of Nevada (Axelrod, 1966), the Middle Clarno assemblage from central Oregon, and the Lower Cedarville flora of northern California (Wolfe, 198la). All of these floras have low entire-margin percentages (25-40 percent); thus the coastal-lowland, upper Ravenian Puget Group assemblages are distinctive with respect to the more inland and upland floras represented in Nevada, Oregon, and California. The upland Fultonian Republic flora from eastern Washington (Wolfe and Wehr, 1987) also shows a lower percentage of entire-margined taxa and a smaller leaf size than floras of the upper Ravenian Puget Group. The slightly younger Kummerian Comstock flora of Oregon represents a more coastal, warm-mesic assemblage similar to that from the Puget Group (table 2).
ANALYSIS OF PLANT DISTRIBUTION PRESENCE-
ABSENCE DATA
Several types of analysis were performed to determine whether depositional environment or stratigraphic position had the stronger control on the floristic composition of the
o Z uJG
1OH
.£? O S
5
ex
1O
I
o, E o U
4)O3$
Forest climatic zone
£3 UN
.3 '"5p og jjc'hi § § &g g M
4) i «- o. g 8 H -*Hc «u t/5
. u o 'oz 1
&
E
Co"
ON
aZ
13
5$ (o5 ^oo 2ON O1 "0£ 2ON <U'-H 1-* ^
* I *. g-3 S S* ONi> "5 Hi > '& -a oo ^ 3 ^2 £>O . . vo Oo^r^oo- 'ON* 'r~t^|> ^t^vor-^r-r»t^llOONONONOONONON^
8 1 ° « 0 .aSca^^feuwcaS^^ K^ ^UX^lg6 S & § o- 5 SS S &O-H sB O O--3'-5 O U^&SUJ^^OS
BIO EVOLUTION OF SEDIMENTARY BASINS SOUTHWEST WASHINGTON AND NORTHWEST OREGON
plant-fossil assemblages. All 20 localities are included in the following analyses, and the following facies are included: floodbasin, which is divided into overbank floodbasin and distal crevasse splay; lacustrine cutoff, which is divided into intermittently active lacustrine cutoff and low-energy lacus trine cutoff; and channel margin.
For most analyses, no differences could be detected between floras from the two lacustrine-cutoff subenviron- ments or between floras from the two floodbasin subenviron- ments. Therefore, in the tabulations of assemblages that follow, the floodbasin assemblages are grouped together and the cutoff assemblages are grouped together.
SPECIES RICHNESS
For the purposes of this report species richness is defined to indicate the number of species present in a given area. To assess the importance of spatial and temporal changes, the species richness of each of the 20 plant-fossil localities was plotted with respect to facies type (fig. 8A) and stratigraphic position (fig. 85). The mean species richness per locality is 20.2. Assemblages from channel-margin localities have significantly lower (a=0.05) mean species richness (12.4) than those from floodbasin localities (24.3). The intermediately rich lacustrine-cutoff assemblages are not statistically differentiable from either floodbasin or channel-margin floras in species richness (a=0.5). The mid dle third of the stratigraphic section (fig. SB) contains local ities (33,24,27, 30, 36) that have lower than average species richness (not statistically lower than the other localities as a group, a=0.05) that may indicate a short interval during which species richness was lower. These five localities, however, represent channel-margin and lacustrine-cutoff facies, both of which tend to contain floral assemblages hav ing lower species richness values than floodbasin assem blages (fig. 8A). Floodbasin assemblages from this interval are not available to differentiate between the two explana tions for lowered species richness.
SPECIES DIVERSITY
Species diversity is a measure of the number of species present in a sample or community weighted by the number of individuals of each species in that sample or community (Pielou, 1975). A high level of diversity describes a commu nity in which plants are apportioned equally among a large number of species. Diversity measures thus take into account the probability of encountering a single individual of each species in a sample and are not the same as species richness. The use of this type of information-theory diversity measure has come into question on theoretical grounds (Hurlbert, 1971; Peet, 1974) and is used herein only to illustrate differ ences among similarly collected samples rather than between different sample sizes and sampling regimes.
Figure 8. Species richness by locality for 20 plant-fossil locali ties from the Eocene Puget Group, west-central Washington. Av erage richness (20.2 per locality) for the 20 localities is plotted as a horizontal line. A, Localities grouped by facies type and by stratigraphic position within facies type. B, Localities grouped by stratigraphic position.
Diversity of each of 20 localities from the Puget Group is shown in figure 9 using the Shannon-Wiener index, designed to estimate the diversity of a community from a limited sample (Pielou, 1975). The average diversity of channel-margin assemblages is low (0.59), and, even if the very low diversity locality 17 is omitted, the average diversity of channel-margin assemblages is lower (0.73) than that of either floodbasin (0.97) or lacustrine-cutoff (0.82) assemblages.
LEAF MARGINS OF ANGIOSPERM TAXA
The positive association between the percentage of woody, dicotyledonous species in a flora having entire- margined leaves and mean annual temperature of a floristic
55 LOCALITY NUMBER BY FACIES TYPEFigure 9. Shannon-Weiner diversity index (Pielou, 1975) for 20 plant-fossil localities from the Eocene Puget Group, west-central Washington, grouped by facies type and, within facies type, by stratigraphic position.
region was noted by Bailey and Sinnott (1915, 1916) and quantified by Wolfe (1971, 1979). The percentages of spe cies having entire margins are higher in modern floras from warm, mesic areas, and lower in floras from areas of lower mean annual temperatures. This correlation has allowed paleobotanists to suggest mean annual temperature values for Tertiary floras without a lengthy taxonomic analysis of each locality (Wolfe 1971, 1981b). A stratigraphic succes sion of floras then can be analyzed for evidence of climatic trends.
Low numbers of taxa can adversely affect the accuracy of entire-margin percentages from Tertiary floras. Wolfe (1971,1981b) suggested using a minimum of 30 taxa for cal culating margin percentages. Five of the localities plotted in figure 10 have less than 15 dicotyledonous taxa and are marked with an asterisk to indicate that the number of spe cies present is probably inadequate for determining paleo- temperatures based on the single localities alone.
Percentages of entire-margined species are plotted for the 20 plant-fossil localities from the Puget Group, grouped by facies (fig. 10A) and by stratigraphic position (fig. 105). The average per locality percentage of entire-margined spe cies is 49.3 percent (very close to the 50 percent entire mar gins recorded for all taxa in the 18 L-Bar quarry localities). Assemblages from the floodbasin localities deviate very lit tle from the total mean percentage of entire margins, whereas assemblages from lacustrine-cutoff localities are quite vari able, from 25 percent to 87 percent entire (fig. IOA). Chan nel-margin assemblages tend to have lower entire-margin percentages (average 41.9 percent), as has been predicted (MacGinitie, 1953; Wolfe, 1979). Locality 18 is aberrant with respect to other channel-margin localities, having an entire-margin percentage of 60. The locality has a low
c/noo2O 90 "
< 80-
g 70-
60
§40^
20
10]
O. 0
ACUSTRINE CUT FF
CHANNEL MARGIN
O 80
1 7°
r$ 60
H 50>§ 30
| 20
S 10
£a. o
B
li4233525263133242730362932 7 172218192134
LOCALITIES BY STRATIGRAPHIC POSITION
Figure 10. Percentage of species having entire-margined leaves for 20 plant-fossil localities, Eocene Puget Group, west-central Washington. Average entire-margin percentage for the 20 localities is 49.3 percent. A, Localities grouped by facies type (see Burnham, 1990) and, within facies type, by stratigraphic position. B, Locali ties grouped by stratigraphic position. Asterisks indicate localities having species richness, <15.
number of species, which may contribute to this high per centage, but the taxonomic composition also shows marked similarities to floodbasin assemblages, which may indicate that the higher entire-margin percentage is valid and not an artifact of low species richness. This locality is unusual with respect to other channel-margin assemblages, as is discussed later in greater detail.
There is no clear relationship between leaf-margin per centage and stratigraphic position (fig. lOfi). A sequence of lower entire-margin percentages is present in the middle third of the section. Of the eight lower than average percent ages recorded from locality 24 through locality 22, the five lowest are from assemblages of channel-margin and lacus trine-cutoff facies. This decrease in percentage of taxa hav ing entire-margined leaves in the middle of the section, if representative of mean annual temperature, could represent
B12 EVOLUTION OF SEDIMENTARY BASINS SOUTHWEST WASHINGTON AND NORTHWEST OREGON
Table 3. Leaf-size classes.[Fom Webb (1959), Wolfe (1985), and Wolfe and Upchurch (1987). Leaf size (LSI) can be calculated from the percentage of leaves in the classes listed using the equation (Wolfe, 1978):
*Length applies to leaves having basically elliptic shape.
a decrease in temperature of 4°C (Wolfe, 1979), altering the forest classification from Notophyllous Broad-Leaved Ever green to between Notophyllous Broad-Leaved Evergreen and Mixed Mesophytic. Of the nine localities in the middle of the section that include this possible cooling trend, six represent channel-margin and lacustrine-cutoff environ ments, which have, on average, lower entire-margin percent ages. The three floras from floodbasin facies (29, 32, 7) do not indicate a lowering of mean annual temperature. Thus, paleoenvironment, rather than climatic change, controls the distribution of taxa and thus of entire-margin percentages.
LEAF SIZE OF ANGIOSPERM TAXA
Several studies suggest a positive correlation between leaf size and climatic parameters (Dolph and Dilcher, 1979, 1980a, b; Wolfe, 1979, 1990; Greenwood 1992). In mesic areas, leaf size tends to increase with an increase in mean annual temperature. This relationship may hold only for areas in which the cold-month mean temperateure is higher than -2°C (Wolfe, 1979). A leaf-size index was proposed by Wolfe (1978, fig. 5) to classify both fossil and extant plant assemblages. The average size class of each dicotyledonous taxon is determined (after Webb, 1959), and the percentage of the dicotyledonous flora in each size class is calculated. The equation for leaf-size index (LSI) (Wolfe, 1978; Wolfe and Upchurch, 1987; Greenwood, 1992) is:
Dimensions for each leaf-size class are listed in table 3.
Leaf-size indices for the 20 floristic assemblages under consideration from the Puget Group are plotted with respect to facies (fig. 11A) and stratigraphic position (fig. 1 IB). The average leaf-size index for all 79 dicotyledonous leaf taxa is 51. The average dictyledonous leaf-size index for all locali ties is 57. This slight difference indicates that the larger leaved taxa are more frequently represented in the assem blages than are smaller leaved taxa. Both values (all dicotyledonous taxa versus locality averages) indicate a
Figure 11. Leaf-size index of dicotyledonous taxa for 20 plant- fossil localities, Eocene Puget Group, west-central Washington. Average leaf-size index is plotted as a horizontal line; leaf-size in dex as calculated by Wolfe (1978; see text for discussion). A, Lo calities grouped by facies type (designation in Burnham, 1990), and, within facies type, by stratigraphic position. B, Localities grouped by stratigraphic position.
forest including taxa having predominantly Notophyllous leaves. There is neither a trend nor a substantial difference within localities derived from specific depositional settings or from a particular stratigraphic position (fig. 11). The lack of any trends supports the idea that the mid-section differ ence in species richness and percentage entire margin is most likely due to facies effects. In the assemblages from the Puget Group, the leaf-size index does not appear to be sensi tive to environmental differences.
CONIFERS, PTERIDOPHYTES, AND SPHENOPSIDS
Depositional environments appear to have strong con trol on the distribution of the sphenopsid, pteridophytes, and conifers at the 20 Ravenian localities (fig. 12). Assemblages
HETEROGENEITY IN THE PLANT-FOSSIL RECORD B13
4 25262932 7 1921342335313327222430361718
LOCALITIES ORDERED BY STRATIGRAPHIC POSITION WITHIN FACIES TYPE
EXPLANATION
Equisetum [H Conifers Ferns
Figure 12. Species richness of ferns, conifers, and Equisetum in 20 plant-fossil localities from the Eocene Puget Group, west-cen tral Washington. Localities are grouped by facies type, after desig nations in Burnham (1990).
from channel-margin facies have none of the 10 non- angiosperm taxa: all are in the floras from floodbasin and lacustrine-cutoff facies. The two conifers are present in the floras from five floodbasin localities and one lacustrine-cut off locality. The conifers probably inhabited the stable back- swamps or back-levee areas near floodbasins. The seven pteridophytes and Equisetum are found in floras from flood- basin and lacustrine-cutoff localities. Pteridophytes nor mally are present in low frequencies (<5 percent of specimens from a single locality), but at two distal-splay (floodbasin) localities (25 and 26) ferns make up more than 20 percent of the specimens. The pteridophyte distribution may have two interpretations: (1) channel margins were not stable enough to allow fern rhizomes or gametophytes to become established, and areas of lush fern growth were restricted to floodbasins, levees, backswamps, and the more tranquil floodplain areas; or (2) higher energy depositional environments destroy finely divided pteridophyte foliage, which can be more fragile than that of angiosperms. Burial of ferns by sediment may have occurred only during rapid sedimentation events, as might be expected in distal splays. Both explanations probably account for the distribution observed.
COMPARISON OF FLORISTIC ASSEMBLAGES
Sorenson's Index of Similarity (also, known as Dice's Coefficient; Sneath and Sokal, 1973) was used to calculate
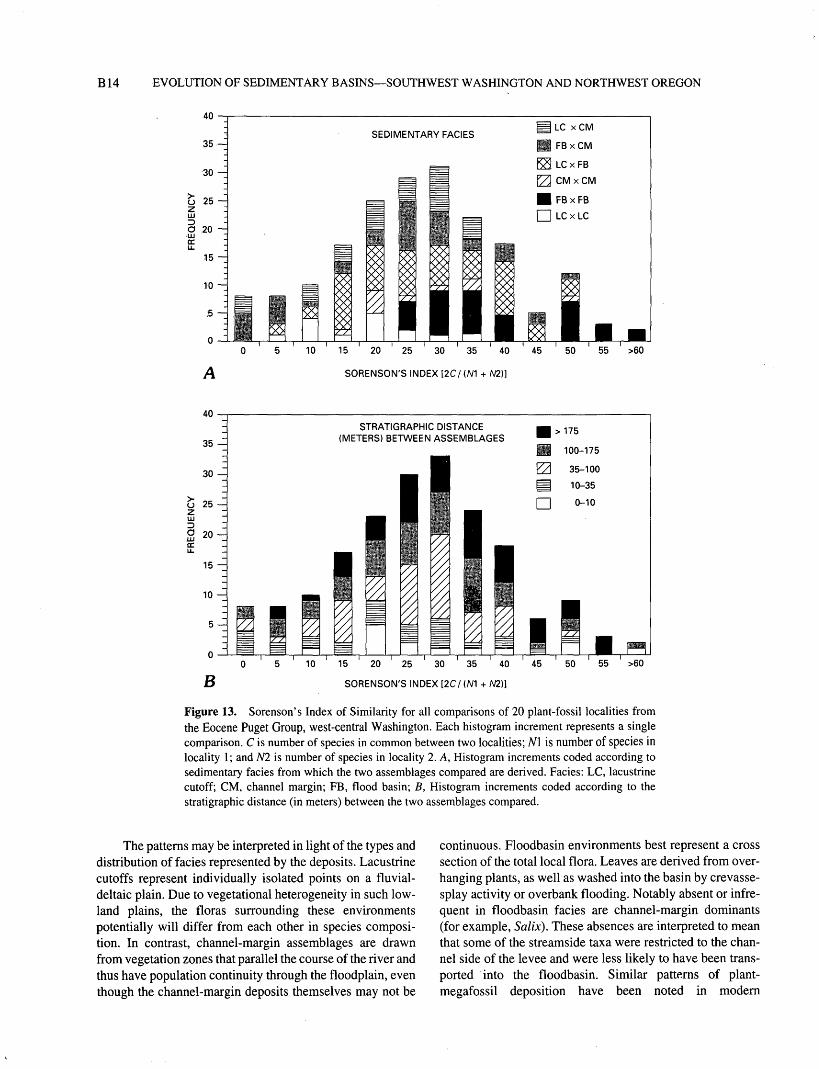
the similarity in paired species lists between all localities: the higher the value of the index, the greater the similarity between the list of species in the two localities compared. A total of 190 pairwise comparisons can be made among the localities. Figure 13A shows all floristic comparisons; each histogram increment is coded to indicate the depositional facies from which the two floras compared were drawn. Sim ilarities between assemblages derived from floodbasin facies are much greater than any other single type of comparison. The average similarity between floodbasin assemblages (mean similarity = 41 percent) is the highest of all compari sons. There is substantial difference between the similarity distribution for floodbasin-floodbasin comparisons and that for lacustrine cutoff-lacustrine cutoff comparisons. This dif ference indicates that although lacustrine-cutoff assem blages are similar physiognomically to floodbasin assemblages, lacustrine-cutoff assemblages are dissimilar to one another with respect to floristic composition. All other types of comparisons show distributions that are intermedi ate between these two endpoint types of distributions, including channel margin-channel margin comparisons.
Stratigraphic position of plant-fossil localities in the Puget Group sequence would be expected to have some con trol on the degree of floristic similarity between localities if climatic or evolutionary change had occurred during the time of deposition. To determine whether Stratigraphic position had an effect on the similarity among floras, I plotted the same Sorenson's Indices on figure 135 and coded them to represent the Stratigraphic distance between the two samples compared. If Stratigraphic distance had an effect on floristic similarity, the more closely spaced samples would have higher similarity values. Conversely, if Stratigraphic position had little control on the floristic composition of localities, an even distribution of similarity values would be expected. No stratigraphically controlled difference can be detected in the upper Ravenian sequence, whereas depositional environ ment (fig. 13/4) appears to have a strong control on species composition.
SUMMARY OF DATA ON PRESENCE- ABSENCE OF SPECIES
Overall, the greatest similarity in floristic composition between assemblages from the 20 localities censused is between those collected from floodbasin deposits. Assem blages from lacustrine-cutoff and channel-margin localities are less similar to one another (lacustrine cutoff-channel margin), less similar to themselves (lacustrine cutoff-lacus trine cutoff and channel margin-channel margin), and less species rich and, on average, include a lower proportion of Pteridophytes and Coniferophytes. Influence of Stratigraphic position is not apparent (figs. 6B, SB, 105, 135); floras from floodbasin facies have the highest similarity in composition to one another, regardless of Stratigraphic position.
EVOLUTION OF SEDIMENTARY BASINS SOUTHWEST WASHINGTON AND NORTHWEST OREGON
10 15 20 25 30 35 40 45
SORENSON'S INDEX [2C/ (A/1 + A/2)]
55 >60
STRATIGRAPHIC DISTANCE (METERS) BETWEEN ASSEMBLAGES
15 20 25 30 35 40
SORENSON'S INDEX [2C/ (A/1 + A/2)]
50 55 >60
Figure 13. Sorenson's Index of Similarity for all comparisons of 20 plant-fossil localities from the Eocene Puget Group, west-central Washington. Each histogram increment represents a single comparison. C is number of species in common between two localities; Nl is number of Species in locality 1; and N2 is number of species in locality 2. A, Histogram increments coded according to sedimentary facies from which the two assemblages compared are derived. Facies: LC, lacustrine cutoff; CM, channel margin; FB, flood basin; B, Histogram increments coded according to the stratigraphic distance (in meters) between the two assemblages compared.
The patterns may be interpreted in light of the types and distribution of facies represented by the deposits. Lacustrine cutoffs represent individually isolated points on a fluvial- deltaic plain. Due to vegetational heterogeneity in such low land plains, the floras surrounding these environments potentially will differ from each other in species composi tion. In contrast, channel-margin assemblages are drawn from vegetation zones that parallel the course of the river and thus have population continuity through the floodplain, even though the channel-margin deposits themselves may not be
continuous. Floodbasin environments best represent a cross section of the total local flora. Leaves are derived from over hanging plants, as well as washed into the basin by crevasse- splay activity or overbank flooding. Notably absent or infre quent in floodbasin facies are channel-margin dominants (for example, Salix). These absences are interpreted to mean that some of the streamside taxa were restricted to the chan nel side of the levee and were less likely to have been trans ported into the floodbasin. Similar patterns of plant- megafossil deposition have been noted in modern
HETEROGENEITY IN THE PLANT-FOSSIL RECORD
environments (McQueen, 1969; Birks, 1973; Scheihing and Pfefferkorn, 1984). Floodbasin deposits preserve what appears to be only a partially autochthonous flora, derived from the levees and low-lying back-levee areas. The area covered by floodbasins may have been extensive, as in mod ern delta plains (Scheihing and Pfefferkorn 1984), which would effectively homogenize a large, diverse flora when sampled at several different points.
ANALYSIS OF PLANT DATA TAXON ABUNDANCE
The abundance of leaf specimens of each taxon in plant-fossil collections depends on proximity of source plant to depositional site, ease of fragmentation, cyclicity of abscission, and rate of degradation. Presence-absence data treat each taxon equally, eliminating the variability in abun dances that may be caused by leaves composed of many leaf lets or by synchronous leaf abscission of particular species. Abundance data, however, do not overemphasize rare spe cies as do presence-absence data. A direct measure of taxon abundance can help to differentiate samples derived from vegetation having similar taxonomic compositions but dif ferent proportions of taxa. Dominant species are most impor tant in analyses using abundance data. Abundance data can be analyzed using two general groups of methods: ordination and cluster analysis. These techniques reduce multidimen sional data to a small number of dimensions so that the major variation can be plotted and viewed easily. Both methods are used here to illustrate the abundance data from the 20 local ities sampled in the Puget Group.
ORDINATION OF LOCALITIES
METHODS
Ordination is a procedure by which complex, multidi mensional community data are summarized using a low number of axes (1 to 3) on which similar localities are grouped close together and dissimilar localities are far apart (Gauch, 1982). For these analyses, I used both Reciprocal Averaging (also known as Correspondence Analysis) and Detrended Correspondence Analysis (Hill and Gauch, 1980; Gauch, 1982). Both methods are iterative techniques in which sample scores are averages of species scores and chi- squared distances are used to maximize the correlation between samples and species. In Detrended Correspondence Analysis, the axes are rescaled to correct for a tendency for the second- and higher-order axes to be correlated with the first axis and for the ends of axis 1 to be compressed relative to the center as a result of the typical Reciprocal Averaging procedure (Hill and Gauch, 1980; Gauch, 1982; Wartenberg and others, 1987). Results obtained using the two methods
Figure 14. Axes 1 and 2 from Detrended Correspondence Analysis (DECORANA) of 20 plant-fossil localities from the Eocene Puget Group of west-central Washington. Data used are log-transformed abundance counts of 92 taxa (appendix 1). Eigenvalues: axis 1, 0.386; axis 2, 0.295.
are very similar for axes 1 and 2, indicating that the first two axes are not significantly correlated when using Reciprocal Averaging without rescaling.
Localities were ordinated using both Reciprocal Aver aging and Detrended Correspondence Analysis based on abundance data that were log-transformed prior to analysis. Log-transformation was used because of the high abundance of certain species, particularly in channel-margin environ ments (appendix 1). These high abundances, if untrans- formed, distort the position of the localities along the axes such that single localities having abundant, almost unique species form endpoints and all other localities lump together at some point between the outliers.
RESULTS AND DISCUSSION
Axes 1 and 2 for Detrended Correspondence Analysis are plotted in figure 14. Floodbasin localities are grouped in the lower left, channel-margin localities in the upper left, and lacustrine-cutoff localities in a broad band through the cen ter. Floras derived from floodbasin localities within the lower left quadrant of the plot cannot be secondarily subdi vided. The lack of distinct separation between floras derived from lacustrine-cutoff and channel-margin facies indicates that, based on numerical abundance of foliage, the two types of facies have substantial overlap in their floras. The assem blages from lacustrine-cutoff deposits generally differ both from each other (hence the broad band on axis 1) and from those of other facies (especially localities 27 and 33). One floodbasin locality, 25, has a low species richness and strati- graphically overlies a prominent coal seam. The flora is an
B16 EVOLUTION OF SEDIMENTARY BASINS SOUTHWEST WASHINGTON AND NORTHWEST OREGON
outlier, low in species richness, but is most closely allied to the rest of the floodbasin assemblages and may represent a hypoautochthonous assemblage from a clastic swamp. The low similarity values of locality 25 compared to other flood- basin assemblages may result from few taxa from levees and well-drained floodplain areas being represented in the assemblage.
Locality 18 (a channel-margin assemblage) is worthy of special mention because of its central position on the ordina tion plot. The sedimentological features of this locality con form well to a channel-margin facies (planar and ripple cross-lamination, isolated leaves, fine-sand grain size); how ever, its floristic attributes indicate its similarity to floodba sin assemblages. Leaves are taxonomically allied to those of floodbasin floras (relatively high Sorenson's Indices; appen dix 2). They may represent either plants from an environ ment that is transitional between channel-margin and floodbasin environments or an allochthonous assemblage originating in the source area of the floodbasin floras and incorporated into a near-channel environment. The strong similarity between sedimentary features at locality 18 and those of other channel-margin facies suggests that locality 18 represents a part of a crevasse-splay deposit that incorpo rated taxa from the floodbasin. The presence of a floodbas- inlike assemblage in channel-margin deposits indicates that the floodbasin floras represent the dominant regional vegeta tion and can be incorporated into any type of deposit because of their dominance on the floodplain.
METHODS
Spearman's Rank-Order Correlation Coefficient (Nie and others, 1975) was calculated for all pairs of sample localities, using quantitative data, to produce a matrix of similarities (appendix 3). The coefficient is derived by com paring the rank order of species between pairs of localities. Localities having similar dominance hierarchies (the rank- order lists) score as more similar to one another than those having dissimilar rank orderings of species. This comparison of species rankings between pairs of localities produces a measure that expresses the similarity based on dominance hierarchy rather than on absolute abundances. In contrast, Euclidean or normalized-Euclidean distance measures, which use quantitative data directly, are strongly biased by samples containing species having very high abundance val ues. Both unweighted and weighted (Sneath and Sokal, 1973) pair-group methods were used to cluster the similarity measures; these produced almost identical results.
RESULTS AND DISCUSSION
Results of the cluster analysis (unweighted-pair group method) based on Spearman's Rank-Order Correlation
70-
60-
1 40-fcO
UJP30- <2LU
^ 20-
10-
\!3 1 1.5<\
1
\82 6 7 293
l___
1 3 23
)
4 352 31 73 024 36 2227 3
TEXPLANATION
O Floodbasin Lacustrine ^.Channel margin
Figure 15. Cluster Analysis (UPGMA) of Spearman's Rank-Or der Correlation Coefficients for 20 plant-fossil localities from the Eocene Puget Group, west-central Washington. Taxa are ranked according to abundance. Dominance lists form the basis for the similarity matrix (appendix 3). Localities are coded according to the depositional facies from which they were derived (Burnham, 1990).
Coefficients are shown in figure 15. Localities cluster into two large groups and a small outlier, indicated by the bars in figure 15. The large group to the left includes all nine floras from floodbasin deposits, one from a channel-margin deposit, and two from lacustrine-cutoff deposits. Assem blages from floodbasin facies make up 85 percent of this group. The group to the right consists entirely of floras from lacustrine-cutoff and channel-margin facies. Localities 27 and 33 are outlying, as they are in most analyses, underscor ing the variability in species composition and dominance from lacustrine-cutoff facies. The groupings reflect neither stratigraphic position nor species richness and can be explained most easily on the basis of their shared deposi tional environments.
Localities 19 and 21, which are from the same strati- graphic level and represent floodbasin environments (distal splay), are most similar to one another (similarity=73), as might be expected. Floodbasin localities 7 and 29 are sepa rated by about 10 m of section and cluster at similarity=38. Localities 32 and 7, however, are separated by less than 3 m of section and both represent overbank-floodbasin subfacies of the floodbasin facies, yet locality 31 (lacustrine-cutoff facies) clusters more closely to locality 32 (similarity=46) than does locality 7 to locality 32 (similarity=38). Overall, the floodbasin group holds together, although the average similarity for the cluster is fairly low (similarity=22). In con trast, the group of channel-margin and lacustrine cutoff envi ronments generally does not reflect proximity of stratigraphic position or depositional environment. It is clear that the pattern of dominance is more similar among
HETEROGENEITY IN THE PLANT-FOSSIL RECORD B17
floodbasin localities than among lacustrine-cutoff localities. High similarity of dominants among floodbasin localities indicates that the assemblages may have been derived from a large rich flora dominated by a few (perhaps about 20) spe cies. The assemblages are homogenenous, probably due to natural sampling and sedimentary processes responsible for the floodbasin deposits. The low level at which the two major clusters are linked (12 percent) indicates a general dis similarity between localities that could be due to floristic richness or to the amount of time represented by the sequence. The clustering method used for vegetational anal yses is effective, particularly for visualizing the dominance data, but probably has no real advantages over ordination procedures.
ENVIRONMENTAL HETEROGENEITY IN THE PUGET GROUP
Species present in the 20 localities of the Puget Group are probably controlled primarily by the depositional envi ronment from which they were derived. The frequency with which taxa are present at localities, coupled with the large number of total taxa recorded for the stratigraphic section, indicates that taxa are not distributed uniformly among local ities.
The following factors are most likely to have influenced this distribution of taxa.
1. Plant-species distribution is patchy. The conse quence of differing environmental tolerance among plant species in a heterogeneous environment is vegetational het erogeneity. Plant litter reflects the differentiation of species preferences for specific environmental sites. This type of dif ferential litter distribution by microhabitat occurs in modern environments and has been shown to be due to source-plant zonation and patchiness among the subenvironments along the Rio San Pedro of southern Mexico (Burnham, 1989).
2. Transport and degradation of plant litter is not equal for all species. Plant parts of different taxa degrade dif ferentially following abscission, and the differential hydro- dynamic properties of leaves have the potential to sort taxa, causing them to be present patchily in a group of samples. Within a single sample, the high abundance of rare taxa is caused by proximity of the source plant to the fossil locality or by similar fluid-dynamic properties of leaves of a single species (Spicer and Greer, 1986; Spicer and Wolfe, 1987; Burnham and others, 1992).
3. Sampling scale affects our perception of species distribution. The small scale of outcrop sampling for paleo- botanical specimens can make a group of samples appear heterogeneous. Most samples are derived from a limited ver tical and lateral extent that may reflect only the plants imme diately surrounding the site. Heterogeneity of the standing
vegetation is commonly on a scale large enough that a paleobotanical sample cannot reflect the major patterns. A limited number of plants can contribute to litter at a small site. This factor was observed to affect the reliability of sin gle 0.5-m2 litter samples used for reconstruction of the standing vegetation in the modern floodplain of the Rio San Pedro (Burnham, 1989). The effective source area for autochthonous deposits is only on the order of 0.1 to 0.125 hectare (Burnham and others, 1992).
The presence-absence data and the dominance patterns (table 4) indicate that a high level of floodplain heterogene ity existed but that the scale at which the heterogeneity is sampled affects our perception of it. Cutoff meanders vary greatly in species composition, possibly because they are environments that incorporate such a small part of the flood- plain vegetation. Floodbasin samples are less heterogeneous because they are drawn from a larger and more continuously distributed source flora and thus incorporate regionally dom inant taxa rather than local dominants. The larger scale rep resented by the deposits from floodbasins is probably the most reliable for reflection of the regional vegetation. Chan nel-margin floras have a smaller number of dominant taxa (2-4) than lacustrine-cutoff and floodbasin assemblages (2-6). Two taxa (Salix and Cercidiphyllum-Trochodendron Complex) tend to dominate each channel-margin locality. Thus, although less diverse than assemblages from other facies, channel-margin assemblages are relatively homoge neous. This homogeneity is interpreted to indicate that the channel-margin assemblages are derived from a source flora that is homogeneous relative to that from which the lacus trine-cutoff floras are derived. Some of the observed homo geneity of channel-margin floras could have been caused by transport and mixing in the channel, although this latter explanation requires a transport pattern that can mix all taxa in a similar manner.
DISCUSSION
SPECIES DISTRIBUTION IN THE UPPER RAVENIAN PUGET GROUP
The preceding analysis of vegetational patterns from upper Ravenian rocks of Washington State suggests that paleoenvironment, as recorded by depositional facies, was the major factor influencing the plant-species composition and dominance throughout the stratigraphic sequence and that, in contrast, the effect of stratigraphic position was minimal. Although the stratigraphic sequence is thin (200 m) relative to the complete section (1,890 m) described from the Puget Group, the lack of a stratigraphic trend here suggests that depositional environments may have had some control on changes in floral assemblages observed in
B18 EVOLUTION OF SEDIMENTARY BASINS SOUTHWEST WASHINGTON AND NORTHWEST OREGON
Table 4. Dominant taxa (5 percent or greater relative abundance) at 20 plant-fossil localities from the Eocene Puget Group,Washington.[Taxa and abbreviations for informally named taxa are given in appendix 4]
other parts of the complete section. For example, the Fulto- nian stage is represented by less than 115 m in the Green River Gorge section, yet interpretation of the section and its subdivisions was not made in light of the environments of deposition represented.
The pattern of distribution of source plants can be com pared by analogy to that along the Rio San Pedro in Tabasco, Mexico, where zones of streamside vegetation are flanked by more diverse levee and back-levee vegetation (Burnham, 1989). Subenvironments of the modern floodplain have a strong influence on the species composition and thus on the litter that might be preserved in the fossil record. Plant-spe cies composition is likely to have been somewhat patchy in the Puget Group floodplain; individuals of species probably were distributed in clumps or zones across a heterogeneous edaphic or topographic area. This type of distribution has been documented in temperate and tropical forests (Nixon and others, 1977; Hubbell, 1979; Hupp and Osterkamp, 1985) and has been presumed to be due to patchy dispersal and disturbance.
The species composition along the river margins appar ently was less rich than that in the area more distal to the
river channel (floodbasin and lacustrine cutoff). Physiogno- mically, the channel-margin assemblages have a lower entire-margin percentage than assemblages derived from other facies. Leaf-size index of floras from channel-margin facies is not different from that derived from assemblages of other facies, and the proportion of deciduous taxa is similar to that in the whole flora. Floristically, the channel-margin assemblages are dominated by taxa (Cercidiphyllum-Tro- chodendron Complex and Salix) that are allied either to modern forms more characteristic of streamsides than mature forests or to forms interpreted from fossil assemblages to be open-habitat woody species or colonizers (Mickey, 1977; Wing, 1981; Crane, 1984; Crane and Stockey, 1985; Crane and others, 1991). The channels may have acted as conduits along which species able to live in marginal, disturbed environments could be distributed. This continuity would effectively homogenize the channel-mar gin plant assemblages, producing a relatively high level of similarity. The presence of several channel-margin deposits in the middle of the stratigraphic section gives the false impression of a climatic or disturbance event. The principal controlling factor is the depositional environment, an effect
HETEROGENEITY IN THE PLANT-FOSSIL RECORD B19
that would not have been detected without the kind of anal ysis presented here.
In contrast, floodbasin deposits are the product of over- bank flooding and distal crevasse-splay activity. Leaf litter accumulating in these low-lying back-levee areas was derived from a rich, but patchy, source vegetation. The floodbasin assemblages, on average, are very similar in physiognomic aspects to the whole flora from the Puget Group. This reflects the large proportion of the total flora that is present in floodbasin assemblages as a whole (73 of 92), as well as the high species richness of most of the flood- basin assemblages. Floristically, the dominant taxa from floodbasin assemblages are Viburnum, Glyptostrobus, two leaf taxa that resemble leaflets of the Juglandaceae, and Dryophyllum, presumably a member of the Fagaceae. These taxa are related to modern taxa whose ecological distribu tions range from swamps, especially Glyptostrobus, to mod erate uplands, especially Viburnum and members of the Fagaceae. Regional vegetation is represented best by several samples from this back-levee area.
The observed similarity among floodbasin assemblages can be attributed to the large and continuous area sampled by the floodbasin deposits, which effectively homogenizes the species-rich assemblages. Floodbasins are interpreted to rep resent an area in which species heterogeneity on a small scale may be substantial; however, over a large area, hetero geneity is reduced because of the recurrence of particular species at moderate to low abundances in many areas. Figure 16 illustrates this concept. Note that source floras near cutoff meanders are unlike each other, whereas source floras for near-channel assemblages are very similar. Regional vegeta tion is best reconstructed from fossil floras using numerous samples from paleofloodbasins with representative samples (localities) from a variety of subenvironments, as shown in figure 16.
Lacustrine-cutoff floras are species rich, although, on average they are less species rich than floodbasin assem blages. The average percentage of entire margins is essen tially the same for lacustrine-cutoff assemblages as for floodbasin floras but shows a wider range of variation among samples. Average leaf size of lacustrine-cutoff assemblages is the same as for floodbasin assemblages and the total flora, but again, is more variable than floodbasin assemblages. The notable feature in analysis of lacustrine- cutoff assemblages is their lack of similarity to one another. They show low site-to-site similarity in terms of presence and absence of taxa, as well as abundance and dominance.
The lacustrine cutoffs probably were isolated on the floodplain. Their isolated distribution created barriers to the continuity of plant populations that colonized lacus trine-cutoff environments and produced the observed high site-to-site variation in plant litter. Source floras growing alongside different lacustrine cutoffs (and in the cutoff if infilling had progressed far enough) may have had different compositions, controlled by random colonization from the
CUTOFF MEANDERS
FLOODBASINS CHANNEL
Figure 16. Plan view of hypothetical fluvial-deltaic floristic het erogeneity. Each symbol represents one species and may include one to several individuals.
levee and back-levee area. Because of this high degree of variability, floristic or vegetational reconstructions based on lacustrine cutoff assemblages have the potential to be biased in unpredictable ways. A suite of lacustrine-cutoff assemblages does not provide a strong basis for prediction of the taxa or physiognomy of the vegetation likely to be present in another lacustrine-cutoff flora. If the source flo ras are homogeneous, this potential for bias is reduced.
Criteria that appear to be correlated with accurate reflection of regional flora are (1) high species richness relative to other localities from the same sequence but from apparently different depositional settings, and (2) consistency of characteristics from locality to locality within depositional environment (for example, richness, margin percentages, dominant taxa). Observation of these two criteria within samples drawn from a specific type of depositional environment probably indicates that regional vegetation can be reconstructed using several samples from the specified type of depositional environment (Burnham, 1993).
B20 EVOLUTION OF SEDIMENTARY BASINS SOUTHWEST WASHINGTON AND NORTHWEST OREGON
ANOMALOUS LOCALITIES AND THEIR USE IN INTERPRETING PALEOECOLOGY
physical sedimentary structures (Burnham 1990) do not pro vide adequate evidence for differentiation.
Certain plant localities are anomalous in the multivari- ate analyses. These localities are either extremes of a trend (localities 25 (floodbasin) and 17 (channel-margin)) or their scores are unusual relative to other samples. Localities 27 and 33 are examples of assemblages that are truly different from all others. These two localities form a low-similarity, outlying cluster on the dendrogram (fig. 15) and form the extremes at the right on axis 1 of the Reciprocal Averaging and the Detrended Correspondence Analyses (fig. 14). They probably are outliers that deviate from the general trend and thus may be of special interest because of their unique posi tion. Both samples are derived from lacustrine-cutoff facies and are from the lower-middle part of the section, 49 and 64 m, respectively, above the base (table 1). Both assemblages are dominated by taxa such as Salvinia and Zingiberopsis and by two monocotyledonous taxa that rarely are present in other assemblages (appendix 1). These dominant taxa prob ably are indicative of quiet standing water and suggest growth during the lacustrine phase of infill of an abandoned cutoff. They are not particularly similar floristically (Soren- son's Index=21 percent), yet they are consistently grouped together. The presence of these two extreme outliers strengthens the impression that lacustrine cutoffs are iso lated, vegetationally distinct islands on the floodplain.
As mentioned previously, locality 18, a channel-margin assemblage, also is anomalous with respect to the other channel-margin localities. It consistently groups with the floodbasin and lacustrine-cutoff assemblages (figs. 14, 15), even though it has a low number of taxa (n=13). All of the taxa recorded from this site are characteristic of floodbasin environments, and the sample does not contain Salix, which is present in many lacustrine-cutoff samples and all other channel-margin samples. Locality 18 was deposited in a coarsening-upward sequence of typical channel-margin sed iments that overlies a thin, coaly shale. This locality is inter preted to represent deposition in a position distal to the channel, even though sedimentation rates were higher (as indicated by the presence of ripple-cross-laminated sand stone, isolated leaves, and so on) than in typical cutoff or floodbasin deposits. In the facies classification used for this analysis (Burnham, 1990), channel-margin facies include several types of subfacies that represent minor channels, levees, point bars, and proximal crevasse-splay channels. Locality 18 is interpreted to represent a deposit from the proximal part of a crevasse splay, deposited farther from the channel than most proximal parts of crevasse splays. During deposition, the crevasse channel extended onto the floodba sin and incorporated typical floodbasin taxa, thus the high floristic similarity. In this case, the use of the taxonomic composition of plant-bearing deposits provided a means to assess the unique characteristics of the deposit even though
CONCLUSIONS
Three types of plant assemblages are present in the plant-rich floodplain deposits of the Eocene Puget Group of Washington State: relatively homogeneous floodbasin floras having high species richness, heterogeneous floras of lacus trine-cutoff sites having moderate, but variable, species rich ness, and relatively homogeneous channel-margin floras having low species richness.
The regional flora is represented best by floodbasin localities, which collect taxa from the high-diversity levee and back-levee areas, as well as from the swamp floras. The conclusions drawn from modern leaf-litter censuses in the Rio San Pedro, Mexico (Burnham 1989), support the con cept of floodbasin sites as the best indicators of regional flora. The correlation between abundance of individual spe cies in litter samples and their abundance in the standing vegetation is not clear (but see Burnham and others, 1992). The results of the present study of the Puget Group indicate that abundance data has the potential to distinguish plants common in the immediate area of the sample from those at greater distances.
The lacustrine-cutoff environments are interpreted as isolated pockets on the floodplain that incorporate the plants immediately surrounding them. Because cutoff flow is slug gish and episodic, plant parts from outside the immediate area rarely are transported into these cutoff environments. Studies on modern lacustrine-cutoff leaf litter versus other floodplain litter would be useful in supporting the standing vegetation distribution proposed for the Puget Group.
Channel-margin deposits are low in species richness. These deposits represent environments in which periodic disturbance of plant communities takes place; such environ ments are the least conducive to preservation and have the highest potential for leaf destruction. The floristic assem blages of channel margins may be homogeneous because of the conduit nature of the river itself. Plant populations spread along the banks or by dispersal in the water and become re established downstream. The distribution of plants along the banks of the Rio San Pedro bear on these observations (Burnham, 1989). The flora is less species rich along the channel margins of the Rio San Pedro. The same 5-10 spe cies are present as streamside dominants along most of the 20 km of river studied. Litter samples from surface sediments in the channel-margin environments are less diverse than those collected on, and in back of, the levees. Plant assemblages from channel-margin environments can be biased both taxonomically and physiognomically due to the taxonomic composition and vegetation type likely to develop in these more open, disturbed environments.
HETEROGENEITY IN THE PLANT-FOSSIL RECORD B21
DEPOSITIONAL ENVIRONMENTS- IMPLICATIONS FOR THEIR USE
IN PALEOBOTANY
BIOSTRATIGRAPHY
Biostratigraphic zonation usually is based on series of vertically superposed samples taken from a reasonably con tinuous stratigraphic section. In the Puget Group, an analysis of this sort would require that the zonation be based on strati- graphically and ecologically similar samples. Species turn over from one stratigraphic level to the next can be due to large-scale heterogeneity, migration, or evolutionary change. Appearance and disappearance of taxa can be inter preted as biogeographic movement, climatic change, or evo lutionary modification of taxa in situ. In a zonation based on plant biostratigraphy, the confounding effects of ecology and stratigraphy have the potential to inflate estimates of evolutionary or climatic change. Assemblages from lacus trine-cutoff deposits have erratic taxonomic changes from site to site, as demonstrated by the ordination and cluster analyses (figs. 14, 15), and are particularly subject to misin terpretation. Stratigraphic zonations of plant fossils should be based on sections in which the potential changes due to facies type can be evaluated. The floodbasin deposits of the Puget Group L-Bar quarry section are species rich, consis tent with respect to physiognomic features, and floristically similar. These features indicate that they provide the best assemblages on which to base a biostratigraphic zonation, if a single environment type is to be used. The strong facies effects demonstrated by the several analyses presented here indicate that plant biostratigraphic zonations based on a sin gle facies type will be more reliable than those for which facies restrictions cannot be demonstrated. Biostratigraphic zonations for which facies type is held constant provide a way to investigate the effects that spatial and temporal vari ability have had on plant-fossil data. At the minimum, bios tratigraphic zonations based on plants must unequivocally demonstrate that the zone boundaries are based on temporal changes, not on environmental differences.
PALEOCLIMATOLOGY
The most accurate climatic reconstructions are made using a large number of taxa, as recommended by Wolfe (1971, 1981b), but the samples should be derived from nonchannel facies. The channel-margin assemblages of the Puget Group show an average of 10 percent fewer entire margins than floodbasin and lacustrine-cutoff assemblages. Use of these channel-margin samples alone potentially decreases the estimate of mean annual temperature by 3-4°C (Wolfe, 1979). Elimination of the five channel-margin assemblages from the 20 samples from the Puget Group
increases the average percentage of entire-margined taxa from 49.3 to 52 percent. It is recommmended that for paleo- climatic analysis of deposits similar to those of the Puget Group, demonstrable channel and channel-margin assem blages should be segregated and not counted for purposes of climatic reconstruction.
The lacustrine-cutoff assemblages, as a group, show no deviation in physiognomy from that of the total flora (figs. 8-11). Individually, however, lacustrine-cutoff assemblages show marked deviations from the average for all localities. Care should be taken to ensure that cutoff floras do not show marked compositional variability from locality to locality. Variation of this sort would likely bias the climatic signal if it were to be inferred from any single cutoff deposit. As a group, these assemblages probably represent an adequate cross section of the vegetation with which to estimate paleo- climate.
PALEOECOLOGY
Paleoecological reconstructions probably are made most accurately using a range of different depositional envi ronments. In the Eocene community investigated here, sharp ecological boundaries are not present between adjacent facies, and the resulting mix of plant taxa confounds a clear statement of taxon by environment specificity. Certain taxa, however, clearly show facies preference (for example, Salix in channel margins and Viburnum, Glyptostrobus, and "Acrodromous Entire" in floodbasins).
The obvious bias of channel-margin assemblages (figs. 8A, 10A, 12), which represent only a specific kind of stream- side vegetation, limits their use. Channel-margin deposits are species poor and floristically similar over large geo graphic distances. Although they are unreliable for climatic reconstructions, they add information regarding the ecologi cal distribution of taxa. In the floodplain represented by the Puget Group, Cercidiphyllum-Trochodendron Complex were streamside associates, possibly present in the standing floras on the levee, but at low frequency. With specific ref erence to the ecological distribution of the Cercidiphyllum- Trochodendron Complex, this distribution was mentioned by Crane (1984), who studied similar taxa from the early Tertiary of Britain. Thus, the strongest contribution of chan nel-margin assemblages may be in clarifying the ecological tolerances of extinct taxa.
Lacustrine-cutoff deposits are likely to be species rich relative to channel-margin deposits but also include floristic components that indicate a standing-water wetland (for example, Salvinid). Depending on the regional species rich ness, lacustrine-cutoff assemblages may be variable from site to site (as documented in the Puget Group), or they may be pockets of vegetation that are similar to one another in a more species poor region. The value of lacustrine-cutoff
B22 EVOLUTION OF SEDIMENTARY BASINS SOUTHWEST WASHINGTON AND NORTHWEST OREGON
assemblages depends on knowledge of the spatial variability of the ecosystem being studied.
Floodbasin assemblages are, for the most part, species rich. These assemblages reflect regional and local vegetation most accurately of all the depositional environments investi gated, both modern and ancient. Thus, they are reliable indi cators of the forest type and physiognomy from which Cenozoic fossil assemblages were derived. To represent ade quately spatial vegetation patterns, floodbasin assemblages are used most effectively by combining their vegetation information with that from other environments. Floodbasin facies are presumed to represent low-lying wetland areas and, less frequently, well-drained floodplain areas. Their flo ras are likely to be composed of regionally dominant, mature forest trees.
Each facies type contributes information on plants restricted to, or most abundant in, specific depositional envi ronments. Autecology of individual taxa can be approached by recognition of the restriction of the taxon to a specific depositional environment. The longevity and stability of streamside communities versus floodbasin (or back-levee) communities can be compared through this kind of docu mentation of spatial community structure.
RECOMMENDATIONS FORCENOZOIC PALEOBOTANICAL
INVESTIGATIONS
The following recommendations are made for specific applications of Cenozoic plant-fossil data. Approaches to the plant-fossil record must vary to suit the goal of the research; for example, paleoecology, paleoclimatplogy, bio- geography, or phylogenetic reconstruction. /
First, data on megafossil biostratigraphic zonations should be restricted, where possible, to deposits derived from similar depositional environments. In situations where the biostratigraphy must be constructed using different facies, care should be taken that the variation observed is evolutionary not ecological.
Second, certain types of facies preserve a biased sample of the standing vegetation. The observation of high variabil ity in plant-species composition among lithologically simi lar, contemporaneous deposits is an indication that individual samples are biased. Such samples should be used only tentatively for paleoecological and paleoclimatological purposes.
Third, paleoclimatic reconstructions are best estimated from plant assemblages representing environments other than channel or channel margin.
Fourth, community paleoecology can be reconstructed most accurately using a wide range of paleoenvironments, including those environments that may be less favorable sites of plant-fossil preservation.
Finally, paleoecology of single species or clades is esti mated most accurately by assessing paleoenvironment inde pendently of plant composition.
REFERENCES CITED
Armentrout, J.M., 1981, Correlation and ages of Cenozoic chrono- stratigraphic units in Oregon and Washington: Geological Society of America Special Paper 184, p. 137-148.
Armentrout, J.M., Hull, D.A., Beaulieu, J.D., and Rau, W.W., 1983, Correlation of Cenozoic stratigraphic units of western Oregon and Washington: State of Oregon, Department of Geology and Mineral Industries, Oil and Gas Investigation 7, 90 p.
Axelrod, D.I., 1966, The Eocene Copper Basin flora of northeastern Nevada: University of California Publications in the Geologi cal Sciences 59, 119 p.
1985, Miocene floras from the Middlegate basin, west-cen tral Nevada: University of California Publications in the Geo logical Sciences 129, 279 p.
Bailey, I.W., and Sinnott, E.W., 1915, A botanical index of Creta ceous and Tertiary climates: Science, v. 41, no. 3, p. 831-834.
1916, The climatic distribution of certain types of angiosperm leaves: American Journal of Botany, v. 3, p. 24-39.
Bedinger, M.S., 1971, Forest species as indicators of flooding in the lower White River valley, Arkansas: U.S. Geological Survey Professional Paper 750-C, p. 248-253.
Bell, D.T., and del Moral, R., 1977, Vegetation gradients in the streamside forest of Hickory Creek, Will County, Illinois: Bul letin Torrey Botanical Club, v. 104, no. 2, p. 127-135.
Berggren, W.A., Kent, D.V., Flynn, J.J., and van Couvering, J.A., 1985, Cenozoic geochronology: Geological Society of Ameri ca Bulletin, v. 96, p. 1407-1418.
Berggren, W.A., Kent, D.V., Obradovich, J.D., and Swisher, C.C., III, 1992, Toward a revised Paleogene geochronology, in Pro- thero, D.R., and Berggren, W.A., eds., Eocene-Oligocene cli matic and biotic evolution: Princeton, New Jersey, Princeton University Press, p. 29-45.
Berggren, W.A., McKenna, M.C., Hardenbol, J., and Obradovich, J.D., 1978, Revised Paleogene polarity time scale: Journal of Geology, v. 86, p. 67-81.
Berry, E.W., 1925, A new Salvinia from the Eocene (Wyoming and Tennessee): Torreya, v. 25, p. 116-118.
Birks, H.H., 1973, Modern macrofossil assemblages in lake sedi ments in Minnesota, in Birks, H.J.B., ed., Quaternary plant ecology: Oxford, Blackwell, p. 173-190.
Brandon, M.T., and Vance, J.A., 1992, Tectonic evolution of the Cenozoic Olympic subduction complex, Washington State, as deduced from fission track ages for detrital zircons: American Journal of Science, v. 292, p. 565-636.
Buckovic, W.A., 1979, The Eocene deltaic system of west-central Washington, in Armentrout, J.M, Cole, M.R., and TerBest, H., Jr., eds., Cenozoic paleogeography of the Western United States: Pacific Section, Society of Economic Paleontologists and Mineralogists, p. 147-164.
HETEROGENEITY IN THE PLANT-FOSSIL RECORD B23
Burnham, R.J., 1986, Foliar morphological analysis of the Ulmoideae (Ulmaceae) from the early Tertiary of western North America: Palaeontographica Abt. B., v. 201, p. 135-167.
1989, Relationships between standing vegetation and leaf litter in a paratropical forest Implications for paleobotany: Review of Palaeobotany and Palynology, v. 58, p. 5-32.
1990, Some Late Eocene depositional environments of the coal-bearing Puget Group of western Washington State, U.S.A.: International Journal of Coal Geology, v. 15, p. 27-51.
1993, Reconstructing richness in the plant fossil record:Palaios, v. 8, p. 376-384.
Burnham, R.J., Wing, S.L., and Parker, G.G., 1992, The reflection of deciduous forest communities in leaf litter Implications for autochthonous litter assemblages from the fossil record: Paleobiology, v. 18, no. 1, p. 30-49.
Cande, S.C., and Kent, D.V., 1992, A new geomagnetic polarity time scale for the late Cretaceous and Cenozoic: Journal of Geophysical Research, v. 97, no. BIO, p. 13917-13951.
Chaney, R.W., 1951. A revision of Sequoia and Taxodium in west ern North America based on the recent discovery of Metase- quoia: American Philosophical Society Transactions, v. 40, no. 3, p. 171-263.
Collinson, M.E., 1983, Accumulations of fruits and seeds in three small sedimentary environments in southern England and their palaeoecological implications: Annals of Botany, v. 52, p. 583-592.
Crane, P.R., 1984, A re-evaluation of Cercidiphyllum-\ike plant fossil from the British early Tertiary: Botanical Journal of the Linnean Society, v. 89, p. 199-230.
Crane, P.R., Manchester, S.R., and Dilcher, D.L., 1991, Reproduc tive and vegetative structure of Nordenskioldia (Trochoden- draceae), a vesselless dicotyledon from the early Tertiary of the Northern Hemisphere: American Journal of Botany, v. 78, no. 10, p. 1311-1334.
Crane, P.R., and Stockey, R.A., 1985, Growth and reproductive biology of Joffrea speirsii gen. et sp. nov., a Cercidiphyllum- like plants from the Late Paleocene of Alberta, Canada: Cana dian Journal of Botany, v. 63, no. 2, p. 340-364.
DiMichele, W.A., and Phillips, T.L., 1985, Arborescent lycopod reproduction and paleoecology in a coal-swamp environment of Late Middle Pennsylvania!! age (Herrin Coal, Illinois, U.S.A.): Review of Palaeobotany and Palynology, v. 44, p. 1-26.
Dolph, G.E., and Dilcher, D.L., 1979, Foliar physiognomy as an aid in determining paleoclimate: Palaeontographica Abt. B, v. 170, p. 151-172.
1980a, Variation in leaf size with respect to climate in Costa Rica: Biotropica, v. 12, no. 2, p. 91-99.
1980b, Variation in leaf size with respect to climate in thetropics of the western Hemisphere: Bulletin Torrey Botanical Club, v. 107, no. 2, p. 154-162.
Durham, J.W., 1942, Eocene and Oligocene coral faunas of Wash ington: Journal of Paleontology, v. 16, no. 1, p. 84 104.
Efremov, J.A., 1940, Taphonomy New branch of paleontology: Pan-American Geologist, v. 74, p. 81-93.
Ferguson, D.K., 1985, The origin of leaf-assemblages New light on an old problem: Review of Palaeobotany and Palynology, v. 46, p. 117-188.
Frye, R.J., III, and Quinn, J.A., 1979, Forest development in rela tion to topography and soils on a floodplain of the Raritan
River, New Jersey: Bulletin Torrey Botanical Club, v. 106, no.4, p. 334-345.
Gastaldo, R.A., 1987, Confirmation of Carboniferous clasticswamp communities: Nature, v. 326, p. 869-871.
Gauch, H.G., 1982, Multivariate analysis in community ecology:Cambridge, Cambridge University Press, 298 p.
Greenwood, D.R., 1991, The taphonomy of plant macrofossils, inDonovan, S.K., ed., The processes of fossilization: London,Belhaven Press, p. 141-169.
1992, Taphonomic constraints on foliar physiognomic interpretations of Late Cretaceous and Tertiary paleoclimates: Review of Palaeobotany and Palynology, v. 71, p. 149-190.
Haq, B.U., Hardenbol, J., and Vail, P.R.M., 1987, Chronology of fluctuating sea levels since the Triassic: Science, v. 235, p.1156-1167.
Hickey, L.J., 1973, Classification of the architecture of dicotyle donous leaves: American Journal of Botany, v. 60, no. 1, p. 17-33.
1977, Stratigraphy and paleobotany of the Golden Valley Formation (early Tertiary) of western North Dakota: Geolog ical Society of America Memoir 150, 181 p.
Hickey, L.J., and Peterson, R.K., 1978, Zingiberopsis, a fossil genus of the ginger family from Late Cretaceous to early Eocene sediments of western interior North America: Canadi an Journal of Botany, v. 56, no. 9, p. 1136-1152.
Hill, M.O., and Gauch, H.G., 1980, Detrended correspondence analysis An improved ordination technique: Vegetatio, v. 42, p. 47-58.
Hubbell, S.P., 1979, Tree dispersion, abundance, and diversity in a tropical dry forest: Science, v. 203, p. 1299-1309.
Hupp, C.R., 1982, Stream-grade variation and riparian ecology along Passage Creek, Virginia: Bulletin Torrey Botanical Club, v. 109, no. 4, p. 488^99.
1983, Vegetation pattern on channel features in the Passage Creek Gorge, Virginia: Castanea, v. 48, p. 62-72.
Hupp, C.R., and Osterkamp, W.R., 1985, Bottomland vegetation distribution along Passage Creek, Virginia, in relation to fluvi al landforms: Ecology, v. 66, no. 3, p. 670- 681.
Hurlbert, S.H., 1971, The nonconcept of species diversity A cri tique and alternative parameters: Ecology, v. 52, no. 4, p. 577-586.
Johnson, S.Y., 1985, Eocene strike-slip faulting and nonmarine basin formation in Washington, in Biddle, K.T., and Christie- Blick, N., eds., Strike-slip deformation, basin formation and sedimentation: Society of Economic Paleontologists and Min eralogists Special Publication 37, p. 283-302.
Johnson, W.B., Sasser, C.E., and Gosselink, J.G., 1985, Succession of vegetation in an evolving river delta, Atchafalaya Bay, Lou isiana: Journal of Ecology, v. 73, p. 973-986.
Knowlton, F.H., 1919, A catalogue of the Mesozoic and Cenozoic plants of North America: U.S. Geological Survey Bulletin 696, 815 p.
MacGinitie, H.D., 1941, A Middle Eocene flora from the central Sierra Nevada: Carnegie Institution Washington Publication, v. 534.
1953, Fossil plants of the Florissant beds, Colorado: Carn egie Institution Washington Publication, v. 599.
1969, The Eocene Green River Flora of northwestern Colo rado and northeastern Utah: University of California Publica tions in Geology, v. 83, 140 p.
B24 EVOLUTION OF SEDIMENTARY BASINS SOUTHWEST WASHINGTON AND NORTHWEST OREGON
Manchester, S.R., 1986, Vegetative and reproductive morphology of an extinct plane tree (Platanaceae) from the Eocene of west ern North America: Botanical Gazette, v. 147, no. 2, p. 220-226.
McQueen, D.R., 1969, Macroscopic plant remains in Recent lake sediments: Tuatara, v. 17, p. 13-19.
Me Williams, R.G., 1971, Biostratigraphy of the marine Eocene near Seattle, Washington: Northwest Science, v. 45, no. 4, p. 276-287.
Mullineaux, D.R., 1970, Geology of the Renton, Auburn, and Black Diamond quadrangles, King County, Washington: U.S. Geo logical Survey Professional Paper 672, 92 p.
Nie, N.H., Hull, C.H., Jenkins, J.G., Steinbrenner, K., and Bent, D.H., 1975, SPSS Statistical package for the social sciences: New York, McGraw Hill, 675 p.
Nixon, E.S., Wilett, R.L., and Cox, P.W., 1977, Woody vegetation of a virgin forest in an eastern Texas river bottom: Castanea, v. 42, p. 227-236.
Pabst, M.B., 1968, The flora of the Chuckanut Formation of north western Washington: University of California Publications in Geological Sciences, v. 76, 60 p.
Parker, L.R., 1976, The paleoecology of the fluvial coal-forming swamps and associated floodplain environments in the Black- hawk Formation (Upper Cretaceous) of central Utah: Brigham Young University Geological Studies 22, p. 99-116.
Peet, R.K., 1974, The measurement of species diversity: Annual Review of Ecology and Systematics, v. 5, p. 285-308.
Pielou, E.G., 1975, Ecological diversity: New York, Wiley, 165 p.Proctor, J., Anderson, J.M., Fogden, S.C.L., and Vallack, H.W.,
1983, Ecological studies in four contrasting lowland rain for ests in Gunung Mulu National Park, Sarawak; II, Litterfall, lit ter standing crop and preliminary observations on herbivory: Journal of Ecology, v. 71, p. 261-283.
Sadler, P.M., 1981, Sediment accumulation rates and the complete ness of stratigraphic sections: Journal of Geology, v. 89, p. 69-584.
Sanborn, E.I., 1935, The Comstock flora of west central Oregon: Carnegie Institution Washington Publication, v. 465, p. 1-28.
Scheming, M.H., and Pfefferkorn, H.W., 1984, The taphonomy of land plants in the Orinoco Delta A model for incorporation of plant parts in clastic sediments of late Carboniferous age of Euramerica: Review of Palaeobotany and Palynology, v. 41, p. 205-240.
Shelford, V.E., 1954, Some lower Mississippi Valley flood plain biotic communities Their age and elevation: Ecology, v. 35, no. 2, p. 126-142.
Sneath, P.H.A., and Sokal, R.R., 1973, Numerical taxonomy The principles and practise of numerical classification: San Fran cisco, W.H. Freeman, 573 p.
Spicer, R.A., 1980, The importance of depositional sorting to the biostratigraphy of plant megafossils, in Dilcher, D.L., and Tay- lor, T.N., eds., Biostratigraphy of fossil plants: Stroudsburg, Pennsylvania, Dowden, Hutchinson and Ross, p. 171-183.
1981, The sorting and deposition of allochthonous plant material in a modern environment at Silwood Lake, Silwood Park, Berkshire England: U.S. Geological Survey Professional Paper 1143, 77 p.
Spicer, R.A., and Greer, A., 1986, Plant taphonomy in fluvial and lacustrine systems, in Broadhead, T.W., ed., Land plants
Notes for a short course: University of Tennesee Department of Geology Studies in Geology, v. 15, p. 10-26.
Spicer, R.A., and Wolfe, J.A., 1987, Plant taphonomy of late Holocene deposits in Trinity (Clair Engle) Lake, northern Cal ifornia: Paleobiology, v. 13, no. 2, p. 227-245.
Turner, D.L., Frizell, V.A., Triplehorn, D.M., and Naeser, C.W., 1983, Radiometric dating of ash partings in coal of the Eocene Puget Group, Washington Implications for paleobotanical stages: Geology, v. 11, p. 527-531.
Vine, J.D., 1969, Geology and coal resources of the Cumberland, Hobart, and Maple Valley quadrangles, King County, Wash ington: U.S. Geological Survey Professional Paper 624, 67 p.
Waldron, H.H., 1967, Geologic map of the Duwamish Head quad rangle, King and Kitsap Counties, Washington: U.S. Geologi cal Survey Geological Quadrangle Map GQ-706.
Waldron, H.H., Liesch, B.A., Mullineaux, D.R., and Crandell, D.R., 1962, Preliminary geologic map of Seattle and vicinity, Washington: U.S. Geological Survey Miscellaneous Geologi cal Investigation Map 1-354.
Wartenberg, D., Person, S., and Rohlf, F.J., 1987, Putting things in order A critique of detrended correspondence analysis: American Naturalist, v. 129, no. 3, p. 434-448.
Webb, L.J., 1959, A physiognomic classification of Australian rain forests: Journal of Ecology, v. 47, p. 551-570.
White, C.A., 1889, On vertebrate fossils from the Pacific Coast: U.S. Geological Survey Bulletin 51, p. 435-532.
Whitten, A.J., 1982, A numerical analysis of tropical rain forest, using floristic and structural data, and its application to an anal ysis of Gibbon ranging behavior: Journal of Ecology, v. 70, p. 249-271.
Wing, S.L., 1981, A study of paleoecology and paleobotany in the Wilwood Formation (early Eocene, Wyoming): New Haven, Connecticut, Yale University, Ph.D. thesis, 391 p.
Wnuk, C., 1985, Transition from clastic to peat sedimentation in Appalachian Basin Pennsylvanian swamps in West Virginia and Pennsylvania [abs.]: American Association of Petroleum Geologists Bulletin, v. 69, no. 9, p. 1452.
Wnuk, C., and Pfefferkorn, H.W., 1987, A Pennsylvanian-age ter restrial storm deposit Using plant fossils to characterize the history and process of sediment accumulation: Journal of Sed imentary Petrology, v. 57, no. 2, p. 212-222.
Wolfe, J.A., 1968, Paleogene biostratigraphy of nonmarine rocks in King County, Washington: U.S. Geological Survery Profes sional Paper 571, 33 p.
1971, Tertiary climatic fluctuations and methods of analysis of tertiary floras: Palaeogeography, Palaeoclimatology, Palae- oecology, v. 9, p. 27-57.
1977, Paleogene floras from the Gulf of Alaska region: U.S. Geological Survey Professional Paper 997, 108 p.
1978, A paleobotanical interpretation of Tertiary climates in the northern hemisphere: American Scientist, v. 66, no. 6, p. 694-703.
1979, Temperature parameters of humid to mesic forests of eastern Asia and relation to forests of other regions of the Northern Hemiphere and Australasia: U.S. Geological Survey Professional Paper 1106, 37 p.
198la, A chronologic framework for Cenozoic megafossil floras of northwestern North America and its relation to marine geochronology: Geological Society of America Special Paper 184, p. 39^7.
HETEROGENEITY IN THE PLANT-FOSSIL RECORD B25
198 Ib, Paleoclimatic significance of the Oligocene and Neogene floras of the Northwestern United States, in Niklas, K.J., ed., Paleobotany, paleoecology and evolution, v. 2: New York, Praeger, p. 79-101.
1985, Distribution of major vegetation types during the Ter tiary, in Sundquist, E.T., and Broecker, W.S., eds., The carbon cycle and atmospheric CO2 Natural variations Archean to Present: Geophysical Monograph 32, p. 357-375.
-1990, Palaeobotanical evidence for a marked temperatureincrease following the Cretaceous/Tertiary boundary: Nature, v. 343, p. 153-156.
Wolfe, J.A., and Tanai, T., 1987, Systematics, phylogeny and dis tribution of Acer (Maples) in the Cenozoic of western North America: Journal of the Faculty of Science, Hokkaido Univer sity, v. 22, no. l,p. 1-246.
Wolfe, J.A., and Upchurch, G.R., 1987, North American nonma- rine climates and vegetation during the late Cretaceous: Palaeogeography, Palaeoclimatology, Palaeoecology, v. 61, p. 33-77.
Wolfe, J.A., and Wehr, W., 1987, Middle Eocene Dicotyledonous plants from Republic, northeastern Washington: U.S. Geolog ical Survey Professional Paper 1597, 25 p.
Yanosky, T.M., 1982, Effects of flooding upon woody vegetation along parts of the Potomac River floodplain: U.S. Geological Survey Professional Paper 1206, 21 p.
Yount, J.C., and Gower, H.D., 1991, Bedrock geologic map of the Seattle 30' by 60' quadrangle, Washington: U.S. Geological Survey Open-File Report 91-147.
Manuscript approved for publication January 10, 1994 Published in the Central Region, Denver, Colorado Edited by Judith StoeserGraphics and photocomposition by Shelly Fields Tables prepared by Judith Stoeser
Appendix 4. Abbreviations and taxonomic citations for plant-fossil taxa from the 20 localities examined in the Puget Group.
The four-letter abbreviation for taxa in appendix 1 is given in italics at the left of each citation. Taxa are either (1) referred to previously described taxa to which the Puget Group specimens are most similar, citing references to original descriptions or to recent emendations of the original descriptions, or (2) briefly described in the case of taxa not previously described and named informally (using quotations marks) with morphotype designations. Descriptive terminology is drawn from Hickey (1973). Descriptions of the morphotypes presented here are not intended to serve as formal systematic descriptions of taxa nor are the informal names intended to serve as formal nomenclature. Until further work can be completed on the taxonomic affinities of the taxa described informally, the descriptions and names are intended simply to assist in identifying taxa found in plant-bearing deposits from the Puget Group. Examples of taxa identified only as morphotypes are listed by specimen number. All specimens listed are curated at the National Musuem of Natural History, Smithsonian Institution, Washington, D.C. Arrangement of taxa is in the same order as in the data matrix presented in appendix 1: Equisetum first, followed by Pteridophytes, Coniferophytes, monocotyledonous Angiosperms, and dicotyledonous Angiosperms.
Equi Equisetum sp. cf. E. newberryi Knowlton and Cockerell. Knowlton (1919) or E. sp. of Wing (Wing, 1981).
Aspl Asplenium sp. cf. A. delicata (Brown) MacGinitie. MacGinitie (1969).
Dryp Dryopteris sp. cf. D. whatcomensis Pabst. Pabst (1968).
Alia Allantodiopsis sp. cf. A. pugetensis Wolfe. Wolfe (1968).
Cyin Cyathea sp. cf. C. inequilateralis (Hollick) Wolfe. Wolfe (1977).
Derm Dennstaedtia sp. cf. D. delicata Pabst. Pabst (1968).
Salv Salvinia sp. cf. S. preauriculata Berry. Berry (1925), similar to that described in Hickey (1977) and Wing (1981).
Meta Metasequoia sp. cf. M. glyptostroboides Hu and Cheng or M. occidentalis (Newberry) Chancy. Chaney (1951) and Wolfe (1968).
Glyp Glyptostrobus sp. Wolfe (1968).
BrdM "Broadly cross-veined monocotyledon." Monocotyledonous foliage fragments, as much as 6 cm in length and 2-3 cm wide. Primary and secondary veins paralleodromous, spaced approximately 1 cm apart and similar in size, such that differentiation between them is difficult to detect. Cross veins widely spaced, about every 2-4 mm along the length of the foliage fragments.
M23m "Monocotyledon having 2-3 veins per millimeter." Monocotyledonous foliage fragments, > 15 cm long, 1-3 cm wide; parallelodromous veins closely spaced, of essentially equal size. Vein density from 2 to 4 per millimeter on the same fragment. Texture coriaceous. These fragments bear similarity to segments of dissected palm leaves.
Zing Zingiberopsis sp. cf. Z. isonervosa Hickey. Hickey (1977) and Hickey and Peterson (1978).
TLWP "Thread-like water plant." Leaves(?) 1 mm wide or less, more than 2 cm long, attached to only slightly wider stems. Leaves form thin mats as much as 10 cm in width on bedding planes.
3LMo "Three-level monocotyledon." Broad-bladed monocotyledonous leaf similar to general form of Zingiberopsis. Maximumsize unknown, fragments as much as 9 cm in width, as much as 10 cm in length. Neither measurement believed to be close to the size of a whole leaf. Three vein orders: coarsest veins spaced 2-4 mm apart, second-order veins evenly spaced at 1 mm, third-order veins evenly divide the area between the second-order veins into four areas. Thus, the leaf fragments have five veins per millimeter, consisting of three vein size orders.
M45m "Monocotyledon having 4-5 veins per millimeter." Broad-bladed monocotyledonous foliage, similar to Zingiberopsis, but having blade segments commonly much narrower than those present in Zingiberopsis. Blade segments commonly 10-17 cm wide (believed to be very close to typical total width) but occasionally as narrow as 2 cm wide. Central broad midrib present, as much as 8 mm wide. One subsidiary vein order present, density 4-5 per mm, diverging from midvein at very low angles
B32 EVOLUTION OF SEDIMENTARY BASINS SOUTHWEST WASHINGTON AND NORTHWEST OREGON
FeMo "Featureless monocot." Heavily cutinized leaves(?), as much as 12 cm in width, 5-30 mm long, (obviously only a part of the total length). Largest specimens have a thin, longitudinal vein centrally, but in the similar, smaller specimens this vein is not visible. Faint transverse ridges are present sporadically along axes, spaced at distances greater than 1 cm, possibly representing nodes; however, no axillary appendages are seen emerging at this point. Fragments bear resemblance to the largest axes of WPTA but are much larger. Their lack of distinctive features precludes even a definitive statement that they certainly represent monocotyledonous angiosperms.
Plre Plafkeria sp. cf. P. rentonensis (Wolfe) Wolfe; Wolfe (1977).
Vipu Viburnum sp. cf. V. pugetensis Wolfe. Wolfe (1968).
Hyps Hypserpa sp. cf. H. cashmanensis Wolfe. Wolfe (1968).
Apoc "Apocynaceous leaf." Simple, dicotyledonous leaf, 10-15 cm long, 4 5 cm wide; margin entire; base cuneate, forming 45°angle; apex acute. Secondary veins eucamptodromous, divergence angle 70°-85°, forming an almost perpendicular secondary network. Intersecondary veins common, between almost every pair of secondary veins and extending to three-fourths the distance to the margin before bifurcating and joining supra- and sub-jacent secondary veins. Finer venation rarely preserved, apparently forming orthogonal-reticulate pattern.
CdBs "Cordate base, even alternate secondaries." Simple, dicotyledonous leaf, 8-15 cm long, 4-8 cm wide; margin entire; base cordate; apex acute having short (0.5 cm) drip tip. Secondary veins eucamptodromous to acrodromous near apex, evenly spaced, divergence angle 45°, commonly bifurcating near margin. Intersecondary veins rare and thin, losing identity by one- quarter the distance to the margin. Tertiary, veins thin, oblique to primary veins, forming random-reticulate pattern.
Foth Fothergilla sp. cf. F. durhamensis Wolfe. Wolfe (1968).
Calk Calkinsia sp. cf. C. plafkeri Wolfe. Wolfe (1977).
AcEn "Acrodromous entire." Simple, dicotyledonous leaf, 10-12 cm long, 2.5-3.5 cm wide; margin entire; base cuneate, forming 45°-90° angle; apex acuminate having 1.0 cm drip tip. Secondary veins eucamptodromous, divergence angle 30°. Intersecondary veins absent. Tertiary veins oblique to midrib, forming orthogonal-reticulate pattern. Finest veins intruding areoles, branching once.
LREE "Low-rank entire elliptic." Simple, dicotyledonous leaf, 8-12 cm long, 4 5 cm wide; margin entire; base cuneate, forming40°-60° angle; apex rounded to acute. Secondary veins eucamptodromous, bifurcating two to three times at three-fourths the distance to margin. Intersecondary veins absent. Tertiary veins orthogonal to primary vein, sinuous, forming widely spaced reticulum.
Meni Menispermites sp. cf. M. parvareolatus Hickey. Hickey (1977).
Dryo Dryophyllum sp. cf. D. pugetensis Wolfe. Wolfe (1968).
Tern Ternstroemites sp. cf. T. ravenensis Wolfe. Wolfe (1968).
CTCC "Cercidiphyllum-Trochodendron Complex." Simple, dicotyledonous leaf, 7-15 cm long, 4-7 cm wide; margin non-entire; base cordate to rounded; apex acuminate to acute. Teeth having convex basal margin and concave apical margin (C-l type). Secondary veins actinodromous, two to four (usually three) pairs originating at base of the lamina: central pair strongest, extending to apex and curving toward midvein, external pair(s) ending in teeth two-thirds the distance to apex. In some leaves the point of origin of the central pair of secondary veins is suprabasal. Tertiary veins forming weak loops at margin and bifurcating near teeth, the branch entering the tooth. This complex has a wide range of morphologies included, among all of which gradations can be found. The resolution of the limits to this taxon (these taxa?) will be aided by reference to the Puget Group specimens.
CrRi "Crenate cf. Rinorea." Simple, dicotyledonous leaf, 7-13 cm long, 2.5-5.0 cm wide; margin non-entire; base rounded to acute; apex not fully preserved, apparently at least short acuminate. Teeth having basal and apical margins convex (A-l type), rounded. Secondary veins eucamptodromous, bifurcating three-fourths of the distance to margin, both branches branching again. Intersecondary veins common, often more than one between adjacent secondary veins. Tertiary and finer veins are not easily distinguishable, forming a very fine orthogonal reticulate pattern. Resembles the leaves of the modern genus Rinorea (Violaceae).
HETEROGENEITY IN THE PLANT-FOSSIL RECORD B33
LRNF "Low-rank narrow with fimbrial." Simple, dicotyledonous leaf, as much as 7 cm in length, 3-4 cm wide; margin entire; base only partially preserved: probably cuneate; apex narrowing, blunt, not acuminate. Secondary veins brochidodromous, divergence angle 75°-85°, arching just inside margin, looping apically to fuse with suprajacent secondary vein. Intersecondary veins common, one or two between adjacent secondary veins. Tertiary veins oblique to primary vein, forming a random-reticulate pattern. This morphotype is similar to Apoc but the secondary veins fuse at the margin to form a prominent fimbrial vein, which is not pronounced in Apoc.
Pers Persea sp. cf. P. pseudocarolinensis Lesquereux. As described in MacGinitie (1941).
Pier Pterocarya sp. cf. P. pugetensis Wolfe. Wolfe (1968).
FBEE "Festooned brochidodromous entire elongate." Simple, dicotyledonous leaf, 10-20 cm long, 4-10 cm wide; margin entire; base rounded; apex rounded. Secondary veins brochidodromous, looping apically to merge with suprajacent secondary, divergence angle 45°. Subsidiary loops formed by tertiary veins outside the secondary loops create festooned brochidodromous appearance. Intersecondary veins common, two or three between adjacent secondaries. Tertiary veins oblique to primary, unbranched. Quaternary and high-order venation forming quadrangular-reticulate pattern.
Arto "Artocarpoides"=Dicotylophyllum kummerensis Wolfe. Wolfe (1977).
Pulo Pugetia sp. cf. P. longifolia Wolfe. Wolfe (1968).
E2Br "Entire, twice-brochidodromous, square intercostals." Simple, dicotyledonous leaf, 6-8 cm long, 3-5 cm wide; margin entire; base rounded; apex acute. Secondary veins brochidodromous, branching and looping upward at about three-fourths the distance to margin to merge with suprajacent secondary vein. Branches of secondary veins looping outside the secondary veins to form festooned brochidodromous appearance. Intersecondary veins uncommon, perpendicular to primary vein. Tertiary veins very faint, even in clay matrix, oblique to primary veins, forming square intercostal areas.
Caca Carya sp. cf. C. cashmanensis Wolfe. Wolfe (1968).
Clad Cladrastis sp. cf. C. pugetensis Wolfe. Wolfe (1968).
Plat "Platanaceae" cf. Macginitea angustiloba (Lesq) Manchester. Manchester (1986).
Rham "Rhamnites" cf. Dipterocarpaceae after "Rhamnites" cashmanensis of Wolfe (1968, 1977).
Chae Chaetoptelea morphotype A Burnham. Burnham (1986).
Maca Macaranga sp. cf. M. pugetensis Wolfe. Wolfe (1968)
WPTA "Water plant thick axis (cf. Myriophyllum)." Stems 0.3-4.0 mm wide, in fragments as much as 10 cm in length. Leaves (?) approximately 0.1 mm wide, as much as 2 cm in length, having a single midvein, apparently borne in a dense spiral arrangement on the stem axis. Multiple branching hierarchies present, having finer branches borne similarly to the leaves, in a dense spiral. Possibly a dicotyledonous angiosperm similar to the modern genus Myriophyllum, but the lack of attachment of the ultimate segments (leaves?) to each other does not support a dicotyledonous affinity.
Phac Phytocrene sp. cf. P. acutissima Wolfe. Wolfe (1977).
Plap Platycarya sp. cf. P. pseudobrauni (Hollick) Wolfe. Wolfe (1977).
Ainu Alnus sp. cf. A. operia MacGinitie. MacGinitie (1941)
MuOE "Mucronate Oval Entire." Simple, dicotyledonous leaf, 4-5 cm long, 1-2 cm wide; margin entire; base cordate to rounded; apex retuse-rounded to mucronate. Leaves very carbonaceous, secondary and higher order veins poorly preserved: obviously sunk beneath the thick cuticle. Secondary veins eucamptodromous, divergence angle 45°. Higher order venation too poorly preserved to characterize.
B34 EVOLUTION OF SEDIMENTARY BASINS SOUTHWEST WASHINGTON AND NORTHWEST OREGON
Sail Salix sp. cf. S. heartensis Hickey. Hickey (1977).
Acne Acer sp. cf. A. negundo-type. Similar to Acer eonegundo Wolfe et Tanai. Wolfe and Tanai (1987).
Hama Hamamelites sp. cf. H. voyana (Lesq) MacGinitie. MacGinitie(1941).
Gowe Goweria sp. cf. G. dilleri (Knowlton) Wolfe. Wolfe (1968,1977).
FCBN "Finely crenate margins, brochidodromous secondaries, wide lamina." Simple, dicotyledonous leaf, 4-7 cm long, 2.0-3.5 cm wide; margin non-entire; base cuneate; apex acuminate. Teeth small, basal margin convex, apical margin concave (C-1 type), secondary branch extending into apex of tooth. Secondary veins brochidodromous, looping and branching just inside the margin, one branch extending to a tooth, the other branch merging with the suprajacent secondary. Tertiary veins oblique to primary vein, branching halfway between secondary veins. Finer veins forming orthogonal-reticulate pattern.
JuHi "Juglandaceae" cf. Carya pugetensis Wolfe. Wolfe (1968).
Frax Fraxinus sp. cf. F. yubaensis MacGinitie. MacGinitie (1941).
Rhus Rhus sp. cf. R. typhina Torner (modern).
Betu Betula sp. cf. B. papyrifera Marsh, (modern).
PeBf "Perpendicular secondaries, brochidodromous, fimbrial vein." Simple, dicotyledonous leaf, 7-9 cm long, 1.0-3.0 cm wide; margin entire; base cuneate; apex acute. Secondary veins brochidodromous, divergence angle 65°-80°, meeting just inside the margin, forming a prominent fimbrial vein. Tertiary veins sinuous, turning toward margin after diverging from secondary vein, finally becoming perpendicular to primary vein. Finer veins form disorganized-reticulate pattern.
SCA2 "Semi-craspedodromous, arching secondaries, elliptic shape." Simple, dicotyledonous leaf, 3.5-7.0 cm long, 1.5-3.0 cmwide; margin non-entire; base cuneate, forming 60° angle; apex not preserved. Teeth having convex apical and basal margins (A-l type), blunt. Secondary veins semicraspedodromous, apical branches looping up to meet suprajacent secondary, basal branch entering tooth. Tertiary veins subperpendicular to midvein. Finer venation forming clear quadrangular and pentagonal areoles.
Smse "Small, craspedodromous secondaries, elliptic." Simple (?) dicotyledonous leaf, 1.5-3.0 cm long, 1.1-1.5 cm wide; margin non-entire, base acute, apex acute. Teeth having convex basal and concave apical margins (C-1 type), having dark round gland at tip. Secondary veins craspedodromous, straight, ending in a tooth. Intersecondary veins absent. Tertiary veins oblique to secondary veins, branching before crossing between secondary veins. High-order venation mostly indistinct, apparently a random reticulate pattern.
ATRP "Apiculate teeth, reflexed secondaries, percurrent tertiaries." Simple, dicotyledonous leaf, 7-8 cm long; 3.2-4.0 cm wide;margin non-entire; base rounded-acute; apex acute. Teeth having straight apical margin and convex basal margin (B-l type), intruded below the center by a secondary or tertiary vein. Tertiary veins straight or branching as they cross the secondary- secondary intercostal. Finer veins poorly preserved, apparently forming a random-reticulate pattern.
Popu Populus sp. cf. P. tremuloides Michaux (modern). Simple, dicotyledonous leaf, more than 5 cm long, 5 cm wide; margin non-entire; base broadly rounded; apex not preserved. Teeth convex on basal and apical margins (A-l type), rounded, without gland. Secondary veins actinodromous, three pairs arising at the base of the lamina, ending in teeth approximately one-third to two-thirds the distance to apex. Tertiary veins perpendicular to primary vein near the primary veins and oblique to the primary vein close to the margin. Finer venation forming a random-reticulate pattern.
HETEROGENEITY IN THE PLANT-FOSSIL RECORD B35
AcEu "Acalyphoid euphorb." Simple, dicotyledonous leaf, 8-12 cm long, 5-7 cm wide; margin non-entire; base shallowly cordate; apex acute. Teeth having convex basal and apical margins (A-l type), prominent secondary vein-ending protruding from tooth. Secondary veins craspedodromous, evenly spaced, opposite, branching at margin rare. Basal secondary branches common from basal pair of secondary veins. Tertiary veins commonly oblique to midrib and unbranched.
Burs Bursera sp. similar to the modern genus Bursera. Pinnately compound, dicotyledonous leaf, leaflets 3.5-4.0 cm long, 1.5 cm wide; margin entire; base rounded; apex mucronate to rounded. Secondary veins eucamptodromous, divergence angle 45°, branching one or two times near margin. Tertiary veins oblique to midrib, branched.
CESB "Craspedodromous elongate shallow base." Simple, dicotyledonous leaf, 12-15 cm long, 6-7 cm wide; margin non-entire; base shallowly cordate to rounded; apex acuminate, 1-2 cm drip tip. Teeth having concave basal and apical margins (C-3 type), flat. Secondary veins craspedodromous, opposite, entering teeth medially, divergence angle 30°-45° (greater apically). Tertiary veins oblique to midrib, branching or slightly sinuous between secondary veins. Texture chartaceous.
CCMT "Cordate craspedodromous multiple teeth." Simple, dicotyledonous leaf, 5 cm long, 3 cm wide; margin non-entire; base cordate; apex acute. Teeth small, several per secondary, having convex basal and apical margins (A-l type). Secondary veins craspedodromous, branching one or two times near margin, each branch going to a tooth. Tertiary veins oblique to midrib, sinuous and unbranched. Finer veins form orthogonal-reticulate pattern.
ACII "Acalyphoid Euphorb Type II." Simple, dicotyledonous leaf, 15 cm long, 7.5 cm wide; margin entire; base cordate; apex not fully preserved, but at least short acuminate. Secondary veins actinodromous to acrodromous, three pairs of secondary veins arising at the base of lamina. Centralmost pair of secondary veins converges on margin approximately half the distance to the apex, second pair of secondary veins converges on margin in basal one-quarter of the lamina, basalmost pair of secondary veins follow margin, fusing with secondary branches of suprajacent secondary. Suprabasal secondary veins widely spaced, divergence angle 35°-45°. Tertiary veins percurrent, sinuous, oblique to primary vein, closely spaced. Texture chartaceous.
DDCA "Densely disorganized conical apex." Simple, dicotyledonous leaf, margin entire, more than 9 cm long, 5 cm wide; base not preserved; apex acute. Secondary veins brochidodromous, branching near margin, the branches fusing with supra- and subjacent secondary veins. Intersecondary veins present, two or three between adjacent secondary veins. Tertiary and higherorder veins disorganized, having veins forking and changing direction frequently. Ultimate areoles very small, intruded by unbranched veinlet.
NFMe "Narrow lamina fine mesh." Simple, dicotyledonous leaf, 9-10 cm long, 4-5 cm wide; margin entire; base rounded; apex short acuminate. Secondary veins eucamptodromous, rarely fusing with other secondary veins. Tertiary veins indistinguishable from finer veins. All finer veins forming an orthogonal-reticulate pattern.
CTBR "Cercidiphyllum-\\\x, teeth, Festooned Brochidodromous." Simple, dicotyledonous leaf, 9-10 cm long, 4-5 cm wide; margin non-entire; base rounded; apex short acuminate. Teeth having convex basal margin and concave apical margin (C-l type), and a tertiary vein extending to sinus, not to tooth. Secondary veins brochidodromous, arching upward to fuse with suprajacent secondary vein. Tertiary branches forming external loops on secondary veins and between secondaries; intercostal tertiary veins sinuous, widely spaced. Finer veins forming random-reticulate pattern.
C2R3 "Secondary veins craspedodromous, tertiary veins reticulate." Pinnately-compound, dicotyledonous leaf, leaflets 9-10 cm long, 2.7-3.0 cm wide; margin entire; base cuneate and asymmetric; apex short acuminate. Teeth having concave apical and basal margins (C-3 type), intruded by a secondary vein. Secondary veins craspedodromous, divergence angle 55°-60°, ending in the prominent teeth. Intersecondary veins common, two to four between adjacent secondary veins. Tertiary veins thin, only slightly thicker than finer veins, crossing between secondary veins without branching. Finer veins forming orthogonal-reticulate pattern.
LTau "Linear cf. Tauche' or Manilkara." Simple, dicotyledonous leaf, 10-11 cm long, 3-4 cm wide; margin entire; base rounded acute; apex acute. Secondary veins eucamptodromous, divergence angle 70°-80°, smoothly looping upward and decreasing in size. Intersecondary veins absent. Tertiary veins branching irregularly in crossing between secondaries. Finer venation poorly preserved, probably forming a random-reticulate pattern. Resembles the modern genus Manilkara (Sapotaceae).
Anam Anamirta sp. cf. A. milleri Wolfe. Wolfe (1977).
Sapl "Sapindaceous-Anacardiaceous leaflet." Similar to Melanorrhoea alaskana (Hollick) Wolfe. Wolfe (1977).
B36 EVOLUTION OF SEDIMENTARY BASINS SOUTHWEST WASHINGTON AND NORTHWEST OREGON
Ilex Ilex sp. cf. /. opaca Ait. (modern). Simple, dicotyledonous leaf, 6-8 cm long, 3.5-5.0 cm wide; margin non-entire; baserounded and asymmetric; apex acute. Teeth having concave apical and basal margins (C-3 type), intruded by tertiary vein, spinose. Secondary veins semicraspedodromous to brochidodromous, divergence angle 45°, forking two or three times before reaching margin, having only one small branch reaching tooth. Tertiary veins sinuous, crossing between secondary veins without branching. Finer veins forming random-reticulate pattern.
Viti Vitis sp. cf. Vitis sp. of Wolfe (1977).
EmAe "Emarginate apex, entire margin." Simple(?), dicotyledonous leaf, 6-9 cm long, 2-2.5 cm wide; margin entire; base rounded; apex emarginate. Secondary veins eucamptodromous, divergence angle 75°-85°, turning toward apex only slightly at margin. Intersecondary veins present, one or two between adjacent secondary veins. Tertiary veins very thin, sinuous, only faintly visible between secondary veins. Basal venation slightly asymmetric, indicating that these could be leaflets; however, they also possess short (3 mm) petioles, relatively uncommon for leaflets.
EIB2 "Elliptic shape, brochidodromous intersecondary veins." Simple(?), dicotyledonous leaf, 6-9 cm long, 2-2.5 cm wide;margin entire; base rounded; apex emarginate. Secondary veins brochidodromous, arching apically to fuse with superjacent secondary vein. Intersecondary veins common, two or three between adjacent secondary veins. Tertiary veins forming loops on margin side of secondary loops, creating festooned brochidodromous appearance. Intercostal tertiary veins branching two or three times between secondary veins, forming random-reticulate pattern.
CrSp "Craspedodromous Spined Margin." Simple, dicotyledonous leaf, 7-8 cm long, 2.2-3.0 cm wide; margin non-entire; base rounded-acute; apex not preserved, apparently short acuminate. Teeth abundant, very small, having straight apical margin and convex basal margin (B-l type), rarely having a small oblong gland at tip. Secondary veins brochidodromous, looping apically to fuse with suprajacent secondary vein. Intersecondary veins absent. Tertiary veins forming loops on the margin- side of secondary loops. Intercostal tertiary veins oblique to primary vein and straight.
Lila "Entire campylodromous lauraceous." Simple, dicotyledonous leaf, 9-12 cm long, 2.5-5.0 cm wide; margin entire; basecuneate; apex not entirely preserved, probably long acuminate. Secondary veins eucamptodromous, smoothly arching toward margin, evenly spaced. Intersecondary veins uncommon to absent. Tertiary veins perpendicular to primary vein, uncommonly branching. Finer veins forming a loosely organized, orthogonal pattern. Texture coriaceous.
FiEu "Fimbrial veined, eucalyptoid." Simple, dicotyledonous leaf, 8-10 cm long, 3.0-3.5 cm wide; margin entire; base narrowly rounded; apex short acuminate. Secondary veins eucamptodromous, thin, divergence angle 70°-85°, remaining almost perpendicular to primary vein until reaching margin. Strong marginal vein present, almost coincident with the margin. Texture coriaceous.
Mace Macclintockia sp. cf. M. pugetensis Wolfe. Wolfe (1968).
Meme "Menispermaceous-Piperaceous." Simple, dicotyledonous leaf, 6-8 cm long, 5-6 cm wide; margin entire; base cordate; apex long acuminate. Secondary veins acrodromous, three pairs arising at base of lamina, two pairs converging on apex, the other pair reaching margin in basal third of lamina. Tertiary veins forming tight loops outside the secondary veins, Intercostal tertiary veins perpendicular to secondary veins, unbranched. Finer venation paralleling tertiary veins, forming elongated, rectangular areoles. Texture coriaceous. Similar to species of the Menispermaceae or Piperaceae.
Tile "Small leaf, brochidodromous." Simple, dicotyledonous leaf, 2-4 cm long, 1-2 cm wide; margin entire; base acute; apex acute. Secondary veins brochidodromous, without extensive looping, simply joining suprajacent secondary vein. Intersecondary veins present, rare. Tertiary veins oblique to primary vein, sinuous, branching present. Petiole as long as 5 mm. Texture coriaceous.
3FHy Trifoliate "Hypserpa." Simple(?), dicotyledonous leaf, 5-8 cm long, 2-3.5 cm wide; margin non-entire; base cuneate; apex short acuminate. Teeth small, numerous in apical half of leaflet, absent in basal half, straight apical and basal margins (B-2 type). Secondary veins thin, acrodromous divergence angle 3Q°-4Q°. Tertiary veins not preserved. Frequently found in groups of three, attached at their petiole bases, which are short (<5 mm). They may represent leaflets of a trifoliately compound leaf.
Anac Anacardites sp. cf. A. franklinensis Wolfe. Wolfe (1968).
U.S. GOVERNMENT PRINTING OFFICE: 1994-673-046/86052