26
US HOTEL OUTLOOK RECOVERY UNDER THREAT? July 23, 2020

US HOTEL OUTLOOK
R E C O V E R Y U N D E R T H R E A T ?
July 23, 2020
2CBRE U.S. HOTEL OUTLOOK
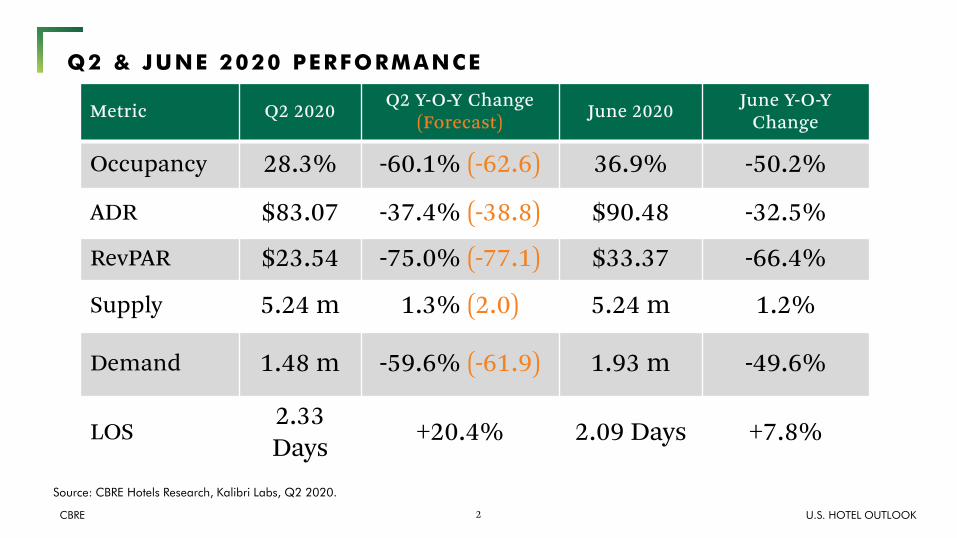
Source: CBRE Hotels Research, Kalibri Labs, Q2 2020.
Q2 & JUNE 2020 PERFORMANCE
Metric Q2 2020 Q2 Y-O-Y Change (Forecast) June 2020 June Y-O-Y
Change
Occupancy 28.3% -60.1% (-62.6) 36.9% -50.2%
ADR $83.07 -37.4% (-38.8) $90.48 -32.5%
RevPAR $23.54 -75.0% (-77.1) $33.37 -66.4%
Supply 5.24 m 1.3% (2.0) 5.24 m 1.2%
Demand 1.48 m -59.6% (-61.9) 1.93 m -49.6%
LOS2.33 Days +20.4% 2.09 Days +7.8%
3CBRE U.S. HOTEL OUTLOOK
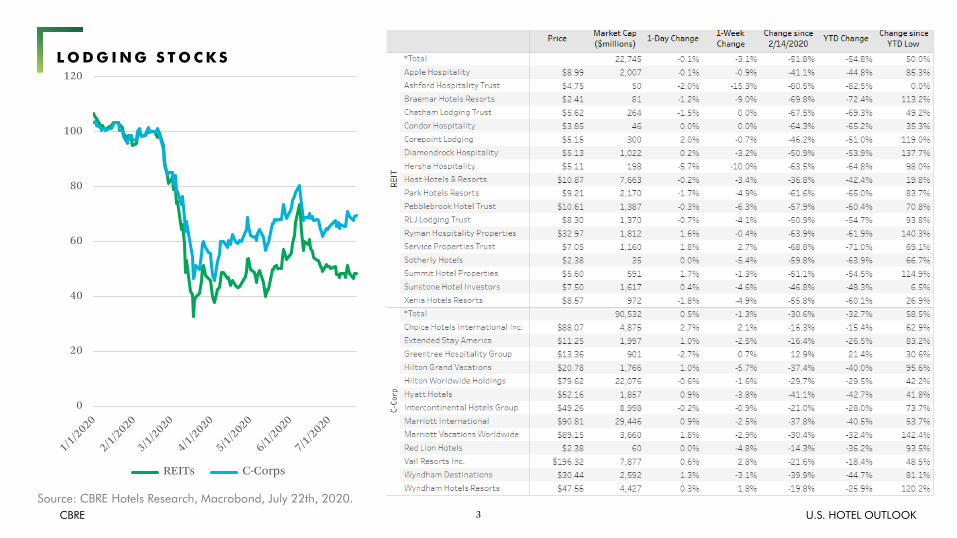
L O D G I N G S T O C K S
Source: CBRE Hotels Research, Macrobond, July 22th, 2020.
0
20
40
60
80
100
120
REITs C-Corps
4CBRE U.S. HOTEL OUTLOOK
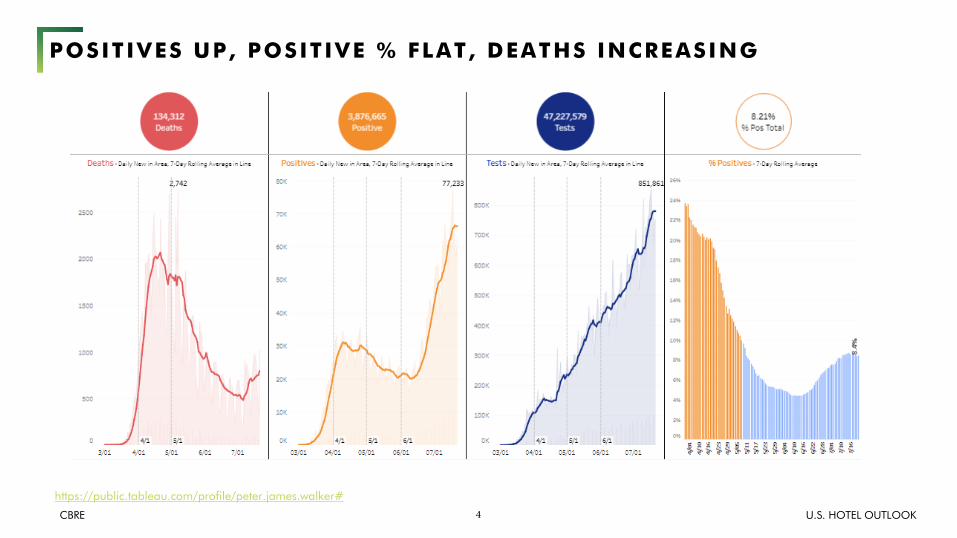
POSITIVES UP, POSITIVE % FLAT, DEATHS INCREASING
https://public.tableau.com/profile/peter.james.walker#
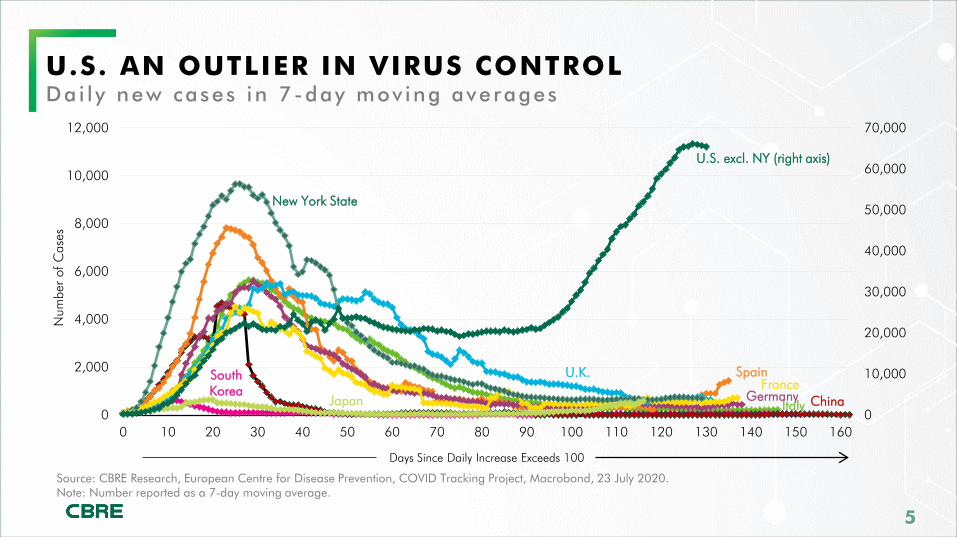
Italy
South Korea
China
Spain
Germany
U.K.France
New York State
Japan
U.S. excl. NY (right axis)
0
10,000
20,000
30,000
40,000
50,000
60,000
70,000
0
2,000
4,000
6,000
8,000
10,000
12,000
0 10 20 30 40 50 60 70 80 90 100 110 120 130 140 150 160
Num
ber
of C
ases
U.S. AN OUTLIER IN VIRUS CONTROLDai l y new cases in 7-day mov ing averages
Source: CBRE Research, European Centre for Disease Prevention, COVID Tracking Project, Macrobond, 23 July 2020.Note: Number reported as a 7-day moving average.
Days Since Daily Increase Exceeds 100
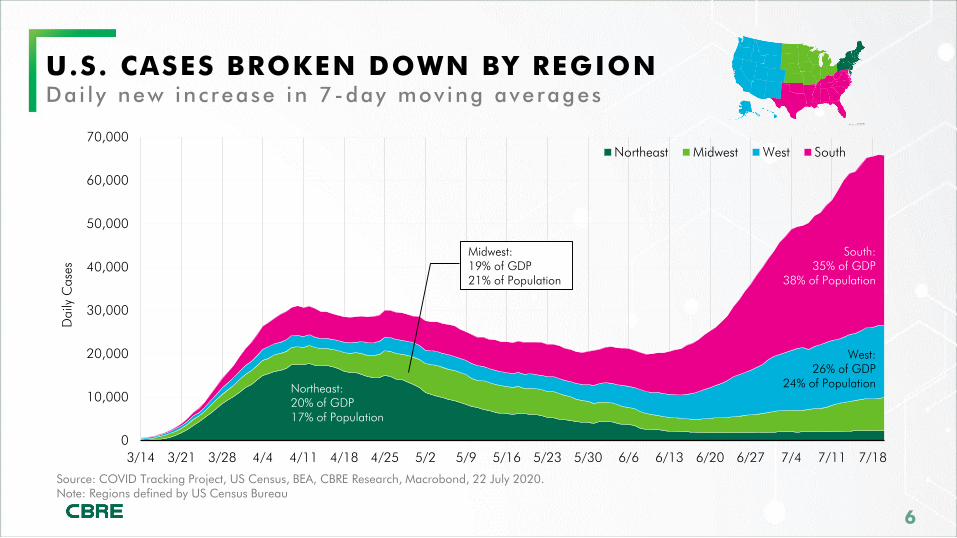
U.S. CASES BROKEN DOWN BY REGIONDai l y new inc rease in 7-day mov ing averages
Source: COVID Tracking Project, US Census, BEA, CBRE Research, Macrobond, 22 July 2020.Note: Regions defined by US Census Bureau
0
10,000
20,000
30,000
40,000
50,000
60,000
70,000
3/14 3/21 3/28 4/4 4/11 4/18 4/25 5/2 5/9 5/16 5/23 5/30 6/6 6/13 6/20 6/27 7/4 7/11 7/18
Dai
ly C
ases
Northeast Midwest West South
West: 26% of GDP
24% of Population Northeast: 20% of GDP 17% of Population
Midwest: 19% of GDP 21% of Population
South: 35% of GDP
38% of Population
7CBRE U.S. HOTEL OUTLOOK
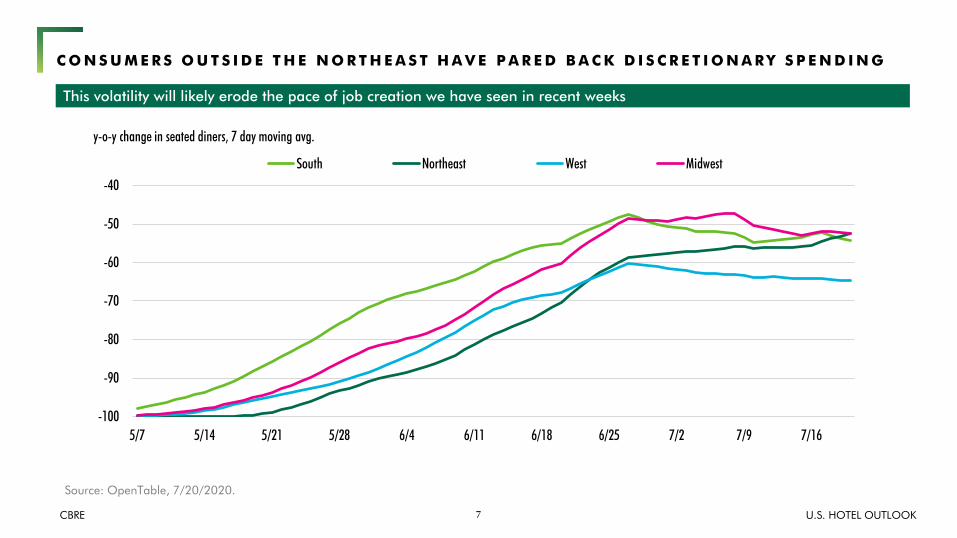
Source: OpenTable, 7/20/2020.
C O N S U M E R S O U T S I D E T H E N O R T H E A S T H A V E P A R E D B A C K D I S C R E T I O N A R Y S P E N D I N G
This volatility will likely erode the pace of job creation we have seen in recent weeks
-100
-90
-80
-70
-60
-50
-40
5/7 5/14 5/21 5/28 6/4 6/11 6/18 6/25 7/2 7/9 7/16
South Northeast West Midwest
y-o-y change in seated diners, 7 day moving avg.
8CBRE U.S. HOTEL OUTLOOK
-
50
100
150
200
(38)
(34)
(30)
(26)
(22)
(18)
(14)
(10) (6
) (2
) 2 6 10
14
18
22
26
30
34
38
42
46
50
54
58
62
66
70
74
78
82
86
90
94
98
102
106
110
114
118
122
126
130
134
138
142
146
150
154
158
162
Days to/from Peak
Europe United Kingdom China Italy Germany United States Spain
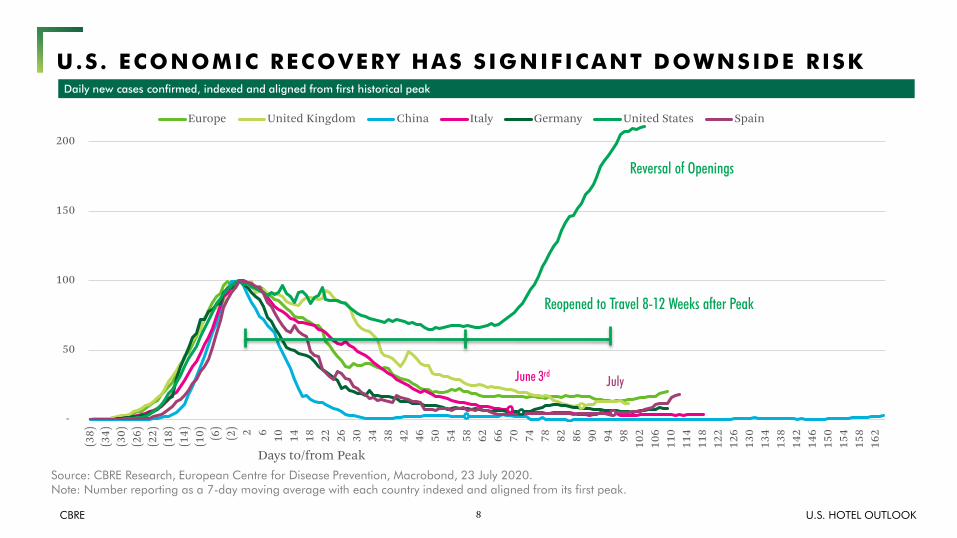
Source: CBRE Research, European Centre for Disease Prevention, Macrobond, 23 July 2020.Note: Number reporting as a 7-day moving average with each country indexed and aligned from its first peak.
Reopened to Travel 8-12 Weeks after Peak
June 3rdJuly
U.S. ECONOMIC RECOVERY HAS SIGNIFICANT DOWNSIDE RISKDaily new cases confirmed, indexed and aligned from first historical peak
Reversal of Openings
9CBRE U.S. HOTEL OUTLOOK
90
590
1090
1590
2090
2590
3090
35900
10
20
30
40
50
60
70
80
90
100
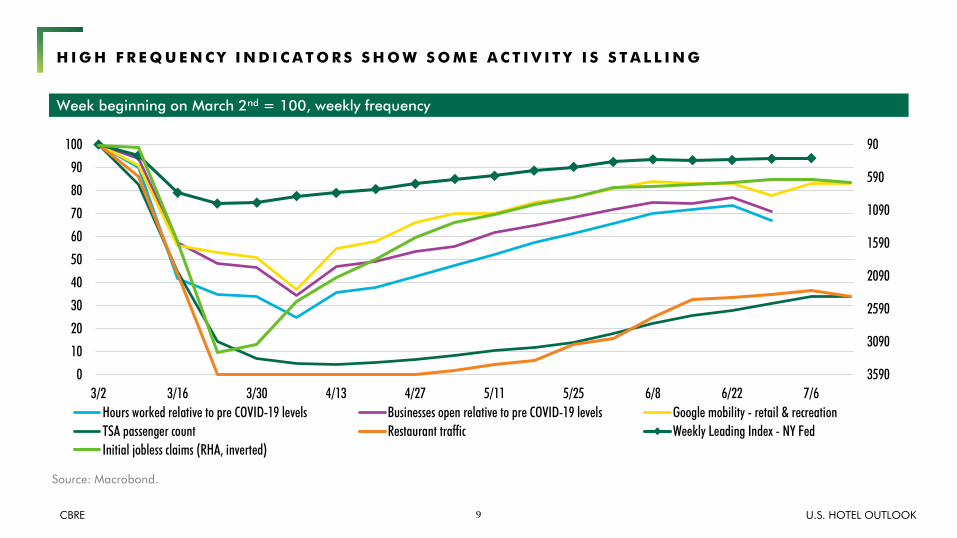
3/2 3/16 3/30 4/13 4/27 5/11 5/25 6/8 6/22 7/6Hours worked relative to pre COVID-19 levels Businesses open relative to pre COVID-19 levels Google mobility - retail & recreationTSA passenger count Restaurant traffic Weekly Leading Index - NY FedInitial jobless claims (RHA, inverted)
Source: Macrobond.
H I G H F R E Q U E N C Y I N D I C A T O R S S H O W S O M E A C T I V I T Y I S S T A L L I N G
Week beginning on March 2nd = 100, weekly frequency
10CBRE U.S. HOTEL OUTLOOK
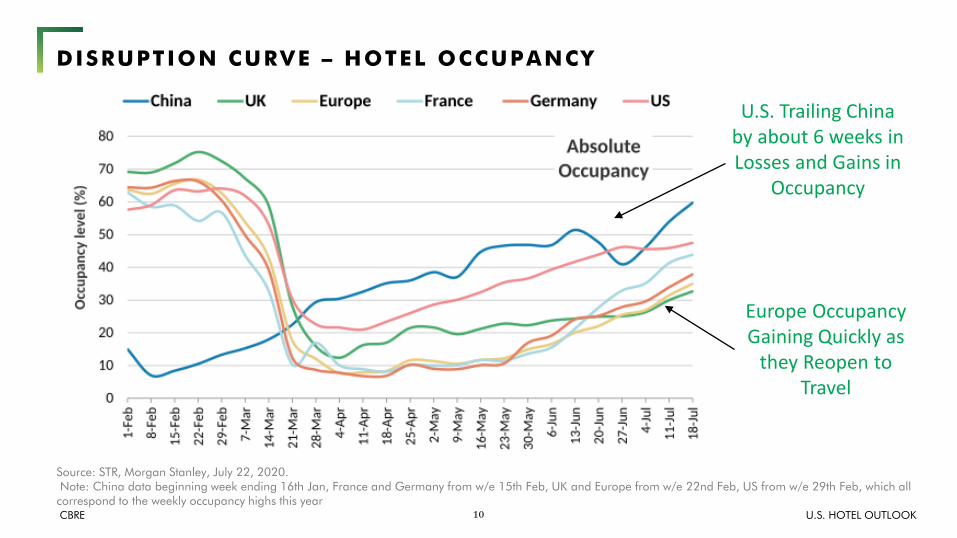
DISRUPTION CURVE – HOTEL OCCUPANCY
Source: STR, Morgan Stanley, July 22, 2020.Note: China data beginning week ending 16th Jan, France and Germany from w/e 15th Feb, UK and Europe from w/e 22nd Feb, US from w/e 29th Feb, which all correspond to the weekly occupancy highs this year
Europe Occupancy Gaining Quickly as
they Reopen to Travel
U.S. Trailing China by about 6 weeks in Losses and Gains in
Occupancy

ECONOMY
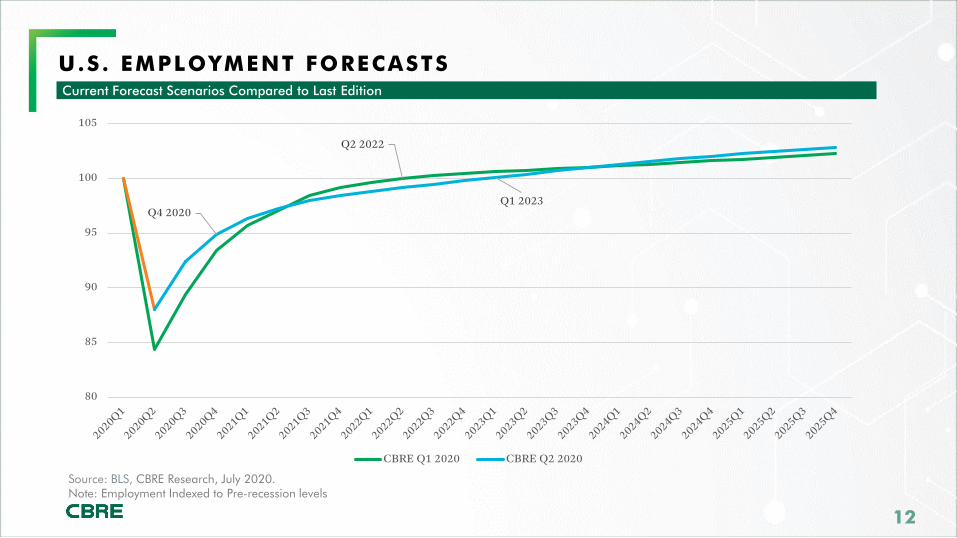
U.S. EMPLOYMENT FORECASTSCurrent Forecast Scenarios Compared to Last Edition
Source: BLS, CBRE Research, July 2020.Note: Employment Indexed to Pre-recession levels
Q2 2022
Q4 2020Q1 2023
80
85
90
95
100
105
CBRE Q1 2020 CBRE Q2 2020
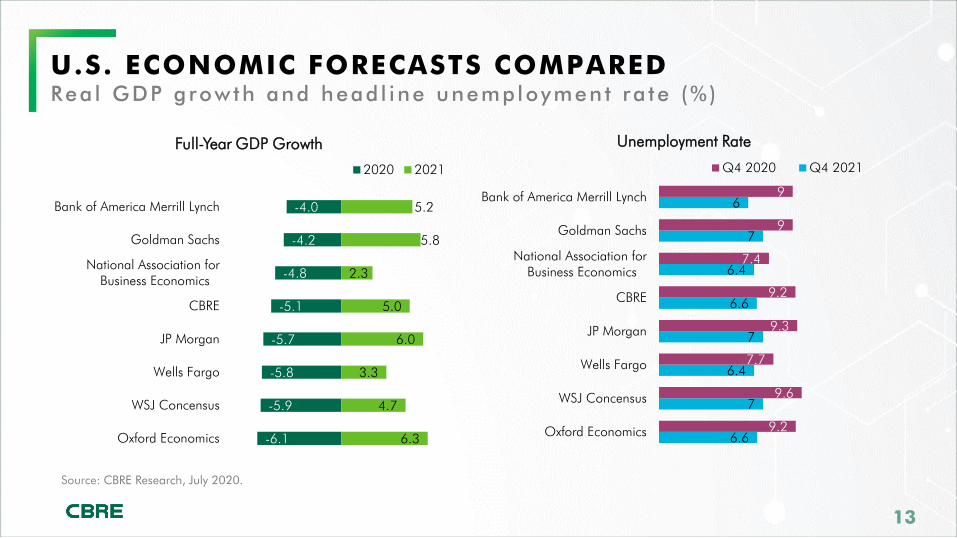
U.S. ECONOMIC FORECASTS COMPARED Rea l GDP growth and head l ine unemployment ra te (%)
Source: CBRE Research, July 2020.
-6.1
-5.9
-5.8
-5.7
-5.1
-4.8
-4.2
-4.0
6.3
4.7
3.3
6.0
5.0
2.3
5.8
5.2
Oxford Economics
WSJ Concensus
Wells Fargo
JP Morgan
CBRE
National Association for Business Economics
Goldman Sachs
Bank of America Merrill Lynch
Full-Year GDP Growth
2020 2021
6.6
7
6.4
7
6.6
6.4
7
6
9.2
9.6
7.7
9.3
9.2
7.4
9
9
Oxford Economics
WSJ Concensus
Wells Fargo
JP Morgan
CBRE
National Association for Business Economics
Goldman Sachs
Bank of America Merrill Lynch
Unemployment Rate
Q4 2020 Q4 2021
14CBRE U.S. HOTEL OUTLOOK
86
88
90
92
94
96
98
100
102
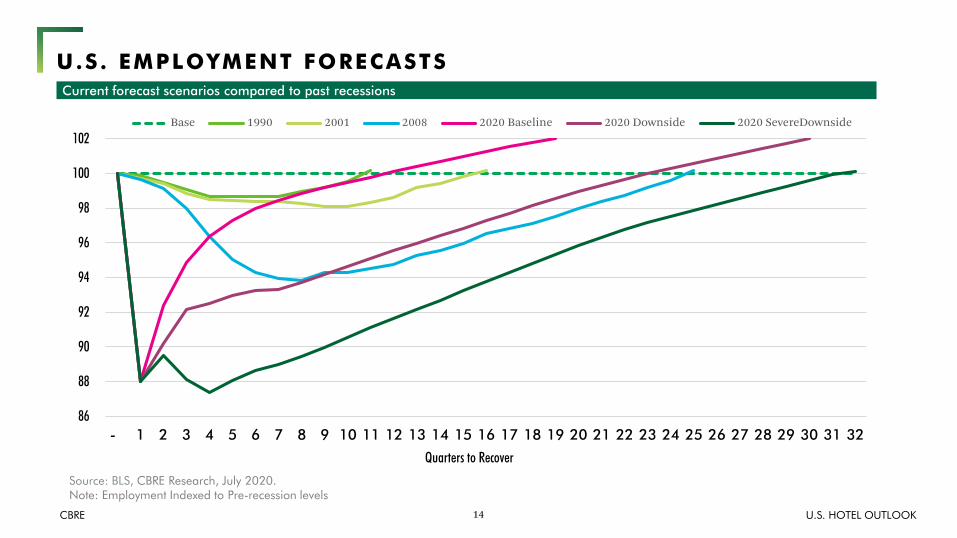
- 1 2 3 4 5 6 7 8 9 10 11 12 13 14 15 16 17 18 19 20 21 22 23 24 25 26 27 28 29 30 31 32
Quarters to Recover
Base 1990 2001 2008 2020 Baseline 2020 Downside 2020 SevereDownside
Source: BLS, CBRE Research, July 2020.Note: Employment Indexed to Pre-recession levels
U.S. EMPLOYMENT FORECASTSCurrent forecast scenarios compared to past recessions
15CBRE U.S. HOTEL OUTLOOK
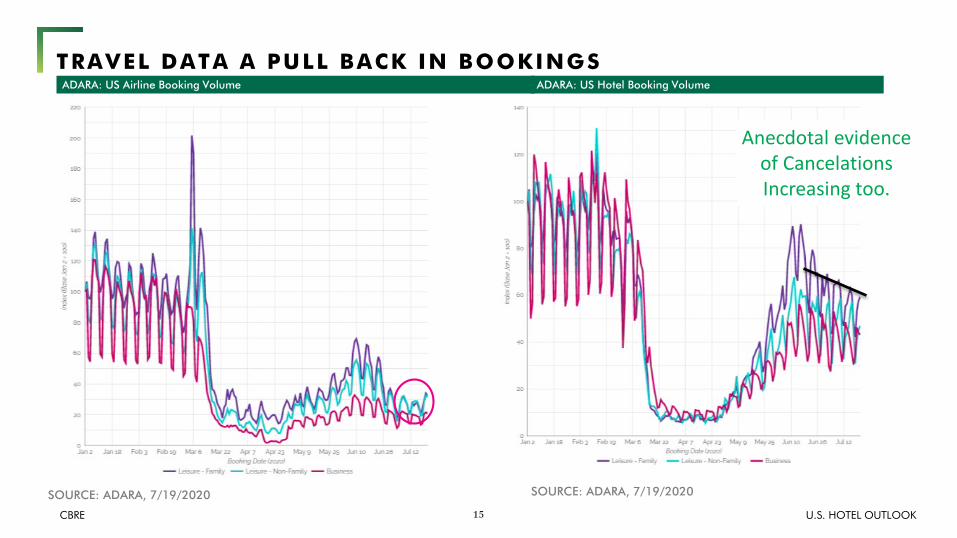
TRAVEL DATA A PULL BACK IN BOOKINGS
SOURCE: ADARA, 7/19/2020
ADARA: US Airline Booking Volume ADARA: US Hotel Booking Volume
Anecdotal evidence of Cancelations Increasing too.
SOURCE: ADARA, 7/19/2020
16CBRE U.S. HOTEL OUTLOOK
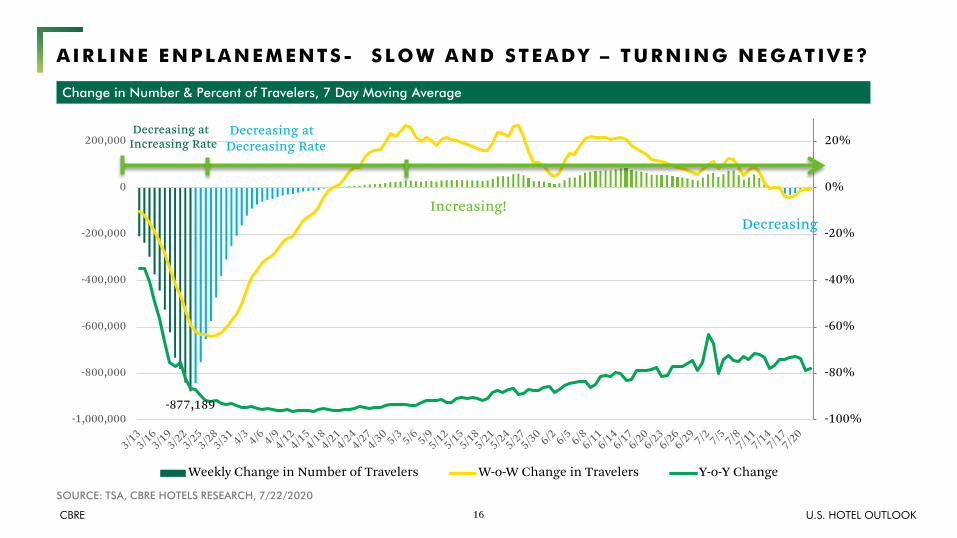
AIRL INE ENPLANEMENTS- SLOW AND STEADY – TURNING NEGATIVE?
SOURCE: TSA, CBRE HOTELS RESEARCH, 7/22/2020
Change in Number & Percent of Travelers, 7 Day Moving Average
-877,189-100%
-80%
-60%
-40%
-20%
0%
20%
-1,000,000
-800,000
-600,000
-400,000
-200,000
0
200,000
Weekly Change in Number of Travelers W-o-W Change in Travelers Y-o-Y Change
Decreasing atDecreasing Rate
Increasing!
Decreasing atIncreasing Rate
Decreasing

TURNING TO HOTELS
18CBRE U.S. HOTEL OUTLOOK
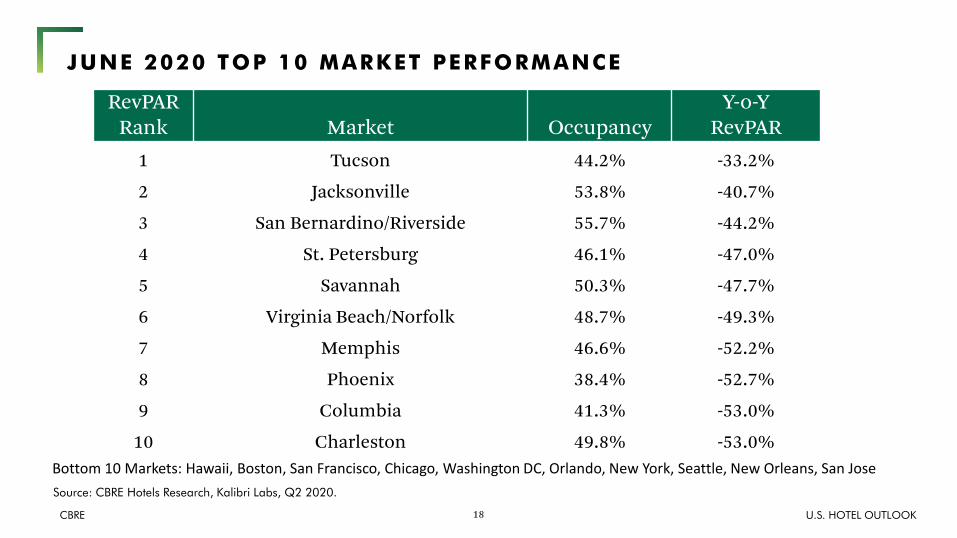
Source: CBRE Hotels Research, Kalibri Labs, Q2 2020.
JUNE 2020 TOP 10 MARKET PERFORMANCE
RevPAR Rank Market Occupancy
Y-o-Y RevPAR
1 Tucson 44.2% -33.2%
2 Jacksonville 53.8% -40.7%
3 San Bernardino/Riverside 55.7% -44.2%
4 St. Petersburg 46.1% -47.0%
5 Savannah 50.3% -47.7%
6 Virginia Beach/Norfolk 48.7% -49.3%
7 Memphis 46.6% -52.2%
8 Phoenix 38.4% -52.7%
9 Columbia 41.3% -53.0%
10 Charleston 49.8% -53.0%Bottom 10 Markets: Hawaii, Boston, San Francisco, Chicago, Washington DC, Orlando, New York, Seattle, New Orleans, San Jose
19CBRE U.S. HOTEL OUTLOOK
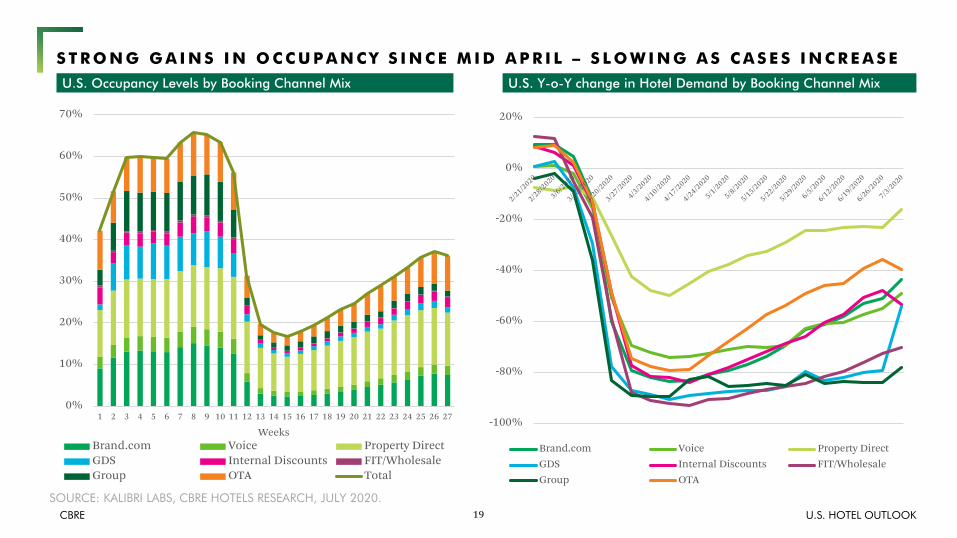
S T R O N G G A I N S I N O C C U P A N C Y S I N C E M I D A P R I L – S L O W I N G A S C A S E S I N C R E A S E
0%
10%
20%
30%
40%
50%
60%
70%
1 2 3 4 5 6 7 8 9 10 11 12 13 14 15 16 17 18 19 20 21 22 23 24 25 26 27
WeeksBrand.com Voice Property DirectGDS Internal Discounts FIT/WholesaleGroup OTA Total
-100%
-80%
-60%
-40%
-20%
0%
20%
Brand.com Voice Property DirectGDS Internal Discounts FIT/WholesaleGroup OTA
SOURCE: KALIBRI LABS, CBRE HOTELS RESEARCH, JULY 2020.
U.S. Occupancy Levels by Booking Channel Mix U.S. Y-o-Y change in Hotel Demand by Booking Channel Mix
20CBRE U.S. HOTEL OUTLOOK
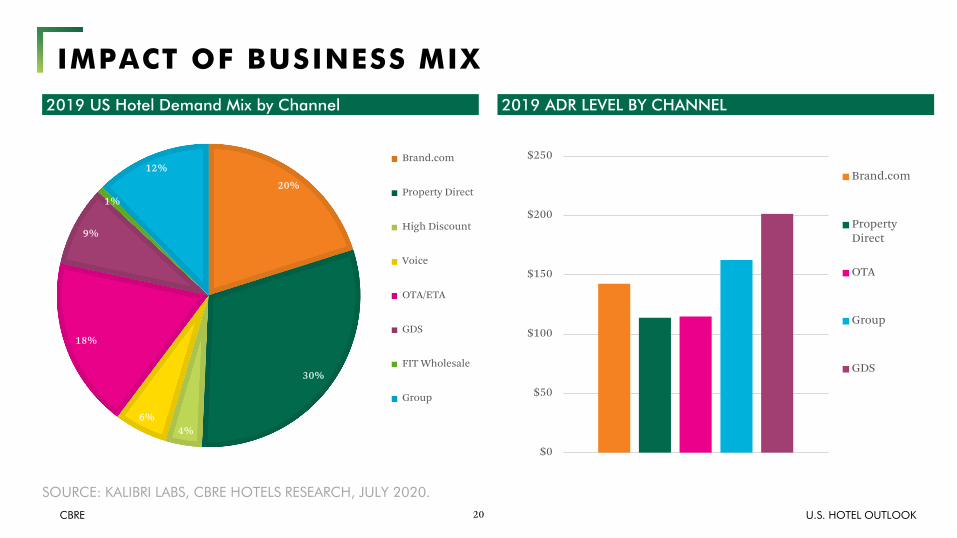
IMPACT OF BUSINESS MIX
20%
30%
4%6%
18%
9%
1%
12% Brand.com
Property Direct
High Discount
Voice
OTA/ETA
GDS
FIT Wholesale
Group
SOURCE: KALIBRI LABS, CBRE HOTELS RESEARCH, JULY 2020.
2019 US Hotel Demand Mix by Channel 2019 ADR LEVEL BY CHANNEL
$0
$50
$100
$150
$200
$250
Brand.com
PropertyDirect
OTA
Group
GDS
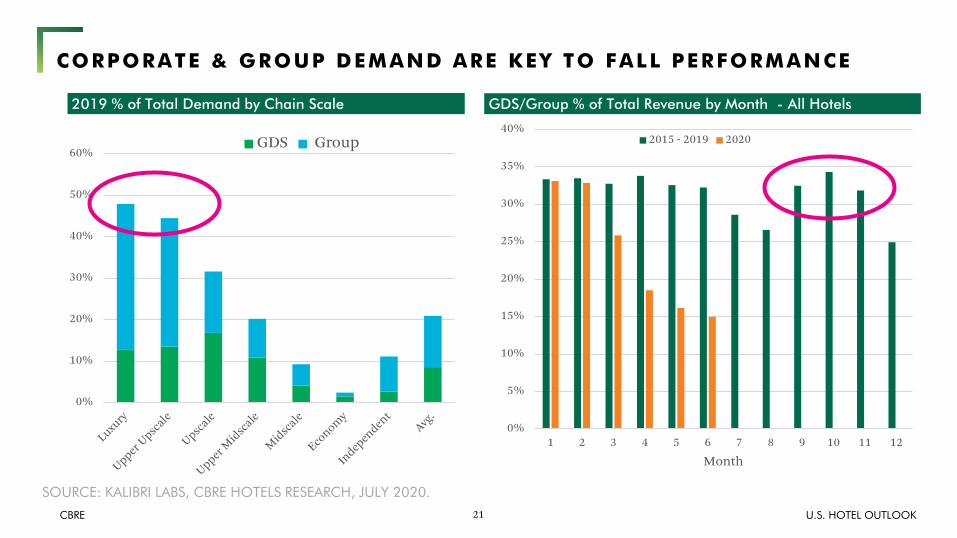
21CBRE U.S. HOTEL OUTLOOK
0%
5%
10%
15%
20%
25%
30%
35%
40%
1 2 3 4 5 6 7 8 9 10 11 12
Month
2015 - 2019 2020
CORPORATE & GROUP DEMAND ARE KEY TO FALL PERFORMANCE
0%
10%
20%
30%
40%
50%
60%GDS Group
SOURCE: KALIBRI LABS, CBRE HOTELS RESEARCH, JULY 2020.
2019 % of Total Demand by Chain Scale GDS/Group % of Total Revenue by Month - All Hotels
22CBRE U.S. HOTEL OUTLOOK
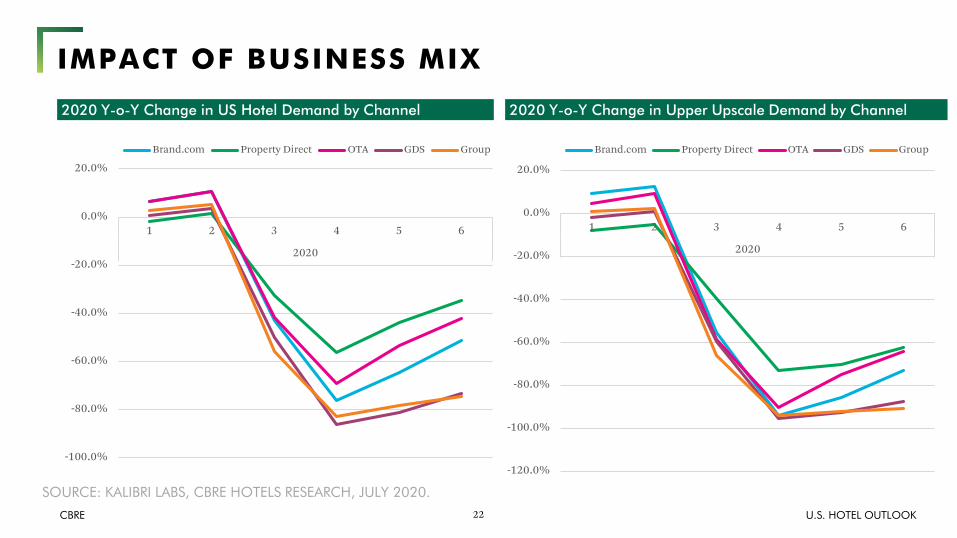
IMPACT OF BUSINESS MIX
SOURCE: KALIBRI LABS, CBRE HOTELS RESEARCH, JULY 2020.
2020 Y-o-Y Change in US Hotel Demand by Channel
-100.0%
-80.0%
-60.0%
-40.0%
-20.0%
0.0%
20.0%
1 2 3 4 5 6
2020
Brand.com Property Direct OTA GDS Group
2020 Y-o-Y Change in Upper Upscale Demand by Channel
-120.0%
-100.0%
-80.0%
-60.0%
-40.0%
-20.0%
0.0%
20.0%
1 2 3 4 5 6
2020
Brand.com Property Direct OTA GDS Group
23CBRE U.S. HOTEL OUTLOOK
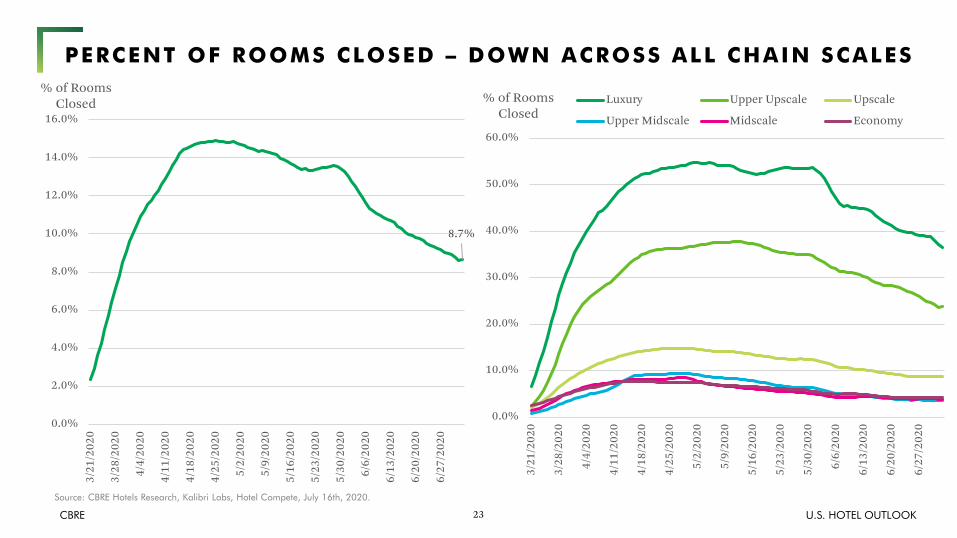
PERCENT OF ROOMS CLOSED – DOWN ACROSS ALL CHAIN SCALES
Source: CBRE Hotels Research, Kalibri Labs, Hotel Compete, July 16th, 2020.
8.7%
0.0%
2.0%
4.0%
6.0%
8.0%
10.0%
12.0%
14.0%
16.0%
3/21
/202
0
3/28
/202
0
4/4/
2020
4/11
/202
0
4/18
/202
0
4/25
/202
0
5/2/
2020
5/9/
2020
5/16
/202
0
5/23
/202
0
5/30
/202
0
6/6/
2020
6/13
/202
0
6/20
/202
0
6/27
/202
0
% of Rooms Closed
0.0%
10.0%
20.0%
30.0%
40.0%
50.0%
60.0%
3/21
/202
0
3/28
/202
0
4/4/
2020
4/11
/202
0
4/18
/202
0
4/25
/202
0
5/2/
2020
5/9/
2020
5/16
/202
0
5/23
/202
0
5/30
/202
0
6/6/
2020
6/13
/202
0
6/20
/202
0
6/27
/202
0
% of Rooms Closed
Luxury Upper Upscale Upscale
Upper Midscale Midscale Economy
24CBRE U.S. HOTEL OUTLOOK
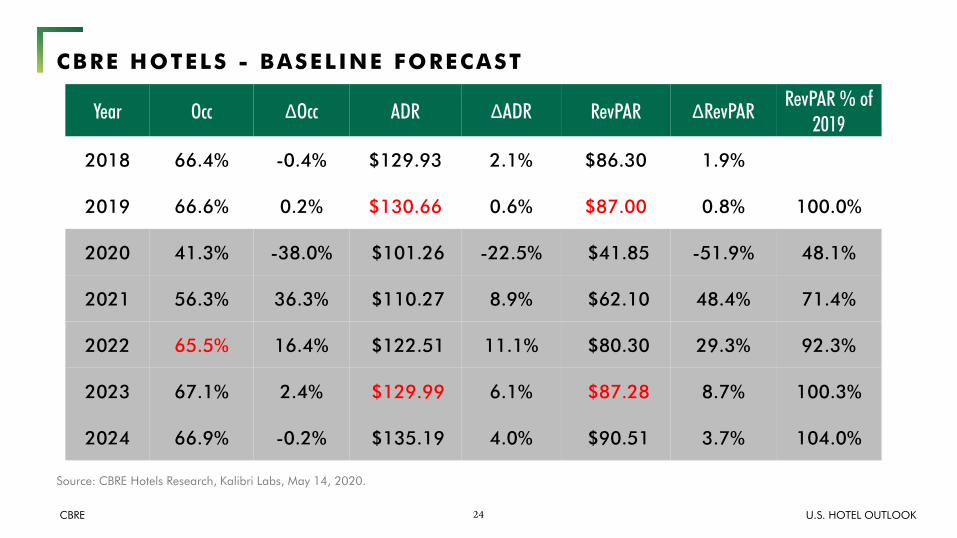
CBRE HOTELS - BASELINE FORECAST
Source: CBRE Hotels Research, Kalibri Labs, May 14, 2020.
Year Occ ΔOcc ADR ΔADR RevPAR ΔRevPAR RevPAR % of 2019
2018 66.4% -0.4% $129.93 2.1% $86.30 1.9%
2019 66.6% 0.2% $130.66 0.6% $87.00 0.8% 100.0%
2020 41.3% -38.0% $101.26 -22.5% $41.85 -51.9% 48.1%
2021 56.3% 36.3% $110.27 8.9% $62.10 48.4% 71.4%
2022 65.5% 16.4% $122.51 11.1% $80.30 29.3% 92.3%
2023 67.1% 2.4% $129.99 6.1% $87.28 8.7% 100.3%
2024 66.9% -0.2% $135.19 4.0% $90.51 3.7% 104.0%
25CBRE U.S. HOTEL OUTLOOK
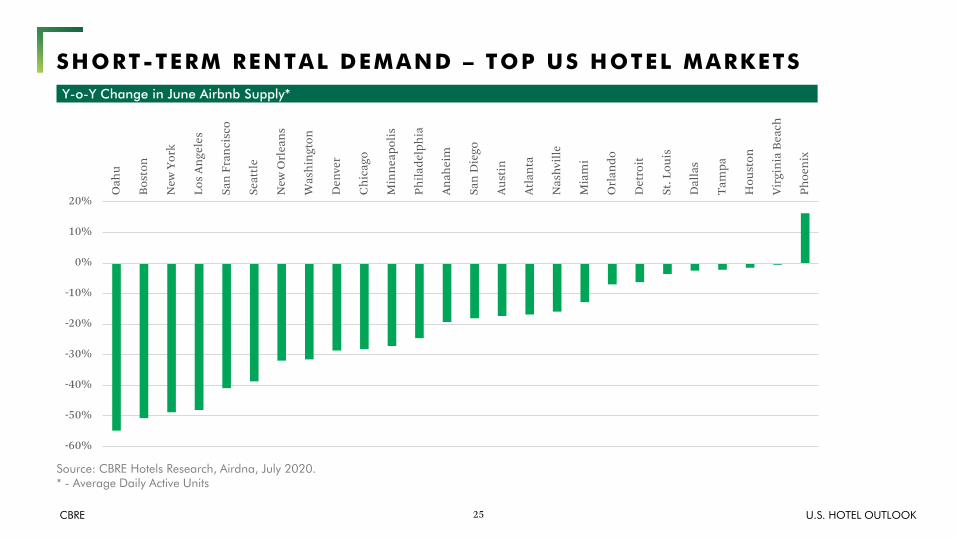
SHORT-TERM RENTAL DEMAND – TOP US HOTEL MARKETS
Source: CBRE Hotels Research, Airdna, July 2020.* - Average Daily Active Units
Y-o-Y Change in June Airbnb Supply*
-60%
-50%
-40%
-30%
-20%
-10%
0%
10%
20%
Oah
u
Bos
ton
New
Yor
k
Los
Ange
les
San
Fran
cisc
o
Seat
tle
New
Orl
eans
Was
hing
ton
Den
ver
Chi
cago
Min
neap
olis
Phila
delp
hia
Anah
eim
San
Die
go
Aust
in
Atla
nta
Nas
hvill
e
Mia
mi
Orl
ando
Det
roit
St. L
ouis
Dal
las
Tam
pa
Hou
ston
Virg
inia
Bea
ch
Phoe
nix

THANK YOU!
July 23, 2020
This presentation has been prepared in good faith based on CBRE’s current views of the commercial real-estate market. Although CBRE believes its views reflect market conditions on the date of this presentation, they aresubject to significant uncertainties and contingencies, many of which are beyond CBRE’s control. In addition, many of CBRE’s views are opinion and/or projections based on CBRE’s subjective analyses of current marketcircumstances. Other firms may have different opinions, projections and analyses, and actual market conditions in the future may cause CBRE’s current views to later be incorrect. CBRE has no obligation to update its viewsherein if its opinions, projections, analyses or market circumstances later change.Nothing in this presentation should be construed as an indicator of the future performance of CBRE’s securities or of the performance of any other company’s securities. You should not purchase or sell securities – of CBREor any other company – based on the views herein. CBRE disclaims all liability for securities purchased or sold based on information herein, and by viewing this presentation, you waive all claims against CBRE and thepresenter as well as against CBRE’s affiliates, officers, directors, employees, agents, advisers and representatives arising out of the accuracy, completeness, adequacy or your use of the information herein.© Copyright 2020 CBRE


