CRS Report for Congress Prepared for Members and Committees of Congress U.S. Household Savings for Retirement in 2010 John J. Topoleski Analyst in Income Security July 23, 2013 Congressional Research Service 7-5700 www.crs.gov R43057
Transcript
CRS Report for CongressPrepared for Members and Committees of Congress
U.S. Household Savings for Retirement in 2010
John J. Topoleski Analyst in Income Security
July 23, 2013
Congressional Research Service
7-5700 www.crs.gov
R43057
U.S. Household Savings for Retirement in 2010
Congressional Research Service
Summary Whether households have sufficient savings from which to ensure adequate income throughout retirement is a concern of households and, therefore, policymakers. The retirement income landscape has been changing over the past few decades. Although most households are eligible to receive Social Security benefits in retirement, over the past 30 years, the types of non-Social Security sources of retirement income have been changing. About half of the U.S. workforce is covered by an employer-sponsored pension plan. An increasing number of employers offer defined contributions (DC) pension plans (i.e., tax-advantaged accounts in which employee, and sometimes employer, contributions accrue investment returns) in lieu of traditional defined benefit (DB) pension plans (i.e., monthly payments to a retiree by a former employer). This shift in the nature of employer-sponsored pensions places more responsibility on workers to financially prepare for their own retirement. Households also save for retirement using Individual Retirement Accounts (IRAs), into which contributions, up to a specified limit, are tax-deductible for some individuals.
Congress has several reasons for its interest in the retirement preparedness of American households: income from Social Security may be insufficient to provide for an adequate standard of living in retirement for U.S. households; congressional actions may encourage or discourage employer and household efforts to provide for their own well-being in retirement; and the U.S. Treasury will forego $117 billion in FY2013 as a result of tax policies that are designed to encourage employer and worker retirement savings. President Obama’s FY2014 budget would prohibit contributions to DC pension plans and IRAs that have a value over $3.4 million. This threshold is specified to be equivalent to the maximum annual payment allowed from a DB pension plan, which is $205,000 in 2013.
This report provides data on a variety of household wealth measures in 2010 from the Federal Reserve’s triennial Survey of Consumer Finances. Although the amount of retirement assets is the primary focus of the report, other measures of wealth (such as the amount of total assets, financial assets, total debt, net worth, and housing equity) are also included. The report classifies the amount of assets and debt by the age of the head of the household for both single and married households. In general, the amount of household wealth is higher for married households than for single households. Household wealth generally increased as the age of the head of the household increased, although some measures decreased for those households in which the head of the household was aged 75 or older. In general, the median values were less than the average values, which is an indication that some households held relatively large amounts of wealth compared with most households.
Among households with retirement assets, households in which the head is younger than 55 years old are more likely to own DC pension plan assets than they are likely to own assets from IRAs, whereas households in which the head is aged 55 or older are more likely to have IRA assets. In 2010, less than 1.0% of U.S. households had IRA or DC assets of $1.0 million or more.
Ownership of a principal residence is likely to be a factor that affects the accumulation of retirement assets. Survey data suggest an important saving goal for younger households is home ownership, whereas preparing for retirement is an important saving goal for older households. As the age of the head of the household increases, the percentage of assets represented by the household’s principal residence decreases, although there is not a discernible pattern to the percentage of wealth that retirement assets represent.
U.S. Household Savings for Retirement in 2010
Congressional Research Service
Contents Introduction ...................................................................................................................................... 1 Types of Retirement Plans and Accounts ......................................................................................... 3
Defined Benefit Pension Plans .................................................................................................. 3 Defined Contribution Pension Plans .......................................................................................... 3 Individual Retirement Accounts ................................................................................................ 3
Household Net Worth in 2010 ......................................................................................................... 4 Assets, Debt, and Net Worth Among Single and Married Households in 2010 .............................. 5 Defined Contribution and IRA Balances Among All Households in 2010 .................................... 11 Percentage of Households with an IRA Balance, DC Plan Balance, or DB Pension in
2010 ............................................................................................................................................ 16 DC and IRA Balances Among Households with DC or IRA Balances in 2010 ............................ 18 Value of a Principal Residence as a Percentage of Total Assets in 2010 ....................................... 19 Home Equity as a Percentage of the Value of the Principal Residence in 2010 ............................ 20 Implications for Policy................................................................................................................... 21
Figures Figure 1. Net Worth in 2010 Among Single and Married Households ............................................ 5 Figure 2. DC Plan and IRA assets in 2010 Among Single and Married Households .................... 11 Figure 3. Percentage of Households in 2010 with an IRA Balance, DC Account Balance,
or a Defined Benefit Pension ...................................................................................................... 17 Figure 4. DC and IRA Balances in 2010 Among Single and Married Households with DC
or IRA Balances .......................................................................................................................... 18 Figure 5. Value of a Principal Residence in 2010 as a Percentage of Total Assets ........................ 19 Figure 6. Principal Residence Equity as a Percentage of the Value of the Principal
Tables Table 1. Median Assets, Debt, Net Worth, and Income Among Single Households in
2010 .............................................................................................................................................. 7 Table 2. Average Assets, Debt, Net Worth, and Income Among Single Households in
2010 .............................................................................................................................................. 8 Table 3. Median Assets, Debt, Net Worth, and Income Among Married Households in
2010 .............................................................................................................................................. 9 Table 4. Average Assets, Debt, Net Worth, and Income Among Married Households in
2010 ............................................................................................................................................ 10 Table 5. Distribution of Retirement Assets Among Households in 2010 ..................................... 14
U.S. Household Savings for Retirement in 2010
Congressional Research Service
Table 6. Distribution of IRA and DC Retirement Assets Among All Households and Working Households in 2010 ..................................................................................................... 15
Table 7. Median and Average Retirement Assets in 2010 Among Households in Which the Head Was Aged 62 to 67 ....................................................................................................... 16
Appendixes Appendix. Survey of Consumer Finances ..................................................................................... 23
Introduction Americans financially prepare for retirement in a variety of ways: most individuals who work are eligible for Social Security benefits; about half the workforce is covered by an employer-sponsored pension; some save for retirement using Individual Retirement Accounts (IRAs); others accumulate non-retirement financial assets, such as stocks, bonds, and mutual funds; and some accumulate non-financial assets, such as homes or other real estate or business ownerships. A persistent concern among policymakers is whether households will have sufficient resources to maintain their pre-retirement standards of living throughout retirement.
A pension plan is a voluntary benefit that some employers provide to their workers. Employers who offer pension plans for their workers sponsor one or both types: defined benefit (DB) pension plans or defined contribution (DC) pension plans. In DB pensions, participants receive a monthly payment in retirement that is based on a formula that typically uses a combination of length of service, an accrual rate, and an average of final years’ salary. In DC plans, of which 401(k) plans are the most common, workers contribute a percentage of their wages to an individually established account. Employers may also contribute a match to the DC plan, which is an additional contribution equal to some or all of the worker’s contribution. The account accrues investment returns and is then used as a basis for income in retirement. Individuals may be eligible to make contributions to IRAs if they have earnings from work or by making a rollover contribution from an employer-sponsored pension.
To encourage American households to save for retirement, Congress has authorized a variety of tax incentives for both employer-sponsored pensions and IRAs. Among the incentives are (1) an income tax deduction for employer contributions to DB pension plans; (2) the deferral of income taxes on employee and employer contributions to employer-sponsored DC retirement accounts; and (3) a tax deduction for some contributions to IRAs.1 The Joint Committee on Taxation (JCT) estimated that in FY2013, the U.S. Treasury will forgo $117.2 billion of income as a result of the exclusion from income of contributions to, and earnings from, pension plans.2 The only larger tax expenditure in FY2013 is expected to be the exclusion of employer contributions for medical insurance premiums ($131.7 billion).3 Congress has expressed support for the goal of increasing U.S. household retirement income security. For example, in the 112th Congress, the Senate passed resolutions supporting the goals of “National Save for Retirement Week.” 4
1 In DC accounts, employees (and often their employers) place funds in individual employee accounts that are used as the basis for retirement incomes. 2 See U.S. Congress, Joint Committee on Taxation, Estimate Of Federal Tax Expenditures For Fiscal Years 2012-2017, committee print, 113th Cong., 1st sess., February 1, 2013, JCS-1-13 (Washington, DC: GPO, 2013). 3 Some point out that the dollar amount reported by U.S. Treasury and JCT of the tax expenditure for pensions is overstated because the exclusion from income of contributions to pensions and IRAs is a deferral of taxes that will be paid in the future. In comparison, the dollar amount of other tax expenditures (such as the exclusion from income of payments for medical insurance premiums) represents permanent losses to the U.S. Treasury. For more information, see Peter Brady, The Tax Benefits and Revenue Costs of Tax Deferral, Investment Company Institute, Washington, DC, September 2012, http://www.ici.org/pdf/ppr_12_tax_benefits.pdf. or Judy Xanthopoulos, Ph.D. and Mary M. Schmitt, Retirement Savings and Tax Expenditure Estimates, American Society of Pension Professionals & Actuaries, Arlington, VA, May 2011, http://www.asppa.org/Main-Menu/govtaffairs/RET.aspx. 4 See S.Res. 266 and S.Res. 555. In the 111th Congress, both the House and Senate passed resolutions supporting the goals of “National Save for Retirement Week.” See H.Res. 662 and S.Res. 649 in the 111th Congress.
U.S. Household Savings for Retirement in 2010
Congressional Research Service 2
The nature of employer-sponsored pensions has changed over the past 30 years. When the first major pension legislation (Employee Retirement Income Security Act of 1974 [ERISA; P.L. 93-406]) was passed, employer-sponsored pensions were mainly DB plans. Since 1974, fewer and fewer employers have been offering DB pensions, whereas an increasing number of employers offer DC pensions. Because of this shift, an increasing number of households have greater responsibility for their economic well-being in retirement.5 This trend is set to continue for the foreseeable future, and many households expect to rely on their DC accounts as a source of income in retirement. For example, among non-retirees surveyed by the Gallup in November 2012, 68% indicated that they expected a 401(k), IRA, or other retirement savings account to be a major source of income in retirement.6
The amounts that Americans have saved for retirement are an important component of evaluating the effectiveness of public policies toward retirement income security and understanding how prepared American households are for retirement. Despite tax incentives to promote saving for retirement, 57% of Americans surveyed by Gallup in January 2013 reported that they were worried about outliving their savings after they retire.7 Many factors affect the accumulation of financial and non-financial assets by American households. Some of these factors include education; income; the number of children in a household; the amount, if any, of non-measured wealth, such as future Social Security or DB pension benefits; and tax policy as established by Congress.8
Households have a variety of choices about where to put their wealth and may have different reasons for saving. Households that are saving to purchase a home or for their children’s education might be less likely to consider putting money into a retirement account. The Congressional Research Service’s (CRS’s) analysis of the 2010 Survey of Consumer Finances (SCF) indicated that 29.1% of all U.S. households indicated that saving for retirement is their most important reason for saving and was the second most important reason for saving for an additional 9.1% of households.
Although this report examines the amount of wealth (such as financial and retirement assets) that households own, it does not address the adequacy of these assets to provide financial security in retirement. A large academic and policy literature addresses the adequacy of current retirement savings and policies.9
5 For more information on this trend, see Barbara A. Butrica, Howard M. Iams, and Karen E. Smith et al., The Disappearing Defined Benefit Pension and Its Potential Impact on the Retirement Incomes of Baby Boomers, Social Security Bulletin, vol. 69, no. 3, 2009, http://www.ssa.gov/policy/docs/ssb/v69n3/v69n3p1.html or CRS Report RL30122, Pension Sponsorship and Participation: Summary of Recent Trends, by John J. Topoleski. 6 See Gallup, “U.S. Investors Want Gov't to Enhance 401(k) Accounts,” press release, January 23, 2013, http://www.gallup.com/poll/159614/investors-gov-enhance-401-accounts.aspx. 7 See Gallup, “U.S. Financial Worries Rival Those of 1992,” press release, January 25, 2012, http://www.gallup.com/poll/152180/Financial-Worries-Rival-1992.aspx. 8 See, for example, Sondra Beverly, Michael Sherraden, and Min Zhan et al., Determinants of Asset Building: A Report in the Series, Poor Finances: Assets and Low-Income Households, U.S. Department of Health and Human Services, Office of the Assistant Secretary for Planning and Evaluation (DHHS/ASPE), March 2008, http://aspe.hhs.gov/hsp/07/poorfinances/determinants/report.pdf. 9 For example, see Jack VanDerhei, A Post Crisis Assessment of Retirement Income Adequacy for Baby Boomers and Gen Xers, Employee Benefit Research Institute, Issue Brief 354, February 2011, http://www.ebri.org/pdf/briefspdf/IB.Feb11.Post-Crisis_RetIncAd.FinalFlow.pdf. Pablo Antolin, “Private Pensions and the Financial Crisis: How to Ensure Adequate Retirement Income from DC Pension Plans,” Organization for Economic Cooperation and Development (OECD), OECD Journal: Financial Market Trends, vol. 2009, issue 2 (2009), http://www.oecd.org/(continued...)
U.S. Household Savings for Retirement in 2010
Congressional Research Service 3
Types of Retirement Plans and Accounts Congress has authorized a variety of tax incentives to encourage employers and workers to save for retirement. For example, employer contributions to retirement plans are excluded from the company’s taxable income and taxes on investment earnings in DC accounts are deferred until distributed. Some employers sponsor DB or DC pension plans (or both) and individual workers, regardless of their participation in an employer-sponsored pension plan, may also establish and contribute to IRAs (although only workers who do not have an employer-sponsored pension or who have an employer-sponsored pension plan and who have earnings below specified thresholds receive a tax-deduction for their IRA contributions).
Defined Benefit Pension Plans In DB pension plans, participants receive a monthly payment in retirement that is based on a formula that typically uses a combination of length of service, accrual rate, and average of final years’ salary. For example, a plan might specify that retirees receive an amount equal to 1.5% of their pay for each year of service, where the pay is the average of a worker’s highest five pay years.10
Defined Contribution Pension Plans In DC plans—of which 401(k) plans, 403(b) plans, 457(b), and the Thrift Savings Plan (TSP) are the most common—workers contribute a percentage of their wages to an individual account established by the employer.11 Employers may also contribute a match to the DC plan, which is an additional contribution equal to some or all of the worker’s contribution. The account accrues investment returns and is then used as a basis for income in retirement.
Individual Retirement Accounts IRAs are tax-advantaged accounts that individuals (or married couples) can establish to accumulate funds for retirement. Any individual under the age of 70½ and who has earnings from work may establish and contribute to an IRA. Individuals may rollover their DC plan assets into
(...continued) finance/financialmarkets/44628862.pdf. William G. Gale, John Karl Scholz, and Ananth Seshadri, “Are All Americans Saving ‘Optimally’ for Retirement?,” December 31, 2009, http://www.ssc.wisc.edu/~scholz/Research/Are_All_Americans_v6.pdf. Barbara A. Butrica, Karen E. Smith, and Howard M. Iams, This Is Not Your Parents’ Retirement: Comparing Retirement Income Across Generations, Social Security Bulletin, vol. 72, no. 1, 2012, http://www.ssa.gov/policy/docs/ssb/v72n1/v72n1p37.html. 10 A worker with 20 years of service in a DB that has accrual rate of 1.5% that is based on an average of the worker’s highest five years of salary of $50,000 would receive a pension benefit of $50,000 x 20 x .015 = $15,000 per year. 11 Except for the TSP, which is sponsored by the federal government, the plans are named for the section of the Internal Revenue Code that authorizes the plan. Private-sector employers sponsor 401(k) plans, public school systems and non-profit organizations sponsor 403(b) plans, and state and local governments sponsor 457(b) plans. For more information, see http://www.irs.gov/Retirement-Plans/Plan-Sponsor/Types-of-Retirement-Plans-1 or CRS Report R40707, 401(k) Plans and Retirement Savings: Issues for Congress, by John J. Topoleski.
U.S. Household Savings for Retirement in 2010
Congressional Research Service 4
an IRA. A rollover is the transfer of assets from one retirement plan to an IRA upon separation from the original employer.12
Household Net Worth in 2010 Figure 1 shows the distribution of household net worth in quartiles classified by marital status and the age of the head of the household.13 Net worth is the broadest wealth measure and is calculated as the value of household assets minus the value of household debt. Household assets include financial assets (such as checking accounts, savings accounts, stocks, bonds, mutual funds, defined contribution retirement accounts, IRAs, and the cash value of life insurance) and non-financial assets (such as vehicles, housing and other real estate, and businesses). Retirement assets consist primarily of DC retirement account balances (such as 401(k), 403(b), 457(b) accounts, and the TSP) and IRAs. Household debt includes, among other debts, credit card debt, mortgages, installment loans, and loans from DC retirement accounts.14 Data in this report are from the 2010 SCF, which is a triennial household survey conducted by the Federal Reserve.15 The SCF collects information about the amount of regular payments that households receive (for example, from Social Security and defined benefit pensions), but it does not include the value of these payments in household wealth calculations.
In 2010, among married households in which the age of the head of the household was younger than 35, 25% had net worth less than or equal to $1,170; 50% had net worth less than or equal to $15,000 (which was the median net worth for this group); and 75% had net worth less than or equal to $63,900. With the exception of married households in which the head of the household was 75 years old or older, median net worth in 2010 increased with the age of the head of the household. Within each age group, median net worth was higher for married households than for single households.
Figure 1 includes retirement assets as a percentage of net worth. Households in which the head is aged 55 to 64 had the highest percentages of retirement assets (19.4% for single households and 19.9% for married households). Households in which the head is older than 74 years of age owned the lowest percentage of retirement assets of any age group (6.9% of single households and 9.7% of married households). Possible explanations for the low percentage among households in which the head is older than 74 years include (1) these households are most likely to be retired and thus have been drawing down their retirement assets and (2) these households are more likely to have a DB pension plan, which is a source of income in retirement but is not measured by the SCF. Households that expect to receive income in retirement from a DB pension plan may need to save less than households that do not expect to receive DB pension income.
12 More information on IRAs is available in CRS Report RL34397, Traditional and Roth Individual Retirement Accounts (IRAs): A Primer, by John J. Topoleski. 13 Quartiles are the three values that divide the data into four equal groups (e.g., 25% of observations are equal to or less than the first quartile, 50% of the observations are equal to or less than the second quartile). In this report, quartile values are for the range of values within each subgroup. Households were grouped between married and single households, and then grouped into one of six subgroups based on the age of the head of the household. Quartiles are then reported within each of the 12 subgroups. 14 The net worth of all American households in 2010 was $58.2 trillion. 15 More information about the Survey of Consumer Finances is available in the Appendix.
U.S. Household Savings for Retirement in 2010
Congressional Research Service 5
Figure 1. Net Worth in 2010 Among Single and Married Households First Quartile, Median, and Third Quartile Amounts by Age of the Head of the Household
Percentages represent defined contribution account and IRA balances as a percentage of household net worth
Source: The Congressional Research Service (CRS) analysis of the 2010 Survey of Consumer Finances (SCF).
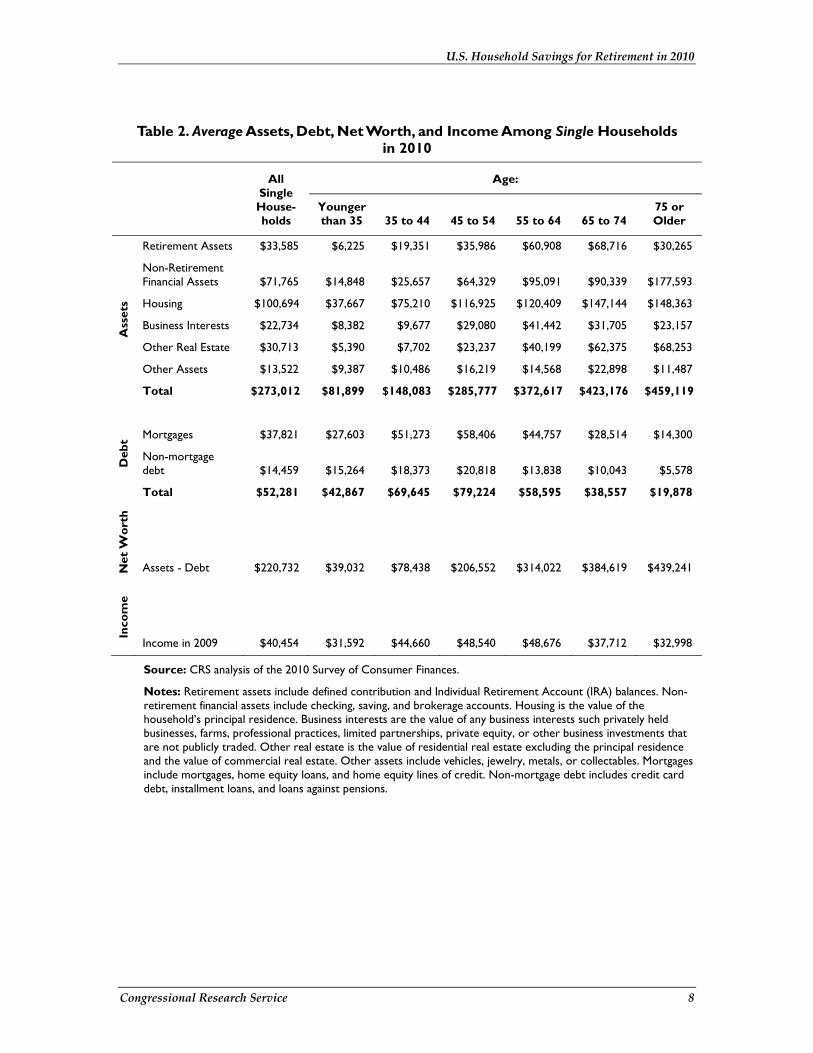
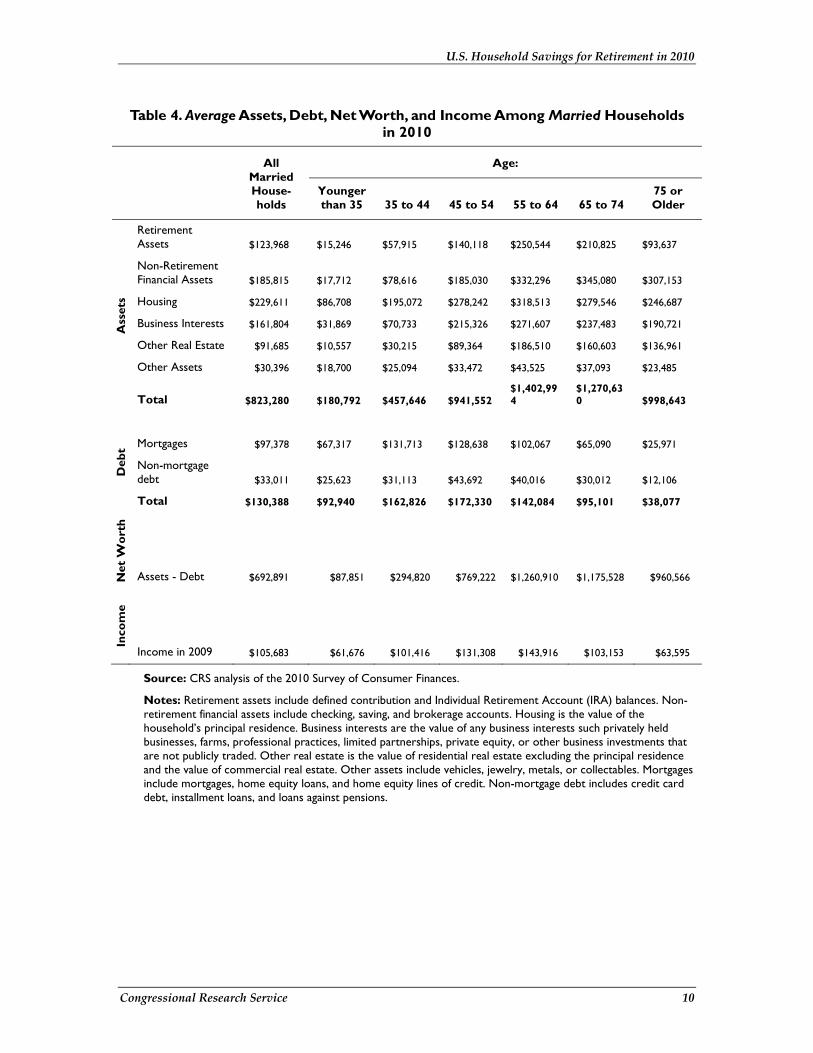
Assets, Debt, and Net Worth Among Single and Married Households in 2010 Table 1 and Table 2 provide, respectively, the median and average values for each of the components of household net worth among single households. Table 3 and Table 4 provide, respectively, the median and average values for each of the components of household net worth among married households. Because a large percentage of households hold relatively small amounts of financial assets and debt, the distribution of these variables is highly skewed. As a result, there are large differences between the average and median values of most financial variables. A few very large observations produce a higher average value for a set of data but do not affect the median value.16 For example, among married households in which the head of the
16 Means and medians provide different, but useful, information. Median values represent the experience of the middle (or typical) household. However, medians are not additive. For example, the median value of net worth is not equal to the median value of assets minus the median value of debt. However, average values are additive: the average value of net worth is equal to the average value of assets minus the average value of debt. Medians facilitate the understanding of the ownership of assets and debt among the typical household (e.g., 50% of single households had net worth less than or equal to $34,300), whereas averages facilitate mathematical computation and therefore comparisons across (continued...)
U.S. Household Savings for Retirement in 2010
Congressional Research Service 6
household was aged 45 to 54, median net worth (from Table 3) was $181,000 whereas average net worth (from Table 4) was $769,222.
Ownership of business interests and of non-residential real estate was not widespread among American households. In 2010, median values for business interests and non-residential real estate were $0 for all age groups among single and married households. This is an indication that at least half of the households do not own any of these types of assets.
In 2010, married households had much larger amounts of assets and debt than single households. Both average and median asset and debt values for every age group were at least twice as large for married households compared with single households.
Table 1 indicates that at least half of all single households did not own any retirement assets in 2010, as the median assets amounts for each age group is $0. Table 1 and Table 2 also show that there was a large increase in the median and average amounts of non-retirement financial assets for single households in which the age of the head of household is 75 or older compared with single households in which the age of the householder is 65 to 74. Median non-retirement financial assets increased by 214.5% from $6,200 to $19,500 and average non-retirement financial assets increased by 96.6% from $90,339 to $177,593.
Among married households in which the head of the household was aged 75 or older, Table 3 shows that median non-retirement financial assets increased by 34.3% (from $28,291 to $38,000) compared with married households in which the head was aged 65 to 74, though average non-retirement financial assets declined by 11.0% (from $345,080 to $307,153). The change in average and median amounts of non-retirement financial assets is not completely explained by decreases in other assets, such as businesses, as decreases in the amount of these assets were insufficient to provide a complete explanation.
For all single and married households in which the head was younger than 55 years of age, the largest component of household assets was the principal residence. However, because many households had mortgages, mortgage debt was also a large component of households’ financial situation. For married households in which the head was aged 55 or older, non-retirement financial assets were the largest component of assets. For all single and married households, the average amount of non-retirement financial assets was larger than the amount of retirement assets.
(...continued) asset and debt categories (e.g., retirement assets were 12.3% of single households’ total assets).
U.S. Household Savings for Retirement in 2010
Congressional Research Service 7
Table 1. Median Assets, Debt, Net Worth, and Income Among Single Households in 2010
All Single House-holds
Age:
Younger than 35 35 to 44 45 to 54 55 to 64 65 to 74
Income in 2009 $28,462 $24,396 $35,578 $33,545 $31,512 $25,413 $21,143
Source: The Congressional Research Service (CRS) analysis of the 2010 Survey of Consumer Finances (SCF).
Notes: Retirement assets include defined contribution and Individual Retirement Account (IRA) balances. Non-retirement financial assets include checking, saving, and brokerage accounts. Housing is the value of the household’s principal residence. Business interests are the value of any business interests such privately held businesses, farms, professional practices, limited partnerships, private equity, or other business investments that are not publicly traded. Other real estate is the value of residential real estate excluding the principal residence and the value of commercial real estate. Other assets include vehicles, jewelry, metals, or collectables. Mortgages include mortgages, home equity loans, and home equity lines of credit. Non-mortgage debt includes credit card debt, installment loans, and loans against pensions.
U.S. Household Savings for Retirement in 2010
Congressional Research Service 8
Table 2. Average Assets, Debt, Net Worth, and Income Among Single Households in 2010
All Single House-holds
Age:
Younger than 35 35 to 44 45 to 54 55 to 64 65 to 74
Income in 2009 $40,454 $31,592 $44,660 $48,540 $48,676 $37,712 $32,998
Source: CRS analysis of the 2010 Survey of Consumer Finances.
Notes: Retirement assets include defined contribution and Individual Retirement Account (IRA) balances. Non-retirement financial assets include checking, saving, and brokerage accounts. Housing is the value of the household’s principal residence. Business interests are the value of any business interests such privately held businesses, farms, professional practices, limited partnerships, private equity, or other business investments that are not publicly traded. Other real estate is the value of residential real estate excluding the principal residence and the value of commercial real estate. Other assets include vehicles, jewelry, metals, or collectables. Mortgages include mortgages, home equity loans, and home equity lines of credit. Non-mortgage debt includes credit card debt, installment loans, and loans against pensions.
U.S. Household Savings for Retirement in 2010
Congressional Research Service 9
Table 3. Median Assets, Debt, Net Worth, and Income Among Married Households in 2010
All Married House-holds
Age:
Younger than 35 35 to 44 45 to 54 55 to 64 65 to 74
Income in 2009 $65,057 $50,825 $71,156 $80,304 $76,238 $59,974 $39,644
Source: CRS analysis of the 2010 Survey of Consumer Finances.
Notes: Age refers to age of the head of the household. Retirement assets include defined contribution and Individual Retirement Account (IRA) balances. Non-retirement financial assets include checking, saving, and brokerage accounts. Housing is the value of the household’s principal residence. Business interests are the value of any business interests such privately held businesses, farms, professional practices, limited partnerships, private equity, or other business investments that are not publicly traded. Other real estate is the value of residential real estate excluding the principal residence and the value of commercial real estate. Other assets include vehicles, jewelry, metals, or collectables. Mortgages include mortgages, home equity loans, and home equity lines of credit. Non-mortgage debt includes credit card debt, installment loans, and loans against pensions.
U.S. Household Savings for Retirement in 2010
Congressional Research Service 10
Table 4. Average Assets, Debt, Net Worth, and Income Among Married Households in 2010
All Married House-holds
Age:
Younger than 35 35 to 44 45 to 54 55 to 64 65 to 74
Income in 2009 $105,683 $61,676 $101,416 $131,308 $143,916 $103,153 $63,595
Source: CRS analysis of the 2010 Survey of Consumer Finances.
Notes: Retirement assets include defined contribution and Individual Retirement Account (IRA) balances. Non-retirement financial assets include checking, saving, and brokerage accounts. Housing is the value of the household’s principal residence. Business interests are the value of any business interests such privately held businesses, farms, professional practices, limited partnerships, private equity, or other business investments that are not publicly traded. Other real estate is the value of residential real estate excluding the principal residence and the value of commercial real estate. Other assets include vehicles, jewelry, metals, or collectables. Mortgages include mortgages, home equity loans, and home equity lines of credit. Non-mortgage debt includes credit card debt, installment loans, and loans against pensions.
U.S. Household Savings for Retirement in 2010
Congressional Research Service 11
Defined Contribution and IRA Balances Among All Households in 2010 Figure 2 shows the distribution of retirement assets for single and married households in quartiles, classified by the age of the head of the household. Retirement assets are defined as the value of DC accounts and the value of IRAs. Most households had small amounts in their DC plans or IRAs. A majority of single households in each age group had no retirement assets in 2010. Compared with single households, a greater percentage of married households in each age group had retirement assets. The data do not include estimates of the value of future defined benefit or Social Security payments, which might affect how households prepare financially for retirement. Younger households are less likely than older households to be covered by DB pension plans and so may need to prepare for retirement differently than previous generations.
Figure 2 also includes the percentage of households within each age group that had either DC or IRA assets. The percentage of households with retirement assets increased as the age of the head of the household increased from under 35 years old to 55 to 64 years old. The percentage declined for households in which the head was aged 65 to 74 and for households aged 75 or older. Among single households, within each age group, at least half of the households did not have any retirement assets. Among married households, 70.6% of households in which the head was aged 55 to 64 have retirement assets, the highest percentage of any group in Figure 2.
Figure 2. DC Plan and IRA assets in 2010 Among Single and Married Households First Quartile, Median, and Third Quartile Amounts by Age of the Head of the Household
Source: CRS analysis of the 2010 Survey of Consumer Finances.
U.S. Household Savings for Retirement in 2010
Congressional Research Service 12
Table 5 provides the distribution of retirement assets among (1) the 117.6 million U.S. households in 2010 and (2) the 91.0 million households in which either the head of the household or the spouse was in the labor force in 2010. Table 6 provides the distributions separately for IRA and for DC assets. Households in which neither the head of the household nor the spouse were in the labor force would likely not have made a contribution to a retirement account in 2010 because (1) they would not have been working for an employer that offered a defined contribution retirement plan and (2) they would not have had income from wages from which to make a contribution to an IRA.17
Slightly more than half (50.4%) of U.S. households had retirement assets in 2010 and 31.6 million (26.8%) had more than $0 and less than $50,000 in retirement assets in 2010. Approximately 1.8 million of all U.S. households (1.6%) had retirement assets greater than $1.0 million in 2010.
The Obama Administration’s FY2014 budget has proposed prohibiting contributions to retirement accounts if the sum of the taxpayer’s retirement accounts is greater than the amount needed to fund an annuity equal to the maximum benefit allowed in a DB pension plan. Under 26 U.S.C. Section 415(b)(1)(A), the maximum benefit allowed from a DB plan is $205,000 in 2013.18 The proposed FY2014 budget estimates that the amount of DC plan assets needed to fund an annuity equal to $205,000 would be approximately $3.4 million.19 The maximum could decrease or increase as interest rates increase or decrease respectively.20
The Obama Administration has indicated that an individual’s participation in a DB plan would affect an individual’s maximum account balance. For example, individuals who expect to receive DB pensions in retirement from their current or past job would need less than the currently proposed $3.4 million account balance to receive $205,000 per year in retirement income. For example, an individual who expects to receive DB income of $25,000 per year would face a retirement account limit that would provide an annuity of $180,000 per year ($205,000 - $25,000 = $180,000).
Under the proposal, each person with a DB pension would have a different maximum DC account limit. In addition, for individuals who expect to receive DB pension benefits, their maximum DC
17 It is possible that a few households classified as not in the labor force may have worked for an employer with a 401(k) plan or had income from wages prior to or after participating in the survey. 18 See Internal Revenue Service, “IR-2012-77: IRS Announces 2013 Pension Plan Limitations; Taxpayers May Contribute Up to $17,500 to Their 401(k) Plans in 2013,” press release, October 18, 2012, http://www.irs.gov/uac/2013-Pension-Plan-Limitations. 19 See Office of Management and Budget, Analytical Perspectives, Budget of the United States Government, Fiscal Year 2014, Washington, DC, April 2013, p. 201, http://www.whitehouse.gov/sites/default/files/omb/budget/fy2014/assets/spec.pdf and also U.S. Department of Treasury, General Explanations of the Administration’s Revenue Proposals (Greenbook), Washington, DC, April 2013, http://www.treasury.gov/resource-center/tax-policy/Documents/General-Explanations-FY2014.pdf. 20 The dollar amount needed to purchase a given annuity amount is inversely related to prevailing interest rates. Given that current interest rates are at historically low levels, increases in interest rates would lower the amount needed to fund a given annuity amount. The Obama Administration’s proposal does not indicate whether the maximum dollar amount allowed in retirement accounts would increase or decrease with interest rate changes. For example, the Employee Benefit Research Institute (EBRI) has indicated that in 2006 (interest rates were higher in 2006 compared with today), the maximum retirement account amount would have been $2.2 million. See Employee Benefit Research Institute, “FY 2014 Obama Budget Proposal (Updated): The Impact of a Retirement Savings Account Cap,” press release, April 12, 2013, http://www.ebri.org/pdf/PR-1019.Advise2.12Apr13.RetCap-Update1.pdf.
U.S. Household Savings for Retirement in 2010
Congressional Research Service 13
account limits could change each year as they accrue benefits in the DB plan for which they are eligible.
Because only households that have income from earnings may make contributions to IRA and 401(k) plans, Table 5 also provides the distribution of retirement account balances among households in which either the head of the household or spouse, if any, are in the labor force. Table 5 indicates that the head of household or the spouse of approximately 130,000 households were in the labor force in 2010 and had retirement assets of $3.0 million or more. Some households that have retirement assets less than the proposed maximum of $3.4 million and benefits from a DB retirement plan could be affected by the proposed limit on retirement account balances. Households that expect to receive income from a defined benefit pension will face a retirement account balance less than $3.4 million because the receipt of a DB pension will reduce the IRA and DC account amounts needed to fund an annuity of $205,000. Among households in which the head or spouse was in the labor force in 2010, 283,000 had account balances greater than $2.0 million and less than $3.0 million and 129,983 households had retirement account balances of $3.0 million or more.
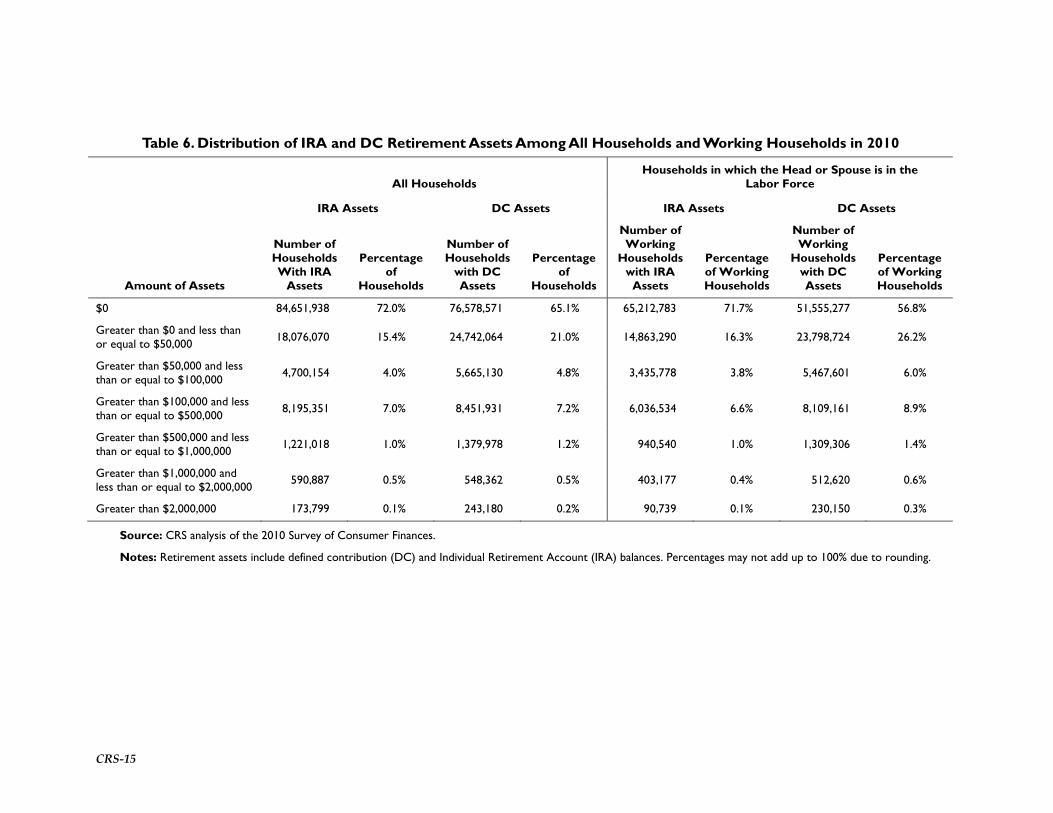
Among households that have retirement assets, some households have only IRA assets, some households have only DC assets, and some households have both. Table 6 indicates that more households have DC assets than have IRA assets even though IRAs were authorized in 1974 and DC plans became widespread in the early 1990’s. Approximately 33.0 million households (28.0%) have IRA assets whereas 41.0 million (34.9%) have DC assets. Less than 1.0% of U.S. households had IRA or DC assets of $1.0 million or more.
CRS-14
Table 5. Distribution of Retirement Assets Among Households in 2010
All Households Households in which the Head or Spouse is in
the Labor Force
Amount of Retirement Assets Number of Households Percentage of All Households
Number of Working Households
Percentage of Working Households
$0 58,363,198 49.6% 39,849,170 43.8%
Greater than $0 and less than or equal to $50,000 31,527,732 26.8% 27,810,222 30.6%
Greater than $50,000 and less than or equal to $100,000
8,325,406 7.1% 7,023,745 7.7%
Greater than $100,000 and less than or equal to $500,000
14,690,016 12.5% 12,322,614 13.5%
Greater than $500,000 and less than or equal to $1,000,000
2,919,566 2.5% 2,516,501 2.8%
Greater than $1,000,000 and less than or equal to $2,000,000
1,273,997 1.1% 1,047,414 1.2%
Greater than $2,000,000 and less than or equal to $3,000,000
335,415 0.3% 283,192 0.3%
Greater than $3,000,000 173,886 0.1% 129,983 0.1%
Source: CRS analysis of the 2010 Survey of Consumer Finances.
Notes: Retirement assets include defined contribution (DC) and Individual Retirement Account (IRA) balances. Percentages may not add up to 100% due to rounding.
CRS-15
Table 6. Distribution of IRA and DC Retirement Assets Among All Households and Working Households in 2010
All Households Households in which the Head or Spouse is in the
Source: CRS analysis of the 2010 Survey of Consumer Finances.
Notes: Retirement assets include defined contribution (DC) and Individual Retirement Account (IRA) balances. Percentages may not add up to 100% due to rounding.
U.S. Household Savings for Retirement in 2010
Congressional Research Service 16
Although workers may retire at any age, ages 62 to 67 might generally be thought of as retirement age. Individuals are eligible to receive reduced Social Security benefits at age 62, are eligible for Medicare at age 65, and full Social Security benefits at their normal retirement age (age 67 for individuals born after January 1, 1960). In addition, age 65 is often the normal retirement age in private-sector and state and local pension plans. Among households in which the head of the household was aged 62 to 67 in 2010, 57.2% had retirement assets whereas 42.8% did not have retirement assets. Table 7 shows median and average account balances in 2010 for households in which the head of the household was aged 62 to 67.
Table 7. Median and Average Retirement Assets in 2010 Among Households in Which the Head Was Aged 62 to 67
All Households
Single Households
Married Households
Total Retirement (IRA and DC) Assets
Median $150,000 $70,000 $178,000
Average $341,417 $205,227 $384,000
IRA Assets Median $115,000 $50,000 $140,000
Average $265,475 $148,792 $307,300
DC Assets Median $80,000 $30,000 $100,000
Average $246,115 $152,123 $272,761
Source: CRS analysis of the 2010 Survey of Consumer Finances.
Notes: Retirement assets include defined contribution (DC) and Individual Retirement Account (IRA) balances. Median and average amounts are among households that have retirement assets, IRA assets, and DC assets, respectively.
Percentage of Households with an IRA Balance, DC Plan Balance, or DB Pension in 2010 Figure 3 shows the percentage of households that in 2010 had DB plans, DC plans, and IRAs. For a given age of the head of household, married households were more likely than single households to have had a retirement plan or a retirement account.
Older households were more likely to have had a DB pension, which is consistent with other evidence that shows a decline in DB pension plan coverage and an increase in DC pension plan coverage over the past 20 years.21
The “hump-shaped” pattern of the percentage of households that had DC assets and IRA assets shows that ownership of retirement accounts initially increased as the age of the head of the household increased but then declined as the head of the household became older. This pattern is consistent with the evidence of a shift from DB to DC pension plans, as older households were 21 See, for example, Barbara A. Butrica, Karen Elizabeth Smith, and Eric Toder et al., The Disappearing Defined Benefit Pension and its Potential Impact on the Retirement Incomes of Boomers, Center of Retirement Research, 2009-2, January 2009, http://crr.bc.edu/working-papers/the-disappearing-defined-benefit-pension-and-its-potential-impact-on-the-retirement-incomes-of-boomers/.
U.S. Household Savings for Retirement in 2010
Congressional Research Service 17
less likely to have been offered a DC pension plan in their working careers. In comparing DC and IRA ownership, younger households were more likely to have had a DC pension whereas older households were more likely to have an IRA. One likely explanation is that as individuals retired, they made rollovers of the account balances of their DC plans into IRAs.22
Figure 3. Percentage of Households in 2010 with an IRA Balance, DC Account Balance, or a Defined Benefit Pension
Source: CRS analysis of the 2010 Survey of Consumer Finances.
Notes: Percentages represent percentages of households that had the type of plan at the time of the survey. Households may have had more than one type of plan.
22 The rollovers can be voluntary or involuntary. When a worker who participates in a DC plan leaves the employer who sponsored the plan, the worker may be allowed to or, in some cases, required to withdraw their DC plan account balance. For information on distribution rules from 401(k) plans, see http://www.irs.gov/Retirement-Plans/Plan-Participant,-Employee/401%28k%29-Resource-Guide—Plan-Participants—General-Distribution-Rules.
U.S. Household Savings for Retirement in 2010
Congressional Research Service 18
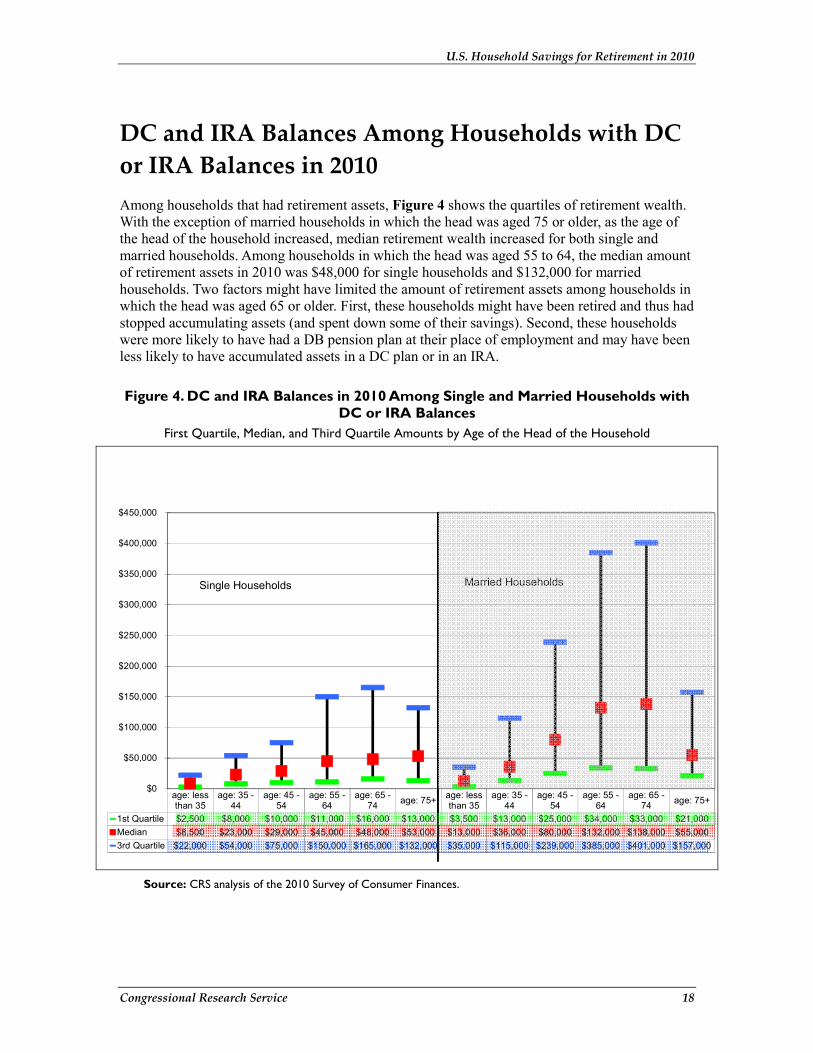
DC and IRA Balances Among Households with DC or IRA Balances in 2010 Among households that had retirement assets, Figure 4 shows the quartiles of retirement wealth. With the exception of married households in which the head was aged 75 or older, as the age of the head of the household increased, median retirement wealth increased for both single and married households. Among households in which the head was aged 55 to 64, the median amount of retirement assets in 2010 was $48,000 for single households and $132,000 for married households. Two factors might have limited the amount of retirement assets among households in which the head was aged 65 or older. First, these households might have been retired and thus had stopped accumulating assets (and spent down some of their savings). Second, these households were more likely to have had a DB pension plan at their place of employment and may have been less likely to have accumulated assets in a DC plan or in an IRA.
Figure 4. DC and IRA Balances in 2010 Among Single and Married Households with DC or IRA Balances
First Quartile, Median, and Third Quartile Amounts by Age of the Head of the Household
Source: CRS analysis of the 2010 Survey of Consumer Finances.
U.S. Household Savings for Retirement in 2010
Congressional Research Service 19
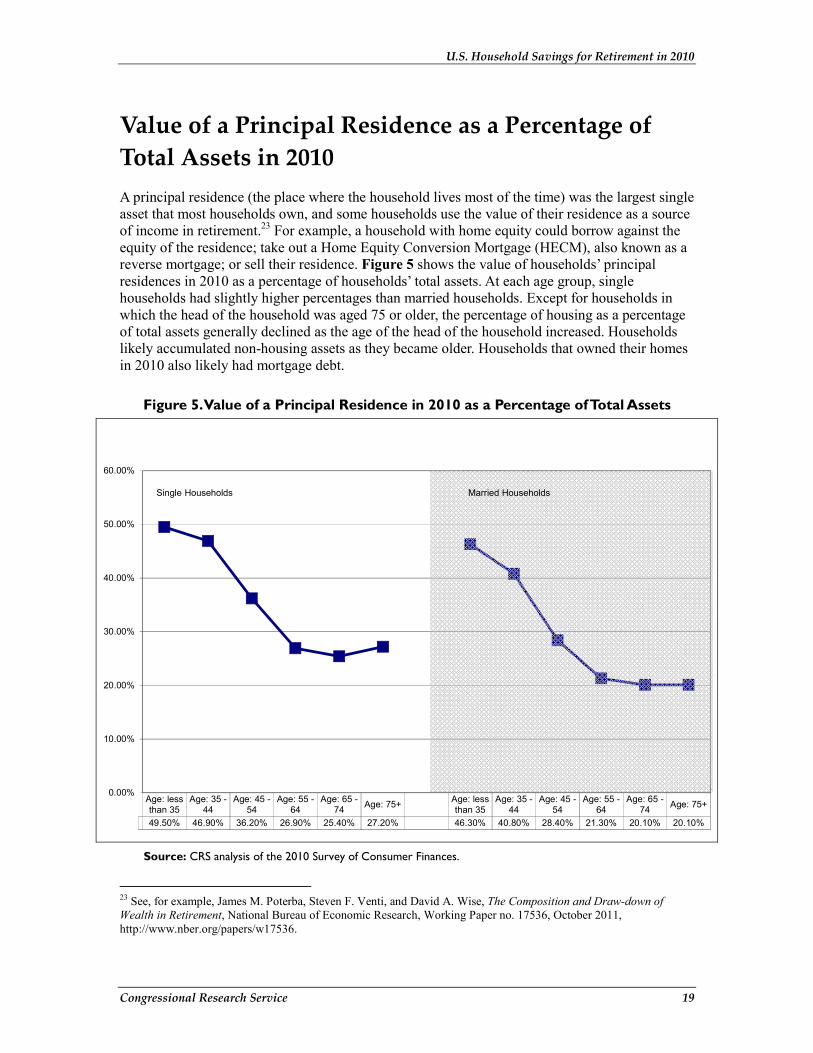
Value of a Principal Residence as a Percentage of Total Assets in 2010 A principal residence (the place where the household lives most of the time) was the largest single asset that most households own, and some households use the value of their residence as a source of income in retirement.23 For example, a household with home equity could borrow against the equity of the residence; take out a Home Equity Conversion Mortgage (HECM), also known as a reverse mortgage; or sell their residence. Figure 5 shows the value of households’ principal residences in 2010 as a percentage of households’ total assets. At each age group, single households had slightly higher percentages than married households. Except for households in which the head of the household was aged 75 or older, the percentage of housing as a percentage of total assets generally declined as the age of the head of the household increased. Households likely accumulated non-housing assets as they became older. Households that owned their homes in 2010 also likely had mortgage debt.
Figure 5. Value of a Principal Residence in 2010 as a Percentage of Total Assets
Source: CRS analysis of the 2010 Survey of Consumer Finances.
23 See, for example, James M. Poterba, Steven F. Venti, and David A. Wise, The Composition and Draw-down of Wealth in Retirement, National Bureau of Economic Research, Working Paper no. 17536, October 2011, http://www.nber.org/papers/w17536.
U.S. Household Savings for Retirement in 2010
Congressional Research Service 20
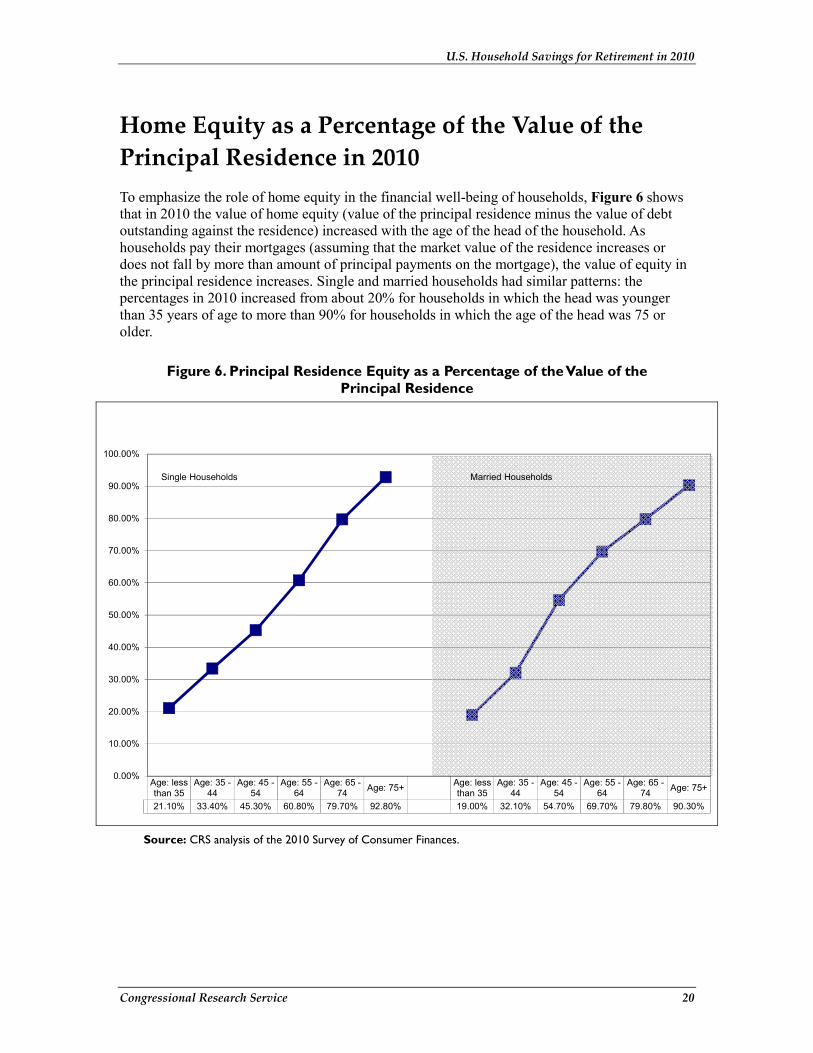
Home Equity as a Percentage of the Value of the Principal Residence in 2010 To emphasize the role of home equity in the financial well-being of households, Figure 6 shows that in 2010 the value of home equity (value of the principal residence minus the value of debt outstanding against the residence) increased with the age of the head of the household. As households pay their mortgages (assuming that the market value of the residence increases or does not fall by more than amount of principal payments on the mortgage), the value of equity in the principal residence increases. Single and married households had similar patterns: the percentages in 2010 increased from about 20% for households in which the head was younger than 35 years of age to more than 90% for households in which the age of the head was 75 or older.
Figure 6. Principal Residence Equity as a Percentage of the Value of the Principal Residence
Source: CRS analysis of the 2010 Survey of Consumer Finances.
U.S. Household Savings for Retirement in 2010
Congressional Research Service 21
Implications for Policy An analysis of the 2010 Survey of Consumer Finances (SCF) by CRS indicates that U.S. households owned $10.1 trillion in retirement assets (such as in 401(k) and 403(b) accounts and IRAs), which was 14.5% of all U.S. household assets in 2010. Across all age groups, because 49.6% of households did not have any retirement assets in 2010, the median amount of retirement assets in 2010 was $190; among the 50.4% of households that had retirement assets in 2010, the median amount of retirement assets was $44,000.
The CRS analysis indicates that
• among households that had retirement assets, the median amount of retirement assets was $44,000 and the average amount of assets was $178,859;
• among households that had DC pension plan assets, the median amount of assets was $31,000 and the average amount was $148,759; and
• among households that had IRAs, the median amount of IRA assets was $40,000 and the average amount was $148,759.
Although this report does not address whether households have sufficient resources from which to ensure an adequate standard of living in retirement, the data in this report highlight the importance of understanding the context in which decisions about saving for retirement occur. Some of the factors that might affect the accumulation of retirement assets include demographic characteristics of the household (e.g., age of the head of the household, marital status, number of children, if any); the financial situation of the household (e.g., ownership of other assets and the amount and type of household debt); and the employment situation of the household (e.g., whether employed, the worker’s participation in other retirement plans, and the amount of Social Security benefits the household expects to receive).24
Table 2 and Table 4 indicate that for households in which the head was younger than 65 years old, the average amount of most assets (including retirement assets) generally increased in 2010 as the age of the head of the household increased. Figure 1 shows that there was not a clear pattern in the percentage of wealth that retirement assets represented in 2010: the percentages neither increased nor decreased consistently as the age of the household increased.
Table 2 and Table 4 show that the average amount of retirement assets was generally higher for households in which the head of the household was closer to retirement age (age 55 to 64) than for households in which the head was younger than 55. Younger households have had fewer years in which to save and may prefer to save for needs other than retirement (such as the purchase of a home, unexpected events, or a child’s education). Table 2 and Table 4 also indicate that households in which the head of the household was aged 75 or older had fewer retirement assets in 2010 than households in which the head of the household was aged 55 to 64. These households (1) may have already made some withdrawals from their retirement accounts prior to the age of 75 or (2) were more likely to have income from a DB pension plan and thus may have had less
24 Most households participate in Social Security though some do not. For example, most federal civilian employees hired before 1984 and some state and local government workers are not covered by Social Security. Social Security coverage of state and local government workers varies by state.
U.S. Household Savings for Retirement in 2010
Congressional Research Service 22
need to rely on a DC pension or an IRA as a source of income in retirement. Figure 3 indicates that in 2010 households in which the head was younger than 55 years old were more likely to have a DC plan than an IRA or a DB plan.
In addition, household accumulation of retirement assets might be affected by ownership of other assets, such as businesses or real estate. Although relatively few households own business interests, the SCF indicates that 67.3% of households owned their principal residence. Whether households use assets such as businesses or real estate as a source of income in retirement might depend on several factors, such as a desire to remain in a home or a wish to leave a bequest. Analysis of the 2010 SCF showed that among households with children, 9.7% indicated that saving for their children or their estate was more important than saving for retirement.
U.S. Household Savings for Retirement in 2010
Congressional Research Service 23
Appendix. Survey of Consumer Finances For the data used in this report, The Congressional Research Service (CRS) examined the 2010 Survey of Consumer Finances (SCF). The SCF is a triennial survey conducted on behalf of the Board of Governors of the Federal Reserve. It contains detailed information on U.S. household finances, such as the amount and types of assets owned, the amount and types of debt owed, and detailed demographic information on the head of the household and spouse. Because many financial decisions are made jointly by the head of the household and spouse, the household is the unit of analysis in the SCF. For the purposes of the SCF, a household consists of the head of the household, a spouse or partner, and any dependent children.25
Wealth, as reported in the SCF, includes measurable financial wealth (such as bank accounts, stocks, and mutual funds) and measurable non-financial wealth (such as the value of real estate and businesses that households own). The data do not estimate wealth from Social Security and other annuities, which are important sources of income for many older households in retirement. Most households receive or will receive Social Security benefits and some households receive or will receive benefits from a defined benefit (DB) pension plan. Although this report does not estimate the value of wealth from Social Security or DB pensions, the presence of these annuitized sources of income in retirement may affect an individual’s financial decisions while working.26
The SCF consists of a sample of 6,492 households and is weighted so as to be representative of the population of 117.6 million U.S. households, of which 41.9% were single and 58.1% were married. The SCF oversamples wealthy households to ensure that the survey accurately portrays the ownership of assets in the United States. The Federal Reserve makes efforts to ensure that the data are of the highest possible quality and to minimize the errors that are common to household surveys, such as respondents not understanding their own finances.27
Data in this report are reported for all households in the United States and are not limited to working households. Retirement income adequacy is an important concern for both working and non-working households. In addition, many non-working households own retirement assets as a result of participation in a retirement plan while employed or as a result of ownership of an Individual Retirement Account (IRA). Future analysis may examine subsets of the population (such as only households in which at least the head of the household or spouse is working).
25 In the SCF, the head of the household is the individual in a single household, the male in a mixed-sex couple, or the older individual in the case of a same-sex couple. The SCF Codebook indicates that “no judgment about the internal organization of the households is implied by this organization of the data” and that the “term is euphemistic and merely reflects the systematic way in which the data set has been organized.” More information is available in the 2010 SCF Codebook, available at http://www.federalreserve.gov/econresdata/scf/scf_2010documentation.htm. 26 For example, the Social Security benefit formula is progressive, which means that the ratio of Social Security benefits to pre-retirement wages decreases as pre-retirement wages increase. See CRS Report R42035, Social Security Primer, by Dawn Nuschler. One implication is that households with lower earnings need fewer assets from which to replace pre-retirement income. 27 See Arthur B. Kennickell, Look and Listen, But Don’t Stop: Interviewers and Data Quality in the 2007 SCF, Federal Reserve Board, Washington, DC, October 2008, http://www.federalreserve.gov/econresdata/scf/files/asa20072.pdf.
U.S. Household Savings for Retirement in 2010
Congressional Research Service 24
Author Contact Information John J. Topoleski Analyst in Income Security [email protected], 7-2290