This work was supported by the Advanced Manufacturing Office of the U.S. Department of Energy’s Office of Energy Efficiency and Renewable Energy under Lawrence Berkeley National Laboratory Contract No. DE-AC02-05CH11231. Energy Technologies Area Lawrence Berkeley National Laboratory U.S. Industrial and Commercial Motor System Market Assessment Report Volume 1: Characteristics of the Installed Base Prakash Rao 1 , Paul Sheaffer 1 , Yuting Chen 1 , Miriam Goldberg 2 , Benjamin Jones 2 , Jeff Crop 3 , and Jordan Hester 3 1 Lawrence Berkeley National Laboratory 2 DNV GL 3 Cadmus January 2021 LBNL-2001382
Transcript
This work was supported by the Advanced Manufacturing Office of the U.S. Department of Energy’s Office of Energy Efficiency and Renewable Energy under Lawrence Berkeley National Laboratory Contract No. DE-AC02-05CH11231.
Energy Technologies AreaLawrence Berkeley National Laboratory
U.S. Industrial and Commercial Motor SystemMarket Assessment ReportVolume 1: Characteristics of the Installed Base
Prakash Rao1, Paul Sheaffer1, Yuting Chen1, Miriam Goldberg2, Benjamin Jones2, Jeff Crop3, and Jordan Hester31Lawrence Berkeley National Laboratory2DNV GL3Cadmus
January 2021
LBNL-2001382
ii
Disclaimer
This document was prepared as an account of work sponsored by the United States Government. While this document is believed to contain correct information, neither the United States Government nor any agency thereof, nor The Regents of the University of California, nor any of their employees, makes any warranty, express or implied, or assumes any legal responsibility for the accuracy, completeness, or usefulness of any information, apparatus, product, or process disclosed, or represents that its use would not infringe privately owned rights. Reference herein to any specific commercial product, process, or service by its trade name, trademark, manufacturer, or otherwise, does not necessarily constitute or imply its endorsement, recommendation, or favoring by the United States Government or any agency thereof, or The Regents of the University of California. The views and opinions of authors expressed herein do not necessarily state or reflect those of the United States Government or any agency thereof, or The Regents of the University of California.
Ernest Orlando Lawrence Berkeley National Laboratory is an equal opportunity employer.
Copyright
This manuscript has been authored by an author at Lawrence Berkeley National Laboratory under Contract No. DE-AC02-05CH11231 with the U.S. Department of Energy. The U.S. Government retains, and the publisher, by accepting the article for publication, acknowledges, that the U.S. Government retains a non-exclusive, paid-up, irrevocable, world-wide license to publish or reproduce the published form of this manuscript, or allow others to do so, for U.S. Government purposes.
iii
Prepared for the Advanced Manufacturing Office
Office of Energy Efficiency and Renewable Energy U.S. Department of Energy
Prakash Rao Paul Sheaffer Yuting Chen
Ernest Orlando Lawrence Berkeley National Laboratory
1 Cyclotron Road Berkeley, CA 94720
With contributions from
Miriam Goldberg and Benjamin Jones, DNV GL Jeff Cropp and Jordan Hester, Cadmus
January 2021
The work described in this study was funded by the Advanced Manufacturing Office of the U.S. Department of Energy’s Office of Energy Efficiency and Renewable Energy under Lawrence
Berkeley National Laboratory Contract No. DE-AC02-05CH11231
iv
Preface In the late 1990s, the U.S. Department of Energy (DOE) conducted two seminal studies to better understand the installed stock and energy savings opportunities of industrial and commercial motor systems: The United States Industrial Electric Motor Systems Market Opportunities Assessment (industrial sector) and Opportunities for Energy Savings in the Residential and Commercial Sectors with High Efficiency Electric Motors (commercial sector). In the more than 20 years since the publication of these reports, the U.S. industrial and commercial sectors have undergone changes, including facility and/or motor system stock turnover, offshoring and onshoring of manufacturing, passage of motor efficiency standards, cost reductions in motor driven systems, and more. To gain a more current understanding of motor systems in the U.S. industrial and commercial sectors, DOE initiated an update to these two studies. Launched in 2016 and led by Lawrence Berkeley National Laboratory (LBNL), the Motor System Market Assessment (MSMA) provides an updated, more comprehensive assessment of the installed stock of motor systems in both the industrial and commercial sectors, a review of the supply chains supporting motor and drives in the U.S., and the performance improvement opportunity available from using best available technologies and maintenance and operation practices. The outcomes of the MSMA are documented in three U.S. Industrial and Commercial Motor System Market Assessment reports, with this report being the first listed:
1. Volume 1: Characteristics of the Installed Base (this report) documents the findings on the installed base of motor systems in the U.S. industrial and commercial sectors. Quantification of energy savings potential is not documented in this report but in Volume 3.
2. Volume 2: Motors and Drives Supply Chain Review reviews the state of supply chains for motors and drives installed in U.S. industrial and commercial facilities, focusing on advanced motor and drive technologies and their constituent materials.
3. Volume 3: Energy Savings Opportunity analyzes the energy performance improvement opportunity for the installed base of U.S. industrial and commercial motor systems.
v
Acknowledgements This work was supported by the Assistant Secretary for Energy Efficiency and Renewable Energy, Advanced Manufacturing Office of the U.S. Department of Energy under Contract No. DE-AC02-05CH11231. The authors would like to thank the following individuals for their guidance and leadership: Allen Hefner, U.S. Department of Energy Advanced Manufacturing Office Paul Scheihing, U.S. Department of Energy Advanced Manufacturing Office (retired) Aimee McKane, Lawrence Berkeley National Laboratory (retired) The authors are grateful to the following individuals and their organizations for their reviews and valuable insights: Kirk Anderson, National Electrical Manufacturers Association Tom Bishop, Electrical Apparatus Service Association Rob Boteler, National Electrical Manufacturers Association Rolf Butters, U.S. Department of Energy Advanced Manufacturing Office R. Neal Elliot, Ph.D., P.E., American Council for an Energy-Efficient Economy Peter Gaydon, Hydraulic Institute Michael Ivanovich, Air Movement and Control Association Edward G. Rightor, Ph.D., American Council for an Energy-Efficient Economy Ethan Rogers, U.S. Department of Energy Advanced Manufacturing Office Additionally, the authors would like to thank the many people across several organizations that helped execute the Motor System Market Assessment: Christie Amero and Aaron Huston of Cadmus, Zach Podell-Eberhardt of Cascade Energy, Mike Witt and Christina Robichaud of DNV GL, and Anna D’Alessio, Steve Greenberg, Phil Price, and Darren Sholes of Lawrence Berkeley National Laboratory.
vi
List of Acronyms and Abbreviations AC Alternating current ASD Adjustable speed drive Beverage/Tobacco Beverage and tobacco products CBECS Energy Information Agency’s Commercial Building Energy
Consumption Survey CBP County business patterns CFM Cubic feet per minute Chemical Chemicals CI Confidence interval CIP Cleaning in place Computer/Electronic Computer and electronic products COP Coefficient of performance DC Direct current DOE United States Department of Energy EDU Education EIA Energy Information Administration Electrical Equipment Electrical equipment and appliances EMW Electric master weight Fabricated Metal Fabricated metal products Food Food products FSA Food sales FSE – Food service Food service Furniture Furniture and related products GPM Gallons per minute GWh Gigawatt-hour HCI Health care: Inpatient HCO Health care: Outpatient HP Horsepower HVAC Heating, ventilation and air-conditioning IN-Hg Inches mercury In-Wg Inches water gauge IQ Interquartile range ISO International Organization for Standardization kWh Kilowatt-hour LBNL Lawrence Berkeley National Laboratory LCL Lower confidence limit Leather Leather and allied products LEED Leadership in Energy and Environmental Design LOD Lodging (includes Nursing) MECS Energy Information Agency’s Manufacturing Energy
Consumption Survey MEM Mercantile: Enclosed and Strip Malls MER Mercantile: retail () MPU Mean-per-unit
vii
MSMA Motor System Market Assessment N/A Not applicable NAICS North American Industry Classification System NEMA National Electrical Manufacturers Association OFF Office OTH Other and vacant Paper Paper and allied products PAS Public assembly Petroleum Refining Petroleum and coal products Plastic/Rubber Plastic and rubber products POS Public order and safety Primary Metal: Iron/Steel Primary metal: Iron and steel mills and ferroalloy manufacturing Primary Metal: Other Primary metals: other Printing Printing and related support PSIG Pounds per square in gauge PSU Primary sampling units REW Religious worship RPM Rotations per minute RSE Relative standard error RWSN Ratio weight site to national SER Service SIC Standard industrial classification Textile Mill Textile mills Textile Product Textile product mills Transportation Transportation equipment TWh Terawatt-hour UCL Upper confidence limit UTC Unable to collect VFD Variable frequency drives WAS Warehouse and storage Wastewater Municipal wastewater treatment Wood Wood products WCMS Combined motor to site weight WFMN Final motor to national weight WFMS Final motor to site weight WMS Preliminary motor to site weight WSN Site to national weight
viii
Executive Summary Motor-driven systems are ubiquitous, operating in virtually every industrial site and commercial building. These motors consume close to one-third of all the electricity in the United States and are vital to the U.S. economy. Lawrence Berkeley National Laboratory, under the direction of the U.S. Department of Energy’s Advanced Manufacturing Office, conducted a multiyear research project to study motor systems in the industrial and commercial building sectors. This report is Volume 1 of the results, showing an inventory of the installed base of electric motor systems in the industrial and commercial building sectors and their operating characteristics. Background and Motivation A lack of sufficient data is a major barrier to effective decision making that will help to capture the energy savings potential in motor systems. Prior to the release of this report, there was no information on the current state of motor driven systems in U.S. industrial and commercial facilities. This limited the ability to conduct analysis on energy savings potential, develop technologies to address energy and productivity gaps, and develop programs to promote energy efficiency. Findings Key findings on the installed base of motors and their operating characteristics are summarized below. Installed Base. The installed base key findings show total electricity consumption and motor system counts by subsector, driven equipment, and system size range. Motor system electricity consumption
• Industrial and commercial three-phase motor systems greater than or equal to 1 horsepower (hp) consume ~1,079 terawatt-hours (TWh)/year, about 29 percent of the total electric grid load.
o Industrial: 546,963 gigawatt-hours (GWh), about 69 percent of all electricity consumption and 13 percent of overall energy consumption in the sector.
o Commercial: 532,016 GWh, about 43 percent of all electricity consumption and 26 percent of overall energy consumption in the sector.
• Sixty-two percent of the industrial sector’s estimated annual motor system electricity consumption resides in the top six subsectors, with the Chemicals subsector (106,000 GWh) being the largest.
• Twenty-nine percent of all industrial sector motor system electricity consumption is for materials processing, followed by 21 percent for pumps and fans/blowers each.
• Seventy-five percent of industrial motor system electricity consumption is attributed to 1-500 hp motor systems.
• Seventy percent of the commercial sector’s estimated annual motor system electricity consumption resides in the top seven subsectors, with the Office subsector (93,334 GWh) being the largest.
ix
• Forty-eight percent of all commercial sector motor system electricity consumption is for refrigeration compressors (e.g., chillers, air conditioners). Refrigeration compressors, fans/blowers, and pumps account for 94 percent of the sector’s motor system electricity consumption.
• Eighty percent of commercial sector motor system electricity consumption is attributed to the 1-50 hp size range.
Motor system counts and size
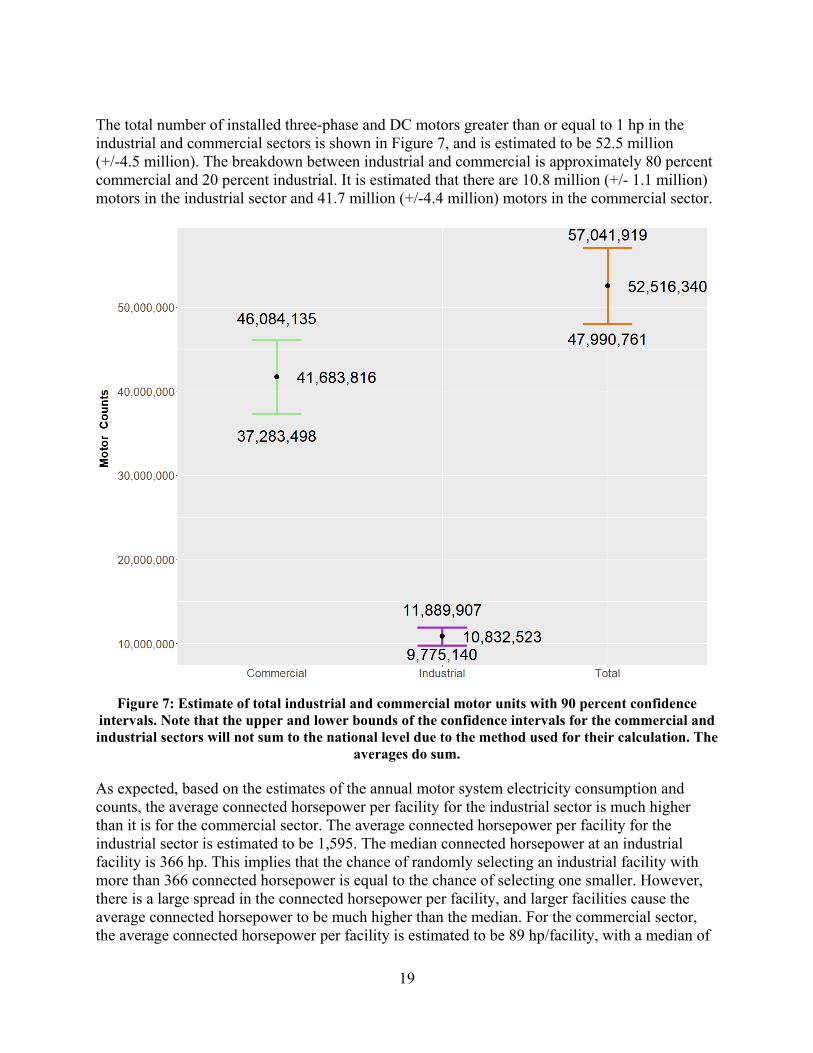
• There are 52.5 million motor systems greater than or equal to 1 hp in the industrial and commercial sectors, with 10.8 million in industrial and 41.7 million in commercial facilities.
• The average connected motor system horsepower at a facility is 1,595 hp for the industrial sector and 89 hp for the commercial sector.
• Average motor size is 27 hp for industrial and 8 hp for commercial. • Sixty-two percent of the industrial sector’s estimated motor system units reside in the top
six subsectors, with Machinery (2 million) accounting for the most. • Seventy-four percent of the commercial sector’s estimated motor system units reside in
the top seven subsectors, with the Mercantile: Enclosed and Strip Malls subsector (6.3 million) accounting for the most units.
• Ninety-nine percent of the motor system units in the industrial sector are in the 1-500 hp range, with 49 percent in the 1-5 hp range.
• Ninety-nine percent of the motor system units in the commercial sector are in the 1-50 hp size range.
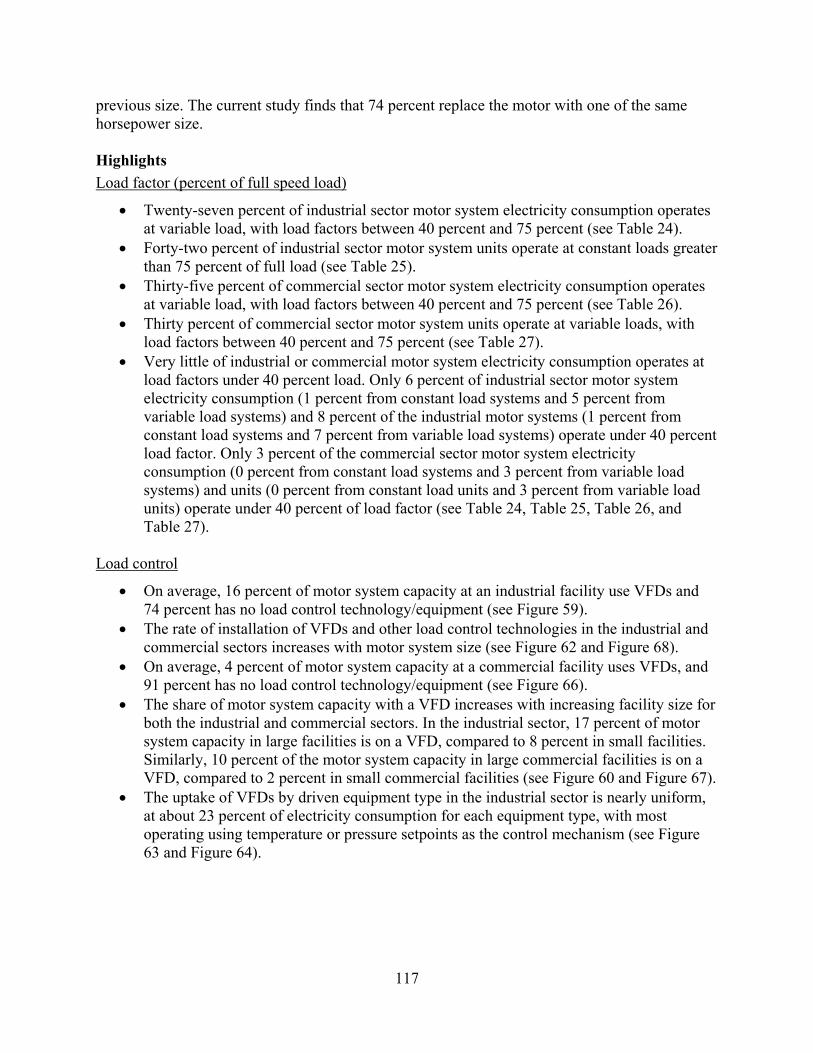
Operating Characteristics. This section summarizes findings related to operating characteristics of industrial and commercial motor systems; specifically, findings related to load factor, load control, and transmission type. Additionally, findings related to energy management and maintenance practices are also summarized. Load factor (percent of full speed load)
• Twenty-seven percent of industrial sector motor system electricity consumption operates at variable load, with load factors between 40 percent and 75 percent.
• Forty-two percent of industrial sector motor system units operate at constant loads greater than 75 percent of full load.
• Thirty-five percent of commercial sector motor system electricity consumption operates at variable load, with load factors between 40 percent and 75 percent.
• Thirty percent of commercial sector motor system units operate at variable loads, with load factors between 40 percent and 75 percent.
• Very little of industrial or commercial motor system electricity consumption operates at load factors under 40 percent load. Only 6 percent of industrial sector motor system electricity consumption, and 8 percent of the industrial motor systems operate under 40 percent load factor.
• Only 3 percent of the commercial sector motor system electricity consumption operates under 40 percent of load factor.
x
Load control • On average, 16 percent of motor system capacity at an industrial facility uses variable
frequency drives (VFDs), and 74 percent has no load control technology/equipment. • The rate of installation of VFDs and other load control technologies in the industrial and
commercial sectors increases with motor system size. • On average, 4 percent of motor system capacity at a commercial facility uses VFDs, and
91 percent has no load control technology/equipment. • The share of motor system capacity with a VFD increases with increasing facility size for
both the industrial and commercial sectors. In the industrial sector, 17 percent of motor system capacity in large facilities is on a VFD compared to 8 percent in small facilities. Similarly, 10 percent of the motor system capacity in large commercial facilities is on a VFD, compared to 2 percent in small commercial facilities.
• The uptake of VFDs by driven equipment type in the industrial sector is nearly uniform, at about 23 percent of electricity consumption for each equipment type, with most operating using temperature or pressure setpoints as the control mechanism.
• The uptake of VFDs by driven equipment type in the commercial sector varies, but is highest for fan/blower systems with the most common metric for VFD control being pressure setpoint.
Transmission type
• Thirty-four percent of industrial sector motor systems and 44 percent of commercial sector motor systems use direct drive transmission to convey motor shaft power to the end-use equipment. Direct drive is the most common transmission type observed across both sectors.
Motor system energy management
• Forty-nine percent of industrial facilities consider energy efficiency in the procurement of motor system components, and 58 percent consider energy efficiency in the design of new motor systems.
• Large industrial facilities are more likely to consider energy efficiency in the procurement and design of motor systems and related components compared to small facilities.
• Fifty-nine percent of commercial facilities consider energy efficiency in the procurement of motor system components, and 67 percent consider energy efficiency in the design of new motor systems.
• Large commercial facilities are less likely to consider energy efficiency in the procurement and/or design of motor systems and related components compared to small facilities
• Across all industrial facilities, external energy assessments were the most common method for identifying energy efficiency measures, with 59 percent utilizing external assessors.
• Thirteen percent of industrial facilities and 18 percent of commercial facilities had an inventory of all their motors, spare and connected.
xi
Motor system maintenance
• It is estimated that commercial and industrial facilities experience more than 8 million and 6 million hours annually of unplanned motor system downtime, respectively, due to failure.
• On average, a commercial facility experiences three hours of unplanned motor system downtime due to failure per year, and an industrial facility experiences 47 hours per year.
• In the industrial sector, 54 percent of all facilities have a repair/replace policy, with the leading criteria guiding the policy being lowest first cost, which is used by 36 percent of facilities.
• Four percent of industrial motors were rewound over the past two years. • In the commercial sector, 16 percent of all facilities have a repair/replace policy. Most
facilities were unaware of the criteria underpinning the policy. The most commonly cited criteria guiding the policy are lowest first cost (11 percent) and quickest option (10 percent).
• Less than 1 percent of commercial motors were rewound over the past two years.
xii
Table of Contents Preface ........................................................................................................................................... iv
Acknowledgements .......................................................................................................................... v
List of Acronyms and Abbreviations ............................................................................................ vi Executive Summary .................................................................................................................... viii List of Figures ............................................................................................................................. xiv
List of Tables ............................................................................................................................. xviii Background and Motivation .......................................................................................................... 1
Installed base characteristics .................................................................................................. 18 Overall industrial and commercial ...................................................................................................................... 18 Industrial sector breakdown by facility type ....................................................................................................... 20 Commercial sector breakdown by facility type .................................................................................................. 27 Driven equipment breakdown ............................................................................................................................. 36 Motor system size breakdown ............................................................................................................................ 55 DC motor system demographics ......................................................................................................................... 61 Motor age ............................................................................................................................................................ 67 Comparison to previous report ............................................................................................................................ 68 Highlights ........................................................................................................................................................... 71
Operating characteristics ....................................................................................................... 73 Motor load factor ................................................................................................................................................ 73 Load control ........................................................................................................................................................ 83 Transmission type ............................................................................................................................................... 99 Energy management practices .......................................................................................................................... 103 Maintenance practices ....................................................................................................................................... 108 Comparison to previous report .......................................................................................................................... 116 Highlights ......................................................................................................................................................... 117
Construction of weights ........................................................................................................ B-1 Basic weights .................................................................................................................................................... B-1
Ratio estimation expansion ................................................................................................... B-5 Basic ratio estimator ......................................................................................................................................... B-5
Applying the weights: Direct expansion .............................................................................. B-8 Direct expansion for non-count variables ......................................................................................................... B-8 National totals directly from the motor-record data .......................................................................................... B-9
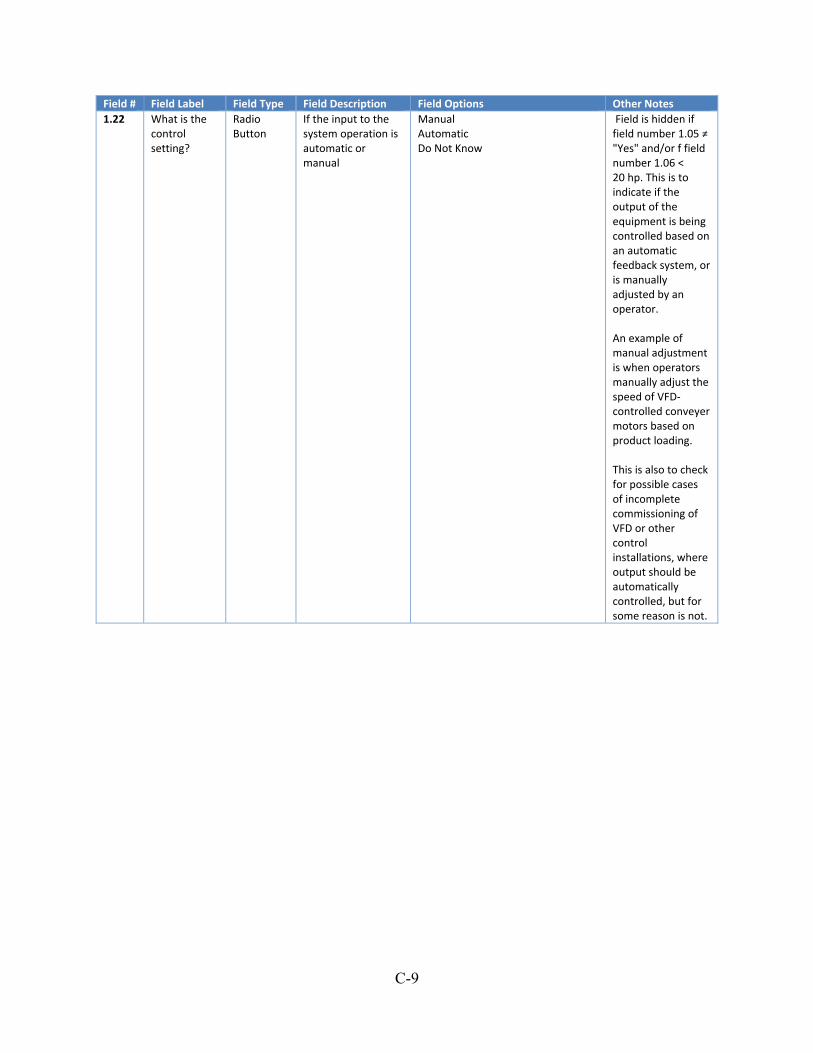
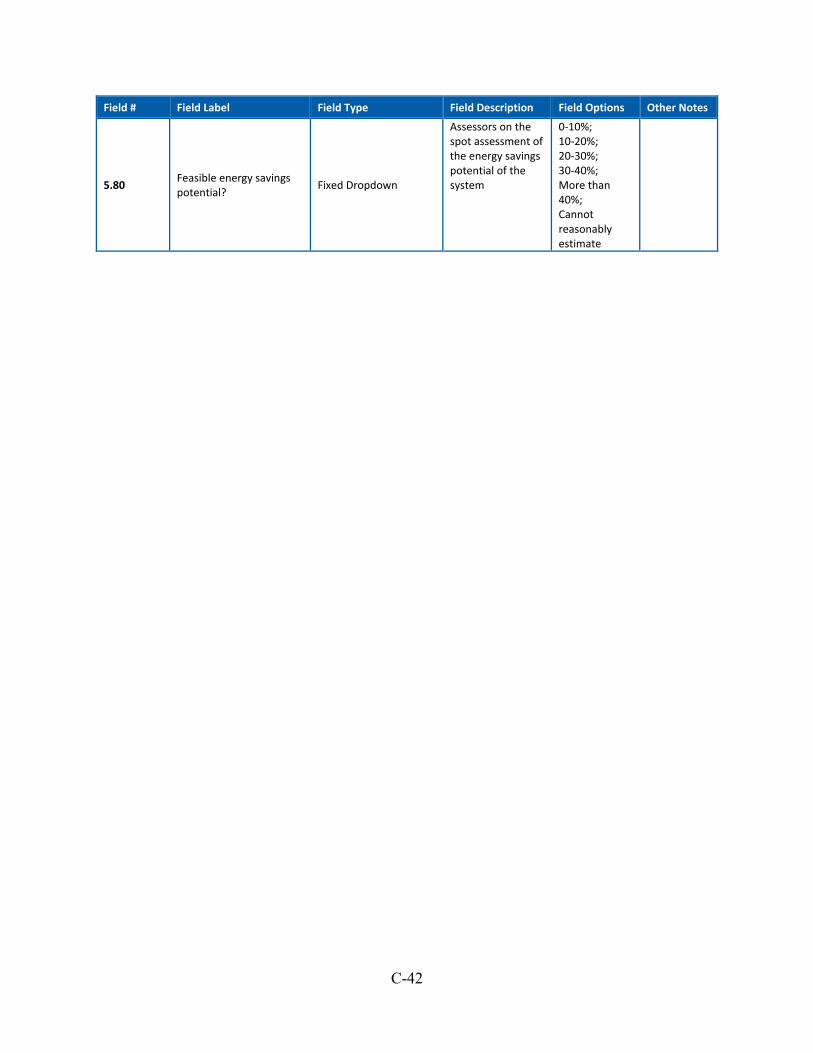
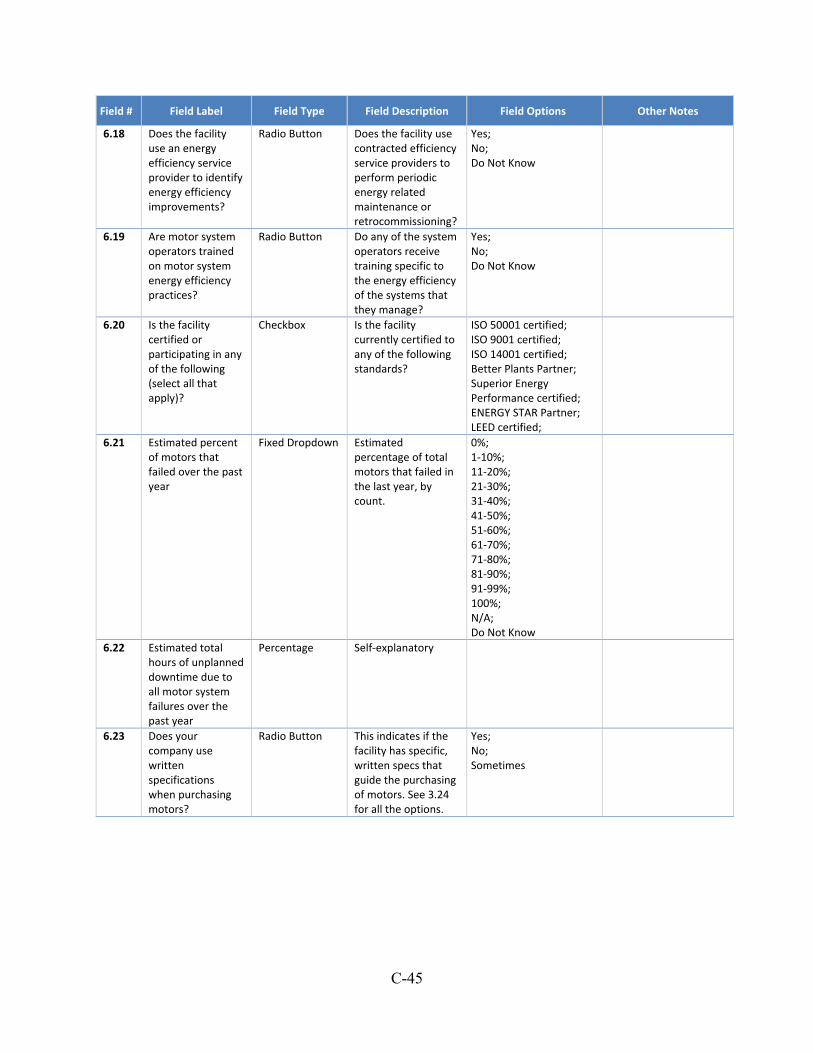
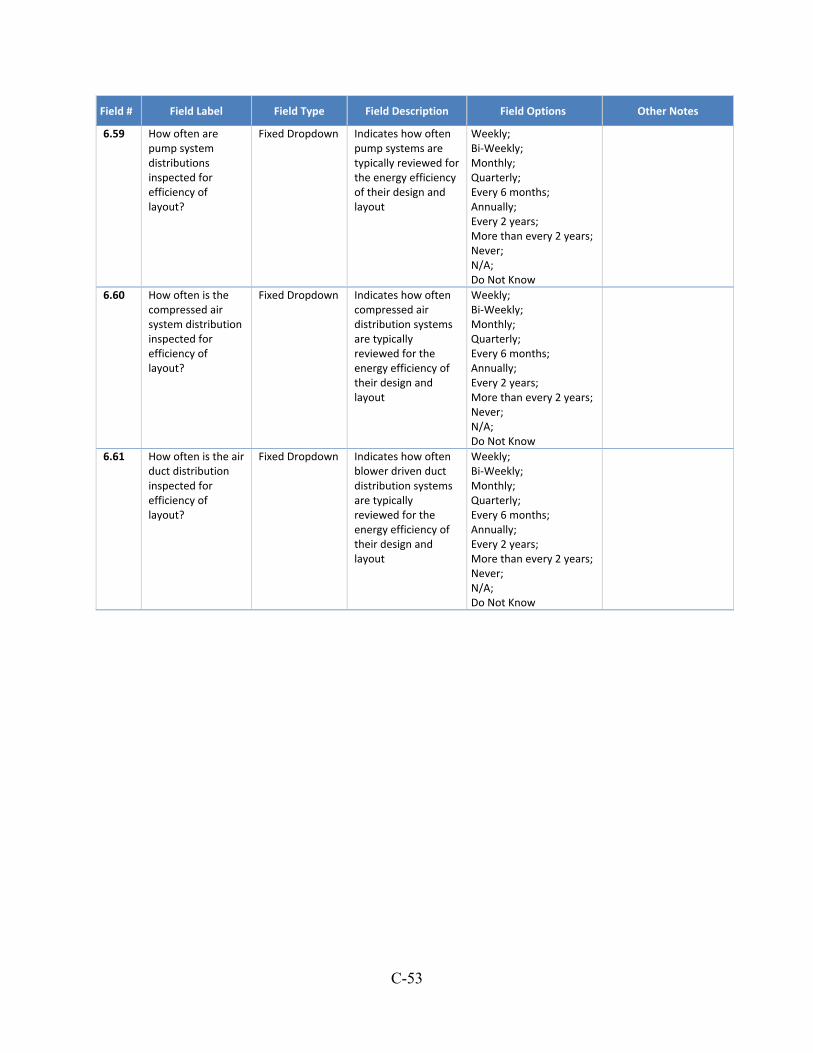
Facility general motor practices questions ........................................................................ C-43
xiv
List of Figures Figure 1: Final sample allocation for industrial assessments. The numbers on the figures indicate
the number of samples conducted within each facility size category per subsector. Size categories with no number had one sample completed. ............................................................. 9
Figure 2: Final sample allocation for commercial assessments. Consult the List of Acronyms and Abbreviations for the full name of each subsector. The numbers on the figures indicate the number of samples conducted within each facility size category per subsector. Size categories with no number had one sample completed. .............................................................................. 9
Figure 3: Motor weights calculation flowchart ............................................................................. 12 Figure 4: Legibility of nameplates on motors assessed: commercial (L) and industrial (R) ........ 16 Figure 5: Guide to reading box plots ............................................................................................ 17 Figure 6: Estimates of total industrial and commercial motor system annual electricity
consumption with 90 percent confidence intervals. Note that the upper and lower bounds of the confidence intervals for the commercial and industrial sectors will not sum to the national level due to the method used for their calculation. The averages do sum. .............................. 18
Figure 7: Estimate of total industrial and commercial motor units with 90 percent confidence intervals. Note that the upper and lower bounds of the confidence intervals for the commercial and industrial sectors will not sum to the national level due to the method used for their calculation. The averages do sum. ........................................................................................... 19
Figure 8: Distribution of facility total connected hp for the industrial and commercial sectors. Please refer to Figure 5 for guidance on interpreting the box plots. ........................................ 20
Figure 9: Total industrial motor system annual electricity consumption by subsector with 90 percent confidence intervals ..................................................................................................... 21
Figure 10: Motor counts by industrial subsector with 90 percent confidence intervals ............... 23 Figure 11: Share of industrial motor system counts and electricity consumption by industrial
subsector. The Balance of Subsectors category includes: Electrical Equipment, Furniture, Leather, Miscellaneous, and Textile Product. .......................................................................... 25
Figure 12: Distribution of facility total connected hp by industrial subsector. Please refer to Figure 5 for guidance on interpreting the box plots. ............................................................... 26
Figure 13: Total industrial annual motor system electricity consumption by facility size ........... 28 Figure 14: Total industrial motor system count by facility size ................................................... 28 Figure 15: Total commercial motor system annual electricity consumption by subsector with 90
percent confidence intervals ..................................................................................................... 29 Figure 16: Motor counts by commercial subsector with 90 percent confidence intervals ........... 31 Figure 17: Distribution of facility total connected hp by commercial subsector. The inset graph
rescales the data by removing the Health Care: Inpatient subsector, allowing for the values of other subsectors to be more readily read. Please refer to Figure 5 for guidance on interpreting the box plots. ............................................................................................................................ 33
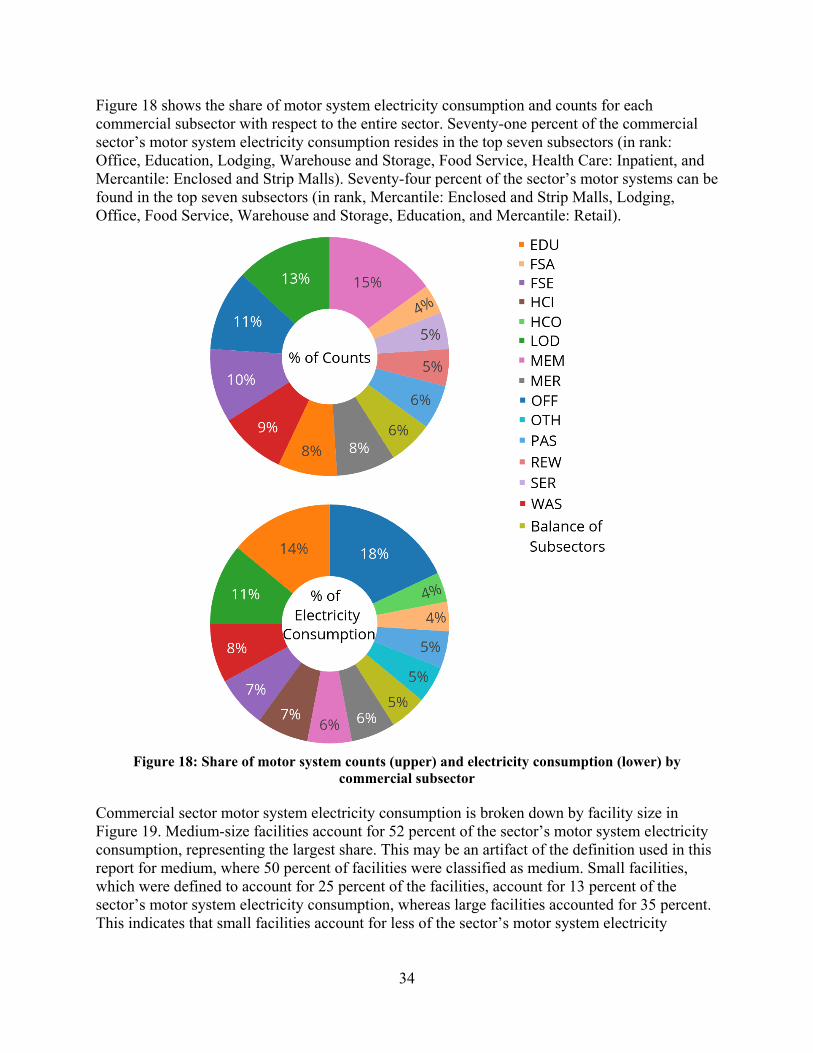
Figure 18: Share of motor system electricity consumption and counts by commercial subsector 34 Figure 19: Commercial sector motor system annual electricity consumption by facility size ..... 35 Figure 20: Commercial sector motor system counts by facility size ............................................ 36 Figure 21: Industrial motor system annual electricity consumption by driven equipment. UTC
indicates that the equipment driven by the motor could not be identified. .............................. 37 Figure 22: Share of motor system electricity consumption by driven equipment and technology
type for the industrial sector ..................................................................................................... 38
xv
Figure 23: Breakdown of industrial motor counts by driven equipment ...................................... 40 Figure 24: Share of motor system units by driven equipment and technology type for the
industrial sector ........................................................................................................................ 41 Figure 25: Distribution of driven equipment size within the industrial sector. Please refer to
Figure 5 for guidance on interpreting box plots. ...................................................................... 42 Figure 26: Distribution of annual run hours by driven equipment for the industrial sector, Please
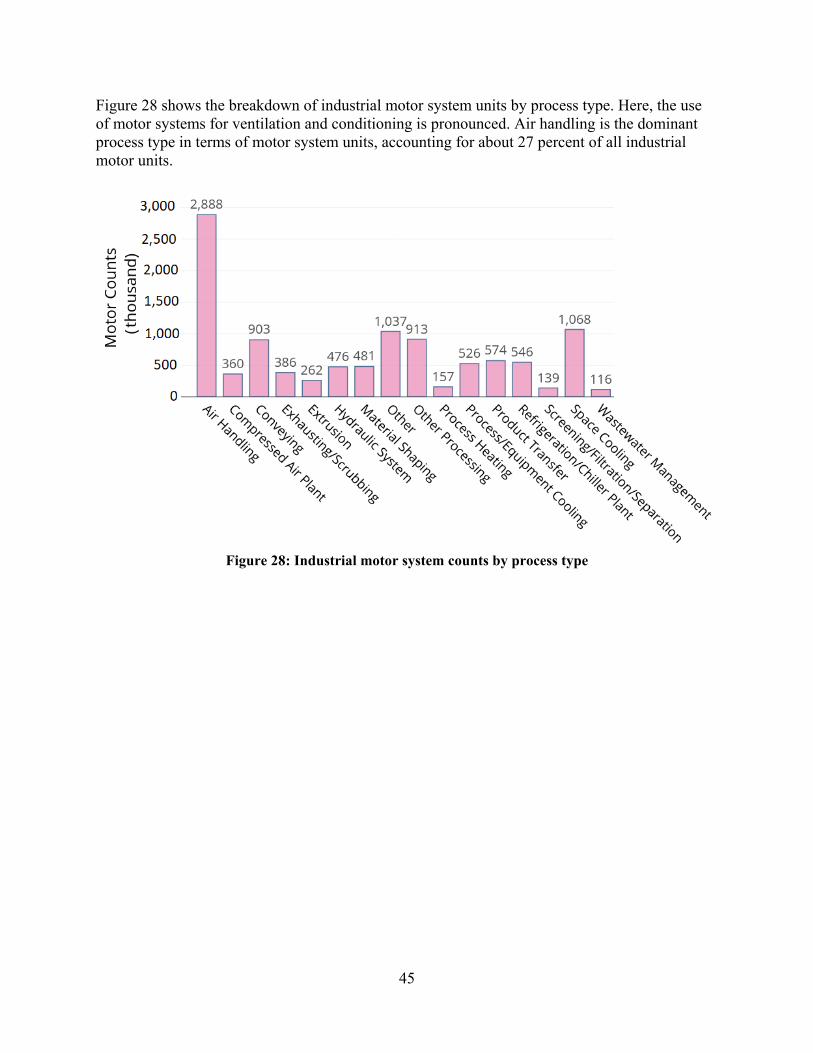
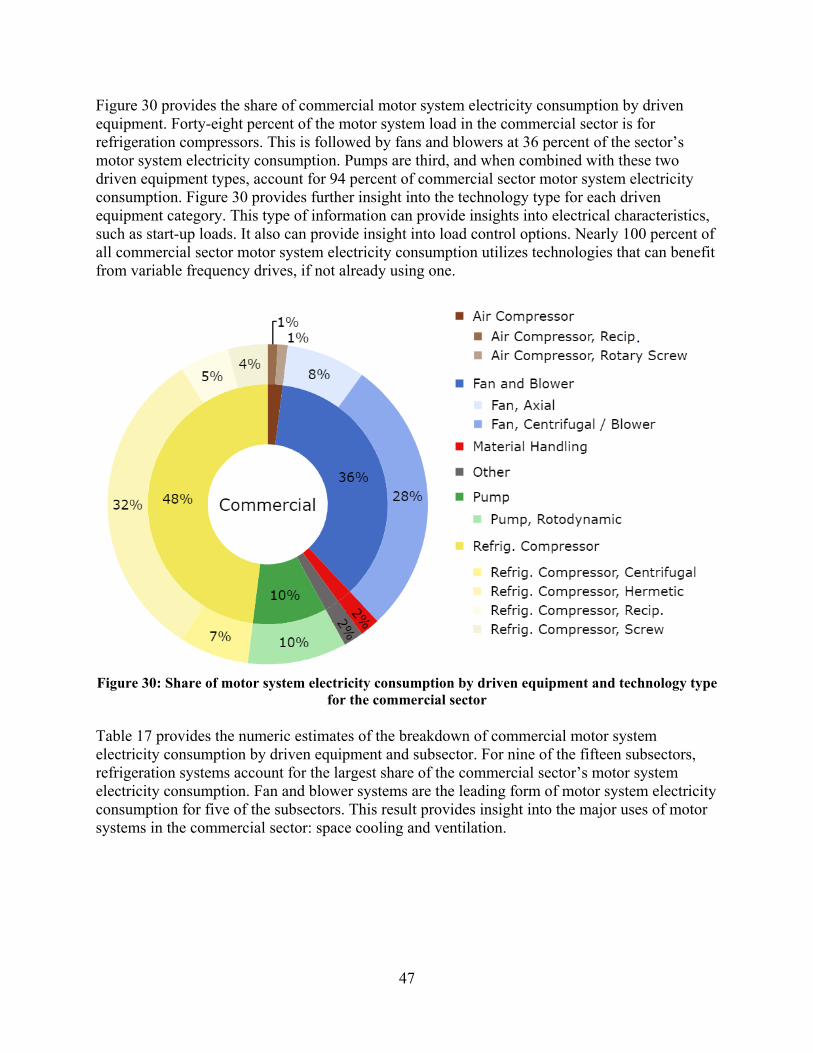
refer to Figure 5 for guidance on interpreting box plots. ......................................................... 42 Figure 27: Industrial motor system annual electricity consumption by process type ................... 44 Figure 28: Industrial motor system counts by process type .......................................................... 45 Figure 29: Commercial motor system annual electricity consumption by driven equipment ...... 46 Figure 30: Share of motor system electricity consumption by driven equipment and technology
type for the commercial sector ................................................................................................. 47 Figure 31: Breakdown of commercial motor counts by driven equipment .................................. 49 Figure 32: Share of motor system units by driven equipment and technology type for the
commercial sector .................................................................................................................... 50 Figure 33: Distribution of driven equipment size within the commercial sector ......................... 51 Figure 34: Distribution of annual run hours by driven equipment for the commercial sector ..... 52 Figure 35: Commercial sector motor system annual electricity consumption by process type .... 54 Figure 36: Commercial motor system counts by process type ..................................................... 55 Figure 37: Industrial motor system annual electricity consumption by size category .................. 56 Figure 38: Industrial motor system count by size category .......................................................... 57 Figure 39: Distribution of annual run hours for industrial motor systems by size category. See
Figure 5 for guidance on interpreting the box plots. ................................................................ 58 Figure 40: Commercial motor system annual electricity consumption by size category ............. 59 Figure 41: Commercial motor system counts by size category .................................................... 59 Figure 42: Distribution of annual run hours for commercial motor systems by size category. See
Figure 5 for guidance on interpreting the box plots. ................................................................ 60 Figure 43: DC motor system annual electricity consumption in the industrial sector .................. 61 Figure 44: DC motor system counts in the industrial sector ......................................................... 62 Figure 45: DC motor system electricity consumption by end use application for the industrial
sector ........................................................................................................................................ 62 Figure 46: DC motor system counts by end use application for the industrial sector .................. 63 Figure 47: DC motor system annual electricity consumption by subsector in the commercial
sector. Subsectors with no estimated DC motor system electricity consumption have been omitted. These are: EDU, FSA, FSE, LOD, MEM, MER, POS, REW, SER, and WAS. ....... 64
Figure 48: DC motor system counts in the commercial sector by subsector. Subsectors with no observed DC motor systems have been omitted. These are: EDU, FSA, FSE, LOD, MEM, MER, POS, REW, SER, and WAS. ......................................................................................... 65
Figure 49: DC motor system electricity consumption by end use application for the commercial sector .................................................................................................................... 66
Figure 50: DC motor system counts by end use application for the commercial sector .............. 66 Figure 51: Age of industrial motor systems broken down by size. Compared to Figure 4, UTC in
this figure includes UTC, illegible nameplates, and some nameplates that were legible but the age still could not be determined. ............................................................................................ 67
Figure 52: Age of commercial motor systems broken down by size ............................................ 68
xvi
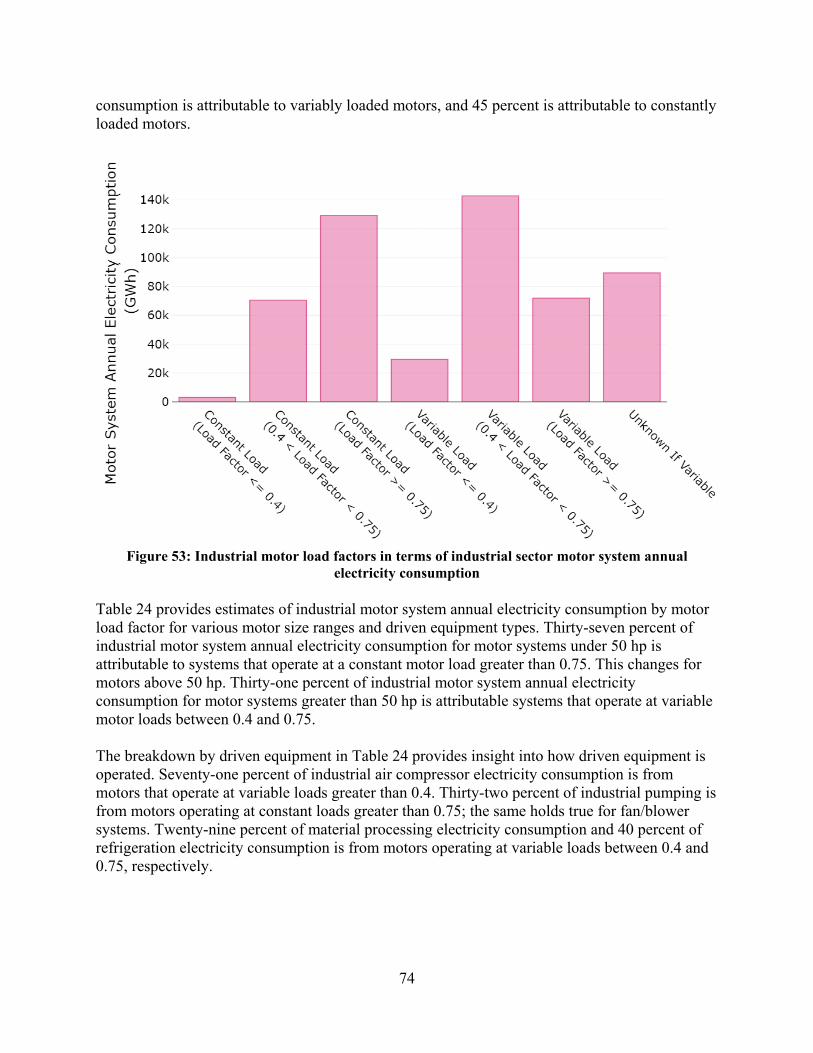
Figure 53: Industrial motor load factors in terms of industrial sector motor system annual electricity consumption ............................................................................................................ 74
Figure 54: Motor load factor for industrial sector motor systems (number of units) ................... 76 Figure 55: Average motor load factor for industrial sector motor systems by size ...................... 78 Figure 56: Motor load factors for commercial sector motor system annual electricity
consumption ............................................................................................................................. 79 Figure 57: Motor load factor for commercial sector motor systems (number of units) ............... 81 Figure 58: Average motor load factor for commercial sector motor systems by size .................. 83 Figure 59: Penetration rates of VFDs and other load control technologies by industrial subsector.
See Figure 12 for the distribution of connect hp per facility for the industrial subsectors. Annotations show the corresponding percent for each segment for shares greater than 5%. . 85
Figure 60: Penetration rates of VFDs and other load control technologies by industrial facility size ........................................................................................................................................... 86
Figure 61: Penetration rates of VFDs and other control technologies by motor size in terms of percentage of industrial motor system annual electricity consumption. See Figure 12 for the distribution of connect hp per facility for the industrial subsectors. Annotations show the corresponding percent for each segment for shares greater than 5%. ...................................... 87
Figure 62: Penetration rates of VFDs and other control technologies by motor size in terms of percentage of industrial motor system counts. See Figure 12 for the distribution of connect hp per facility for the industrial subsectors. Annotations show the corresponding percent for each segment for shares greater than 5%. ........................................................................................ 88
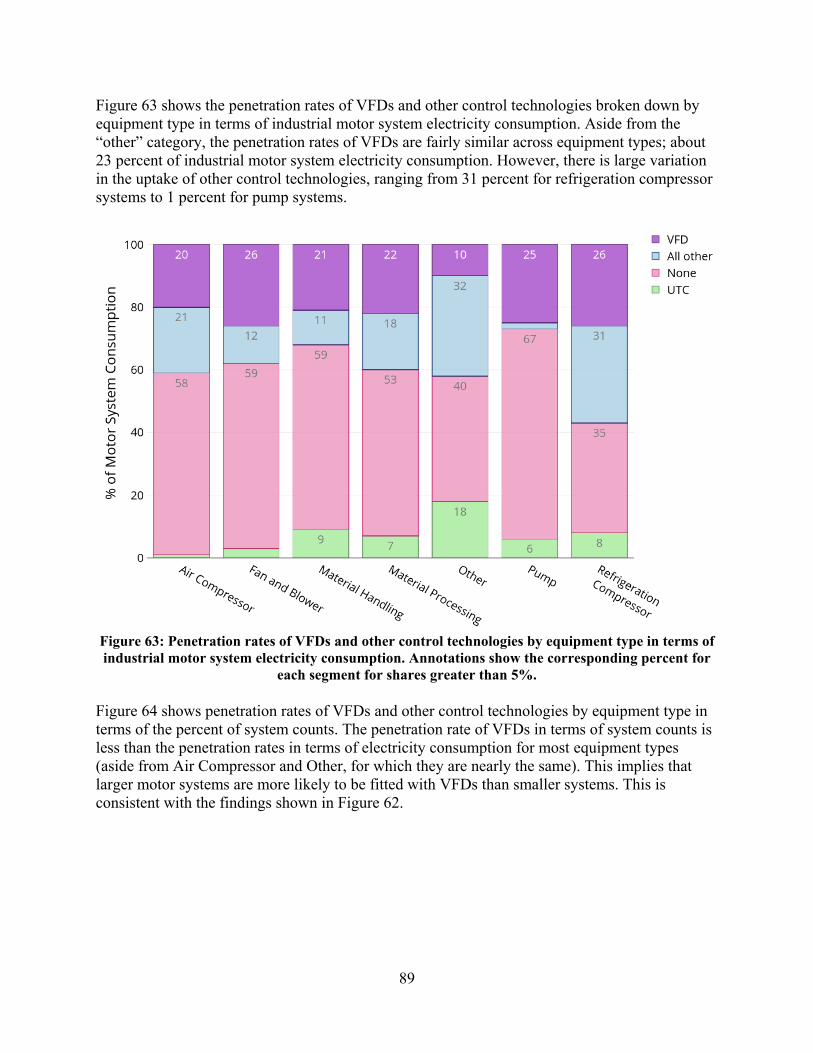
Figure 63: Penetration rates of VFDs and other control technologies by equipment type in terms of industrial motor system electricity consumption ................................................................. 89
Figure 64: Penetration rates of VFDs and other control technologies by equipment type in terms of industrial motor system counts ............................................................................................ 90
Figure 65: VFD control feedback for industrial air compressors, fans, pumps, and refrigeration compressors as a percentage of system counts ....................................................................... 91
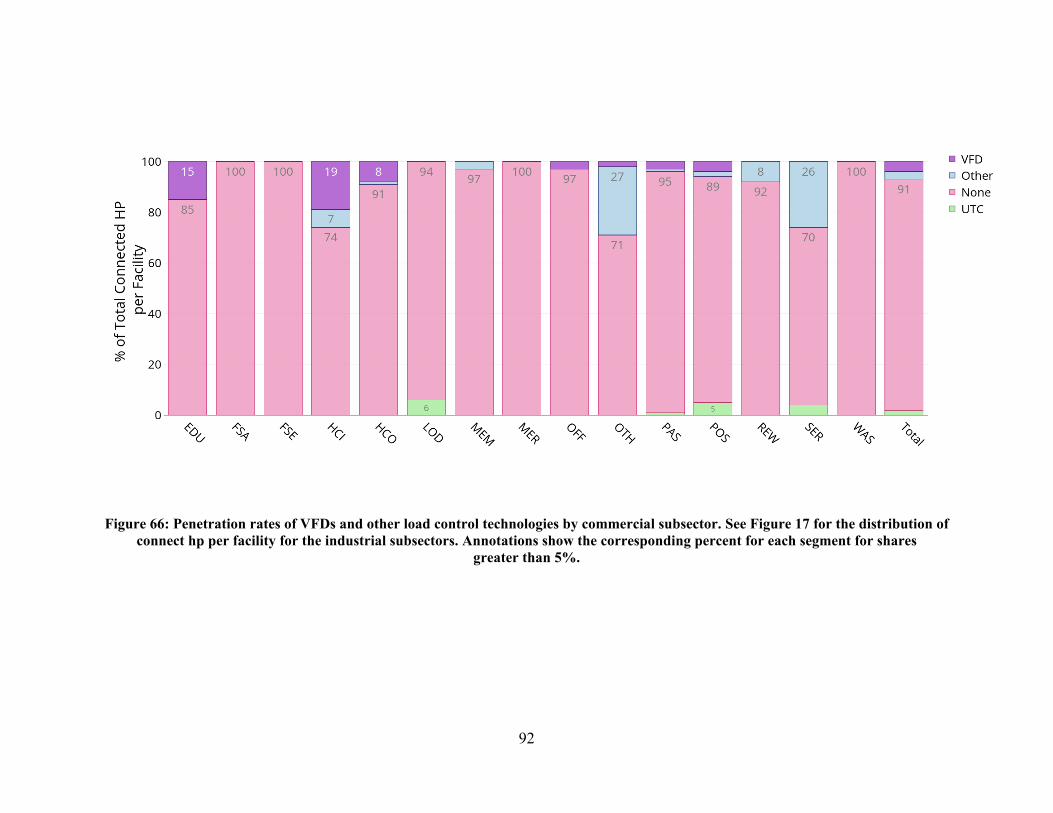
Figure 66: Penetration rates of VFDs and other load control technologies by commercial subsector. See Figure 17 for the distribution of connect hp per facility for the industrial subsectors. Annotations show the corresponding percent for each segment for shares greater than 5%. ................................................................................................................................... 92
Figure 67: Penetration rates of VFDs and other load control technologies by commercial facility size. Annotations show the corresponding percent for each segment for shares greater than 5%. ........................................................................................................................................... 93
Figure 68: Penetration rates of VFDs and other control technologies by motor size in terms of percentage of commercial sector motor system electricity consumption. Annotations show the corresponding percent for each segment for shares greater than 5%. ...................................... 94
Figure 69: Penetration rates of VFDs and other control technologies by motor size in terms of percentage of commercial motor system count. Annotations show the corresponding percent for each segment for shares greater than 5%. .......................................................................... 94
Figure 70: Penetration rates of VFDs and other control technologies by equipment type in terms of commercial sector motor system electricity consumption. Annotations show the corresponding percent for each segment for shares greater than 5%. ...................................... 96
Figure 71: Penetration rates of VFDs and other control technologies by equipment type in terms of commercial motor system counts. Annotations show the corresponding percent for each segment for shares greater than 5%. ........................................................................................ 97
xvii
Figure 72: VFD control feedback for commercial air compressors, fans, pumps, and refrigeration compressor ............................................................................................................................... 98
Figure 73: Transmission type for industrial motor systems by electricity consumption (l) and counts (r) ........................................................................................................................... 99
Figure 74: Breakdown of transmission type by driven equipment in the industrial sector. Breakdowns are provided for % of counts and % of electricity consumption. From top left clockwise: refrigeration compressors, materials processing, air compressors, fans/blowers, materials handling, and pumps. .............................................................................................. 100
Figure 75: Transmission type for commercial motor systems by electricity consumption (l) and counts (r) ......................................................................................................................... 101
Figure 76: Breakdown of transmission type by driven equipment in the commercial sector. Breakdowns are provided for % of counts and % of electricity consumption. From top left clockwise: refrigeration compressors, materials processing, air compressors, fans/blowers, materials handling, and pumps. .............................................................................................. 102
Figure 77: Consideration of energy efficiency in procurement of industrial motor and related system components. Annotations show the corresponding percent for each segment for shares greater than 5%. ..................................................................................................................... 103
Figure 78: Consideration of energy efficiency in design of industrial motor and related system components new capital projects. Annotations show the corresponding percent for each segment for shares greater than 5%. ...................................................................................... 104
Figure 79: Consideration of energy efficiency in procurement of commercial motor and related system components. Annotations show the corresponding percent for each segment for shares greater than 5%. ..................................................................................................................... 104
Figure 80: Consideration of energy efficiency in the design of new commercial motor and related system component capital projects. Annotations show the corresponding percent for each segment for shares greater than 5%. ...................................................................................... 105
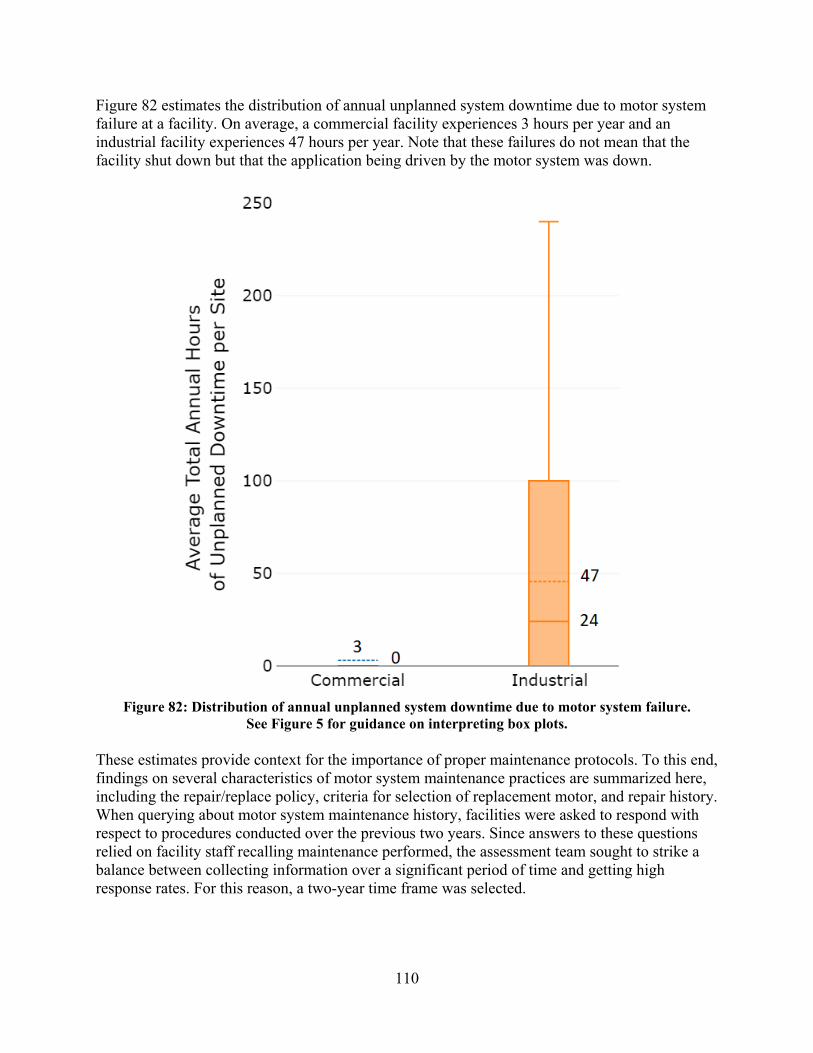
Figure 81: Title of person responsible for managing motor system energy ............................... 106 Figure 82: Distribution of annual unplanned system downtime due to motor system failure.
See Figure 5 for guidance on interpreting box plots. ............................................................. 110 Figure 83: Criteria used for motor repair/replace policy in industrial facilities, percent of
facilities .................................................................................................................................. 111 Figure 84: Criteria for selecting size of replacement motor in industrial facilities,
percent of facilities ................................................................................................................. 111 Figure 85: Criteria used for motor repair/replace policy in commercial facilities ..................... 113 Figure 86: Criteria for selecting size of replacement motor in commercial facilities ................ 114
xviii
List of Tables Table 1: Stakeholders of this report and how they may use its contents ........................................ 3 Table 2: Industrial subsector categorization used in MSMA .......................................................... 5 Table 3: Commercial building subsector categorization used in MSMA (based on CBECS) ....... 5 Table 4: Planned industrial sector sample allocation ...................................................................... 7 Table 5: Planned commercial sector sample allocation .................................................................. 8 Table 6: Industrial sample achieved by census region .................................................................. 10 Table 7: Commercial sample achieved by census region ............................................................. 11 Table 8: Example of motor to site weight calculation .................................................................. 12 Table 9: Example of site to national weight calculation ............................................................... 13 Table 10: Example of final combined weight calculation ............................................................ 13 Table 11: Annual motor system electricity consumption for the industrial subsectors and
comparison to overall energy and electricity consumption...................................................... 22 Table 12: Motor count and average motor sizes by industrial subsector ...................................... 24 Table 13: Motor system annual electricity consumption for the commercial subsectors and
comparison to overall energy and electricity consumption...................................................... 30 Table 14: Total motor count and average motor sizes by commercial subsector ......................... 32 Table 15: Industrial motor system annual electricity consumption (GWh) by driven equipment
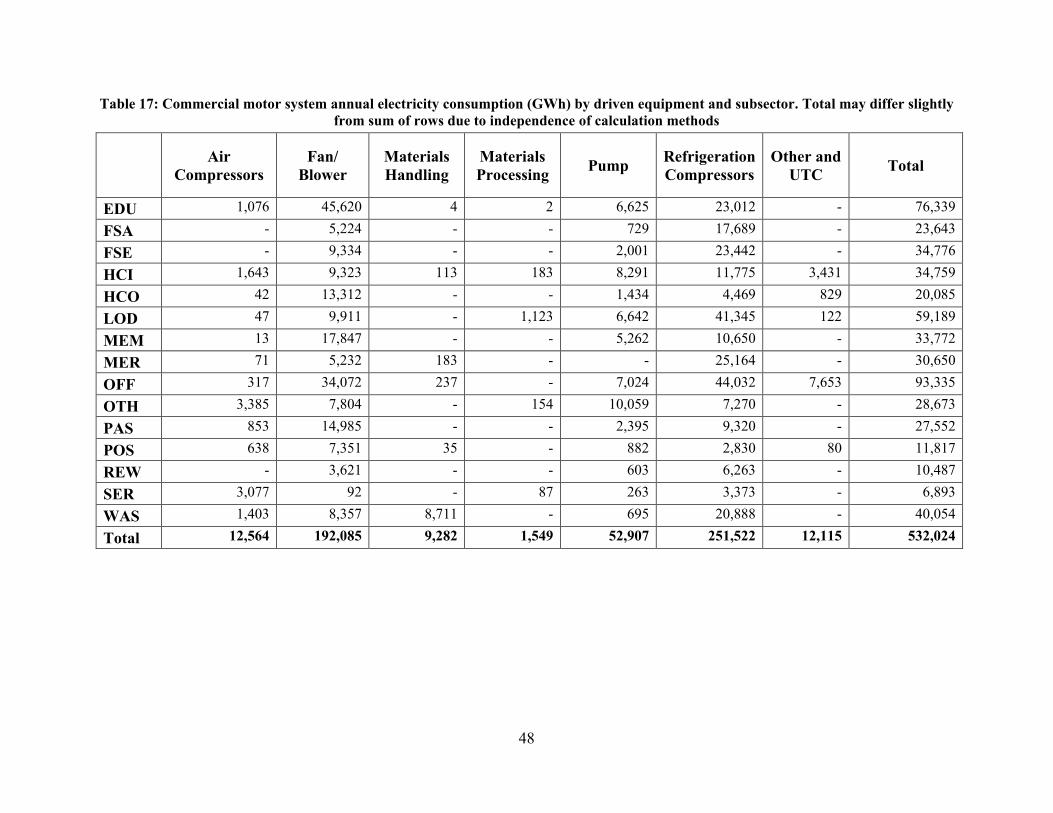
and subsector ............................................................................................................................ 39 Table 16: Motor system counts (units) by driven equipment type for each industrial subsector . 43 Table 17: Commercial motor system annual electricity consumption (GWh) by driven equipment
and subsector ............................................................................................................................ 48 Table 18: Motor system counts (units) by driven equipment type for each commercial subsector
.................................................................................................................................................. 53 Table 19: Industrial motor system annual electricity consumption and counts by size category . 58 Table 20: Commercial motor system annual electricity consumption and counts by category .... 60 Table 21: Rank (high to low) of industrial subsectors by motor system annual electricity
consumption as estimated in 2002 and 2020 MSMA .............................................................. 69 Table 22: Share of industrial motor driven equipment annual electricity consumption ............... 70 Table 23: Comparison of shares of industrial motor system electricity consumption and counts
between 2002 and 2020 MSMAs ............................................................................................. 70 Table 24: Load factors for industrial sector motor system annual electricity consumption (GWh)
by size range and driven equipment type ................................................................................. 75 Table 25: Load factor for industrial sector motor systems units by size range and driven
equipment type ......................................................................................................................... 77 Table 26: Load factors for commercial sector motor system electricity consumption by size range
and driven equipment type ....................................................................................................... 80 Table 27: Load factors for commercial sector motor systems units by size range and driven
equipment type ......................................................................................................................... 82 Table 28: Load control technology types surveyed and the categorization used in this report .... 84 Table 29: Location where motor system decisions are made (percentage of facilities) ............. 105 Table 30: Methods for identifying energy efficiency measures, percent of facilities ................ 107 Table 31: Existence of motor system inventories, percent of facilities ...................................... 108 Table 32: Annual unplanned system downtime due to motor system failure ............................. 109 Table 33: Most common motor maintenance procedures in industrial facilities. ....................... 112
xix
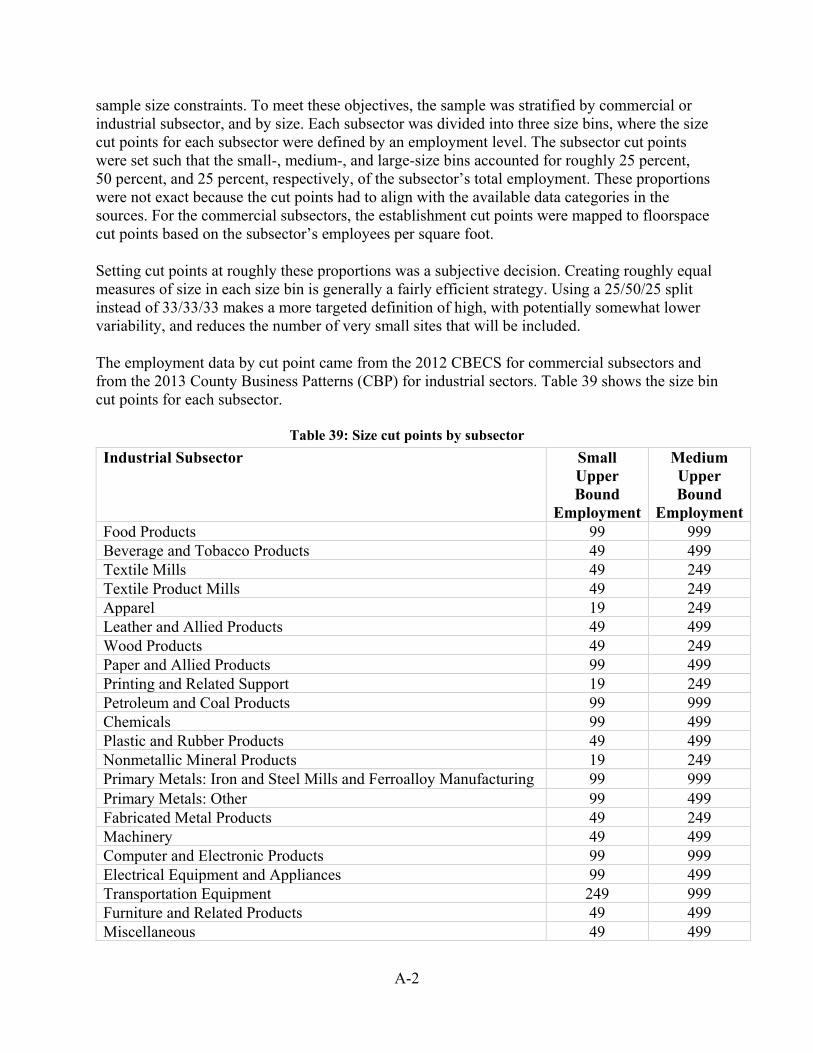
Table 34: Industrial motor maintenance procedures over the last two years by size range ........ 112 Table 35: Maintenance history of industrial motor systems by driven equipment. .................... 113 Table 36: Most common motor maintenance procedures in commercial facilities .................... 114 Table 37: Commercial motor maintenance procedures over the last two years by size range ... 115 Table 38: Maintenance history of commercial motor systems by driven equipment. ................ 115 Table 39: Size cut points by subsector ............................................................................................ 2 Table 40: Targeted and achieved sample allocations by subsector and size bin, for the industrial
subsector ..................................................................................................................................... 5 Table 41: Targeted and achieved sample allocations by subsector and size bin, for the
commercial subsector ................................................................................................................. 6 Table 42: Industrial sample achieved by census region .................................................................. 8 Table 43: Commercial sample achieved by census region ............................................................. 9 Table 44: Data sources used ......................................................................................................... 12 Table 45: Example preliminary motor to site weight ..................................................................... 2 Table 46: Example site to national weight calculation (commercial office subsector) .................. 3 Table 47: Example combined motor to site weight calculation ...................................................... 4 Table 48: Example combined motor to national weight calculations ............................................. 5 Table 49: Imputation for unobserved industrial site consumption ............................................... 14 Table 50: Imputation for unobserved commercial site consumption ............................................ 15 Table 51: Imputation for unobserved industrial motors ............................................................... 17 Table 52: Imputation for unobserved commercial motors ............................................................ 18 Table 53: Number of motors relative to site level energy consumption in MWh ratio results and
90% confidence interval (CI) by subsector .............................................................................. 20 Table 54: Magnitude number of motors results and 90% confidence interval (CI) by subsector 20 Table 55: Industrial cumulative motor MWh consumption relative to site level energy
consumption in MWh ratio results and 90% confidence interval (CI) by subsector ............... 20 Table 56: Industrial cumulative motor MWh consumption magnitude results and 90% confidence
interval (CI) by subsector ......................................................................................................... 20 Table 57: Industrial number of motors relative to site level energy consumption in MWh ratio
results and 90% confidence interval (CI) by subsector ............................................................ 21 Table 58: Industrial magnitude number of motors results and 90% confidence interval (CI) by
subsector ................................................................................................................................... 22 Table 59: Industrial cumulative motor MWh consumption relative to site level energy
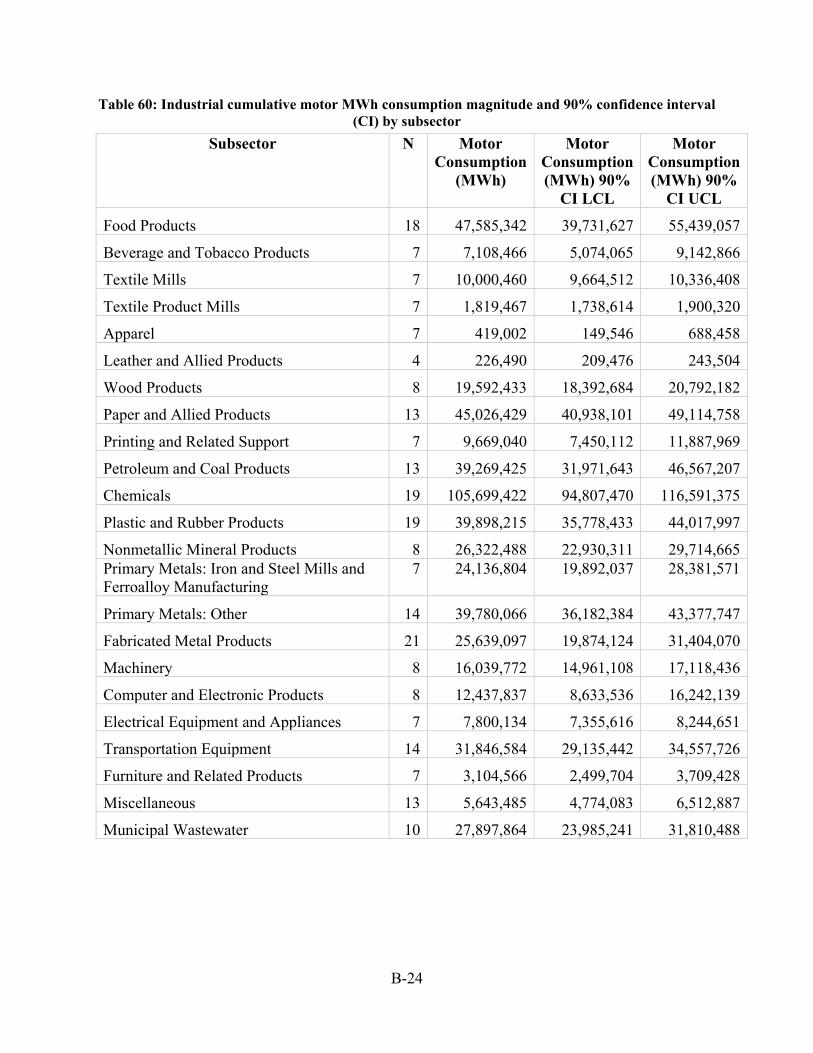
consumption in MWh ratio results and 90% confidence interval (CI) by subsector ............... 23 Table 60: Industrial cumulative motor MWh consumption magnitude results and 90% confidence
interval (CI) by subsector ......................................................................................................... 24 Table 61: Commercial number of motors relative to site level energy consumption in MWh ratio
results and 90% confidence interval (CI) by subsector ............................................................ 25 Table 62: Commercial number of motors magnitude results and 90% confidence interval (CI) by
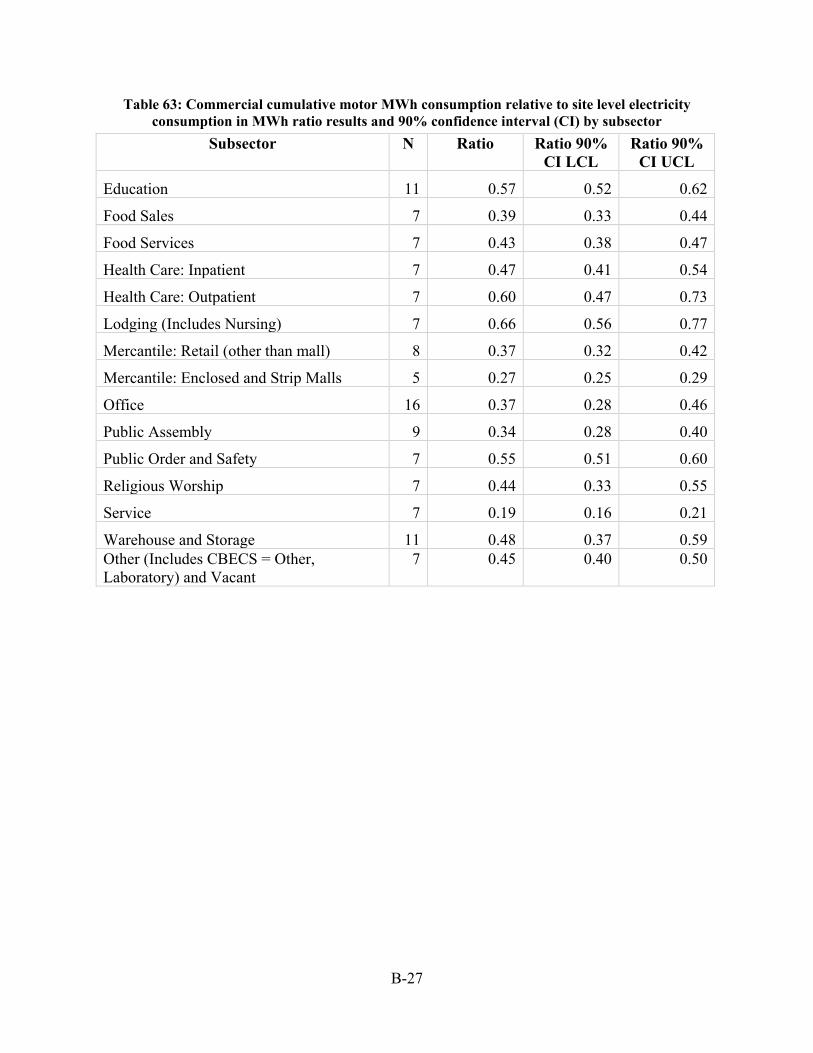
subsector ................................................................................................................................... 26 Table 63: Commercial cumulative motor MWh consumption relative to site level energy
consumption in MWh ratio results and 90% confidence interval (CI) by subsector ............... 27 Table 64: Commercial cumulative motor MWh consumption magnitude results and 90%
confidence interval (CI) by subsector ...................................................................................... 28 Table 65: Industrial magnitude number of motors results and 90% confidence interval (CI) by
Table 66: Industrial cumulative motor MWh consumption magnitude results and 90% confidence interval (CI) by subsector ......................................................................................................... 30
Table 67: Commercial number of motors magnitude results and 90% confidence interval (CI) by subsector ................................................................................................................................... 31
Table 68: Commercial cumulative motor MWh consumption magnitude results and 90% confidence interval (CI) by subsector ...................................................................................... 32
Background and Motivation Motor systems are an integral part of our industrial and commercial facilities. They provide the motive force behind the fans, pumps, compressors, chillers, and conveyors in these facilities. Given their centrality to any facility’s operations, they are a critical energy end use to understand, particularly when developing technologies and policies to meet sustainability goals, improve productivity, and enhance resilience. In the late 1990s, the U.S. Department of Energy (DOE) conducted two seminal studies to better understand the installed stock and energy savings opportunities of industrial and commercial motor systems. In the industrial sector, The United States Industrial Electric Motor Systems Market Opportunities Assessment used primary data collected through onsite assessments and led to a greater understanding of the installed base of motor systems, their characteristics, and the opportunities for energy savings (U.S. Department of Energy, 2002). Notable findings included the following:
• Industrial motor systems consumed 679 billion kilowatt-hours (kWh) in 1994, representing 23 percent of U.S. electricity consumption.
• Cost-effective energy efficiency measures could result in 62-104 billion kWh of energy savings annually.
• Sixty-two percent of the energy savings potential was from fan, pump, and compressor end use equipment.
• Nearly half of motor system electricity consumption was attributable to approximately 3,500 facilities, or 1.5 percent of U.S. manufacturing facilities.
Opportunities for Energy Savings in the Residential and Commercial Sectors with High Efficiency Electric Motors provided an evaluation of the installed stock of motor driven equipment in U.S. commercial and residential buildings and opportunities for utilization of high efficiency motors and variable speed technologies (Arthur D. Little, 1999). Notable findings included the following:
• Commercial motor systems consumed 343 billion kWh in 1995, with refrigeration and space conditioning constituting 93 percent of the total.
• Cost-effective energy efficiency measures could result in 51 billion kWh of energy savings annually.
Due in no small part to these seminal studies, motor system technologies and usage characteristics have changed drastically since the late 1990s. Greater awareness of cost-effective strategies for reducing motor system electricity consumption have been developed and deployed. This includes several software tools, literature, and utility and government programs promoting energy efficiency improvements in motor driven systems. Additionally, several rounds of energy efficiency standards have been enacted, resulting in improved installed motor efficiency. The cost of variable speed drives has dropped substantially, and combined with utility rebate programs, has led to their greater adoption.
2
Further, since these results were published, the U.S. manufacturing sector has undergone a massive transformation. Due to global competition, some sectors have relocated operations overseas. Others have brought operations onshore to avail low cost and abundant natural gas. Additionally, automation and robotics have pervaded the entire sector. Consequently, these two reports likely do not represent the current state of motor driven systems in U.S. industrial and commercial facilities. As cited in recent studies, the lack of current information on motor system electricity consumption and use characteristics limits the ability to conduct analysis on energy savings potential, develop technologies to address energy and productivity gaps, and develop programs to promote energy efficiency practices and technologies for motor systems (International Energy Agency, 2007; UNIDO, 2010; McKane and Hasanbeigi, 2011; Waide and Brunner, 2011). Specifically, the lack of information affects a range of stakeholders:
• Governments must rely on outdated information when setting research agendas, developing policies, and designing energy efficiency programs and offerings.
• Utilities and energy efficiency programs cannot identify the current market needs or potential impact when designing rebate and energy efficiency programs.
• Electric grid planners cannot identify motor system usage characteristics when developing plans to support the resilience of the electric grid.
• Manufacturers of motors, motor driven equipment, and drives are hampered when developing technologies to meet the needs of their market.
• Motor system end users are limited in their ability to identify energy saving opportunities within their own facilities because they do not have reliable benchmark information.
In response to the lack of current information and analysis on industrial and commercial motor systems, the DOE initiated an update to these two studies. Launched in 2016 and led by Lawrence Berkeley National Laboratory (LBNL), the Motor System Market Assessment (MSMA) provides an updated, more comprehensive assessment of the installed stock of motor systems in both the industrial and commercial sectors, a review of the supply chains supporting motor and drives in the U.S., and the performance improvement opportunity available from using best available technologies and maintenance and operation practices. The outcomes of the MSMA are documented in three U.S. Industrial and Commercial Motor System Market Assessment reports, with this report being the first listed:
1. Volume 1: Characteristics of the Installed Base (this report) documents the findings on the installed base of motor systems in the U.S. industrial and commercial sectors. Quantification of energy savings potential is not documented in this report but in Volume 3.
2. Volume 2: Motors and Drives Supply Chain Review reviews the state of supply chains for motors and drives installed in U.S. industrial and commercial facilities, focusing on advanced motor and drive technologies and their constituent materials.
3. Volume 3: Energy Savings Opportunity analyzes the energy performance improvement opportunity for the installed base of U.S. industrial and commercial motor systems.
3
This report has been prepared as a reference for motor system stakeholders. It provides factual information as could be best determined by the assessment results and avoids speculating on any findings. Table 1 summarizes the identified stakeholders of this report and how they may use it. This list of stakeholders is not intended to be comprehensive, and others likely exist.
Table 1: Stakeholders of this report and how they may use its contents Stakeholder Use of this Report
End users and sector trade associations
• Understand operational practices of their installed motor systems in the context of similar facilities
Motor and drive manufacturers, motor distributors, motor repair practitioners, and their trade organizations
• Understand the characteristics and needs of the existing installed motor base to direct development and marketing of motor offerings
• Gain insight into existing motor repair/replace policies of facilities
• Decision making processes around improving performance of their motor systems
Motor driven equipment manufacturers and their trade associations, distributors
• Understand the impact of motor and system efficiency on the performance and operation of their products
• Identify underserved markets for existing products • Identify opportunities to develop new products to meet
underserved and/or emerging customer needs Electric utilities and their member organizations
• Understand the magnitude, operational patterns, and system characteristics of motor system electricity consumption
Energy efficiency program administrators and their member organizations
• Identify where to direct their programs to have greatest impact on motor system electricity consumption
Energy efficiency service providers, energy efficiency consultants, and purchasing agents for the end user
• Gain insight into characteristics of motors, drives, and motor driven systems in energy intensive industries and the commercial sector to assist them in targeting their interactions with customers
Regional, state, and national government
• Develop targeted information on which sectors, motor systems, and improvement measures offer the best opportunity for performance improvement with respect to energy savings, reliability, process optimization, productivity enhancement, and others
U.S. Department of Energy • Inform the establishment of a program(s) targeted at motor end users to increase awareness of motors and motor driven systems with respect to: energy efficiency and cost savings opportunities; procurement and management procedures; and new, replacement, or repair decision making processes
• Identify technologies and research needs to drive greater increases in U.S. motor and motor system efficiency
• Support investments in research and initiatives to increase U.S. motor and motor system manufacturing competitiveness
4
Methodology The methodology for the MSMA was detailed in Rao et al. (2016) and Rao, Sheaffer and Scheihing (2017). Complete details can be found in Appendices A through C. The methodology is summarized here. Objectives The MSMA was divided into two major tasks:
Task 1: Motor System Field Assessments: An assessment of the installed motor system base in the U.S. industrial and commercial sectors, including the electricity consumption, operational and maintenance practices, and their potential for greater energy efficiency Task 2: Supply Chain Assessment: A study of the global supply chain for advanced motor and drive technologies
Task 1 was further broken into three components:
1. Develop a detailed profile of the stock of the motors and motor systems in U.S. commercial and industrial facilities.
2. Develop a profile of U.S. commercial and industrial motor and motor system purchase and maintenance practices.
3. Analyze the opportunities (by market segment) for improved energy efficiency and cost savings available through implementation of efficient motors, control technologies, system optimization, and new and future advanced motor and motor system designs.
This report details the findings from Task 1, components 1 and 2. Task 1 component 3 is detailed in Volume 3 and specifically addresses energy saving opportunities from motor systems in U.S. industrial and commercial facilities. Results from Task 2 are documented in Volume 2. Scope The MSMA covered all three-phase AC and DC motors greater than and including 1 horsepower (hp). Advanced motor technologies, such as synchronous reluctance and permanent magnet, were also included (as AC motors). Fractional horsepower motors (motors < 1 hp) were excluded because they are often embedded within components, and it would be difficult to assess their installed base comprehensively. Further, excluding these motors aligns with the scope of the previous assessment. The assessments encompassed the drive, motor, transmission, end use equipment, and distribution system (e.g., compressed air lines, water pipes). The types of end use equipment evaluated included: pumps, fans/blowers, air compressors, refrigeration compressors, materials handling, and materials conveying. Motor systems that utilize non-electric energy sources (e.g., fossil fuels) were not part of the assessment scope. The industrial and commercial subsectors included in the assessment are summarized in Table 2 and Table 3, respectively. For subsector definitions, please refer to the Glossary section of this report. The industrial sector assessment followed the North American Industrial Classification System (NAICS). This allowed for simpler comparison to other data sources, such as the Energy
5
Information Administration’s (EIA) Manufacturing Energy Consumption Survey (MECS) (U.S. Energy Information Administration 2014). The commercial building assessment used the EIA’s Commercial Building Energy Consumption Survey (CBECS) building type categories (U.S. Energy Information Administration 2012). This was primarily done because many commercial buildings can include occupants from many different sectors (e.g., an office building could have tenants from a variety of vastly different NAICS codes). Based on the results of the previous Motor System Market Assessment and to ensure proper representation, the Primary Metals subsector was subdivided into Iron, Steel, and Ferroalloy products and all other activities when allocating samples. This is due to the large motor system electricity consumption for Iron and Steel manufacturing compared to the balance of the subsector based on the findings from the previous MSMA. Also, for the purposes of the MSMA, the Municipal Wastewater Treatment subsector only includes the treatment facility and does not include the supporting infrastructure that brings wastewater to the facility and safely discharges the treated effluent.
Table 2: Industrial subsector categorization used in the MSMA Apparel Leather and Allied Products Primary Metals Beverage and Tobacco Products Machinery Printing and Related Support Chemicals Miscellaneous Textile Mills Computer and Electronic Products Municipal Wastewater Treatment Textile Product Mills Electrical Equipment and Appliances Nonmetallic Mineral Products Transportation Equipment Fabricated Metal Products Paper and Allied Products Wood Products Food Products Petroleum and Coal Products Furniture and Related Products Plastic and Rubber Products
Table 3: Commercial building subsector categorization used in the MSMA (based on CBECS)
Education Lodging (includes Nursing) Public Order and Safety Food Sales Mercantile: Retail (other than mall) Religious Worship Food Services Mercantile: Enclosed and Strip Malls Service Health Care: Inpatient Office Warehouse and Storage Health Care: Outpatient Public Assembly Other and Vacant
To improve the readability of figures and data tables presented in this report, abbreviations and shortened names for the subsectors are used throughout. Please refer to the List of Acronyms and Abbreviations for these abbreviations. The scope was limited to industrial establishments with six or more employees and commercial buildings with 1,000 square feet or more. These restrictions are consistent with the sites covered by the MECS and CBECS, respectively. Sampling approach Details on the sample allocation, roll-up of assessment results to the national level, and determination of confidence intervals can be found in Appendix A: Sampling Allocation and Appendix B: Weighting Description.
6
Planned sample allocation Subsector (defined in Table 2 and Table 3) and facility size were used to develop a statistically representative sample of industrial and commercial facilities in the United States. This sample was used to guide the recruitment of facilities for the MSMA. The final allotment deviated from the planned sample, as described in the next section. Specific definitions of small, medium, and large were developed for each subsector. For the industrial assessments, facilities were categorized into small, medium, and large size bins based on number of employees. The 2013 U.S. Census County Business Patterns (CBP) data provides number of establishments by employee size ranges. These were summed such that for each subsector the intention was to allot 25 percent, 50 percent, and 25 percent of the subsector’s total employment respectively to the small, medium, and large size bins. Using a 25/50/25 split instead of 33/33/33 makes a more targeted definition of high with potentially somewhat lower variability and reduces the number of very small sites that will be included. Similar allocation criteria were adopted for commercial assessments using the floorspace data obtained from the 2012 CBECS. The number of samples was allocated to the subsector-size bins based on their magnitude of the estimated motor system electricity consumption1 and its variability across facilities within the subsector. The following aspects were considered in the final allocation:
• Optimal allocation to best characterize the subsector motor system electricity consumption with best possible precision
• Allocation proportional to estimated motor electricity consumption and the number of facilities in each subsector
• A minimum of seven assessments per subsector The objective was to select facilities with probability proportional to its size and motor system electricity consumption. Larger facilities have a higher chance to be assessed, so that those facilities that account for the most motor system electricity consumption are intended to be better characterized, while those sites with the least motor system electricity consumption are assessed with lesser precision. The standard deviation of motor system electricity consumption was estimated for each subsector based on the reported standard errors and sample sizes from the 2014 MECS and 2012 CBECS. Table 4 and Table 5 provide the targeted sample allocations by subsector and size bin for the industrial and commercial sectors, respectively.
1 Estimated by multiplying the segment employment total by the estimated motor electricity consumption per employee from EIA 2010 MECS. See more details in Appendix A.
Final sample allocations Ultimately, 246 assessments were conducted in industrial facilities and 123 in commercial facilities. Due to challenges with recruiting facilities (more than 80 percent of facilities approached turned down the offer for an assessment), it was not possible to achieve the full desired sample. Further, a comprehensive directory and data on the geographic and size distribution of water facilities could not be obtained. As a result, this subsector was dropped from the scope of the MSMA. The calculation of the confidence intervals reflected the sample collected. The final counts of assessments conducted for the industrial and commercial sectors are shown in Figure 1 and Figure 2, respectively.
Sample Size
Commercial Subsector Subsector Total
Size 1 Small
Size 2 Medium
Size 3 Large
Education 13 1 4 8 Food Sales 7 1 3 3 Food Services 7 1 2 4 Health Care: Inpatient 7 1 2 4 Health Care: Outpatient 7 1 3 3 Lodging (includes Nursing) 7 1 3 3 Mercantile: Retail (other than mall) 11 1 6 4 Mercantile: Enclosed and Strip Malls 7 1 3 3 Office 20 6 9 5 Public Assembly 10 2 7 1 Public Order and Safety 7 1 3 3 Religious Worship 7 1 2 4 Service 7 1 3 3 Warehouse and Storage 17 2 7 8 Other (includes CBECS = Other, Laboratory) and Vacant
16 3 6 7
Total 150 24 63 63
9
Figure 1: Final sample allocation for industrial assessments. The numbers on the figures indicate the number of samples conducted within each facility size category per subsector. Size categories
with no number had one sample completed.
Figure 2: Final sample allocation for commercial assessments. Consult the List of Acronyms and
Abbreviations for the full name of each subsector. The numbers on the figures indicate the number of samples conducted within each facility size category per subsector. Size categories with no
number had one sample completed. As can be seen in Figure 1 and Figure 2, small facilities in some subsectors were not sampled at the rate specified in Table 4 and Table 5. For example, the assessment team was unable to gain access to any small facilities in the Electrical Equipment, Furniture, Miscellaneous, Printing,
10
Food Sales, and Religious Worship subsectors. This may lead to sample bias in these sectors, as relatively smaller motor systems may not have been comprehensively surveyed. Geography was not used as an explicit sample allocation. Including geography along with subsector and size would have created sample allocations that were very small and difficult to fulfill. However, an overall target by census region was considered in the sample allocation of each subsector as an implicit stratum. Table 6 and Table 7 show the achieved sample distribution by subsector and census region, for the industrial and commercial sectors. The percent of samples allocated to each census region is also provided. For context, the 2013 County Business Patterns (which was used to allocate industrial sector samples) shows the distribution of manufacturing facilities (excluding wastewater) as: Midwest 29 percent, Northeast 18 percent, South 30 percent, and West 22 percent. Similarly, the 2012 CBECS (which was used for allocating commercial sector samples) shows the distribution of commercial facilities as: Northeast 14 percent, Midwest 22 percent, South 40 percent, and West 23 percent.
Table 6: Industrial sample achieved by census region Subsector Midwest Northeast South West Total
*Six assessments were conducted in Puerto Rico, which is not part of a census region.
11
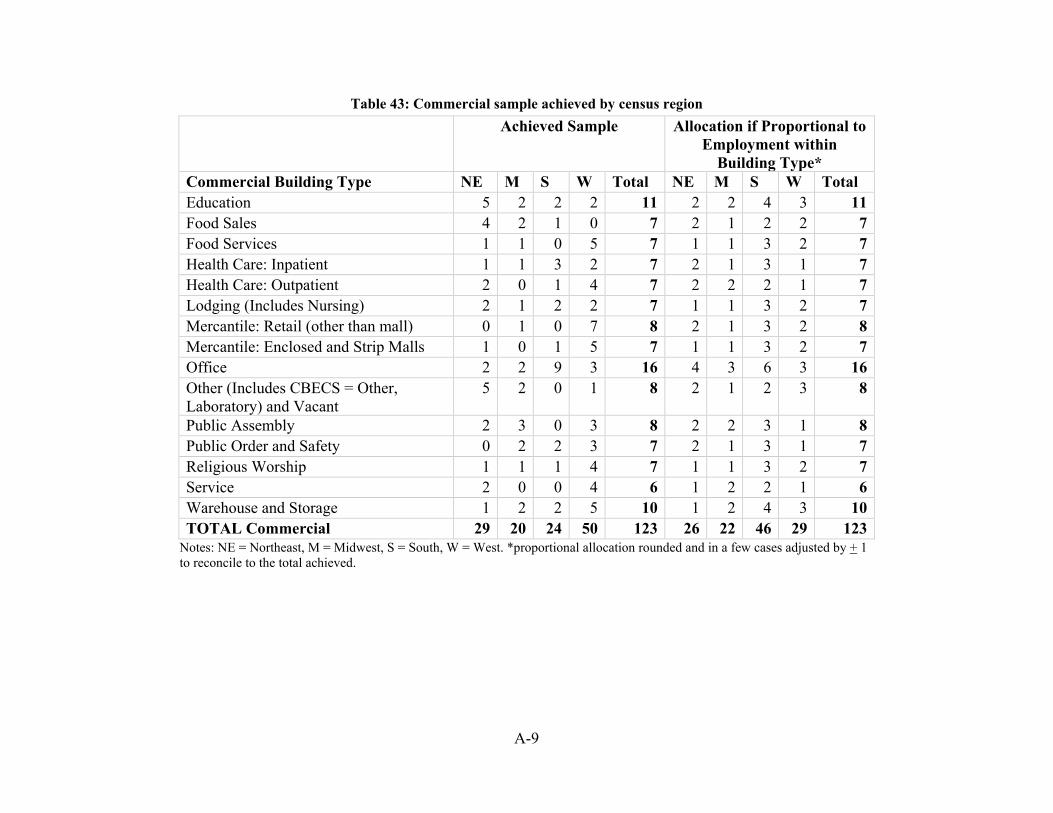
Table 7: Commercial sample achieved by census region Subsector Midwest Northeast South West Total
Education 2 5 2 2 11 Food Sales 2 4 1 0 7 Food Service 1 1 0 5 7 Health Care: Inpatient 1 1 3 2 7 Health Care: Outpatient 0 2 1 4 7 Lodging 1 2 2 2 7 Mercantile: Enclosed and Strip Malls 0 1 0 4 5 Mercantile: Retail (other than mall) 1 0 1 6 8 Office 2 2 9 3 16 Other 1 5 0 1 7 Public Assembly 3 3 0 3 9 Public Order and Safety 2 0 2 3 7 Religious Worship 1 1 1 4 7 Service 0 1 0 6 7 Warehouse and Storage 3 1 2 5 11 Total 20 29 24 50 123 % of Total 16% 24% 20% 41% 100%
Sample weighting and scaling The assessment data were expanded to the national level to characterize the installed industrial and commercial motor system base. This was done by developing weights to estimate the population totals from the observed motor systems with the purpose of minimizing sampling biases. Specifically, three weights and one adjustment factor were developed to expand the survey assessment data at the motor system level to the national level. The framework for using the weight is shown in Figure 3.
12
Figure 3: Motor weights calculation flowchart
The three weights are quantity, motor group to site weight, and site to national weight:
• Quantity: The quantity is associated with the number of motor systems within a site that are identical to an observed motor system with the same usage pattern. The quantity weight will scale a motor up from a single motor to a group of motors with the same usage pattern.
• Motor group to site weight: This is the number of motor systems at the site represented by each assessed motor system. This weight helps to bring the motor system-specific estimates to the site-specific estimates. An example of this calculation can be found in Table 8. All motor systems in the 1-6 hp size bin were assessed, while only 25 motors of the 26 motors in the 6-21 hp size bin were assessed. The resulting weight for the 1-6 hp size bin is 1 and for the 6-21 hp size bin is 1.04 This can be interpreted to mean each of the 6-21 hp size bin motor systems represents 1.04 motor systems at this site.
Table 8: Example of motor to site weight calculation Motor hp Size Bin
Estimated Total Motors
Total Observed Motors
Motor to Site Weight
1-6 29 29 1.00 6-21 26 25 1.04
• Site to national weight: This is the number of sites in the full national population
represented by each observed site. This weight can scale the site-specific estimates to the national level to obtain the preliminary subsector estimates. An example calculation is
13
shown in Table 9. The site to national weight can be calculated as the national estimated population of similar sites divided by the number of sampled sites in the same size and subsector category. For the sampled large sites indicated in Table 9, the site to national weight is 1,395.3.
Table 9: Example of site to national weight calculation Size
Category Estimated
Population of Sites Number of
Sampled Sites Site to National
Weight Large 6,976 5 1,395.3 Medium 143,560 7 20,508.6 Small 861,836 4 215,459.1
In addition to the three weights, an adjustment factor was used to align the estimates to MECS and CBECS.
• Adjustment factor: To assure that the final subsector-specific national electricity consumption is consistent with the 2014 MECS and 2012 CBECS estimates, an adjustment factor was introduced for each subsector to scale the motor system electricity consumption estimates. It is calculated as the MECS/CBECS subsector electricity consumption divided by the sum of the weighted sample sites’ total electricity consumption (using the site to national weights).
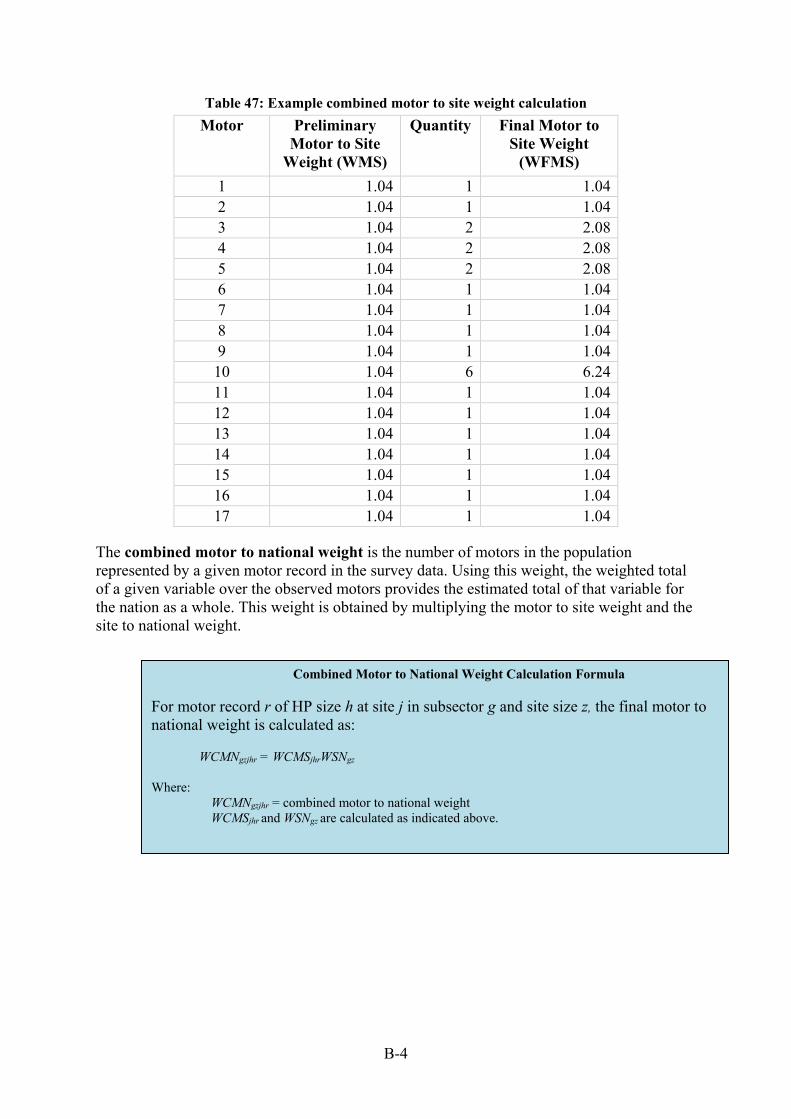
For each assessed motor, as illustrated by Table 10, the final combined weight can be obtained as follows:
Final Combined Motor to national weight = Quantity x Motor to site weight x Site to national weight x Adjustment factor
For the second motor record, the final combined weight is 2 x 1.04 x 1,395.3 x 0.97 = 28,15.2.
Table 10: Example of final combined weight calculation Motor Motor
No adjustments were made to the collected information to account for operating conditions (e.g., climate, production). It is expected that conditions like climate and production will affect a system’s electricity consumption relative to a similar system operating under different conditions. For example, a motor drive system supporting space cooling in a Southern climate will consume more electricity over a year than a similar system in a Northern climate. However, since the goal of the assessment was to understand total electricity consumption of all motor systems rather than relative electricity consumption between systems, understanding these distinctions was not a primary priority. Further, information needed to make these types of adjustments would likely not be available for every facility assessed.
14
Assessment details A description of the assessments can be found in Rao, Sheaffer and Scheihing (2017). A brief summary follows here. A tablet-based software tool was designed and used to prompt survey questions and store responses. The responses to these questions formed the analytical basis for the MSMA. These questions and answer choices can be found in Appendix C: Field Assessment . Field assessments were conducted from September 2016 through March 2019. Most of the 369 assessments were conducted over one day, with approximately 60 large industrial facilities requiring a two-day assessment. The field assessment team could directly observe approximately 100 unique motor systems in a day. If a facility had more than 100 motors, the assessment team assessed a statistically representative sample of motors. The assessment team determined the number, size, location, rough estimate of run hours, and driven equipment of motors using a combination of existing inventories and questions of facility staff. Motor systems embedded in other equipment (i.e., a cooling fan embedded in process heating equipment) were part of the scope of motors assessed. However, identifying the existence of these motor systems at a facility relied upon facility staff recalling their existence or their inclusion in an existing motor inventory. The information was populated in the tablet-based software which selected motors based on estimated electricity consumption by size and location. For example, if 20 percent of the estimated motor system electricity consumption fell into a bin of 50-100 hp within one location, then 20 percent of the motor systems selected for observation would be from this size range and location. For duplicate motor systems, one motor system was sampled and used to represent the duplicate systems. For example, a building may have three identical heating, ventilation and air-conditioning (HVAC) systems that all have the same size, age, and maintenance history. In this case, one of the three motor systems would be selected for direct observation, and its information would be recorded as being applicable to all three. This allowed for the assessment team to potentially collect information on more than 100 motor systems during a single day assessment. The assessment questions were broken into three categories:
1. General facility-level questions2 2. General motor system questions3 3. Motor system efficiency checklists for systems greater than 20 hp and 2,000 annual
operating hours4
The general facility-level questions were used to determine characteristics of the facility related to operating motor systems. Questions included but were not limited to: annual energy and electricity consumption; policies related to designing, procuring, and maintaining motor systems; and policies related to identifying and implementing energy efficiency measures.
2 See Appendix C: Field Assessment Questions, Table 74. 3 See Appendix C: Field Assessment Questions, Table 69. 4 See Appendix C: Field Assessment Questions, Table 70, Table 71, Table 72, and Table 73.
15
The general motor system questions were intended to gather basic technical specifications, operating characteristics, and purpose of the motor systems selected for observation. Nameplate information for all motor systems selected was gathered. Equipment specification, such as manufacturer, model, horsepower size, no load speed, number of poles, and more can be found on a motor’s nameplate.5 Operational information such as operating hours, load factor, and load control method was also gathered. Contextual information was gathered as well, including the type of transmission and connected load, and the motor’s purpose. For a sampling of pump, fan/blower, compressed air, and refrigeration systems greater than 20 hp and operating more than 2,000 hours annually, an in-depth survey was conducted to gather more information on their installation and energy efficiency. Separate checklists were created for each type of driven equipment. The pump and fan/blower checklists were similar and gathered information on pump/fan/blower nameplate information, other pumps/fans/blowers operating in conjunction, methods of load control, and more. The compressed air and refrigeration system checklists were similar in that they considered the entire air/refrigerant system with the compressor(s) being part of the system. These checklists queried details regarding system settings, control parameters, equipment nameplate information (similar to motor nameplates, equipment nameplates provide equipment specifications such as maximum operational settings, manufacturer, model, etc.), and more.
Uncertainty assessment The MSMA estimates were obtained based on a statistical sample of industrial and commercial facilities. As with any other statistical based analyses, these estimates have uncertainty due to the random sampling of sites and of motors within sites. The sampling errors are usually considered as random errors.6 The estimates are also subject to non-sampling error. The accumulation of sampling and non-sampling errors is equal to the difference between the estimate based on the sample and the real value of these estimates. Efforts were made to minimize the chance that non-sampling errors would occur that would systematically overestimate or underestimate the variable of interest.7 Only sampling errors can be estimated.
To quantify the uncertainty associated with the MSMA estimates, basic 90 percent confidence intervals were used to capture the random error due to the sampling process. The confidence interval is a window that brackets the point estimate and has a 90 percent chance of including the true value. More discussion about both the sampling and non-sampling errors can be found in Appendix B: Weighting Description.
5 For a description and guide to motor nameplate information, please see Chapter 3 of the DOE Advanced Manufacturing Office publication Continuous Energy Improvement in Motor Driven Systems. 6 This means that these errors are equally likely to overstate or understate values of interest. 7 Errors that lead to systematic overestimates or underestimates contribute to bias, which cannot be identified nor quantified easily.
Findings This section provides results from the MSMA pertaining to motor system electricity consumption and counts by overall, facility type (subsector and size), driven equipment, and motor size. It also details findings on DC motors. Findings are presented in two broad categories: Installed Base Characteristics and Operating Characteristics. Where relevant, comparisons to the previous assessment are made. Where a motor system characteristic was undeterminable, the abbreviation UTC (unable to collect) was used. The primary and preferred method for determining many characteristics of the motor was to read its nameplate. In many cases, however, this was not possible because the nameplate was illegible. Figure 4 breaks down the legibility of the nameplates of the motors assessed. Legibility is defined as being able to read nameplate information. Illegible nameplates include those that are missing, scratched or weathered extensively, inaccessible, painted over, or otherwise unreadable. Over two-thirds of the commercial nameplates and nearly a half of the industrial nameplates were illegible.
Figure 4: Legibility of nameplates on motors assessed: commercial (L) and industrial (R)
In lieu of a legible nameplate, assessors used a secondary source of information, including querying the facility staff or estimating based on visual observation. Many of the figures that show a characteristic on a “per facility” basis use box plots. Figure 5 explains how to read these figures. The solid horizontal line represents the median value, which is the value where half of all values in the set are higher and half are lower. The dashed line represents the average. The lower bound of the box shows the first quartile. Seventy-five percent of the values in the set are above this line. The upper bound of the box shows the third quartile. Twenty-five percent of the values in the set are above this line. The lower fence is the smallest observation within a 1.5 interquartile range (IQ) of the first quartile. The upper fence is the largest observation within a 1.5 IQ of the third quartile. Observations outside the fences are shown individually.
17
The box plot provides a quick indication of:
• How widely spread the bulk of the observations are (i.e., the height of the box) • Whether the observations are distributed fairly symmetrically around the average (is the
average close to the median?) • Whether there are large numbers of extreme values far from the bulk of the data
(observations outside the fences)
Figure 5: Guide to reading box plots For total and average quantities, 90 percent confidence intervals are given in the text following the estimate as “(+/- X).” This notation indicates that the 90 percent confidence interval has a lower bound equal to the estimate minus X and an upper bound equal to the estimate plus X. Figures displaying total or average quantities show bars at the lower and upper limits of the confidence interval and a dot at the point estimate.
18
Installed base characteristics This section summarizes findings characterizing the installed base of industrial and commercial motor systems greater than 1 hp. Specifically, it summarizes findings related to total electricity consumption and motor system counts by subsector, driven equipment, and system size range. Additionally, findings on run hours, DC motor penetration, and motor age are summarized. A summary of highlights for each of these topics is presented at the end of this section. Overall industrial and commercial The estimated annual electricity consumption for industrial and commercial three-phase and DC motor systems greater than or equal to 1 hp is 1,079 TWh/yr (+/- 36 TWh). This represents approximately 29 percent of the total electricity supply in the United States in 2018. The split between industrial and commercial motor systems is fairly even, particularly when considering the confidence intervals. Industrial motor systems consume 546,963 GWh annually (+/- 19,831 GWh), while commercial motor systems consume 532,024 GWh (+/- 29,719 GWh). The estimates of annual motor system electricity consumption can be found in Figure 6.
Figure 6: Estimates of total industrial and commercial motor system annual electricity
consumption with 90 percent confidence intervals. Note that the upper and lower bounds of the confidence intervals for the commercial and industrial sectors will not sum to the national level due
to the method used for their calculation. The averages do sum.
19
The total number of installed three-phase and DC motors greater than or equal to 1 hp in the industrial and commercial sectors is shown in Figure 7, and is estimated to be 52.5 million (+/-4.5 million). The breakdown between industrial and commercial is approximately 80 percent commercial and 20 percent industrial. It is estimated that there are 10.8 million (+/- 1.1 million) motors in the industrial sector and 41.7 million (+/-4.4 million) motors in the commercial sector.
Figure 7: Estimate of total industrial and commercial motor units with 90 percent confidence
intervals. Note that the upper and lower bounds of the confidence intervals for the commercial and industrial sectors will not sum to the national level due to the method used for their calculation. The
averages do sum.
As expected, based on the estimates of the annual motor system electricity consumption and counts, the average connected horsepower per facility for the industrial sector is much higher than it is for the commercial sector. The average connected horsepower per facility for the industrial sector is estimated to be 1,595. The median connected horsepower at an industrial facility is 366 hp. This implies that the chance of randomly selecting an industrial facility with more than 366 connected horsepower is equal to the chance of selecting one smaller. However, there is a large spread in the connected horsepower per facility, and larger facilities cause the average connected horsepower to be much higher than the median. For the commercial sector, the average connected horsepower per facility is estimated to be 89 hp/facility, with a median of
20
20 hp. The relationship between the median and average is similar to that of the industrial sector, however the difference is less pronounced. Figure 8 shows the average and distribution of connected horsepower per facility.
Figure 8: Distribution of facility total connected hp for the industrial and commercial sectors.
Please refer to Figure 5 for guidance on interpreting the box plots.
Industrial sector breakdown by facility type Within the industrial sector, annual motor system electricity consumption varies among the different subsectors (Figure 9 and Table 11). The Chemical subsector had the highest estimated annual motor system electricity consumption (106,000 GWh/yr)—64 percent higher than the estimated annual motor system electricity consumption of the next highest subsector, Primary Metals. Table 11 provides the total motor system electricity consumption for each industrial subsector.
21
Figure 9: Total industrial motor system annual electricity consumption by subsector with 90 percent confidence intervals
22
The subsector motor system electricity consumption is compared to the overall energy and electricity consumption for the subsector in Table 11. While the Chemical subsector has the largest motor system electricity consumption, it is 10 percent of the subsector’s overall energy consumption. Conversely, in subsectors like Textile Mills or Printing, where motor system electricity consumption is low in comparison to the other subsectors, it is more than one-third of the subsector’s overall energy consumption. Framing the motor system electricity consumption in this manner provides insight into the relative importance of motor systems to a subsector.
Table 11: Annual motor system electricity consumption for the industrial subsectors and comparison to overall energy and electricity consumption
The estimated motor system count by subsector is shown in Figure 10. The Machinery subsector has the largest number of motor systems with nearly 2 million units, followed by the Chemical (1.3 million), Plastics and Rubber (1.1 million), Primary Metals (1.0 million), and Fabricated Metals (0.7 million) subsectors.
Figure 10: Motor counts by industrial subsector with 90 percent confidence intervals
24
This implies that the average motor size within the Chemicals (40 hp), Food (32 hp), and Paper (67 hp) subsectors is larger than the average size of motors in the Machinery (13 hp) and Plastic /Rubber (21 hp) subsectors. Motor counts and average motor size by industrial subsector is shown in Table 12.
Table 12: Motor count and average motor sizes by industrial subsector Subsector Motor Counts Total hp Avg hp
Figure 11 shows the share of motor system electricity consumption and counts for each industrial subsector with respect to the entire sector. Seventy-three percent of the motor system electricity consumption for the industrial sector is in the top eight subsectors (in order: Chemicals, Primary Metals, Food, Paper, Plastic/Rubber, Petroleum Refining, Transportation, and Wastewater). Sixty-four percent of the industrial motor system units are in the top six subsectors (in order: Machinery, Chemicals, Primary Metals, Plastics/Rubber, Food, and Fabricated Metals).
25
Figure 11: Share of industrial motor system counts (upper) and electricity consumption (lower) by industrial subsector. The Balance of Subsectors category includes: Apparel, Electrical Equipment,
Furniture, Leather, Miscellaneous, and Textile Product.
The distribution of facility total connected horsepower is shown for each industrial subsector in Figure 12. This shows the magnitude of motor power capacity within each subsector. The information can be used to inform demand management activities. For many subsectors, it is not uncommon to have more than 1,000 hp of connected motor systems in a facility. However, due to the inability to access small facilities in some subsectors, the total connected horsepower per facility may be overestimated for some subsectors in Figure 12. Specifically, the total connected horsepower per facility for the Electrical Equipment, Furniture, Miscellaneous, and Printing subsectors may be smaller than observed and shown in the figure, since small facilities in these subsectors were not represented in the final sample allocation due to an inability to access these facilities.
26
Figure 12: Distribution of facility total connected hp by industrial subsector. Please refer to Figure 5 for guidance on interpreting the box plots.
27
Figure 13 provides the breakdown of total annual industrial motor system electricity consumption by facility size. Medium-size facilities accounted for half of the estimated industrial motor system electricity consumption, while small facilities accounted for 17 percent. Since the definition of medium was set so that 50 percent of all facilities fell into this category, the share of motor system electricity consumption in this size category can be expected. The findings show that small facilities consume a smaller share of motor system electricity consumption than their representation of facilities in the population, and large facilities consume more than their representation of facilities in the population. Figure 14 shows the total industrial motor system counts by facility size. While small facilities only accounted for 17 percent of total annual industrial motor system electricity consumption, they accounted for 38 percent of the industrial motor system counts. Nevertheless, medium-size facilities accounted for the largest number of motor system units, with 48 percent of the sector’s units. Small facilities house a larger share of the motor systems in the industrial sector than their representation of facilities in the population, whereas large facilities house less. Commercial sector breakdown by facility type The breakdown of motor system electricity consumption by commercial subsector is shown in Figure 15 (please refer to List of Acronyms and Abbreviations for acronym definitions). The Office subsector has the highest estimated annual motor system electricity consumption (93,334 GWh), followed by Education (76,338 GWh) and Lodging (59,189 GWh). Table 13 provides the total motor system electricity consumption for each commercial subsector.
28
Figure 13: Total industrial annual motor system electricity consumption by facility size
Figure 14: Total industrial motor system count by facility size
29
Figure 15: Total commercial motor system annual electricity consumption by subsector with 90 percent confidence intervals
30
Across the commercial sector, it is estimated that motor systems account for 34 percent of the sector’s electricity consumption and 26 percent of its energy consumption (Table 13). This is quite different from the industrial sector, where motor consumption is estimated to be only 13 percent of the industrial sector’s total energy consumption but 69 percent of its electricity consumption. Differences in the use of electricity between the two sectors help to explain this. Commercial buildings have many electrical end uses beyond motor systems (e.g., lighting, plug loads), and these loads are of similar magnitude to the motor system loads. The industrial sector has those same non-motor electric loads, but the electricity consumption for motor systems far outweighs those other loads.
Table 13: Motor system annual electricity consumption for the commercial subsectors and comparison to overall energy and electricity consumption
Office 363,701 253,000 93,334 37 26 Public Assembly 140,674 80,000 27,552 34 20 Public Order and Safety 38,978 21,000 11,816 56 30 Religious Worship 50,701 24,000 10,487 44 21 Service 79,715 37,000 6,892 19 9 Warehouse and Storage 125,727 83,000 40,054 48 32 Other and Vacant 95,834 64,000 28,672 45 30 Total 2,040,654 1,241,000 532,016 43 26
The Mercantile: Enclosed and Strip Malls subsector is estimated to have the largest number of motors of any commercial subsector, with 6.3 million units (Figure 16). In fact, the Mercantile: Enclosed and Strip Malls commercial subsector has more units than any of the industrial and commercial subsectors assessed. After the Mercantile: Enclosed and Strip Malls subsector, the Lodging (5.3 million) and Office (4.8 million) subsectors have the next highest estimated number of motor systems. The top eight commercial subsectors are all estimated to have more motors than the industrial subsector with the most estimated motors (Machinery, 2 million units).
31
Figure 16: Motor counts by commercial subsector with 90 percent confidence intervals
32
As shown in Table 14, the Health Care: Inpatient and the Public Assembly subsectors had the largest motors on average, at 32 hp. Compared to the industrial sector, the relatively small motor size (three subsectors have average motor sizes of 4 hp) is indicative of the typical use of motors. As will be shown in following section on Driven Equipment breakdown, HVAC systems are the largest application of motors in the commercial subsector. Additional implications of small motors are that: (1) the energy losses across the motor are larger than those for large motors, and (2) they are less likely to be repaired and more likely to be replaced upon failure.
Table 14: Total motor count and horsepower, and average motor horsepower by commercial subsector
Subsector Motor Counts Total hp Avg hp Education 3,303,261 35,969,076 11 Food sales 1,686,742 10,209,796 6 Food service 4,082,172 15,558,438 4 Health Care: Inpatient 498,966 16,053,241 32 Health Care: Outpatient 914,332 9,328,888 10 Lodging 5,340,744 22,246,694 4 Mercantile: Enclosed and Strip Malls
6,307,752 37,745,109 6
Mercantile: Retail (other than mall)
3,401,350 20,800,807 6
Office 4,762,177 58,371,188 12 Public assembly 542,034 17,580,975 32 Public order and safety 2,525,907 20,635,046 8 Religious worship 759,636 5,108,278 7 Service 1,941,057 18,530,664 10 Warehouse and storage 1,892,272 8,090,327 4 Other and Vacant 3,611,794 24,160,828 7 Total 41,570,196 320,389,355 8
The distribution of facility total connected horsepower is shown for each commercial subsector in Figure 17. This shows the magnitude of motor power capacity within each subsector. The information can be used to inform demand management activities. The Health Care: Inpatient subsector has the largest estimated connected horsepower. However, due to the inability to access small facilities in some subsectors, the total connected horsepower per facility may be overestimated for some subsectors in Figure 17. Specifically, the total connected horsepower per facility for the Food Sales and Religious Worship subsectors may be smaller than shown in the figure since small facilities in these subsectors were not represented in the final sample allocation due to an inability to access these facilities.
33
Figure 17: Distribution of facility total connected hp by commercial subsector. The inset graph rescales the data by removing the Health Care: Inpatient subsector, allowing for the values of other subsectors to be more readily read. Please refer to Figure 5 for guidance on
interpreting the box plots.
34
Figure 18 shows the share of motor system electricity consumption and counts for each commercial subsector with respect to the entire sector. Seventy-one percent of the commercial sector’s motor system electricity consumption resides in the top seven subsectors (in rank: Office, Education, Lodging, Warehouse and Storage, Food Service, Health Care: Inpatient, and Mercantile: Enclosed and Strip Malls). Seventy-four percent of the sector’s motor systems can be found in the top seven subsectors (in rank, Mercantile: Enclosed and Strip Malls, Lodging, Office, Food Service, Warehouse and Storage, Education, and Mercantile: Retail).
Figure 18: Share of motor system counts (upper) and electricity consumption (lower) by
commercial subsector
Commercial sector motor system electricity consumption is broken down by facility size in Figure 19. Medium-size facilities account for 52 percent of the sector’s motor system electricity consumption, representing the largest share. This may be an artifact of the definition used in this report for medium, where 50 percent of facilities were classified as medium. Small facilities, which were defined to account for 25 percent of the facilities, account for 13 percent of the sector’s motor system electricity consumption, whereas large facilities accounted for 35 percent. This indicates that small facilities account for less of the sector’s motor system electricity
35
consumption than their share of facilities, and large facilities account for more motor system electricity consumption than their share of facilities.
Figure 19: Commercial sector motor system annual electricity consumption by facility size
Medium facilities account for 56 percent of the motor system units in the commercial sector, as shown in Figure 20. Small facilities account for 27 percent of the sector’s motor system units.
36
Figure 20: Commercial sector motor system counts by facility size
Driven equipment breakdown Motor system electricity consumption and counts were estimated by driven equipment type. The driven equipment types considered were air compressors, fans (includes blowers and vacuum pumps), materials handling, materials processing, pumps, refrigeration compressors, and other. Materials processing includes motor systems that use mechanical means to process materials. Examples include grinders, hydraulics, and extruder motors. Materials handling includes motor systems that transport materials, such as conveyor motors. Materials processing and handling are not commonly considered typical commercial applications. Examples of materials processing motors in the commercial sector include trash compactors, shredders, and other equipment that changes the form of a material. Examples of materials handling motors in the commercial sector include elevator, escalator, and conveyor belt motors. Findings by driven equipment are presented below, separated between the industrial and commercial sectors. Industrial sector Figure 21 provides the breakdown of motor system electricity consumption by driven equipment for the industrial sector. Materials processing consumes the largest share of motor system electricity, followed by pumps and fans/blowers. Air compressors and refrigeration compressors round out the top five.
37
Figure 21: Industrial motor system annual electricity consumption by driven equipment. UTC
indicates that the equipment driven by the motor could not be identified. Figure 22 provides the share of industrial motor system electricity consumption by driven equipment. Twenty-nine percent of the motor system load in the industrial sector is for materials processing. This is followed by fans/blowers and pumps, both at 21 percent. Figure 22 also provides further insight into the technology type for each driven equipment category. This type of information can provide insights into electrical characteristics, such as start-up loads. It can also provide insight into load control options. For example, 81 percent of all pumping loads are rotodynamic pumps, and the remaining 19 percent are positive displacement.
38
Figure 22: Share of motor system electricity consumption by driven equipment and technology type
for the industrial sector Table 15 provides the breakdown of industrial motor system electricity consumption by driven equipment and subsector. For 10 of the 22 subsectors, materials processing owns the largest share of the subsector’s motor system electricity consumption. Fan/blower systems are the leading form of motor system electricity consumption for six of the subsectors. Pump system electricity consumption leads for three subsectors and refrigeration compression for two. The driven equipment with the largest share of a subsector’s motor system electricity consumption follows the type of processes occurring in that subsector. For example, refrigeration compressors own the largest share of motor system electricity consumption in the Food subsector, where cold-storing raw and finished food product and cooling products are major processes. Similarly, pumping electricity consumption leads in the Municipal Wastewater subsector, where pumping wastewater through the various treatment processes is a major operation.
39
Table 15: Industrial motor system annual electricity consumption (GWh) by driven equipment and subsector. Total may differ slightly from sum of rows due to independence of calculation methods
Figure 23 shows a breakdown of industrial motor units by driven equipment. As with the breakdown of motor system electricity consumption, materials processing has the most motor units. It is followed by fans/blowers and pumps. Comparing Figure 21 and Figure 23, air compressors have a larger share of sector electricity consumption than motor counts, indicating that air compressors tend to be larger in size than the other driven equipment.
Figure 23: Breakdown of industrial motor counts by driven equipment
Figure 24 shows the percent of units for each type of driven equipment, further breaking down the driven equipment by technology type. Materials processing and fans/blowers hold the largest share of motor system units in the industrial sector. Combined, these two equipment types constitute 61 percent of the motor systems in the industrial sector. Nearly half (47 percent) of all industrial motor systems are for materials processing or handling.
41
Figure 24: Share of motor system units by driven equipment and technology type for the
industrial sector Both Figure 22 and Figure 24 show that the share of materials handling motor systems (12 percent) is outsized compared to their share of motor system electricity consumption (4 percent). This implies that the materials handling motor systems are small, operate at fewer hours, and/or are lightly loaded relative to the other types of driven equipment. Figure 25 and Figure 26 confirms that materials handling motor systems are both smaller and operate for fewer hours. Figure 25 shows the distribution of size for each driven equipment type, and Figure 26 shows the distribution of annual operating hours for each driven equipment type. As will be seen later, the majority of materials handling motor systems operate at load factors greater than 75 percent and therefore are not more lightly loaded than motor systems used in other driven equipment. On the other end of the spectrum, fan/blower systems generally have smaller motors and higher run hours. The long run hours, combined with the relatively high number of units, lead to relatively high fan/blower motor system electricity consumption compared to other types of driven equipment.
42
Figure 25: Distribution of driven equipment size within the industrial sector. Please refer to Figure 5
for guidance on interpreting box plots.
Figure 26: Distribution of annual run hours by driven equipment for the industrial sector, Please refer
to Figure 5 for guidance on interpreting box plots. Table 16 provides the breakdown of units by driven equipment type and subsector. For 11 of the 22 subsectors, materials processing owns the largest share of motor system units. For nine subsectors, fans and blowers are the largest share.
43
Table 16: Motor system counts (units) by driven equipment type for each industrial subsector. Total may differ slightly from sum of rows due to independence of calculation methods
To examine motor system electricity consumption by application even further, Figure 27 provides the breakdown of motor system electricity consumption by process type. The intention is to provide insights into why industrial facilities use a motor system. The largest identified loads are for air handling. This indicates that the need to ventilate (for both space conditioning and emissions removal) is a significant use of motor systems, accounting for about 20 percent of industrial motor system electricity consumption. The next largest process types are refrigeration/chiller plant (process cooling) and compressed air plant (compressed air for providing force).
Figure 27: Industrial motor system annual electricity consumption by process type
45
Figure 28 shows the breakdown of industrial motor system units by process type. Here, the use of motor systems for ventilation and conditioning is pronounced. Air handling is the dominant process type in terms of motor system units, accounting for about 27 percent of all industrial motor units.
Figure 28: Industrial motor system counts by process type
46
Commercial sector Figure 29 provides the breakdown of motor system electricity consumption by driven equipment for the commercial sector. Refrigeration compressors and fans/blowers are the dominant types of driven equipment in terms of electricity consumption. They are followed by pumps. The electricity consumption for the remaining driven equipment types are one (one-tenth) to two (one one-hundredth) orders of magnitude less than the electricity consumption for fans/blowers or refrigeration compressors.
Figure 29: Commercial motor system annual electricity consumption by driven equipment
47
Figure 30 provides the share of commercial motor system electricity consumption by driven equipment. Forty-eight percent of the motor system load in the commercial sector is for refrigeration compressors. This is followed by fans and blowers at 36 percent of the sector’s motor system electricity consumption. Pumps are third, and when combined with these two driven equipment types, account for 94 percent of commercial sector motor system electricity consumption. Figure 30 provides further insight into the technology type for each driven equipment category. This type of information can provide insights into electrical characteristics, such as start-up loads. It also can provide insight into load control options. Nearly 100 percent of all commercial sector motor system electricity consumption utilizes technologies that can benefit from variable frequency drives, if not already using one.
Figure 30: Share of motor system electricity consumption by driven equipment and technology type
for the commercial sector Table 17 provides the numeric estimates of the breakdown of commercial motor system electricity consumption by driven equipment and subsector. For nine of the fifteen subsectors, refrigeration systems account for the largest share of the commercial sector’s motor system electricity consumption. Fan and blower systems are the leading form of motor system electricity consumption for five of the subsectors. This result provides insight into the major uses of motor systems in the commercial sector: space cooling and ventilation.
48
Table 17: Commercial motor system annual electricity consumption (GWh) by driven equipment and subsector. Total may differ slightly from sum of rows due to independence of calculation methods
Air Compressors
Fan/ Blower
Materials Handling
Materials Processing Pump Refrigeration
Compressors Other and
UTC Total
EDU 1,076 45,620 4 2 6,625 23,012 - 76,339
FSA - 5,224 - - 729 17,689 - 23,643
FSE - 9,334 - - 2,001 23,442 - 34,776
HCI 1,643 9,323 113 183 8,291 11,775 3,431 34,759
HCO 42 13,312 - - 1,434 4,469 829 20,085
LOD 47 9,911 - 1,123 6,642 41,345 122 59,189
MEM 13 17,847 - - 5,262 10,650 - 33,772
MER 71 5,232 183 - - 25,164 - 30,650
OFF 317 34,072 237 - 7,024 44,032 7,653 93,335
OTH 3,385 7,804 - 154 10,059 7,270 - 28,673
PAS 853 14,985 - - 2,395 9,320 - 27,552
POS 638 7,351 35 - 882 2,830 80 11,817
REW - 3,621 - - 603 6,263 - 10,487
SER 3,077 92 - 87 263 3,373 - 6,893
WAS 1,403 8,357 8,711 - 695 20,888 - 40,054
Total 12,564 192,085 9,282 1,549 52,907 251,522 12,115 532,024
49
Figure 31 shows the breakdown of commercial motor units by driven equipment. As with the breakdown of electricity consumption, refrigeration compressors and fans/blowers account for the most motor units.
Figure 31: Breakdown of commercial motor counts by driven equipment
50
Figure 32 shows the percent of units for each type of driven equipment. Figure 32 further breaks down the type of driven equipment by technology type. Similar to the breakdown of electricity consumption, refrigeration compressors and fans and blowers hold the largest share of motor system units in the commercial sector. Combined, these two equipment types account for 86 percent of the motor systems in the commercial sector.
Figure 32: Share of motor system units by driven equipment and technology type for the
commercial sector Figure 33 shows the distribution of size of driven equipment, and Figure 34 shows the distribution of annual operating hours for each driven equipment type in the commercial sector. It is important to view these figures along with the count of motor systems. Although the average horsepower for the “other” category is the largest, and the third quartile for materials handling is nearly the largest, these equipment types have very few motor counts. The average size of fan/blower and air compressor units is small, at 5 hp and 7 hp, respectively. Table 18 provides the numeric values of the breakdown of units by driven equipment type and subsector. Refrigeration compressors and fans/blowers each account for the largest share of driven equipment for seven subsectors. Most subsectors do not have any materials handling. While materials processing is only 3 percent of the commercial sector motor system units, it accounts for 41 percent of the motor system units in the Service subsector. This subsector includes building types like gas stations, car washes, and repair shops. These types of activities require lift, hydraulic, and other process applications. Although looking at the breakdown of consumption and counts by driven equipment across a whole sector provides a high-level snapshot, one must be careful when applying sector-wide trends to a specific subsector, as is evident when considering the Service subsector.
51
Figure 33: Distribution of driven equipment size within the commercial sector. See Figure 5 for guidance on interpreting the box plots.
52
Figure 34: Distribution of annual run hours by driven equipment for the commercial sector. See Figure 5 for guidance on interpreting the
box plots.
53
Table 18: Motor system counts (units) by driven equipment type for each commercial subsector. Total may differ slightly from sum of rows due to independence of calculation methods
Air Compressors
Fan/ Blower
Materials Handling
Materials Processing Pump Refrigeration
Compressors
Other and UTC Total
EDU 96,844 1,847,491 719 719 407,643 949,846 - 3,303,261
SER 529,625 155,152 - 774,325 32,599 400,571 - 1,892,272
WAS 448,721 1,270,074 610,804 1,868 30,026 1,250,302 - 3,611,794
Total 1,430,041 17,135,499 698,462 1,036,867 2,250,304 18,638,065 494,577 41,683,816
54
To examine motor system electricity consumption by use even further, Figure 35 shows the breakdown of commercial sector motor system electricity consumption by process type. The intention is to provide insights into why commercial facilities need to use a motor system. Eighty-six percent of all commercial motor system electricity consumption is for air handling, space cooling, and refrigeration/chiller plants.
Figure 35: Commercial sector motor system annual electricity consumption by process type
Figure 36 breaks down commercial sector motor system units by process type. Similar to the breakdown of electricity consumption, the large majority of commercial sector motor systems, about 91 percent, are for HVAC systems (air handling, refrigeration/chiller plant, and space cooling).
55
Figure 36: Commercial motor system counts by process type
Motor system size breakdown Motor system electricity consumption and count were broken down by motor size category. Size categories are (in hp): 1-5, 6-20, 21-50, 51-100, 101-200, 201-500, 501-1,000, 1,001-2,000, 2,001-5,000, and 5,001+. Industrial sector Figure 37 shows industrial motor system annual electricity consumption by motor size category. Eighty-two percent of the electricity consumption is in the 6-1,000 hp size range, with 71 percent in the 6-500 hp size range. Combined with the 1-5 hp range (comprising 5 percent of industrial electricity consumption) this is a notable size range because it has been used in the past as a demarcation for motor energy efficiency regulations. Very large motors (>1,000 hp) account for 13 percent of the industrial motor system electricity consumption.
56
Figure 37: Industrial motor system annual electricity consumption by size category
The distribution of industrial motor system counts (Figure 38) is very different than the distribution of industrial motor system electricity consumption. Nearly half (49 percent) of the motor systems are 1-5 hp, but these only account for 5 percent of the electricity consumption. Ninety-nine percent of all motor system units are under 500 hp, and less than 0.2 percent are greater than 1,000 hp.
57
Figure 38: Industrial motor system count by size category
58
The estimates underlying Figure 37 and Figure 38 are shown in Table 19.
Table 19: Industrial motor system annual electricity consumption and counts by size category Horsepower Consumption
The Chemicals subsector owns the largest share of industrial motor system annual electricity consumption and counts for motors greater than 1,000 hp, with 28 percent and 25 percent, respectively. The Paper subsector owns the second largest share, with 21 percent and 20 percent, respectively. Figure 39 shows the estimated annual run hours for industrial motor systems by size category. The run hours do not vary significantly across size categories. The exception is the 1,001-2,000 hp category, where the 25 percent quartile is nearly as high as the 75 percent quartile for the other size categories. The relatively small number of motor systems in this size category could be skewing the data.
Figure 39: Distribution of annual run hours for industrial motor systems by size category.
See Figure 5 for guidance on interpreting the box plots.
59
Commercial sector Commercial motor system electricity consumption by motor size category is shown in Figure 40. The majority of the electricity consumption is in the 1-50 hp size range (80 percent). Specifically, 36 percent of the motor system electricity consumption is in the 6-20 hp size range. Small motors (1-5 hp) account for 22 percent of the sector’s motor system electricity consumption. Very large motors (>1,000 hp) are not a major source of motor system electricity consumption, only accounting for 2 percent.
Figure 40: Commercial motor system annual electricity consumption by size category
The distribution of commercial motor system units by size category (shown in Figure 41) is similar to the distribution of the sector’s motor system electricity consumption by size category. Both are skewed toward smaller motors. A major difference is that the peak size category is 6-20 hp for electricity consumption but 1-5 hp for counts. Sixty-six percent of commercial motor system units fall in the 1-5 hp category, followed by 28 percent in the 6-20 hp category. Ninety-nine percent of commercial motor systems greater than 1 hp are under 50 hp.
Figure 41: Commercial motor system counts by size category
60
The estimates underlying Figure 40 and Figure 41 are shown in Table 20.
Table 20: Commercial motor system annual electricity consumption and counts by category Horsepower Consumption
The annual run hours for commercial motor systems by size category is shown in Figure 42. Across horsepower size categories, the average is generally between 2,100 hr and 3,700 hr, and the median is between 2,100 hr and 3,500 hr.
Figure 42: Distribution of annual run hours for commercial motor systems by size category.
See Figure 5 for guidance on interpreting the box plots.
61
DC motor system demographics It is estimated that there are 806,000 DC motor systems greater than or equal to 1 hp consuming 31,000 GWh annually in the industrial and commercial sectors. This represents 2 percent of all motors and 3 percent of total annual motor system electricity consumption in the industrial and commercial sectors. The breakdown of DC motors by industrial and commercial subsectors are provided below. Industrial sector DC motor systems in the industrial sector are estimated to consume about 24,000 GWh annually. The breakdown by industrial subsector is shown in Figure 43. The Plastics/Rubber, Paper, and Primary Metal subsectors are estimated to have the highest DC motor system electricity consumption, accounting for approximately 73 percent of the sector’s overall DC motor system electricity consumption.
Figure 43: DC motor system annual electricity consumption in the industrial sector
There are an estimated 584,000 DC motor system units in the industrial sector. Figure 44 shows the breakdown by industrial subsector. The Machinery subsector has the most DC motor system units and accounts for 56 percent of systems in the industrial sector.
62
Figure 44: DC motor system counts in the industrial sector
Due to the low number of DC motor systems observed during the assessments, conducting deeper analysis and examining trends risks overextending the statistical validity of the findings. For this reason, further breakdown of electricity consumption, run hours, or other characteristics are not examined further. However, to better understand the applications of DC motor systems, the electricity consumption and counts by end use is presented as a percent of total sector DC motor system electricity consumption and counts (rather than an absolute electricity consumption value or number of units). Figure 45 shows the breakdown of applications of industrial DC motor systems as a percent of industrial DC motor system electricity consumption. Extrusion and material shaping applications comprise 50 percent of all industrial DC motor system electricity consumption.
Figure 45: DC motor system electricity consumption by end use application for the industrial sector
63
The breakdown of applications of industrial DC motor systems as a percent of industrial DC motor counts is shown in Figure 46. The breakdown is quite different than the breakdown by electricity consumption in Figure 45. Seventy percent of all industrial DC motors are used in air handling applications. Extrusion and materials shaping, which accounted for 27 percent and 23 percent of industrial DC motor system electricity consumption, respectively, only accounts for 3 percent and 5 percent of DC motor units respectively, implying that the extrusion and materials shaping motors are either much larger and/or have much longer run hours than their air handling counterparts.
Figure 46: DC motor system counts by end use application for the industrial sector
Commercial sector DC motor systems in the commercial sector are estimated to consume about 6,600 GWh annually. The breakdown by commercial subsector is shown in Figure 47. Subsectors with no estimated DC motor system electricity consumption have been omitted from Figure 44. The Office subsector accounts for approximately 88 percent of the commercial sector’s overall DC motor system electricity consumption.
64
Figure 47: DC motor system annual electricity consumption by subsector in the commercial sector. Subsectors with no estimated DC motor system electricity consumption have been omitted. These
are: EDU, FSA, FSE, LOD, MEM, MER, POS, REW, SER, and WAS.
There are an estimated 222,000 DC motor system units in the commercial sector. Figure 48 shows the breakdown by commercial subsector. Subsectors without any observed DC motor systems have been omitted from the figure. As with electricity consumption, the Office subsector has the most DC motor system units, accounting for 70 percent of the systems in the sector.
65
Figure 48: DC motor system counts in the commercial sector by subsector. Subsectors with no
observed DC motor systems have been omitted. These are: EDU, FSA, FSE, LOD, MEM, MER, POS, REW, SER, and WAS.
Similar to the industrial sector, a low number of DC motors were observed in the commercial sector. In order to not overextend the findings, no further breakdown on absolute electricity consumption or counts for DC motor systems in the commercial sector is presented. However, to better understand the applications of DC motor systems in the commercial sector, percent breakouts by electricity consumption and counts by end use are detailed below. The breakdown of applications of commercial DC motor systems as a percent of commercial DC motor system electricity consumption is shown in Figure 49. The overwhelming majority of DC motor system electricity consumption is for unclassified or miscellaneous applications.
66
Figure 49: DC motor system electricity consumption by end use application for the
commercial sector
The breakdown of applications of commercial DC motor systems as a percent of commercial DC motor counts is shown in Figure 50. Similar to Figure 49, the majority of commercial DC motor system units are for unclassified or miscellaneous applications. However, nearly 30 percent of commercial DC motor systems are used in air handling applications.
Figure 50: DC motor system counts by end use application for the commercial sector
67
Motor age This section will present results on the age of the installed stock of industrial and commercial three-phase motor systems greater than or equal to 1 hp. The age of the motor is an indication of its energy efficiency level, possible maintenance history, and ability to adopt new technologies (e.g., smart sensors and controls). Industrial sector Due in large part to illegible nameplates, the age of 63 percent of the industrial motors assessed could not be determined (see Figure 51). In cases where the nameplate was legible, the age may not have been discernible. Of the remaining 37 percent of motors, the largest share (16 percent) were fewer than 10 years old. For older motors with illegible nameplates, the likelihood that the facility staff will know the installation date of a motor preceding their employment at the facility reasons to be low. Therefore, it can be inferred that a large percentage of the motors listed as UTC are older motors (i.e., greater than 10 years old). The distribution of size within each age range is fairly uniform and approximately follows the overall distribution of motor sizes in the industrial sector. For example, nearly half the motors within any size range, including those that were undetermined, were 1-5 hp. This is approximately the same percent of motors that are 1-5 hp across the entire industrial sector (49 percent).
Figure 51: Age of industrial motor systems broken down by size. Compared to Figure 4, UTC in this figure includes UTC, illegible nameplates, and some nameplates that were legible but the age
still could not be determined.
68
Commercial sector Due in large part to illegible nameplates, the age of 50 percent of the commercial motors assessed was undeterminable, as shown in Figure 52. Considering the percent of motors with illegible nameplates (69 percent, as shown in Figure 4), secondary sources of information successfully identified the age of 19 percent of the commercial motors assessed. Of the remaining 50 percent of commercial motor systems assessed, 22 percent were under 10 years old, and 21 percent were between 10 and 20 years old. Similar to the industrial sector, the size breakdown within any size range follows the size breakdown across the commercial sector. Nearly all the motors in any age range are under 50 hp, with most between 1 and 5 hp.
Figure 52: Age of commercial motor systems broken down by size
Comparison to previous report To better understand the changes in motor system demographics over time, the results from this MSMA were compared to the previous MSMA (2002 report) for the industrial sector. Comparisons to the previous commercial motor system study were not made since it utilized a different methodology and did not rely on primary data collection. Overall, the manufacturing sector’s motor system annual electricity consumption is far less in 2020 than it was in 2002. Correcting for inclusion of HVAC systems in the current estimate and exclusion in the 2002 assessment, the sector’s non-HVAC motor system electricity consumption is about 435,000 GWh (determined by subtracting air handling and space cooling loads from the industrial total). This represents a 25 percent reduction in motor system electricity consumption. While some of this reduction is likely due to structural changes in the manufacturing sector (e.g., offshoring, mergers, contraction), some is also due to improvements in energy efficiency.
69
The 2002 assessment utilized the Standard Industrial Classification (SIC) system, and this assessment utilizes the North American Industry Classification System (NAICS). However, at the level of classification utilized in both reports (two-digit SIC and three-digit NAICS), the crosswalk between the two classification systems results in minimal loss of fidelity. Table 21compares the top 10 motor system electricity consuming sectors in 2002 and 2020. For the most part, the subsectors in the top 10 are consistent. Two exceptions are the Textile Mill and the Electronic and Other Electric Equipment subsectors, which ranked ninth and tenth, respectively, in 2002. Neither rank in the top 10 in the current assessment. The Fabricated Metals subsector and the Nonmetallic Minerals subsector were ranked in the top 10 in the current assessment but were not in the top 10 in the previous study. It should be noted that the previous study estimated that the motor system annual electricity consumption for the SIC subsector that best aligns with Nonmetallic Minerals (Stone, Clay, and Glass products) was 10 percent of the estimated motor system electricity consumption from MECS. If the MECS estimate were used, it would rank in the top 10 in the 2002 survey. The Municipal Wastewater subsector was not surveyed in 2002. In this survey, it is estimated that its motor system electricity consumption would rank between the Nonmetallic Mineral and Fabricated Metal subsectors.
Table 21: Rank (high to low) of industrial subsectors by motor system annual electricity consumption as estimated in the 2002 and 2020 MSMA
Rank 2002 2020
1 Chemical and Allied Chemicals 2 Paper and Allied Primary Metals (all) 3 Primary Metals Food 4 Petroleum and Coal Paper and Pulp 5 Food and Kindred Plastics and Rubber 6 Rubber and Misc. Plastics Petroleum and Coal 7 Transportation Equipment Transportation 8 Lumber and Wood Nonmetallic Mineral 9 Textile Mill Fabricated Metals 10 Electronic and Other
Electric Equipment Wood
Total (GWh) 575,430 546,963 Table 22 shows the breakdown of industrial motor system electricity consumption by driven equipment for the current and previous assessment. Some of the differences between the two may be attributed to the inclusion of HVAC in the current assessment. Specifically, this could be causing the 85 percent increase in observed refrigeration compressors. The current assessment included split air conditioning systems that utilize a central cooling plant. The differences in materials handling and materials processing between the two assessments could be attributed to how the assessment teams classified these systems. The sum of the two are nearly the same between the two assessments (35 percent in 2002 and 33 percent in 2020).
70
Table 22: Share of industrial motor driven equipment annual electricity consumption Driven
Equipment 2002* (%) 2020* (%) % Change in Share
Air Compressors 16 12 -4
Fans/blowers 14 21 +7
Pumps 25 21 -4
Refrigeration Compressors 7 12 +5
Materials Handling 12 4 -4
Materials Processing 23 29 +6
Other 4 1 -3
Total 100 100 Note: HVAC equipment was included in the 2020 assessment but not in the 2002 assessment
Table 23 shows the breakdown of industrial motor system electricity consumption and counts for the 2002 and current MSMA. The overall trends are similar: the majority of the electricity consumption is for motor systems greater than 5 hp, and the majority of the units are 1-20 hp, with the largest percentage in the 1-5 hp size range.
Table 23: Comparison of shares of industrial motor system electricity consumption and counts between the 2002 and 2020 MSMAs
• Industrial and commercial three-phase motor systems greater than or equal to 1 hp consume ~1,079 TWh/year, about 29 percent of total electric grid load see Figure 6).
o Industrial: 546,963 GWh/year, about 69 percent of all electricity consumption and 13 percent of overall energy consumption in the sector (see Table 11)
o Commercial: 532,016 GWh/year, about 43 percent of all electricity consumption and 26 percent of overall energy consumption in the sector (see Table 13)
• Motor system electricity consumption in the industrial sector has reduced by 25 percent since the previous (2002) assessment.
• Sixty-two percent of the industrial subsector’s estimated annual motor system electricity consumption resides in the top six subsectors, with the Chemicals subsector (105,699 GWh) being the largest (see Table 11).
• Twenty-nine percent of all industrial sector motor system electricity consumption is for materials processing, followed by 21 percent for pumps and fans/blowers each (see Table 15).
• Seventy-five percent of industrial motor system electricity consumption is attributed to 1-500 hp motor systems (see Table 19).
• Seventy percent of the commercial subsector’s estimated annual motor system electricity consumption resides in the top seven subsectors, with the Office subsector (93,334 GWh) being the largest (see Table 13).
• Forty-eight percent of all commercial sector motor system electricity consumption is for refrigeration compressors. Refrigeration compressors, fans/blowers, and pumps account for 94 percent of the sector’s electricity consumption (see Table 17).
• Eighty percent of commercial sector motor system electricity consumption is attributed to the 1-50 hp size range (see Table 20).
Motor system counts and size
• There are 52.5 million motor systems greater than or equal to 1 hp in the industrial and commercial sectors, with 10.8 million in industrial and 41.7 million in commercial facilities (see Figure 7).
• The average connected motor system horsepower at a facility is 1,595 for the industrial sector and 89 for the commercial sector (see Figure 8).
• Average motor size is 27 hp for industrial and 8 hp for commercial (see Table 12 and Table 14).
• Sixty-two percent of the industrial sector’s estimated motor system units reside in the top six subsectors, with Machinery (2 million) accounting for the most (see Table 12).
• Seventy-four percent of the commercial sector’s estimated motor system units reside in the top seven subsectors, with the Mercantile: Enclosed mall and strip mall subsector (6.3 million) accounting for the most units (see Table 14).
• Ninety-nine percent of the motor system units in the industrial sector are in the 1-500 hp range, with 49 percent in the 1-5 hp range (see Table 19).
• Ninety-nine percent of the motor system units in the commercial sector are in the 1-50 hp size range (see Table 20).
72
DC motor systems:
• DC motors accounted for 4 percent of industrial and 1 percent of commercial motor system electricity consumption and 5 percent of industrial and 0.5 percent of commercial motor system counts.
73
Operating characteristics This section summarizes findings related to operating characteristics of industrial and commercial motor systems greater than or equal to 1 hp. Specifically, findings related to load factor, load control, and transmission type are summarized. Additionally, findings related to energy management and maintenance practices are summarized. A summary of highlights for each of these topics is presented at the end of this section. Where tables are presented showing horsepower ranges, parenthesis (e.g., “(“) are used to indicate the range excludes the bound whereas square brackets (e.g., “[“) are used to indicate the range includes the bound. For example, “[6.0 – 21.0)” means that the range includes 6.0 but excludes 21.0. Motor load factor For the MSMA, the motor load factor was defined as the ratio of average motor output power to the motor’s rated power. For example, a motor rated at 100 hp but only operating at 40 hp would have a load factor of 0.4. Within the limitations of a one- or two-day assessment, the load factors of the motor observed were estimated. The MSMA team went through iterations to identify the best method using available resources to get an understanding of typical load factors for each motor observed. Rather than utilizing spot measurements, which may not be representative of the typical load factor and are time consuming to gather, facility staff were queried to estimate the motor load factor and if the load was constant or variable. Staff were provided detailed guidance on how to estimate load factor. For the MSMA, “variable” load is defined as a load that modulates during operation. “Constant” load is defined as a load that remains constant during operation. Variable and constant load are not related to duty/cycling factor. Duty/cycling factor describe the percent of time that the motor is energized (i.e., operational at any load). This has been included in the summary of the installed base when determining run hours. Where no determination of motor load factor could be made, a default value of 0.75 was used based on the assumption that the motor was appropriately sized. The findings on motor load factor are provided below, split between the industrial and commercial sector. Within each sector, the load factor estimates are broken down by motor system electricity consumption and counts, and further by motor size range and driven equipment. The load factors presented here are not for the overall system, but of the motor itself. Attempts to understand the motor system load factor (i.e., output work performed by the system relative to the rated output work) yielded unreliable data with high nonresponse rates. Industrial sector Figure 53 shows the breakdown of motor load factor by industrial motor system annual electricity consumption. The largest share of motor system annual electricity consumption falls under systems that use motors that are variably loaded with a load factor between 0.4-0.75, accounting for 27 percent of industrial motor system electricity consumption. Conversely, very little industrial motor system electricity consumption falls under systems that use motors operating at constant loads, with a load factor less than 0.4 (1 percent). The second smallest category is variably loaded systems with a motor load factor under 0.4 (5 percent). This indicates that a relatively small fraction of industrial motor system annual electricity consumption is attributable to oversized motors. Overall, 38 percent of industrial motor system annual electricity
74
consumption is attributable to variably loaded motors, and 45 percent is attributable to constantly loaded motors.
Figure 53: Industrial motor load factors in terms of industrial sector motor system annual
electricity consumption Table 24 provides estimates of industrial motor system annual electricity consumption by motor load factor for various motor size ranges and driven equipment types. Thirty-seven percent of industrial motor system annual electricity consumption for motor systems under 50 hp is attributable to systems that operate at a constant motor load greater than 0.75. This changes for motors above 50 hp. Thirty-one percent of industrial motor system annual electricity consumption for motor systems greater than 50 hp is attributable systems that operate at variable motor loads between 0.4 and 0.75. The breakdown by driven equipment in Table 24 provides insight into how driven equipment is operated. Seventy-one percent of industrial air compressor electricity consumption is from motors that operate at variable loads greater than 0.4. Thirty-two percent of industrial pumping is from motors operating at constant loads greater than 0.75; the same holds true for fan/blower systems. Twenty-nine percent of material processing electricity consumption and 40 percent of refrigeration electricity consumption is from motors operating at variable loads between 0.4 and 0.75, respectively.
75
Table 24: Motor load factors for industrial sector motor system annual electricity consumption (GWh) by size range and driven equipment type
By Driven Equipment Air Compressor - 908 4,406 4,418 21,099 22,130 7,966 Pump 795 20,883 40,106 5,435 22,927 8,430 24,903 Fan and Blower 739 22,426 37,350 3,946 26,253 11,486 15,360 Material Handling 24 4,482 4,634 1,815 2,685 992 5,200 Material Processing 1,363 19,638 34,113 11,904 41,465 7,856 25,254 Refrigeration Compressor 78 1,830 6,583 1,891 26,749 20,333 8,638
Other - 286 2,171 41 1,710 722 1,977 Total 2,999 70,453 129,363 29,450 142,888 71,949 89,298 % of industrial total 1% 13% 24% 5% 27% 13% 17%
76
Figure 54 provides a breakdown of motor load factor by number of motor system units. Constant load systems operating at motor load factors greater than 0.75 dominate the installed base, representing 42 percent of all industrial motor systems. Overall, there are nearly twice as many constant motor load systems as variable load systems. Significantly underloaded motors (variable or constant under 0.4 load factor) only comprise 8 percent of the industrial motor system units.
Figure 54: Motor load factor for industrial sector motor systems (number of units)
Table 25 provides the breakdown of industrial motor system units by motor load factor for various horsepower size ranges and driven equipment types. Forty-three percent of all industrial motor systems under 100 hp use constant load motors greater than 0.75. Twenty-seven percent of industrial motor systems between 101-5,000 hp use motors operating under variable loads between 0.4 to 0.75, representing the largest fraction of motor load types for this horsepower size range. For the largest motor systems observed (>5,000 hp), 33 percent use constant load motors operating between 0.4 to 0.75, representing the largest fraction of motor load types for this horsepower size range. Across all driven equipment types, the most common operating condition is estimated to be constant motor load systems operating at 0.75 load factor. The majority of air compression (56 percent) and refrigeration compression (58 percent) systems are variably loaded. The majority of pump (65 percent), fan/blower (61 percent), materials handling (52 percent), and materials processing (66 percent) systems operate under constant load.
77
Table 25: Motor load factor for industrial sector motor systems units by size range and driven equipment type Constant
By Driven Equipment Air Compressor - 8,869 75,007 41,235 62,934 69,422 54,434 Pump 15,912 413,154 689,093 99,128 213,667 120,173 172,683 Fan and Blower 29,255 666,805 1,173,935 139,609 485,928 276,284 308,833 Material Handling 717 177,612 433,370 248,375 187,766 39,080 99,431 Material Processing 17,060 444,638 1,965,388 241,366 439,477 244,354 349,669 Refrigeration Compressor 395 52,966 183,427 28,787 206,947 147,585 45,416 Other - 24,002 34,820 619 124,402 28,925 54,444 Total 63,339 1,788,045 4,555,039 799,119 1,721,122 925,824 1,084,910 % of Total Industrial 1% 16% 42% 7% 16% 8% 10%
78
Figure 55 shows the average motor load factor by size for industrial motor systems. The average motor load factor is slightly lower for motor systems greater than 500 hp than it is for motor systems less than 500 hp.
Figure 55: Average motor load factor for industrial sector motor systems by size
Commercial sector Figure 56 shows the motor load factor by commercial sector motor system annual electricity consumption. The largest share of commercial sector motor system annual electricity consumption is for systems that use variably loaded motors with a load factor between 0.4-0.75, accounting for 35 percent of the sector’s motor system electricity consumption. Conversely, very little (0.1 percent) of commercial sector motor system electricity consumption is for systems that use motors operating at constant loads with a load factor less than 0.4. The second smallest category (3 percent) is variably loaded systems operating with a motor load factor under 0.4. Similar to the findings from the industrial sector, this indicates that a relatively small fraction of commercial motor system electricity consumption is attributable to oversized motors. Overall, 60 percent of commercial motor system electricity consumption is attributable to variably loaded motors, and 35 percent is attributable to constantly loaded motors.
79
Figure 56: Motor load factors for commercial sector motor system annual electricity consumption
Table 26 provides estimates of commercial sector motor system annual electricity consumption by motor load factor for various motor size ranges and driven equipment types. Similar to the industrial sector, there is a size cutoff below which the majority of motor systems use constantly loaded motors and above which they are variably loaded. Forty-three percent of commercial motor system electricity consumption for motor systems under 5 hp use motors operating at a constant load greater than 0.75. This changes for motors above 5 hp. Forty percent of commercial motor system electricity consumption for motor systems above 5 hp use motors operating at variable loads between 0.4 and 0.75. Table 26 also shows the motor load breakdown by driven equipment and provides insight into how driven equipment is operated. Thirty-seven percent (by electricity consumption) of commercial air compression, fan/blower, materials processing, and refrigeration compression systems use motors operating at variable loads between 0.4-0.75. Forty percent (by electricity consumption) of commercial sector pumping systems use motors operating at constant loads greater than 0.75. Fifty-seven percent (by electricity consumption) of materials handling systems use motors operating at variable loads less than 0.4.
80
Table 26: Load factors for commercial sector motor system electricity consumption by size range and driven equipment type Constant
By Driven Equipment Air Compressor - 1,480 4,504 240 6,886 912 127 Pump 32 8,901 22,314 4,928 10,782 5,936 2,805 Fan and Blower 91 27,019 62,095 3,557 66,944 19,382 5,650 Material Handling - 329 34 5,384 1,784 1,908 - Material Processing - 77 219 - 314 - 647 Refrigeration Compressor 479 14,813 34,641 3,237 90,508 77,587 17,985 Other - - 216 - 615 5,776 122 Total 602 52,619 124,023 17,346 177,833 111,501 27,336 % of commercial total 0% 10% 24% 3% 35% 22% 5%
81
Figure 57 provides the breakdown of motor load factor by number of motor system units. Systems using variable load motors operating at load factors between 0.4 and 0.75 represent 30 percent of all commercial sector motor systems, followed by constant load systems operating at motor load factors greater than 0.75, at 28 percent. Overall, there is a fairly balanced breakdown between constant load (49 percent) and variable load (46 percent) systems. Significantly underloaded systems (variable or constant under 0.4 load factor) only comprise 3 percent of the commercial motor system units.
Figure 57: Motor load factor for commercial sector motor systems (number of units)
Table 27 provides the breakdown of commercial sector motor system units by motor load factor for various horsepower size ranges and driven equipment types. Thirty-five percent of all commercial motor systems under 5 hp operate at constant loads greater than 0.75, representing the largest fraction of load types for this size range. Forty-three percent of commercial motor systems above 5 hp operate at variable loads between 0.4 to 0.75, representing the largest fraction of load types for this size range. For commercial air compressor, fan/blower, and pump system units, the most common operating condition is estimated to be constant load systems operating at 0.75 motor load factor. For materials handling and refrigeration compression systems, the most common operating condition is estimated to be variable motor load between 0.4 and 0.75. The most common operating condition for materials processing systems is constant load with a motor load factor between 0.4 and 0.75. The majority of air compression (80 percent), pump (78 percent), fan/blower (72 percent), and materials processing (74 percent) system units are variably loaded. The majority of materials handling (92 percent) and refrigeration compression (77 percent) systems operate under constant load conditions.
82
Table 27: Motor load factors for commercial sector motor systems units by size range and driven equipment type Constant
By Driven Equipment Air Compressor - 394,132 1,073,020 1,977 285,677 77,966 4,746 Pump 2,178 664,450 1,307,507 85,579 269,595 83,102 123,464 Fan and Blower 6,246 5,673,811 7,491,310 225,865 2,437,664 1,921,421 600,809 Material Handling - 40,286 17,539 218,544 240,959 184,869 - Material Processing - 646,222 16,834 - 10,055 - 224,106 Refrigeration Compressor 17,720 1,245,137 1,185,550 639,144 8,996,255 2,829,539 1,207,560 Other - 1,089 129,306 - 16,008 156,053 35,011 Total 26,144 8,665,127 11,221,067 1,171,109 12,256,213 5,252,950 2,195,696 % of Total Commercial 0% 21% 28% 3% 30% 13% 5%
83
Figure 58 shows the average motor load factor by size for commercial motor systems. The average motor load factor for motor systems less than 50 hp is greater than it is for motor systems greater than 50 hp.
Figure 58: Average motor load factor for commercial sector motor systems by size
Load control The load control technology for all motor systems surveyed was documented. Table 28 specifies the terms for the load control technology categories and options used in this report. For this section, the load control technologies were grouped into “VFD,” “all others,” and “none.” To focus on load control technologies, load control strategies were categorized as “none,” since these are not technology-based strategies. Further, VFD was categorized separately from other load control technologies due to its dominance in terms of uptake of load control technologies.
84
Table 28: Load control technology types surveyed and the categorization used in this report Category Options
VFD • Variable frequency drive • Multiple methods that include VFD
All others • Inlet vane/damper • Variable displacement • Hydraulic drive • Multiple methods without VFD • Mechanical drive • Slide valve • Adjustable speed gearbox • Eddy current drive • None of the above
None • Constant load (without any control) • On/off cycling • Multispeed motor • Outlet damper • Bypass or open flow • Throttle valve • Load/unload • Periodic material loading
UTC Unable to collect. The control technology was undeterminable.
Industrial sector Per Figure 59, 16 percent of industrial motor system capacity uses VFDs. Seventy-four percent have no load control technology/equipment. Across the subsectors, VFD penetration rates vary. The Beverage and Tobacco (37 percent), Chemicals (35 percent), Printing (32 percent), Plastics/ Rubber (31 percent), and Wastewater (27 percent) subsectors have the highest penetration rates of VFDs among the industrial subsectors. Some of the subsectors with low penetration rates of VFDs are among the highest in overall industrial motor system electricity consumption: Paper (7 percent), Primary Metals (7 percent), and Nonmetallic Minerals (8 percent).
85
Figure 59: Penetration rates of VFDs and other load control technologies by industrial subsector. See Figure 12 for the distribution of
connect hp per facility for the industrial subsectors. Annotations show the corresponding percent for each segment for shares greater than 5%.
86
The penetration rates of VFDs and other load control technologies by large and medium-size facilities largely follow the sector-wide penetration rates. However, the penetration rate among small facilities (8 percent) is half of the sector-wide penetration rate (Figure 60).
Figure 60: Penetration rates of VFDs and other load control technologies by industrial facility size.
Unlabeled segments are < 5%. Figure 61 shows the breakdown of load control technologies for industrial motor system electricity consumption by size range. In general, the uptake of VFDs and other control technologies increases with the size of the industrial motor system. Seventy-three percent of the electricity consumption for 1-5 hp motors is without any load control technology, whereas only 41 percent of the electricity consumption for 501-1,000 hp is without any load control technology. As motor system size increases, not only does the uptake of VFDs increase, but the uptake of all other control technologies also increases. Only 6 percent of industrial motor system electricity consumption in the 1-5 hp range uses a non-VFD control technology, whereas 27 percent of industrial motor system electricity consumption in the 501-1,000 hp size range uses a non-VFD control technology. VFD uptake for the largest motor systems (i.e., greater than 1,000 hp) is the lowest of any motor system size range. This may be due to the unavailability of commercially available VFDs for large medium-voltage motor systems. Figure 62 shows the breakdown of load control technologies for industrial motor systems by size range. The trends are the same as the trends for industrial motor system electricity consumption (Figure 61).
87
Figure 61: Penetration rates of VFDs and other control technologies by motor size in terms of percentage of industrial motor system
electricity consumption. See Figure 12 for the distribution of connect hp per facility for the industrial subsectors. Annotations show the corresponding percent for each segment for shares greater than 5%.
88
Figure 62: Penetration rates of VFDs and other control technologies by motor size in terms of percentage of industrial motor system counts. See Figure 12 for the distribution of connect hp per facility for the industrial subsectors. Annotations show the
corresponding percent for each segment for shares greater than 5%.
89
Figure 63 shows the penetration rates of VFDs and other control technologies broken down by equipment type in terms of industrial motor system electricity consumption. Aside from the “other” category, the penetration rates of VFDs are fairly similar across equipment types; about 23 percent of industrial motor system electricity consumption. However, there is large variation in the uptake of other control technologies, ranging from 31 percent for refrigeration compressor systems to 1 percent for pump systems.
Figure 63: Penetration rates of VFDs and other control technologies by equipment type in terms of industrial motor system electricity consumption. Annotations show the corresponding percent for
each segment for shares greater than 5%. Figure 64 shows penetration rates of VFDs and other control technologies by equipment type in terms of the percent of system counts. The penetration rate of VFDs in terms of system counts is less than the penetration rates in terms of electricity consumption for most equipment types (aside from Air Compressor and Other, for which they are nearly the same). This implies that larger motor systems are more likely to be fitted with VFDs than smaller systems. This is consistent with the findings shown in Figure 62.
90
Figure 64: Penetration rates of VFDs and other control technologies by equipment type in terms of industrial motor system counts. Annotations show the corresponding percent for each segment for
shares greater than 5%. Figure 65 shows the metric used to control VFDs on industrial air compressor, fan/blower, pump, and refrigeration compressor systems. Across all systems, pressure or temperature setpoints are the most commonly used control metric. Commercial sector Overall, 4 percent of commercial motor systems use VFDs and 91 percent have no load control technology/equipment. Across the subsectors, the penetration rates of VFDs are generally low. Aside from the Health Care: Inpatient (19 percent) and the Education (15 percent) subsectors, the VFD penetration rate is less than 8 percent. Many subsectors — Food Sales, Food Service, Mercantile: Enclosed and Strip Malls, and Other/Vacant — had negligible (i.e., ~0 percent) VFD penetration rates. See Figure 66 for details.
91
Figure 65: VFD control feedback for industrial air compressors, fans/blowers, pumps, and refrigeration compressors as a percentage of system counts
92
Figure 66: Penetration rates of VFDs and other load control technologies by commercial subsector. See Figure 17 for the distribution of
connect hp per facility for the industrial subsectors. Annotations show the corresponding percent for each segment for shares greater than 5%.
93
Figure 67 shows the penetration rates of VFDs and other load control technologies by commercial facility size. The penetration rates decline with facility size, falling from 10 percent for large facilities to 2 percent for small facilities.
Figure 67: Penetration rates of VFDs and other load control technologies by commercial facility size. Annotations show the corresponding percent for each segment for shares greater than 5%.
Figure 68 shows the breakdown of load control technologies for commercial sector motor system electricity consumption by size range. Similar to the industrial sector, the uptake of VFDs and other control technologies generally increases with the size of the commercial motor system. Less than 4 percent of the electricity consumption for 1-5 hp motors has any load control technology, whereas 44 percent of the electricity consumption for 101-200 hp motors has a load control technology. As motor system size increases, not only does the uptake of VFDs increase, so does the uptake of all other control technologies, peaking at 31 percent for the 501-1,000 hp size range. This may be due to the unavailability of commercially available VFDs for large medium-voltage motor systems. Also, as was shown in Figure 41, very little commercial motor system electricity consumption resides in motor systems greater than 500 hp. Figure 69 shows the breakdown of load control technologies for commercial motor systems by size range. The trends are the same as the trends for the electricity consumption breakdown (Figure 68).
94
Figure 68: Penetration rates of VFDs and other control technologies by motor size in terms of percentage of commercial sector motor system electricity consumption. Annotations show the
corresponding percent for each segment for shares greater than 5%.
Figure 69: Penetration rates of VFDs and other control technologies by motor size in terms of
percentage of commercial motor system count. Annotations show the corresponding percent for each segment for shares greater than 5%.
95
Figure 70 shows the penetration rates of VFDs and other control technologies broken down by equipment type in terms of commercial sector motor system electricity consumption. The penetration rates vary across equipment types. The VFD penetration rate is relatively high for fan/blower (37 percent) and pump (39 percent) systems, but negligible for all other systems except refrigeration compressor systems (8 percent). As was shown in Figure 29, fan/blower, pump, and refrigeration compressor systems account for the majority of commercial sector motor system electricity consumption. Considering this, the low penetration rates for other equipment types could be due to low representation from those equipment types. Figure 71 shows penetration rates of VFDs and other control technologies by equipment type in terms of the percent of systems with these technologies in the commercial sector. The penetration rate of VFDs in terms of system counts is less than the penetration rates in terms of electricity consumption for most equipment types. This implies that larger motor systems and/or systems with longer run hours are more likely to be fitted with VFDs than smaller systems are. This is consistent with the findings shown in Figure 62. Figure 72 shows the metric used to control VFDs on commercial sector air compressor, fan/blower, pump, and refrigeration compressor systems. For air compressor, fan/blower, and pump systems, pressure setpoint is the most common control metric. HVAC factors, such as ambient temperature, are the most common control metric for commercial sector refrigeration systems.
96
Figure 70: Penetration rates of VFDs and other control technologies by equipment type in terms of commercial sector motor system
electricity consumption. Annotations show the corresponding percent for each segment for shares greater than 5%.
97
Figure 71: Penetration rates of VFDs and other control technologies by equipment type in terms of commercial motor system counts.
Annotations show the corresponding percent for each segment for shares greater than 5%.
98
Figure 72: VFD control feedback for commercial air compressors, fans/blowers, pumps, and refrigeration compressor.
99
Transmission type To completely characterize the motor systems assessed, the transmission used to convey the shaft power was recorded. Results for industrial motor systems are summarized in Figure 73 in terms of industrial sector motor system electricity consumption and units. Direct drive was the most common transmission type observed. The next most common are some type of belt drive (V belt, cog, or unknown). When the belt type was determinable, V belts were four times more common than cog belts (4 percent versus 1 percent of either industrial motor system units or electricity consumption). Gearboxes are used by 8 percent of all industrial motor systems (7 percent of all industrial motor system electricity consumption).
Figure 73: Transmission type for industrial motor systems by counts (top) and electricity
consumption (bottom). Figure 74 provides the breakdown of transmission types by driven equipment in the industrial sector. When the transmission type was known, direct shaft was the most common connection, except for materials handling motor systems. For these systems, gearboxes outpaced all other transmission types.
100
Figure 74: Breakdown of transmission type by driven equipment in the industrial sector. Breakdowns are provided for % of counts and % of electricity consumption. From top left clockwise: refrigeration compressors, materials processing, air compressors, fans/blowers,
pumps, and materials handling.
101
Figure 75 summarizes the transmission types for commercial sector motor systems. Similar to the industrial sector’s motor systems, the most common transmission type is direct drive (44 percent of units and 46 percent of electricity consumption). Twenty-seven percent of commercial motor systems use belts (27 percent of the sector’s motor system electricity consumption). When determinable, V belts were observed far more frequently than cog belts (12 percent versus 4 percent of motor system units).
Figure 75: Transmission type for commercial motor systems by counts (top) and electricity
consumption (bottom). Figure 76 provides a breakdown of transmission types by motor driven system in the commercial sector. Unlike the industrial sector, transmission types by driven equipment are more varied in the commercial sector. While direct shaft is common across all equipment types, and gearboxes are the most common for materials handling, other transmission types constitute a majority share for other equipment types (e.g., belts for fans/blowers). Further, the most common transmission type by electricity consumption may not be the most common by motor count for a given equipment type (e.g., air compressors).
102
Figure 76: Breakdown of transmission type by driven equipment in the commercial sector. Breakdowns are provided for % of counts and
% of electricity consumption. From top left clockwise: refrigeration compressors, materials processing, air compressors, fans/blowers, pumps, and materials handling.
103
Energy management practices A survey of energy management practices was conducted as part of the facility assessments. The intent was to understand the organizational environment under which motor systems operate. This can provide insights into the adoption and maintenance of energy efficiency measures. Summarized here are responses to the consideration of energy efficiency in design and procurement, where motor system decisions are made, type of staff overseeing motor system energy management, methods for determining motor system energy efficiency measures, and existence of motor system inventories. Procurement and Design Figure 77 details whether or not energy efficiency is considered in the procurement of motor systems in industrial facilities. Overall, 49 percent of industrial facilities consider energy efficiency in motor system procurement. The survey responses show that large and medium facilities are more likely to consider energy efficiency than small facilities are.
Figure 77: Consideration of energy efficiency in procurement of industrial motor and related system components. Annotations show the corresponding percent for each segment for shares
greater than 5%. Figure 78 summarizes the consideration of energy efficiency in the design of new capital projects for motor systems in industrial facilities. Fifty-eight percent of all industrial facilities consider energy when designing new motor system capital projects. Nearly all large (90 percent) and medium (85 percent) facilities consider it, whereas less than half (46 percent) of small facilities consider it.
104
Figure 78: Consideration of energy efficiency in design of industrial motor and related system
components new capital projects. Annotations show the corresponding percent for each segment for shares greater than 5%.
Figure 79 summarizes the consideration of energy efficiency when procuring motor system components for commercial facilities. Fifty-nine percent of commercial facilities consider energy efficiency.
Figure 79: Consideration of energy efficiency in procurement of commercial motor and related system components. Annotations show the corresponding percent for each segment for shares
greater than 5%.
105
Figure 80 summarizes responses to whether energy efficiency is considered in the design of new motor system-related capital projects for the commercial sector. Across all commercial facilities, 67 percent consider energy efficiency. There is slight variation when examining the responses by facility size with large facilities less likely to consider it, compared to small facilities (61 percent versus 71 percent).
Figure 80: Consideration of energy efficiency in the design of new commercial motor and related
system component capital projects. Annotations show the corresponding percent for each segment for shares greater than 5%.
Location of motor system decisions Table 29 summarizes where motor system decisions are made. Across all facilities for both the industrial and commercial sector, motor decisions are usually made at the facility, not in a corporate office.
Table 29: Location where motor system decisions are made (percentage of facilities) Size At
facility By
corporate Mix UTC Total
Commercial LARGE 68 25 6 0 100
MEDIUM 66 29 3 2 100 SMALL 72 26 0 2 100
Industrial LARGE 78 3 18 1 100
MEDIUM 88 1 7 4 100 SMALL 78 8 9 5 100
106
Staff overseeing motor system energy management The titles of the person responsible for managing motor systems was recorded to provide insight into the job category for the person making motor system decisions. Figure 81 summarizes those responses. The responsibility of managing motor system energy fell to the plant, facility, or maintenance manager for 71 percent of the industrial facilities. In the commercial sector, this responsibility belonged to a wider array of job titles, with the most common (36 percent) being plant engineer. The president or general manager carried this responsibility for 14 percent of commercial facilities.
Figure 81: Title of person responsible for managing motor system energy at commercial (top) and
industrial (bottom) facilities. Identification of energy efficiency measures The facilities surveyed were asked to select from a list the methods used to identify energy efficiency measures. Responses are summarized in Table 30. Facilities could select more than one method. Fifty-nine percent of industrial facilities use an external energy assessor, far outpacing any other method queried. Peer-to-peer knowledge sharing is used by 27 percent of all industrial facilities, but for large facilities, it is the most common method (66 percent). Similarly, utility resources are used by 33 percent of all industrial facilities, but far more often by large facilities (55 percent) than small facilities (26 percent).
107
Across all commercial facilities, peer-to-peer knowledge sharing is the most common method for identifying energy efficiency measures (13 percent). However, for large commercial facilities, external energy assessments are the most common method (36 percent).
Table 30: Methods for identifying energy efficiency measures, percent of facilities Industrial (%) Commercial (%)
To identify EE improvements, what does
the facility use? Small Medium Large Total Small Medium Large Total
Energy efficiency service provider 5 30 31 12 0 6 5 3
Use of inventories Facilities were asked for an inventory of their motor systems. The existence of these inventories at the facility is summarized in Table 31.
In general, neither industrial nor commercial facilities had an inventory of their motor systems. Only 13 percent of industrial facilities and 18 percent of commercial facilities had an inventory of all their motors (spare and connected). For industrial facilities, larger facilities are more likely to have a motor system inventory than small facilities. Aside from inventories of all motors at small facilities (which appears to be an outlier at 29 percent), less than 10 percent of commercial facilities had any motor system inventory.
108
Table 31: Existence of motor system inventories, percent of facilities
Industrial (%) Commercial (%) Which does the
facility have a list of? Small Medium Large Total Small Medium Large Total
Maintenance practices During the assessments, information on common maintenance practices and history was surveyed. Proper maintenance procedures can extend the life of the motor system, improve system reliability, and ensure that implemented energy efficiency measures deliver the expected benefits. The impact of insufficient maintenance procedures can be seen in Table 32, which shows the estimated system downtime due to motor system failures. It is estimated that commercial and industrial facilities experience more than 8 million and 6 million hours annually of unplanned motor system downtime, respectively, due to failure.
109
Table 32: Annual unplanned motor system downtime due to failure Commercial
Subsector Name Total Downtime
(hours) Industrial
Subsector Name Total Downtime
(hours) EDU 377,565 Apparel 10,377 FSA 940,412 Beverage/Tobacco 13,849 FSE 1,178,406 Chemical 110,564 HCI 120,625 Computer/Electronic 144,712 HCO 58,910 Electrical Equipment 532 LOD 1,094,427 Fabricated Metal 574,221 MEM 634,697 Food 151,917 MER - Furniture 13,676 OFF 491,133 Leather - OTH 10,916 Machinery 4,184,614 PAS - Miscellaneous 77,136 POS 14,982 Nonmetallic Mineral 9,369 REW 1,009,541 Paper 35,085 SER 1,978,191 Petroleum Refining 297,782 WAS 468,476 Plastic/Rubber 195,814 Total 8,378,282 Primary Metal 316,372 Printing 75,987 Textile Mill 73,279 Textile Product 28,174 Transportation 36,038 Wastewater 32,364 Wood 8,772 Total 6,390,635
110
Figure 82 estimates the distribution of annual unplanned system downtime due to motor system failure at a facility. On average, a commercial facility experiences 3 hours per year and an industrial facility experiences 47 hours per year. Note that these failures do not mean that the facility shut down but that the application being driven by the motor system was down.
Figure 82: Distribution of annual unplanned system downtime due to motor system failure.
See Figure 5 for guidance on interpreting box plots. These estimates provide context for the importance of proper maintenance protocols. To this end, findings on several characteristics of motor system maintenance practices are summarized here, including the repair/replace policy, criteria for selection of replacement motor, and repair history. When querying about motor system maintenance history, facilities were asked to respond with respect to procedures conducted over the previous two years. Since answers to these questions relied on facility staff recalling maintenance performed, the assessment team sought to strike a balance between collecting information over a significant period of time and getting high response rates. For this reason, a two-year time frame was selected.
111
Industrial sector In the industrial sector, 54 percent of all facilities have a repair/replace policy, 36 percent do not, and 9 percent were unable to respond to the question. The criteria underpinning the policy in industrial facilities are summarized in Figure 83. When known by the staff queried, cost was the leading criteria. Thirty-six percent of facilities use lowest first cost and 8 percent use lowest lifetime running costs. Cost outweighed speed of replacement, which is used by 7 percent of industrial facilities.
Figure 83: Criteria used for motor repair/replace policy in industrial facilities, percent of facilities.
Figure 84 shows the criteria for selecting the new motor size when replacing the motor. Seventy-four percent of industrial facilities replace the failed motor with one of the same size. Only 3 percent reevaluate system needs and select the motor based on the evaluation results.
Figure 84: Criteria for selecting size of replacement motor in industrial facilities,
percent of facilities.
112
When doing repairs, 12 percent of industrial facilities always use an EASA Accredited or Green Motor Practices Group Motor Service Center, 3 percent mostly do, 4 percent sometimes do, 10 percent never do, and 60 percent did not know. Note that an EASA Accredited service center is more specific than a service center that is a member of EASA. A service center may be a member of EASA but not EASA Accredited. The most common maintenance procedures are summarized in Table 33. This was determined by asking what percent of motors were maintained for the reasons listed in Table 33 over the past two years. The results show that belt tightening (28 percent) was the most common maintenance procedure. Only 4 percent of motors were rewound over the past two years.
Table 33: Most common motor maintenance procedures in industrial facilities Motor Maintenance Over the
Previous Two Years Percentage of Motors
Maintained (%) Rewind 4 Bearing replacement 7 Shaft alignment 4 Belt tightening 28 Other 6
Note: Sums will not equal 100% because each maintenance procedure is independent of another. Motor maintenance for industrial facilities is broken down by size range in Table 34. Aside from belt tightening, which shows no discernible trend with size range, most maintenance procedures occur more frequently as motor size increases.
Table 34: Industrial motor maintenance procedures over the last two years by size range
Generally, knowledge of motor maintenance scales with motor size. Facilities are more likely to be aware of maintenance to large motors compared to small motors. For example, facilities were unable to provide rewind information on 46 percent of the 1-6 hp motors. This fell to 11 percent for motors between 101-201 hp.
113
Table 35 shows the maintenance history for industrial pump, fan/blower, and air compressor systems. Air compressor systems are maintained more frequently than fan/blower systems, which are more frequently repaired than pump systems. This may be due to the individual system needs — air compressor systems require more maintenance than pump systems.
Table 35: Maintenance history of industrial motor systems by driven equipment
Equipment Motor Driven Equipment Maintenance Over the Previous
Two Years
% of Industrial Systems
Pumps
Bearing lubrication/replacement 14 Seal replacement 12 Ring adjustment or replacement 7 Impeller replacement 5 Other 11
Air Compressors Lubrication and filter 71 Trap inspection 66 Inlet air filter replacement 73
Note: Sums will not equal 100% because each maintenance procedure is independent of another. Commercial sector
Sixteen percent of all commercial facilities have a repair/replace policy, 76 percent did not, and 6 percent were unable to respond to the question. The criteria guiding the repair/replace policies are summarized in Figure 85. Most facilities were unable to identify the criteria for their repair/replace policy. When identifiable, lowest first cost (11 percent) and quickest option (10 percent) were the leading criteria.
Figure 85: Criteria used for motor repair/replace policy in commercial facilities, percent of facilities
114
When replacing a motor, the criteria for selecting the size of the replacement motor are shown in Figure 86. Overwhelmingly, motors were sized to match that of the previous motor.
Figure 86: Criteria for selecting size of replacement motor in commercial facilities, percent of facilities
When doing repairs, 54 percent of commercial facilities did not know if they use an EASA Accredited or Green Motor Practices Group Member Motor Service center, 34 percent never did, and 11 percent did not respond. Note that an EASA Accredited service center is distinct from a service center that is a member of EASA. A service center may be a member of EASA but not EASA Accredited. Table 36 summarizes motor maintenance history for motors in the commercial sector over the past two years. This was determined by asking what percent of motors were maintained for the reasons listed in Table 36 over the past two years. The results show that belt tightening (18 percent) was the most common maintenance procedure. Less than 1 percent of commercial motors were rewound over the past two years.
Table 36: Most common motor maintenance procedures in commercial facilities Motor Maintenance Over the
Previous Two Years Percentage of Motors
Maintained (%) Rewind <1 Bearing replacement 1 Shaft alignment 1 Belt tightening 18 Other 2
115
Table 37 shows motor maintenance procedures for commercial motors by size range. Rewind, bearing replacement, and shaft alignment are rarely performed across all size ranges, particularly when compared to the frequency of belt tightening.
Table 37: Commercial motor maintenance procedures over the last two years by size range
Table 38 shows the maintenance history for commercial pump, fan/blower, and air compressor systems. Similar to the industrial sector, air compressor systems are maintained more frequently than fan/blower systems and pump systems. This may be due to the individual system needs — air compressor systems require more maintenance than pump systems. Given the breakout of commercial motor systems (Figure 29 and Figure 31), fan/blower systems are much more common than pump and air compressor systems. From this perspective, proper fan/blower system maintenance would have a greater impact on commercial motor system electricity consumption than pump or air compressor system maintenance.
Table 38: Maintenance history of commercial motor systems by driven equipment
Motor Driven Equipment Maintenance Over the Previous Two Years
% of Commercial Systems
Pumps
Bearing lubrication/replacement 13 Seal replacement 11 Ring adjustment or replacement 2 Impeller replacement 1 Other 4
Air Compressors Lubrication and filter 36 Trap inspection 34 Inlet air filter replacement 35
Note: Sums will not equal 100% because each maintenance procedure is independent of another
116
Comparison to previous report To better understand the changes in motor system operating characteristics over time, the results from this MSMA were compared to the previous MSMA (2002 report) for the industrial sector. Some of the findings where direct comparisons could be made are detailed below. Comparisons to the previous commercial sector motor system study were not made, since it utilized a different methodology and did not rely on primary data collection. The results show significant improvements in load factor. The 2002 report found that 44 percent of all industrial motor systems operated below 40 percent motor load. The current study finds that this has improved drastically, and only 8 percent of all industrial motor systems now operate below 40 percent motor load. Part of the difference between 2002 and now could be attributed to greater awareness of the impact of load factor on lifetime operating costs. It could also be attributable to the methodologies employed by the different studies to determine the load factor. The 2002 report relied on spot measurements, whereas this report relied on facility staff interviews. In terms of load control, the previous MSMA study found that 9 percent of industrial motor systems and 4 percent of industrial motor system electricity consumption utilized an adjustable speed drive (ASD). The report describes ASDs as being synonymous with VFDs. In this report, 19 percent of industrial motor systems had some sort of control technology (6 percent have a VFD and 13 percent had another load control technology). Twenty-three percent of industrial motor system electricity consumption was under a load control technology (6 percent utilized a VFD and 17 percent utilized another technology type). In terms of energy management practices, the location of motor system-related decisions remains mostly at the facility. In 2002, 91 percent of motor system-related decisions were made at the facility, whereas this report finds that 81 percent of these decisions are now made at the facility. While there is a slight decline, the overwhelming majority of facilities still make motor system-related decisions at the facility. The title of the person making motor system-related decisions has changed drastically. In 2002, the president/general manager made these decisions at 40 percent of facilities, and the plant manager did so at 13 percent of facilities. This is nearly reversed in the current report. Motor system-related decisions are made by the plant/facility manager at 48 percent of facilities and by the general manager/president at 9 percent of facilities. Motor maintenance practices have also changed in a few key areas. In 2002, 20-91 percent of motors were rewound depending on the horsepower size. The current report finds that only 4-7 percent of motors are rewound depending on the size. The 2002 report considered rewinds over the lifetime of the motor, whereas the current study only asked about rewinds over the last two years. This could explain some of the difference. Greater awareness of the benefits of instituting a repair/replace policy also could explain these differences. When replacing a motor, fewer facilities look at first cost now, compared to 2002. In 2002, 62 percent of facilities looked at capital cost, whereas this report found that 36 percent look at lowest first cost now. Finally, when replacing a motor, 55 percent in 2002 always replaced a motor with one that matched the
117
previous size. The current study finds that 74 percent replace the motor with one of the same horsepower size. Highlights Load factor (percent of full speed load)
• Twenty-seven percent of industrial sector motor system electricity consumption operates at variable load, with load factors between 40 percent and 75 percent (see Table 24).
• Forty-two percent of industrial sector motor system units operate at constant loads greater than 75 percent of full load (see Table 25).
• Thirty-five percent of commercial sector motor system electricity consumption operates at variable load, with load factors between 40 percent and 75 percent (see Table 26).
• Thirty percent of commercial sector motor system units operate at variable loads, with load factors between 40 percent and 75 percent (see Table 27).
• Very little of industrial or commercial motor system electricity consumption operates at load factors under 40 percent load. Only 6 percent of industrial sector motor system electricity consumption (1 percent from constant load systems and 5 percent from variable load systems) and 8 percent of the industrial motor systems (1 percent from constant load systems and 7 percent from variable load systems) operate under 40 percent load factor. Only 3 percent of the commercial sector motor system electricity consumption (0 percent from constant load systems and 3 percent from variable load systems) and units (0 percent from constant load units and 3 percent from variable load units) operate under 40 percent of load factor (see Table 24, Table 25, Table 26, and Table 27).
Load control
• On average, 16 percent of motor system capacity at an industrial facility use VFDs and 74 percent has no load control technology/equipment (see Figure 59).
• The rate of installation of VFDs and other load control technologies in the industrial and commercial sectors increases with motor system size (see Figure 62 and Figure 68).
• On average, 4 percent of motor system capacity at a commercial facility uses VFDs, and 91 percent has no load control technology/equipment (see Figure 66).
• The share of motor system capacity with a VFD increases with increasing facility size for both the industrial and commercial sectors. In the industrial sector, 17 percent of motor system capacity in large facilities is on a VFD, compared to 8 percent in small facilities. Similarly, 10 percent of the motor system capacity in large commercial facilities is on a VFD, compared to 2 percent in small commercial facilities (see Figure 60 and Figure 67).
• The uptake of VFDs by driven equipment type in the industrial sector is nearly uniform, at about 23 percent of electricity consumption for each equipment type, with most operating using temperature or pressure setpoints as the control mechanism (see Figure 63 and Figure 64).
118
• The uptake of VFDs by driven equipment type in the commercial sector varies but is highest for fan and blower systems (37 percent). The most common metric for VFD control on commercial sector fans/blowers and pumping systems is pressure setpoint (see Figure 72).
Transmission type
• Thirty-four percent of industrial sector motor systems and 44 percent of commercial sector motor systems use direct drive transmission to convey motor shaft power to the end-use equipment. Direct shaft drive is the most common transmission type observed across both sectors (see Figure 73 and Figure 75).
Motor system energy management
• Forty-nine percent of industrial facilities consider energy efficiency in the procurement of motor system components, and 58 percent consider energy efficiency in the design of new motor systems (see Figure 77 and Figure 78).
• Large industrial facilities are more likely to consider energy efficiency in the procurement and design of motor systems and related components compared to small facilities. It was also observed that facilities of any size are more likely to make motor system-related decisions at the facility level (as opposed to the corporate level) (see Figure 77, Figure 78, and Table 29).
• Fifty-nine percent of commercial facilities consider energy efficiency in the procurement of motor system components, and 67 percent consider energy efficiency in the design of new motor systems (see Figure 79 and Figure 80).
• Large commercial facilities are less likely to consider energy efficiency in the procurement and/or design of motor systems and related components compared to small facilities. It was also observed that facilities of any size are more likely to make motor system-related decisions at the facility level (as opposed to a corporate office) (see Figure 79, Figure 80, and Table 29).
• Across all industrial facilities, external energy assessments were the most common method for identifying energy efficiency measures, with 59 percent utilizing external assessors (see Table 30).
• Across all commercial facilities, peer-to-peer knowledge sharing is the most common method for identifying energy efficiency measures, with 13 percent of facilities utilizing this method (see Table 30).
• Thirteen percent of industrial facilities and 18 percent of commercial facilities had an inventory of all their motors, spare and connected (see Table 31).
Motor system maintenance
• It is estimated that commercial and industrial facilities experience more than 8 million and 6 million hours annually of unplanned motor system downtime, respectively, due to failure (see Table 32).
• On average, a commercial facility experiences three hours of unplanned motor system downtime due to failure per year, and an industrial facility experiences 47 hours per year (see Figure 82).
119
• In the industrial sector, 54 percent of all facilities have a repair/replace policy, with the leading criteria guiding the policy being lowest first cost, which is used by 36 percent of facilities (see Figure 83).
• The most common maintenance procedure for industrial motor systems (over the previous two years) is belt tightening, which was performed for 28 percent of industrial motor systems. Four percent of industrial motors were rewound over the previous two years (see Table 33).
• In the commercial sector, 16 percent of all facilities have a repair/replace policy. Most facilities were unaware of the criteria underpinning the policy. The most commonly cited criteria guiding the policy are lowest first cost (11 percent) and quickest option (10 percent) (see Figure 85).
• The most common maintenance procedure for commercial motor systems (over the previous two years) is belt tightening (18 percent). Less than 1 percent of commercial motors were rewound over the previous two years (see Table 36).
120
References Arthur D. Little (1999) Opportunities for Energy Savings in the Residential and Commercial Sectors with High-Efficiency Electric Motors.
International Energy Agency (2007) Tracking Industrial Energy Efficiency and CO2 Emissions, Tracking Industrial Energy Efficiency and CO2 Emissions. doi: 10.1787/9789264030404-en.
McKane, A., and A. Hasanbeigi (2011) “Motor systems energy efficiency supply curves: A methodology for assessing the energy efficiency potential of industrial motor systems.” Energy Policy. doi: 10.1016/j.enpol.2011.08.004.
NAICS Association. No date. 2213 - Water, Sewage and Other Systems. https://www.naics.com/naics-code-description/?code=2213.
Rao, P. et al. (2016) Assessing Energy Efficiency Opportunities in US Industrial and Commercial Building Motor Systems. Berkeley, California.
Rao, P., Sheaffer, P. and Scheihing, P. (2017) “Methodology for Assessing the US Industrial and Commercial Motor System Market Assessment.” In Energy Efficiency in Motor Driven Systems. Rome, Italy.
UNIDO (2010) “Motor Systems Efficiency Supply Curves.” United Nations Industrial Development Organisation (UNIDO).
U.S. Bureau of Labor Statistics. (No date) Industries by Supersector and NAICS Code. https://www.bls.gov/iag/tgs/iag_index_naics.htm.
U.S. Department of Energy. (1989) Improving Fan System Performance: A sourcebook for industry. Energy Efficiency and Renewable Energy. https://www.nrel.gov/docs/fy03osti/29166.pdf.
U.S. Department of Energy (2002) United States Industrial Electric Motor Systems Market Opportunities Assessment. https://www.energy.gov/sites/prod/files/2014/04/f15/mtrmkt.pdf.
U.S. Department of Energy (2012) Replace V-Belts with Notched or Synchronous Belt Drives. EERE. Advanced Manufacturing Office. https://www.energy.gov/sites/prod/files/2014/04/f15/replace_vbelts_motor_systemts5.pdf.
U.S. Department of Energy (2015) Energy Conservation Program: Energy Conservation Standards for Pumps. 10 CFR Parts 429 and 431. Docket Number EERE–2011–BT–STD–0031. RIN 1904-AC54. https://www.energy.gov/sites/prod/files/2015/12/f28/Pumps%20ECS%20Final%20Rule.pdf.
U.S. Department of Energy (2017) 10 CFR Parts 429 and 431. Docket Number EERE-2013-BT-STD-0040. RIN 1904-AC83. Energy Conservation Program: Energy Conservation Standards for Air Compressors. https://www.energy.gov/sites/prod/files/2016/12/f34/Compressors_Standards_Final_Rule.pdf.
U.S. Energy Information Administration (1999, 2003, 2012) CBECS Terminology. Commercial Buildings Energy Consumption Survey (CBECS). https://www.bls.gov/iag/tgs/iag_index_naics.htm.
U.S. Energy Information Administration (2012) Commercial Building Energy Consumption Survey. https://www.eia.gov/consumption/commercial/
U.S. Energy Information Administration (2014) Manufacturing Energy Consumption Survey. https://www.eia.gov/consumption/manufacturing/
Waide, P., and C. U. Brunner (2011) “Energy-Efficiency Policy Opportunities for Electric Motor-Driven Systems.” Internationale energy agency. doi: 10.1787/5kgg52gb9gjd-en.
Glossary Air (or gas) compressor - a machine or apparatus that converts different types of energy into the potential energy of gas (air or other, such as nitrogen) pressure for displacement and compression of gaseous media to any higher pressure values above atmospheric pressure and has a pressure ratio at full-load operating pressure greater than 1.3. Generally in this report, these will be air compressors. (U.S. Department of Energy, 2017) Air handling - a system of components, including fan and ducting, used to move conditioned air from location to location. Apparel - industries in the Apparel Manufacturing subsector group establishments with two distinct manufacturing processes: (1) cut and sew (i.e., purchasing fabric and cutting and sewing to make a garment), and (2) the manufacture of garments in establishments that first knit fabric and then cut and sew the fabric into a garment. The Apparel Manufacturing subsector includes a diverse range of establishments manufacturing full lines of ready-to-wear apparel and custom apparel: apparel contractors, performing cutting or sewing operations on materials owned by others; jobbers performing entrepreneurial functions involved in apparel manufacture; and tailors, manufacturing custom garments for individual clients are all included. Knitting, when done alone, is classified in the Textile Mills subsector, but when knitting is combined with the production of complete garments, the activity is classified in Apparel Manufacturing. (U.S. Bureau of Labor Statistics, No date) Belt - a transmission type whereby the motor shaft is connected to the driven equipment through use of a band of flexible material. Beverage and Tobacco Products - industries in the Beverage and Tobacco Product Manufacturing subsector manufacture beverages and tobacco products. The industry group, Beverage Manufacturing, includes three types of establishments: (1) those that manufacture nonalcoholic beverages; (2) those that manufacture alcoholic beverages through the fermentation process; and (3) those that produce distilled alcoholic beverages. Ice manufacturing, while not a beverage, is included with nonalcoholic beverage manufacturing because it uses the same production process as water purification. The industry group, Tobacco Manufacturing, includes two types of establishments: (1) those engaged in redrying and stemming tobacco and, (2) those that manufacture tobacco products, such as cigarettes and cigars. (U.S. Bureau of Labor Statistics, No date) Chemicals - The Chemical Manufacturing subsector is based on the transformation of organic and inorganic raw materials by a chemical process and the formulation of products. This subsector distinguishes the production of basic chemicals that comprise the first industry group from the production of intermediate and end products produced by further processing of basic chemicals that make up the remaining industry groups. (U.S. Bureau of Labor Statistics, No date) Cog belt - a belt type that is toothed and requires the installation of mating grooved sprockets. These are also called synchronous belts. (U.S. Department of Energy, 2012)
123
Compressed air plant - the air compressor(s) and all ancillary equipment supporting the air compressor(s), such as dryers, receiving/storage tanks, valves, etc. Computer and Electronic Products - industries in the Computer and Electronic Product Manufacturing subsector group establishments that manufacture computers, computer peripherals, communications equipment, and similar electronic products, and establishments that manufacture components for such products. The design and use of integrated circuits and the application of highly specialized miniaturization technologies are common elements in the production technologies of the computer and electronic subsector. Conveying - transfer of materials and unfinished goods from one location to another within the manufacturing process. DC motor - direct current motor. Note that advanced motor designs, like permanent magnet and synchronous motors are categorized as AC motors. Direct shaft - transmission type whereby the motor shaft is directly coupled to the driven equipment and thereby on the same axis of rotation without any change in speed or translation of motion. Education - buildings used for academic or technical classroom instruction, such as elementary, middle, or high schools, and classroom buildings on college or university campuses. Buildings on education campuses for which the main use is not classroom are included in the category relating to their use. For example, administration buildings are part of “Office,” dormitories are “Lodging,” and libraries are “Public Assembly.” This includes, but is not limited to: elementary or middle school, high school, college or university, preschool or daycare, adult education, career or vocational training, and religious education. (U.S. Energy Information Administration, 1999, 2003, 2012) Electrical Equipment and Appliances - Industries in the Electrical Equipment, Appliance, and Component Manufacturing subsector manufacture products that generate, distribute, and use electrical power. Electric Lighting Equipment Manufacturing establishments produce electric lamp bulbs, lighting fixtures, and parts. Household Appliance Manufacturing establishments make both small and major electrical appliances and parts. Electrical Equipment Manufacturing establishments make goods, such as electric motors, generators, transformers, and switchgear apparatus. Other Electrical Equipment and Component Manufacturing establishments make devices for storing electrical power (e.g., batteries), for transmitting electricity (e.g., insulated wire), and wiring devices (e.g., electrical outlets, fuse boxes, and light switches). (U.S. Bureau of Labor Statistics, No date) Exhausting/scrubbing - emissions control through ventilation of polluted, contaminated, or otherwise undesirable air. Extrusion - a manufacturing process by which material is formed by forcing it through a mold or die.
124
Fabricated Metal Products - Industries in the Fabricated Metal Product Manufacturing subsector transform metal into intermediate or end products, other than machinery, computers and electronics, and metal furniture, or treat metals and metal formed products fabricated elsewhere. Important fabricated metal processes are forging, stamping, bending, forming, and machining, used to shape individual pieces of metal; and other processes, such as welding and assembling, used to join separate parts together. Establishments in this subsector may use one of these processes or a combination of these processes. (U.S. Bureau of Labor Statistics, No date) Fan/blower - a power-driven machine that moves a continuous volume of air by converting rotational/mechanical energy to an increase in the total pressure of the moving air below a pressure ratio at full load of 1.3. (U.S. Department of Energy, 1989) Food Products - Industries in the Food Manufacturing subsector transform livestock and agricultural products into products for intermediate or final consumption. The industry groups are distinguished by the raw materials (generally of animal or vegetable origin) processed into food products. The food products manufactured in these establishments are typically sold to wholesalers or retailers for distribution to consumers, but establishments primarily engaged in retailing bakery and candy products made on the premises not for immediate consumption are included. (U.S. Bureau of Labor Statistics, No date) Food Sales - buildings used for retail or wholesale of food. This includes, but is not limited to: grocery store or food market, gas station with a convenience store, and convenience store. (U.S. Energy Information Administration, 1999, 2003, 2012) Food Services - buildings used for preparation and sale of food and beverages for consumption. This includes, but is not limited to: fast food, restaurant or cafeteria, bar, catering service or reception hall, coffee/bagel/doughnut shop, and ice cream/frozen yogurt shop. (U.S. Energy Information Administration, 1999, 2003, 2012) Furniture and Related Products - Industries in the Furniture and Related Product Manufacturing subsector make furniture and related articles, such as mattresses, window blinds, cabinets, and fixtures. The processes used in the manufacture of furniture include the cutting, bending, molding, laminating, and assembly of such materials as wood, metal, glass, plastics, and rattan. However, the production process for furniture is not solely bending metal, cutting and shaping wood, or extruding and molding plastics. Design and fashion trends play an important part in the production of furniture. The integrated design of the article for both esthetic and functional qualities is also a major part of the process of manufacturing furniture. Design services may be performed by the furniture establishment’s work force or may be purchased from industrial designers. (U.S. Bureau of Labor Statistics, No date) Gearbox - a gear assembly/system and its housing used to transmit power. Health Care: Inpatient - buildings used as diagnostic and treatment facilities for inpatient care. This includes, but is not limited to: hospitals and inpatient rehabilitation. (U.S. Energy Information Administration, 1999, 2003, 2012)
125
Health Care: Outpatient - buildings used as diagnostic and treatment facilities for outpatient care. Medical offices are included here if they use any type of diagnostic medical equipment (if they do not, they are categorized as an office building). This includes, but is not limited to: medical office, clinic or other outpatient health care, outpatient rehabilitation, and veterinarian. (U.S. Energy Information Administration, 1999, 2003, 2012) Hot water/steam plant - equipment, including boilers, pumps, condensate return tanks, and other, used to generate steam or hot water. Hydraulic system - a system that relies on pressurized fluids, such as water, to transmit power generated by a motor. Leather and Allied Products - Establishments in the Leather and Allied Product Manufacturing subsector transform hides into leather by tanning or curing and fabricating the leather into products for final consumption. It also includes the manufacture of similar products from other materials, including products (except apparel) made from “leather substitutes,” such as rubber, plastics, or textiles. Rubber footwear, textile luggage, and plastics purses or wallets are examples of “leather substitute” products included in this group. The products made from leather substitutes are included in this subsector because they are made in similar ways leather products are made (e.g., luggage). They are made in the same establishments, so it is not practical to separate them. (U.S. Bureau of Labor Statistics, No date) Load factor - the ratio of average motor output power to the motor’s rated power. For example, a motor rated at 100 hp but only operating at 40 hp would have a load factor of 0.4. Lodging (includes Nursing) - buildings used to offer multiple accommodations for short-term or long-term residents, including skilled nursing and other residential care buildings. This includes, but is not limited to: motel or inn, hotel, dormitory, fraternity or sorority, retirement home, nursing home, assisted living or other residential care, convent or monastery, shelter, orphanage or children’s home, and halfway house. (U.S. Energy Information Administration, 1999, 2003, 2012) Machinery - Industries in the Machinery Manufacturing subsector create end products that apply mechanical force, for example, the application of gears and levers, to perform work. Some important processes for the manufacture of machinery are forging, stamping, bending, forming, and machining that are used to shape individual pieces of metal. Processes, such as welding and assembling are used to join separate parts together. Although these processes are similar to those used in metal fabricating establishments, machinery manufacturing is different because it typically employs multiple metal forming processes in manufacturing the various parts of the machine. Moreover, complex assembly operations are an inherent part of the production process. (U.S. Bureau of Labor Statistics, No date) Material(s) handling - Materials handling includes motor systems that transport materials, such as conveyor motors.
126
Material(s) processing - Materials processing includes motor systems that use mechanical means to process materials. Examples include grinders, hydraulics, and extruder motors. Material(s) shaping - physical deformation of materials into a desired shape. Examples include stamping, bending, machining, and forging. Mercantile: Retail (other than mall) - buildings used for the sale and display of goods other than food. This includes, but is not limited to: retail store, beer/wine/liquor store, rental center, dealership or showroom for vehicles or boats, and studio/gallery. (U.S. Energy Information Administration, 1999, 2003, 2012) Mercantile: Enclosed and Strip Malls - Shopping malls comprised of multiple connected establishments. This includes, but is not limited to enclosed malls and strip shopping centers. (U.S. Energy Information Administration, 1999, 2003, 2012) Miscellaneous - Industries in the Miscellaneous Manufacturing subsector make a wide range of products that cannot readily be classified in specific NAICS subsectors in manufacturing. Processes used by these establishments vary significantly, both among and within industries. For example, a variety of manufacturing processes are used in manufacturing sporting and athletic goods that include products such as tennis racquets and golf balls. The processes for these products differ from each other, and the processes differ significantly from the fabrication processes used in making dolls or toys, the melting and shaping of precious metals to make jewelry, and the bending, forming, and assembly used in making medical products. (U.S. Bureau of Labor Statistics, No date) Municipal Wastewater Treatment - This industry group comprises establishments primarily engaged in operating sewer systems or sewage treatment facilities. This does not include transfer to and away from the wastewater facility. (NAICS Association, No date) Nonmetallic Mineral Products - The Nonmetallic Mineral Product Manufacturing subsector transforms mined or quarried nonmetallic minerals, such as sand, gravel, stone, clay, and refractory materials into products for intermediate or final consumption, such as glass and cement. Processes used include grinding, mixing, cutting, shaping, and honing. Heat often is used in the process and chemicals are frequently mixed to change the composition, purity, and chemical properties for the intended product. For example, glass is produced by heating silica sand to the melting point (sometimes combined with cullet or recycled glass) and then drawn, floated, or blow molded to the desired shape or thickness. Refractory materials are heated and then formed into bricks or other shapes for use in industrial applications. Office - Buildings used for general office space, professional office, or administrative offices. Medical offices are included here if they do not use any type of diagnostic medical equipment (if they do, they are categorized as an outpatient health care building). This includes, but is not limited to: administrative or professional office, government office, mixed-use office, bank or other financial institution, medical office, sales office, contractor’s office (e.g., construction, plumbing, HVAC), nonprofit or social services, city hall or city center, religious office, and call center. (U.S. Energy Information Administration, 1999, 2003, 2012)
127
Other and Vacant - buildings that are industrial or agricultural with some retail space; buildings having several different commercial activities that, together, comprise 50 percent or more of the floorspace, but whose largest single activity is agricultural, industrial/manufacturing, or residential; buildings in which more floorspace was vacant than was used for any single commercial activity at the time of interview. Therefore, a vacant building may have some occupied floorspace; and all other miscellaneous buildings that do not fit into any other category. This includes, but is not limited to: airplane hangar, crematorium, laboratory, telephone switching, agricultural with some retail space, manufacturing or industrial with some retail space, data center, or server farm. (U.S. Energy Information Administration, 1999, 2003, 2012) Other processing - processing other that conveying, extruding, materials handling, materials processing, materials shaping, process heating, product transfer, screening/filtration/separation, and wastewater management. Paper and Allied Products - Industries in the Paper Manufacturing subsector make pulp, paper, or converted paper products. The manufacturing of these products is grouped together because they constitute a series of vertically connected processes. More than one is often carried out in a single establishment. There are essentially three activities. The manufacturing of pulp involves separating the cellulose fibers from other impurities in wood or used paper. The manufacturing of paper involves matting these fibers into a sheet. Converted paper products are made from paper and other materials by various cutting and shaping techniques and include coating and laminating activities. (U.S. Bureau of Labor Statistics, No date) Petroleum and Coal Products - The Petroleum and Coal Products Manufacturing subsector is based on the transformation of crude petroleum and coal into usable products. The dominant process is petroleum refining that involves the separation of crude petroleum into component products through such techniques as cracking and distillation. In addition, this subsector includes establishments that primarily further process refined petroleum and coal products and produce products, such as asphalt coatings and petroleum lubricating oils. (U.S. Bureau of Labor Statistics, No date) Plastic and Rubber Products - Industries in the Plastics and Rubber Products Manufacturing subsector make goods by processing plastics materials and raw rubber. The core technology employed by establishments in this subsector is that of plastics or rubber product production. Plastics and rubber are combined in the same subsector because plastics are increasingly being used as a substitute for rubber; however, the subsector is generally restricted to the production of products made of just one material, either solely plastics or rubber. (U.S. Bureau of Labor Statistics, No date) Primary Metals - Industries in the Primary Metal Manufacturing subsector smelt and/or refine ferrous and nonferrous metals from ore, pig, or scrap, using electrometallurgical and other process metallurgical techniques. Establishments in this subsector also manufacture metal alloys and superalloys by introducing other chemical elements to pure metals. The output of smelting and refining, usually in ingot form, is used in rolling, drawing, and extruding operations to make
128
sheet, strip, bar, rod, or wire, and in molten form to make castings and other basic metal products. (U.S. Bureau of Labor Statistics, No date) Printing and Related Support - Industries in the Printing and Related Support Activities subsector print products, such as newspapers, books, labels, business cards, stationery, business forms, and other materials, and perform support activities, such as data imaging, platemaking services, and bookbinding. The support activities included here are an integral part of the printing industry, and a product (a printing plate, a bound book, or a computer disk or file) that is an integral part of the printing industry is almost always provided by these operations. (U.S. Bureau of Labor Statistics, No date) Process/equipment cooling - cooling equipment, materials, process lines, and auxiliary equipment. Process heating - heating materials and/or process lines to a desired temperature as part of the manufacturing process. Product transfer - moving a final product from one location to another (e.g., stocking in a warehouse). Public Assembly - buildings in which people gather for social or recreational activities, whether in private or non-private meeting halls. This includes, but is not limited to: social or meeting (e.g., community center, lodge, meeting hall, convention center, senior center), recreation (e.g., gymnasium, health club, bowling alley, ice rink, field house, indoor racquet sports), entertainment or culture (e.g., museum, theater, cinema, sports arena, casino, nightclub), library, funeral home, student activities center, armory, exhibition hall, broadcasting studio, and transportation terminal. (U.S. Energy Information Administration, 1999, 2003, 2012) Public Order and Safety - buildings used for the preservation of law and order or public safety. This includes, but is not limited to: police station, fire station, jail/reformatory/penitentiary, and courthouse or probation office. (U.S. Energy Information Administration, 1999, 2003, 2012) Pump - equipment designed to move liquids (which may include entrained gases, free solids, and totally dissolved solids) by physical or mechanical action. (U.S. Department of Energy, 2015) Refrigeration compressors - a mechanical device that employs the vapor-compression cycle to move heat from a higher reservoir to a lower one for the effect of cooling the higher reservoir. A chiller is a common example of a refrigeration compressor. Religious worship - buildings in which people gather for religious activities, (such as chapels, churches, mosques, synagogues, and temples). Screening/Filtration/Separation - physical separation of one material from another based on physical size.
129
Service - buildings in which some type of service is provided, other than food service or retail sales of goods. This includes, but is not limited to: vehicle service or vehicle repair shop, vehicle storage/ maintenance (car barn), repair shop, dry cleaner or laundromat, post office or postal center, car wash, gas station, photo processing shop, beauty parlor or barber shop, tanning salon, copy center or printing shop, and kennel. (U.S. Energy Information Administration, 1999, 2003, 2012) Space cooling - cooling of a physical space for the purposes of maintaining desired ambient temperature and humidity, often for the purposes of human comfort. Space heating - heating of a physical space for the purposes of maintaining desired ambient temperature, often for the purposes of human comfort. Synchronous belt - a belt type that is toothed and requires the installation of mating grooved sprockets. These are also called cog belts. (U.S. Department of Energy, 2012) Textile Mills - industries in the Textile Mills subsector group establishments that transform a basic fiber (natural or synthetic) into a product, such as yarn or fabric that is further manufactured into usable items, such as apparel, sheets, towels, and textile bags for individual or industrial consumption. The further manufacturing may be performed in the same establishment and classified in this subsector, or it may be performed at a separate establishment and be classified elsewhere in manufacturing. (U.S. Bureau of Labor Statistics, No date) Textile Product Mills - industries in the Textile Product Mills subsector group establishments that make textile products (except apparel). With a few exceptions, processes used in these industries are generally cut and sew (i.e., purchasing fabric and cutting and sewing it to make non-apparel textile products, such as sheets and towels). (U.S. Bureau of Labor Statistics, No date) Transportation Equipment - Industries in the Transportation Equipment Manufacturing subsector produce equipment for transporting people and goods. Transportation equipment is a type of machinery. An entire subsector is devoted to this activity because of the significance of its economic size in all three North American countries. Establishments in this subsector utilize production processes similar to those of other machinery manufacturing establishments — bending, forming, welding, machining, and assembling metal or plastic parts into components and finished products. However, the assembly of components and subassemblies and their further assembly into finished vehicles tends to be a more common production process in this subsector than in the Machinery Manufacturing subsector. (U.S. Bureau of Labor Statistics, No date) Unable to collect - The assessment team was unable to collect or request this information. This is different from “do not know” or “no,” where the team was able to request the information. V-belt - a belt type that uses a trapezoidal cross section to create a wedging action on the pulleys to increase friction and improve the belt’s power transfer capability. (U.S. Department of Energy, 2012)
130
Warehouse and Storage - buildings used to store goods, manufactured products, merchandise, raw materials, or personal belongings (such as self-storage). This includes, but is not limited to: refrigerated warehouse, non-refrigerated warehouse, and distribution or shipping center. (U.S. Energy Information Administration, 1999, 2003, 2012) Wastewater management - any process or equipment associated with the treatment of wastewater for safe disposal or transfer offsite. This does not include distribution of wastewater outside of the facility. Wood Products - Industries in the Wood Product Manufacturing subsector manufacture wood products, such as lumber, plywood, veneers, wood containers, wood flooring, wood trusses, manufactured homes (i.e., mobile homes), and prefabricated wood buildings. The production processes of the Wood Product Manufacturing subsector include sawing, planing, shaping, laminating, and assembling of wood products starting from logs that are cut into bolts, or lumber that then may be further cut, or shaped by lathes or other shaping tools. The lumber or other transformed wood shapes may also be subsequently planed or smoothed, and assembled into finished products, such as wood containers. The Wood Product Manufacturing subsector includes establishments that make wood products from logs and bolts that are sawed and shaped, and establishments that purchase sawed lumber and make wood products. With the exception of sawmills and wood preservation establishments, the establishments are grouped into industries mainly based on the specific products manufactured. (U.S. Bureau of Labor Statistics, No date)
A-1
Appendix A: Sampling Allocation Units of analysis The MSMA was designed to obtain data on motor use from industrial and commercial sites. The overall sample size for each sector was set at 300 industrial and 150 commercial sites. For the industrial sector, a site was an “establishment,” meaning a particular business at a physical location. Thus, for example, if a manufacturing complex is renting out space to two different businesses, it counts as two establishments. Conversely, if an industrial business has several buildings at a particular location (e.g., a campus), all its buildings belong to the site that might be selected for an MSMA onsite inventory. Non-vacant, operational industrial establishments with six or more employees are eligible for the study. The MSMA excludes establishments with zero to five employees. This restriction is consistent with the target population for the Energy Information Administration’s (EIA) Manufacturing Energy Consumption Survey (MECS). For the commercial sector, a site was a commercial building. If a single commercial building includes multiple businesses, all these businesses are included in the commercial site for purposes of the MSMA inventory. A strip mall is counted as a single building. Only buildings greater than 1,000 square feet are eligible for the MSMA. This is consistent with the target population for the EIA’s Commercial Buildings Energy Consumption Survey (CBECS). Data sources for the population characteristics and sampling frame To determine the sample allocation to industrial and commercial subsectors overall, and by finer subdivisions within subsectors, the sample design relied on the 2010 MECS and 2012 CBECS data to represent the national populations of manufacturing facilities and commercial buildings, respectively. These are nationally representative samples of thousands of sites each. The datasets include estimates of energy use by various decompositions and in relation to site characteristics. In particular, they provide estimates of electricity use by functional end use. These estimates provide a foundation for designing a study of motor energy use. The MECS and CBECS provide aggregate estimates at the subsector level that are used to determine the target sample sizes. However, these survey samples are confidential. To fulfill the targeted sample sizes, a list frame was used for each sector, the MNI U.S. Manufacturing Industry Database for the industrial sector and the SMR Enhanced Commercial Property Database for the commercial sector. Sample stratification The sample allocation was designed to provide some coverage for each manufacturing and commercial subsector, with acceptable overall precision at the sector level, subject to the overall
A-2
sample size constraints. To meet these objectives, the sample was stratified by commercial or industrial subsector, and by size. Each subsector was divided into three size bins, where the size cut points for each subsector were defined by an employment level. The subsector cut points were set such that the small-, medium-, and large-size bins accounted for roughly 25 percent, 50 percent, and 25 percent, respectively, of the subsector’s total employment. These proportions were not exact because the cut points had to align with the available data categories in the sources. For the commercial subsectors, the establishment cut points were mapped to floorspace cut points based on the subsector’s employees per square foot.
Setting cut points at roughly these proportions was a subjective decision. Creating roughly equal measures of size in each size bin is generally a fairly efficient strategy. Using a 25/50/25 split instead of 33/33/33 makes a more targeted definition of high, with potentially somewhat lower variability, and reduces the number of very small sites that will be included.
The employment data by cut point came from the 2012 CBECS for commercial subsectors and from the 2013 County Business Patterns (CBP) for industrial sectors. Table 39 shows the size bin cut points for each subsector.
Table 39: Size cut points by subsector Industrial Subsector Small
Upper Bound
Employment
Medium Upper Bound
Employment Food Products 99 999 Beverage and Tobacco Products 49 499 Textile Mills 49 249 Textile Product Mills 49 249 Apparel 19 249 Leather and Allied Products 49 499 Wood Products 49 249 Paper and Allied Products 99 499 Printing and Related Support 19 249 Petroleum and Coal Products 99 999 Chemicals 99 499 Plastic and Rubber Products 49 499 Nonmetallic Mineral Products 19 249 Primary Metals: Iron and Steel Mills and Ferroalloy Manufacturing 99 999 Primary Metals: Other 99 499 Fabricated Metal Products 49 249 Machinery 49 499 Computer and Electronic Products 99 999 Electrical Equipment and Appliances 99 499 Transportation Equipment 249 999 Furniture and Related Products 49 499 Miscellaneous 49 499
A-3
Table 39: Size cut points by subsector (cont’d)
Commercial Subsector Small Upper Bound
Square Feet
Medium Upper Bound
Square Feet Education 17,500 128,000 Food Sales 3,500 34,000 Food Services 3,000 9,500 Health Care: Inpatient 240,000 900,000 Health Care: Outpatient 9,000 69,000 Lodging (Includes Nursing) 20,000 215,000 Mercantile: Retail (other than mall) 7,000 110,000 Mercantile: Enclosed and Strip Malls 22,500 150,000 Office 18,000 250,000 Public Assembly 9,000 360,000 Public Order and Safety 9,500 160,000 Religious Worship 5,000 29,500 Service 5,000 26,000 Warehouse and Storage 12,000 136,000 Other (Includes CBECS = Other, Laboratory) and Vacant 15,000 114,000
Metrics used for sample allocation To allocate the sample to subsector-size bins, two key metrics used were (1) the magnitude of estimated motor system electricity consumption and (2) its variability (standard deviation) across establishments within the subsector. Motor system electricity consumption and standard deviation were estimated as follows. For industrial subsectors, motor electricity consumption for each subsector was calculated as the sum of net electricity use for process cooling and refrigeration, motor drive, and facility HVAC, from EIA’s 2010 MECS (Table 5.2). For commercial subsectors, the motor electricity consumption was calculated as the sum of the subsector’s 2012 CBECS cooling, ventilation, refrigeration, and miscellaneous uses (Table E3). The ratio of this estimated motor electricity consumption to the corresponding subsector establishments or buildings from the MECS or CBECS was then calculated. The standard deviation of motor system electricity consumption across establishments or buildings was estimated for each subsector based on the standard errors and sample sizes from the MECS and CBECS. The standard deviation was calculated as the product of the standard error and the square root of the sample size. Sample sizes by commercial and industrial subsector Each sector’s total sample was allocated to subsectors using a few different methods (1-4 below), and these different results were considered in the final allocation (5), which balanced these.
A-4
1. Optimal allocation to produce best possible precision for the sector in total. This is the standard Neyman-Pearson allocation formula, where the sample size for each subsector is proportional to the product of population size (in this case, number of establishments) and standard deviation (in this case, estimated standard deviation of motor electricity consumption).
2. Allocation proportional to estimated motor electricity consumption. 3. Allocation proportional to number of establishments. 4. A judgmental allocation of a minimum of seven per subsector. 5. After reviewing the other allocations, a final allocation that balanced the objectives was
selected: (a) ensure some minimal representation for each subsector, (b) ensure sectors contributing more to total sector motor energy use have higher allocations, and (c) ensure acceptable precision for the sector motor energy use estimate in total.
Based on the estimated standard deviations and the target sample sizes, overall precision at 90 percent confidence was projected at 8.0 percent for the industrial sector (n = 300) and 26.3 percent for the commercial sector (n = 150). Allocation to size bins within a subsector After the subsector-level allocations were determined, these were allocated to size bins within each subsector. The allocation to size bins within a subsector was proportional to the product of the number of establishments and a sector-wide size bin scaling factor. The effect of this allocation was to put a little under 20 percent of the sample in the small bin and a little over 40 percent each in the medium and large bins, with some variation across subsectors. Table 40 and Table 41 provide the targeted and achieved sample allocations by subsector and size bin, for the industrial and commercial sectors, respectively. These tables also indicate the projected precision (prior to actual data collection and analysis) for each subsector. For a few of the subsectors, the projected precision was quite wide. These are subsectors that contribute relatively little to total sector motor consumption. For this reason, they received lower sample allocations, and the projected sector-level precision is reasonable despite these poorly determined subsectors. The precision projections assume the same sample efficiency for total motor energy use in each subsector as was obtained for the MECS and CBECS samples. The achieved precision of subsector motor electricity consumption estimates, presented Appendix B: Weighting Description, was generally much better than these projections from the sample design stage. This improvement was due to using the MECS and CBECS estimates of total electric use, together with the ratio of motor kilowatt-hour to total kilowatt-hour determined from the MSMA sample. This ratio turned out to have very good precision for most subsectors. The corresponding ratio is not reported directly in the MECS and CBECS public tables, so a precision estimate is not available for comparison from those sources and was not available as an input to the sample design.
A-5
Table 40: Targeted and achieved sample allocations by subsector and size bin, for the industrial subsector Industrial Subsector Estimated
Office 490 83.2 20 6 9 5 16 4 7 5 Public Assembly 204 102.1 10 2 7 1 9 1 7 1 Public Order and Safety 43 114.8 7 1 3 3 7 2 3 2 Religious Worship 61 168.6 7 1 2 4 7 0 4 3 Service 76 201.4 7 1 3 3 7 2 4 1 Warehouse and Storage 203 130.6 17 2 7 8 11 1 4 6 Other (Includes CBECS = Other, Laboratory) and Vacant
223 116.4 16 3 6 7 7 1 2 4
Total 2,870 26.3 150 24 63 63 123 23 57 43
A-7
Sample selection within a sampling cell The list frames used for sample recruitment were sorted by subsector, size, and census region. Within a subsector and size category, all site listings had an equal chance of being included in the study. In the event that a selected industrial listing turned out to include multiple industrial establishments, or a selected commercial listing turned out to include multiple commercial buildings, a single establishment or building was selected at random. Sample by census region Explicit sample allocations were not set by geography. Sample allocations to cells defined by combinations of subsector, size, and geography would have been very small, making sample fulfillment challenging. However, overall targets by census region were set as “soft” targets for each subsector. These overall subsector targets by census region were roughly proportional to subsector employment within each region. Table 42 and Table 43 show the achieved sample distribution by subsector and census region, for the industrial and commercial sectors. Also shown in each table is the distribution by census region that would have corresponded to distributing each subsector’s achieved sample over census regions in proportion to employment. On the whole, the samples are well distributed over census regions, though there is some disproportionate allocation for some subsectors.
A-8
Table 42: Industrial sample achieved by census region Achieved Sample
Allocation if Proportional to Employment within NAICS*
NAICS NE M S W Total NE M S W Total Wastewater 0 4 4 2 10 N/A N/A N/A N/A 10 Food Products 0 6 7 5 18 2 6 6 4 18 Beverage and Tobacco Products 0 2 1 4 7 1 1 2 3 7 Textile Mills 0 0 7 0 7 1 0 5 1 7 Textile Product Mills 1 2 2 2 7 1 1 4 1 7 Apparel 1 0 1 5 7 1 1 2 3 7 Leather and Allied Products 3 0 0 1 4 1 1 1 1 4 Wood Products 1 1 2 4 8 1 2 3 2 8 Paper and Allied Products 2 3 6 2 13 2 4 5 2 13 Printing and Related Support 2 4 0 1 7 1 3 2 1 7 Petroleum and Coal Products 2 1 4 6 13 1 3 6 3 13 Chemicals 0 3 14 2 19 4 5 7 3 19 Plastic and Rubber Products 4 8 5 2 19 3 7 7 2 19 Nonmetallic Mineral Products 0 2 0 6 8 1 2 3 2 8 Primary Metals: Iron and Steel Mills and Ferroalloy Manufacturing
Notes: NE = Northeast, M = Midwest, S = South, W = West. *proportional allocation rounded and in a few cases adjusted by + 1 to reconcile to the total achieved.
A-9
Table 43: Commercial sample achieved by census region Achieved Sample
Allocation if Proportional to
Employment within Building Type*
Commercial Building Type NE M S W Total NE M S W Total Education 5 2 2 2 11 2 2 4 3 11 Food Sales 4 2 1 0 7 2 1 2 2 7 Food Services 1 1 0 5 7 1 1 3 2 7 Health Care: Inpatient 1 1 3 2 7 2 1 3 1 7 Health Care: Outpatient 2 0 1 4 7 2 2 2 1 7 Lodging (Includes Nursing) 2 1 2 2 7 1 1 3 2 7 Mercantile: Retail (other than mall) 0 1 0 7 8 2 1 3 2 8 Mercantile: Enclosed and Strip Malls 1 0 1 5 7 1 1 3 2 7 Office 2 2 9 3 16 4 3 6 3 16 Other (Includes CBECS = Other, Laboratory) and Vacant
5 2 0 1 8 2 1 2 3 8
Public Assembly 2 3 0 3 8 2 2 3 1 8 Public Order and Safety 0 2 2 3 7 2 1 3 1 7 Religious Worship 1 1 1 4 7 1 1 3 2 7 Service 2 0 0 4 6 1 2 2 1 6 Warehouse and Storage 1 2 2 5 10 1 2 4 3 10 TOTAL Commercial 29 20 24 50 123 26 22 46 29 123
Notes: NE = Northeast, M = Midwest, S = South, W = West. *proportional allocation rounded and in a few cases adjusted by + 1 to reconcile to the total achieved.
A-10
Sample improvements compared to the prior study Avoiding Clustering: The 2002 study was clustered into 20 geographic primary sampling units (PSU), selected with probability proportional to estimate motor electricity consumption. The clustering was to limit field costs in a first-of-its kind study. The current MSMA sample was drawn from across the United States, without clustering. This improves its representativeness. Simpler Sample Allocation and Sample Management: Both studies had similar overall sample sizes for the manufacturing sector. For both, it was desirable to ensure coverage and distribution of the sample across subsectors, sizes, and geography; but it was not practical to allocate the sample to cells defined by the intersection of those. The prior study addressed this by randomly selecting the subsector and size bins that would be sampled from within each PSU, then selecting sites within those cells. This approach was complex to implement, both at the design and fulfillment stage. The current study established targets by sector-size combination and set soft targets by census region. This approach was more straightforward to implement and achieved good distribution of the sample across the country. Use of sector variability in sample allocation: The prior study allocated the sample in proportion to estimated motor electricity consumption, after setting a minimum of four per subsector. The current study used within-sector variability estimates from the MECS and CBECS to estimate the sample allocations that would estimate sector-level motor system electricity consumption with the best precision for the overall sample size. Ensuring minimum sample size for each subsector: The prior study set a minimum target of four per subsector, and for a few subsectors achieved only one or two. The final sample design for the MSMA allocated a minimum of seven to each subsector, and achieved at least that number, with the exception of Leather and Allied Products. This approach ensured some information for even the low-consuming subsectors. Most of these subsectors had relative precision better than 10 percent at 90 percent confidence, even with these small sample sizes. Leather and Allied Products had only four completed sites. Better targeted recruitment lists: The prior study used Dun and Bradstreet records to identify establishments in manufacturing SIC codes. This may have resulted in some sites being included in the study that were not primarily manufacturing. Also, the range and completeness of data fields available at that time in such databases was more limited than what is currently available. The current study used directories specialized for the industrial sectors from MNI, which identifies itself as the nation’s oldest and largest compiler and publisher of industrial information. The MNI data include primary and secondary SIC codes, employment, floorspace, and business descriptions, as well as contact information. For commercial lists, the study used SMR’s Enhanced Commercial Property Database, which combines public records databases such as those of tax assessors with additional sources. The database includes floorspace and building use, as well as location and contact information. Overall results: The estimates of motor system electricity consumption based on the current study have much better precision than those from the prior study. In part, this improvement likely reflects the closer relationship between motor system electricity consumption and total site electricity consumption used as the basis for ratio estimation in this study versus the
A-11
relationship between motor system electricity consumption and employment used in the prior study. The better precision may also reflect use of better targeted recruitment lists. Limitations of separating recruitment lists from the sample allocation population In most studies with sampling for primary data collection, the same list of units defines both the population that will be represented by the study and the list of units from which the sample will be selected. For the MSMA, the CBP and CBECS aggregate data were used to determine the counts of establishments and employees by size group, while individual sites were recruited from separate lists.
The recruited sample was selected from the lists according to the allocations based on the separate population data. To the extent the recruitment list coverage is not fully aligned with the population data, some bias may result.
Further, with this approach, calculation of population totals requires scaling motor-to-whole-site consumption ratios determined from the sample by population total whole-site consumption. That consumption is known only from energy consumption surveys, which are conducted only periodically and have a lag between data collection and results publication. Thus, for example, the subsector motor system electricity consumption estimates from this study combine:
1. the subsector ratio of motor system electricity to whole-site electric consumption, determined from the sample, and
2. total subsector electric use, from the 2014 MECS or 2012 CBECS.
Thus, bias may result both from coverage discrepancies in the lists used for recruiting and in the lag from the most recent population energy survey. Data sources Table 44 provides the data sources used, how they were used in the study, and links to the data themselves.
A-12
Table 44: Data sources used Data Use Website 2013 State-Level Census Data By NAICS and Size
Appendix B: Weighting Description Construction of weights Basic weights Three weights were developed to expand the survey assessment data at the motor level to the national level. The expansion is conducted separately by subsector (manufacturing NAICS code or commercial building type), with each subsector stratified into three size categories (based on the number of employees for manufacturing sites and the square footage for commercial sites).
Each site belongs to a unique subsector-size combination. Each motor within each surveyed site belongs to one of eight horsepower size ranges, which range from 1 hp to larger than 1,000 hp.8 The three weights developed are:
1. Quantity 2. Preliminary Motor to Site Weight 3. Site to National Weight
These weights and their combinations are described below. Quantity This weight is recorded with the assessed data. The quantity associated with a motor record is the number of motors at the site that are identified by the assessor as being the same as the recorded motor, meaning they are identical motors with identical usage patterns, only differing on their unique nameplate serial number. Preliminary Motor to Site Weight This weight is the number of motors at the site represented by each observed motor, where all motors included in a quantity count are treated as observed. Using this weight, the weighted total of the data on the observed motors provides the estimated total for the site as a whole, for each variable of interest. If all motors treated as observed were recorded individually, rather than being accounted for in the quantity variable, this preliminary motor to site weight would be used directly to weight each motor package record. To produce a weight that is the number of motors represented by an observed motor consisting of multiple identical motors, an additional factor is applied to the preliminary motor to site weight, to produce the final motor to site weight described below. The preliminary motor to site weight is calculated separately for each horsepower size category present at the site. For each horsepower size category at a site, the motor to site
8 For weighting purposes, all motors larger than 1,000 hp were considered to be part of a single bin. A separate field in the dataset (“motor size bin”) was used in the analyses. This process field-categorized sampled motor packages larger than 1,000 hp into three separate bins (1001-2001 hp, 2001-5001 hp, and 5001+ hp).
B-2
weight is the ratio of the number of motors observed at the site in a given horsepower size range to the estimated total motor count for that site and horsepower size. The numerator for the weight came from the total number of surveyed motors by horsepower size category. The denominator of the weight was based on the motor count for the size bin at the site.
The total motor count Qjh for the site and horsepower size was calculated as the sum of the counts for that horsepower size over all departments at the site. The total observed in the denominator was calculated as the sum of the quantities for that horsepower size, over all the motor package records for the site. Table 45 shows an example of this calculation for multiple horsepower sizes at a site. The example site had 72 estimated motors and 71 observed motors across five horsepower size bins. All motors were observed during the assessment for four of the five horsepower size bins. The remaining horsepower size bin (6-21 hp) had 26 estimated motors and 25 observed motors. The resulting weight for that horsepower size bin for the site was 26/25 = 1.04.
Table 45: Example preliminary motor to site weight Motor hp Size Bin
Site to National Weight This weight is the number of sites/facilities in the full national population represented by each observed site. Using this weight, the weighted total of the site-level observations or estimates provides the estimated total for the subsector as a whole. The site to national weight is calculated for each combination of subsector and site size. Subsector population totals were taken from the 2012 CBECS for commercial subsectors and from the 2014 MECS for manufacturing subsectors. The subsector-size total population count
Preliminary Motor to Site Weight Calculation Formula
For site j and hp size h, the preliminary motor to site weight is calculated as:
WMSjh = Qjh/ Σr qjhr Where:
WMSjh = motor to site weight for hp size h at site j Qjh = estimated total motor count for hp size h at site j qjhr = quantity for motor package record r in hp size h at site j The summation is over all motor package records r at site j.
B-3
was estimated as part of the sample design process.
Our example site in Table 45 was in the commercial office subsector. Table 46 shows the site to national weight calculations for commercial offices. Our example site was a large office, so the site to national weight was calculated as the number of estimated large offices in the population (6,976) divided by the number of sampled sites (5), which is 6,976/5 = 1,395.2
Table 46: Example site to national weight calculation (commercial office subsector)
Size Category
Estimated Population of Sites (N)
Number of Sampled Sites
(N)
Site to National Weight (WSN)
Large 6,976 5 1,395.2 Medium 143,560 7 20,508.6 Small 861,836 4 215,459.1
Combined weights The final motor to site weight for a given motor package record r and horsepower size h at site j is the product of the quantity qjhr and the preliminary motor to site weight. For our example site, we show the calculation of the combined motor to site weight for each of the motors horsepower size bin 6-21 hp in Table 47. The weight is the product of the preliminary motor to site weight and the quantity of motors observed for each motor package record.
Site to National Weight Calculation Formula
For subsector g and site size z, the site to national weight is calculated as:
WSNgz = Ngz/ngz Where:
WSNgz = site to national weight in subsector g, site size z Ngz = population count of sites in subsector g, site size z, from MECS or CBECS ngz = sample count of sites in subsector g, site size z
Final Motor to Site Weight Calculation Formula
For motor record r of hp size h at site j, the final motor to site weight is calculated as: WCMSjhr = qjhr WMSjh
Where: WCMSjhr = final motor to site weight qjhr and WMSjh are calculated as indicated above.
B-4
Table 47: Example combined motor to site weight calculation Motor Preliminary
The combined motor to national weight is the number of motors in the population represented by a given motor record in the survey data. Using this weight, the weighted total of a given variable over the observed motors provides the estimated total of that variable for the nation as a whole. This weight is obtained by multiplying the motor to site weight and the site to national weight.
Combined Motor to National Weight Calculation Formula
For motor record r of HP size h at site j in subsector g and site size z, the final motor to national weight is calculated as:
WCMNgzjhr = WCMSjhrWSNgz
Where: WCMNgzjhr = combined motor to national weight WCMSjhr and WSNgz are calculated as indicated above.
B-5
Table 48 shows the calculation of the combined motor to national weight for the same motor package records as were shown in Table 47. The combined motor to national weight is the product of the final motor to site weight and the site to national weight.
Table 48: Example combined motor to national weight calculations Motor Motor Size
Ratio estimation expansion The weighted estimates shown thus far are a direct application of the weights, known as mean-per-unit (MPU) estimates. For quantities that are correlated with a metric of facility size (such as megawatt-hour consumption, floorspace, employment) in the same subsector, the same dataset can typically produce estimates with better precision by using ratio estimation. The ratio estimators have better precision because they utilize additional information, namely, a size variable known for the population, together with the relationship between the quantity of interest and the size variable. This property is described further below. This section describes basic ratio estimation, the development of ratio-based weights to simplify the calculation of ratio estimates, and stratified ratio estimation. Basic ratio estimator Calculation A ratio estimator for the subsector total YTOT of any variable y of interest that is known at the site level is defined as follows:
B-6
Ry = Σj WSNj yj / Σj WSNj xj YTOTR = Ry XTOT.
In these equations:
Ry = ratio estimator for the variable of interest y. In the MSMA context, Ry is the average ratio of motor system electricity consumption to total site electricity consumption in a given subsector. WSNj = site-to-national weight for site j yj = value of variable of interest, the total motor system electricity use for site j xj = site total electricity consumption XTOT = known subsector total of x, site total electricity consumption, from MECS or CBECS YTOTR = estimated subsector total motor electricity consumption
The summation is over all sites in the sample for a particular subsector. Note that the ratio Ry is the ratio of the site-level mean-per-unit estimate of YTOT to the mean-per-unit estimate of XTOT, both based on the same sample points. That is,
Ry = YTOTMPU/XTOTMPU
where YTOTMPU = mean-per-unit estimate of total of y, based on the sample XTOTMPU = mean-per-unit estimate of total of x, based on the sample
Why use the ratio estimator The ratio Ry tends to have good precision if y and x are well correlated, which they tend to be for any size-related variables x and y. XTOT is typically a fixed known quantity. Thus, the relative precision of the ratio estimator YTOTR depends only on the precision of Ry, which depends on how well correlated y is with the size measure x. XTOT may not be directly known, but rather be an independent estimate measured with error. This is the case for the MSMA, where XTOT is electricity consumption from the EIA Energy Consumption Surveys. For such cases, the uncertainty of XTOT also can be considered in assessing the accuracy of the estimated total for y. Expanding the formula for YTOTR, we have
That is, the ratio estimator of YTOT is the direct mean-per-unit estimator YTOTMPU, rescaled by the ratio of the known total XTOT to the corresponding mean-per-unit estimator XTOTMPU. If the sample randomly tends to have somewhat lower or somewhat higher than average units, the ratio estimator YTOTR adjusts for this, based on the ratio of the known XTOT to the mean-per-unit estimate XTOTMPU.
B-7
For the MSMA, the ratio estimator used is the ratio of each y variable of interest to whole-site electricity consumption. Ratio estimation was also attempted using employment as the denominator x for manufacturing subsectors, and floorspace for commercial subsectors. However, ratios using these denominators were less well determined than those using site electricity consumption. The section below provides key estimates and confidence intervals using the ratio estimator. These tables demonstrate the precision provided by leveraging the site electric consumption data. Ratio-based weights Ratio weight calculation To simplify calculations that would have improved precision if performed using ratio estimation, a set of ratio weights is provided that can be used directly to calculate weighted totals equivalent to ratio estimators. An adjustment factor (adj_elec) is calculated for each subsector as the ratio of subsector level electric consumption in the most current MECS and CBECS studies (2014 and 2012, respectively, in the dataset) to the sample weighted total site electric consumption in each subsector, using the direct site to national weight. That is, for a given subsector:
Adj_elec = XTOT/ Σi WSNi xi
Where XTOT is the total of x for the subsector and the summation in the denominator is over all sites in the sample for the subsector. Substituting for the ratio Ry in the ratio estimator for the total of Y, we have:
YTOTR = (Σj WSNj yj / Σj WSNj xj ) XTOT
= Σj WSNj (XTOT/ Σi WSNi xi) yj
= Σj RWSNj yj
where the ratio site to national weight, RWSN ,for site j is:
RWSNj = WSNj (XTOT/ Σi WSNi xi) = WSNj Adj_elec. Thus, if the ratio weight is used in place of the direct weight, the sample weighted sum produces the ratio estimator rather than the mean-per-unit estimator. To calculate ratio estimates directly from the motor level to the national level, the ratio-adjusted final motor to national weight RWFMN should be used. RWFMNgzjhr = WFMNgzjhr x (XTOTg/ Σiεg WSNi xi) When to use the ratio weight The ratio-based weight is used for calculating any totals from the MSMA, as well as for calculating proportions across different subsectors. For calculation of ratios or proportions within a subsector, the basic weights will yield the same results as the ratio-based weights. Stratified Ratio Estimation When the sample for x and y is stratified, there are two general variations available for the
B-8
ratio estimator. The combined ratio estimator calculates the ratio of the population-level mean-per-unit YTOTMPU to the corresponding mean-per-unit XTOTMPU. Thus, if the sample is stratified, the combined ratio is calculated the same as for the unstratified case above:
Ry = YTOTMPU/XTOTMPU The separate ratio estimator calculates a separate ratio for each stratification cell k.
Ryk = YTOTMPUk/XTOTMPUk YTOTk = RykXTOTk
YTOT = Σk YTOTk = Σk RykXTOTk
The separate ratio estimator is more intuitive in some ways, particularly if there is reason to believe the ratios vary across strata. Also, if stratum-level and higher level ratios are to be calculated, separate ratio estimation ensures arithmetic consistency across the sets of estimators. However, if there is no strong reason to expect a lot of variation in the true underlying ratios across strata, and the sample sizes within cell are small, the combined ratio estimator is typically more reliable. For the MSMA study, our primary interest is in estimates at the subsector level, and sample sizes within a subsector-size cell are often quite small. We therefore used combined ratio estimators across size strata, separately for each subsector. That is, within each subsector we calculated the combined ratio estimator across the three size sampling cells. A separate combined ratio estimator was calculated for each subsector. Applying the weights: Direct expansion Direct expansion for non-count variables This expansion process is appropriate for estimating the total horsepower, kilowatt-hours, and other non-count totals where the total for all motors on a motor record would be appropriately calculated as quantity times the value shown for the variable on the motor package record. Site-level totals To estimate the total over motors within a site j of a variable X known for each motor r, apply the final motor to site weights to the values xr observed for each motor record as follows: Xj = Σr in j xrWCMSjhr
= Σh (Σr in jh xr )WCMSjhr In this formula, the summation of xr is over all motor records r at site j.
Totals across sites When site-level total Xj have been obtained, to estimate the national total, apply the site-to-national weights and the ratio weight (Ry).
XTOT = Σj Xj WSNj Ryj
B-9
= Σgz (Σj in gz Xj) WSNgz Rygz The first line indicates that each site’s value Xj is multiplied by its corresponding site-to-national weight. The second line indicates that this summation can be considered as summing the values of Xj for each subsector g and site size z, then applying the site-to-national weight and ratio weight for that subsector and site size. National totals directly from the motor-record data Using the final motor to national weights and the ratio weight, the national totals are calculated directly from the motor-record data as:
The first line indicates that the summation is over motor package records, each multiplied by its corresponding motor to national weight. The second line shows explicitly that each motor record r belongs to a particular site j, which belongs to a particular subsector g and site size bin z, and is for a motor of a particular horsepower size h. The third line simplifies the motor national weight and ratio weight into a single term: the electric master weight (EMW).
Counts These direct expansion approaches are appropriate for estimating counts of motors with a characteristic. Site-level totals To estimate the total count over motors within a site j of variable quantity known for each package r, apply the preliminary motor to site weights to the values qr observed for each motor record as follows: Qj = Σr in j qrWMSjhr
= Σh (Σr in jh qr )WMSjhr In this formula, the summation of qr is over all motor records r at site j.
Totals across sites When site-level quantities Qj have been obtained, to estimate the national total, apply the site to the national weights and the ratio weight (adj_elec).
The first line indicates that each site’s value Qj is multiplied by its corresponding site-to-national weight. The second line indicates that this summation can be considered as summing the values of Qj for each subsector g and site size z, then applying the site-to-national weight and ratio weight for that subsector and site size. National totals directly from the motor-record data
B-10
Using the motor to national weights and the ratio weight (when multiplied together these are the elec_master_wt field), the national total counts are calculated directly from the motor-record data as:
The first line indicates that the summation is over motor records, each multiplied by its corresponding motor to national weight. The second line shows explicitly that each motor record r belongs to a particular site j, which belongs to a particular subsector g and site size bin z, and is for a motor of a particular horsepower size h. The third line simplifies the motor national weight and ratio weight into a single term: the EMW. Uncertainty Components of uncertainty The MSMA estimates are based on a statistical sample of industrial and commercial facilities. These estimates have uncertainty due to the random sampling. The difference between the estimate based on the sample and the results that would be obtained if the entire population could be observed is the sampling error. The estimates also have non-sampling sources of error or uncertainty. To the extent these errors are equally likely to be in either direction, and do not systematically overstate or understate variables of interest, these are random errors. Non-sampling errors that lead to systematic overestimates or underestimates contribute to bias. Bias ordinarily cannot be quantified. Efforts were made to minimize opportunities for bias in the study design and data collection process. The magnitude of random error, including both sampling and non-sampling random error, is measured by the standard error and confidence intervals. The standard error is a measure of the “typical” difference between the estimate and the true population value. The confidence interval is a window that brackets the point estimate, and has a given likelihood of including the true value. Tables provided for this study give 90 percent confidence intervals. Basic confidence intervals capture the uncertainty due to the MSMA sampling only. For totals calculated as the product of an MSMA ratio and an EIA Energy Consumption Survey electricity total, the combined confidence interval reflects the random error in both the MSMA and the Energy Consumption Survey samples.
Basic confidence intervals Ratio estimates and their standard errors and related statistics were calculated using the SAS procedure “proc surveymeans.”9 This SAS procedure is used to calculate ratio estimation by domains while providing the correct standard error of the estimate for each domain and overall. The procedure takes into account defined clusters of observations (sites) and stratification and (as used in this analysis) calculates Taylor series errors.
Combined uncertainty including the Energy Consumption Survey estimates
9 SAS. 2016. SAS/STAT®14.2 User’s Guide: The SURVEYMEANS Procedure https://support.sas.com/documentation/onlinedoc/stat/142/surveymeans.pdf.
The basic confidence intervals reflect the full sampling uncertainty for ratios. For MSMA totals calculated by multiplying the ratio by the EIA Energy Consumption Survey total electric consumption,10 the uncertainty in the electric consumption totals also contributes to the uncertainty of the MSMA estimate. The combined standard error calculation uses the relative standard error (RSE) of the estimates; that is, the ratio of the standard error to the estimate. When two estimates are independent, the RSE of their product is approximated by the square root of the sum of squared RSE’s. The MSMA ratio and the EIA Energy Consumption Survey total are
independent estimates, so this formula applies.
For most subsectors, the uncertainty in the EIA Energy Consumption Survey electric total increases the confidence interval widths by 20 percent or less; in many cases by much less than 1 percent. The exceptions are Printing and Rubber, with a 32 percent increase, and Textile Mills, with a 72 percent increase. Both of these subsectors have low motor electricity consumption.
Non-sampling error and bias Non-sampling sources of error in the MSMA estimates include the following sources: Non-response. Recruitment for studies of this type is challenging. How similar the sites agreeing to an assessment are to those that decline, within the same sampling cell, is unknown. The sample expansion and standard error estimation assumes that within each sampling cell the chance of being included in the study is the same for all sites in the population. Frame coverage and alignment. The sample allocation was based on CBP data on industrial establishment and employment by NAICS group and employment size, and on CBECS data on commercial buildings employment totals by building type and size bin. The CBP data are the standard, comprehensive dataset on U.S. establishments. There is no authoritative list of
10 2012 CBECS data Table C13. http://www.eia.gov/consumption/commercial/data/2012/index.cfm?view=microdata. 2014 MECS data Table 11.1. https://www.eia.gov/consumption/manufacturing/data/2014/#r13.
Combined SE Calculation Formula
When the subsector total for a quantity y is calculated as the product of an electricity ratio Ryg from the MSMA data and the electricity total XTOTg from the corresponding EIA Energy Consumption Survey,
YTOTRg = Ryg XTOTg, the combined RSE for the estimated total is approximated by:
commercial buildings; the CBECS is the most comprehensive, systematic set of estimates on commercial floorspace and activity. Recruitment was conducted from the MNI U.S. Manufacturing Industry Database and the SMR Enhanced Commercial Property Database establishment lists. These lists were used because they had good contact information, but they are not an authoritative comprehensive source. They are likely to have some missed sites and inaccuracies. Assumptions for derived values. Some of the data reported in the MSMA are calculated or imputed, rather than directly observed. Errors in assumptions for these derived values would tend to affect all derived elements similarly. This is detailed below. Measurement/observational errors. Individual data values may be misrecorded during the field assessment. Other errors may arise during data entry and processing. To the extent such errors are equally likely to occur in either direction, they can be regarded as a form of random error that is captured by the variance estimation. Errors that tend to be more in one direction than another — such as an order of magnitude error, which results in overestimates more often than underestimates, contribute to bias. The quality control processes implemented for the MSMA were designed to identify and correct such errors.
Imputation approach Total site consumption (kWh) was not collected at five sites, and several sites had inventoried motors of a certain size (horsepower bin) with no sampled motors observed. Omitting these records would result in underestimates of motor consumption, necessitating imputation to fill values. The imputations used three calculation methods with clear decision rules to determine which method would be used for each missing value. For each imputation the following approaches and decision rules were used:
1. The default approach was to take the average within the subsector and size group used in the sample design.
2. When approach #1 was based on fewer than two sites, approach #2 was used. This approach used the average taken within the subsector and the combined sample in the small- and medium-size categories (no large sites required imputation).
3. When approach #2 also had fewer than two observations, approach #3 was used. Approach #3 used the average across sampled sites for the whole subsector.
Site consumption (MWh) imputation Total site megawatt-hour consumption was imputed for 5 of the 369 sampled sites, all in the commercial sector. The imputation method used was to impute based on the ratio of observed site electricity consumption to observed alternate measure of size averaged across the known sample most similar to the site with missing information (based on the decision rules above). “Site size” was the number of employees for industrial sites and square footage for commercial sites. The imputation multiplied the average ratio of site megawatt-hours to site size by the known site size for the site to estimate the site megawatt-hours. Table 49 and Table 50 provide details on the amount of imputation. The tables show the number of sites and millions of
B-13
weighted site megawatt-hours for each subsector, both imputed and total, along with the percent of each subsector that required imputation.
B-14
Table 49: Imputation for unobserved industrial site consumption Subsector Sites Weighted Site Million MWh
Total in Sample
Imputed Site MWh
Percent of Subsector Sampled
Sites Imputed
(%)
Total Imputed Percent of Subsector Imputed
(%)
Food Products 18 0 0.0 72 0.0 0.0 Beverage and Tobacco Products 7 0 0.0 10 0.0 0.0 Textile Mills 7 0 0.0 13 0.0 0.0 Textile Product Mills 7 0 0.0 3 0.0 0.0 Apparel 7 0 0.0 1 0.0 0.0 Leather and Allied Products 4 0 0.0 0 0.0 0.0 Wood Products 8 0 0.0 21 0.0 0.0 Paper and Allied Products 13 0 0.0 56 0.0 0.0 Printing and Related Support 7 0 0.0 14 0.0 0.0 Petroleum and Coal Products 13 0 0.0 49 0.0 0.0 Chemicals 19 0 0.0 134 0.0 0.0 Plastic and Rubber Products 19 0 0.0 56 0.0 0.0 Nonmetallic Mineral Products 8 0 0.0 38 0.0 0.0 Primary Metals: Iron and Steel Mills and Ferroalloy Manufacturing
Table 50: Imputation for unobserved commercial site consumption Subsector Sites Weighted Site Million MWh
Total in Sample
Imputed Site MWh
Percent of Subsector Sampled
Sites Imputed
(%)
Total Imputed Percent of Subsector Imputed
(%)
Education 11 0 0.0 134 0.0 0.0 Food Sales 7 0 0.0 61 0.0 0.0 Food Services 7 0 0.0 82 0.0 0.0 Health Care: Inpatient 7 0 0.0 74 0.0 0.0 Health Care: Outpatient 7 0 0.0 33 0.0 0.0 Lodging (Includes Nursing) 7 0 0.0 89 0.0 0.0 Mercantile: Retail (other than mall) 8 0 0.0 82 0.0 0.0 Mercantile: Enclosed and Strip Malls 5 2 40.0 117 19.0 16.3 Office 16 1 6.3 264 21.7 8.2 Public Assembly 9 0 0.0 81 0.0 0.0 Public Order and Safety 7 1 14.3 22 3.4 15.5 Religious Worship 7 0 0.0 24 0.0 0.0 Service 7 0 0.0 37 0.0 0.0 Warehouse and Storage 11 1 9.1 100 22.2 22.3 Other (Includes CBECS = Other, Laboratory) and Vacant
7 0 0.0 64 0.0 0.0
B-16
Unobserved motor consumption imputation Individual motor consumption was imputed using the weighted average of motor consumption within motors of the same horsepower size bin. The decision rules above were used to determine the sites included in the average used for imputation. Table 51 and Table 52 provide details on the amount of imputation. The tables show the number of sites, motors, and millions of weighted motor megawatt-hours in each subsector, both those that required imputation and the total, along with the percent of each subsector that required imputation.
B-17
Table 51: Imputation for unobserved industrial motors Subsector Sites Motors Weighted Motor Million MWh
Office 16 0 0.0 479 0 0.0 93 0.0 0.0 Public Assembly 9 0 0.0 232 0 0.0 28 0.0 0.0 Public Order and Safety 7 0 0.0 189 0 0.0 12 0.0 0.0 Religious Worship 7 0 0.0 97 0 0.0 10 0.0 0.0 Service 7 0 0.0 29 0 0.0 7 0.0 0.0 Warehouse and Storage 11 0 0.0 654 0 0.0 40 0.0 0.0 Other (Includes CBECS = Other, Laboratory) and Vacant
7 0 0.0 1,101 0 0.0 29 0.0 0.0
B-19
Calculating motor consumption and motor counts results Ratios for the variables of interest were calculated and applied to the associated ratio to estimate the total number of motors and total motor megawatt-hour consumption per subsector. The ratio estimation results were weighted by the site to nation weight and MECS/CBECS adjustment factor, equaling 1, and calculated 90 percent confidence intervals. The ratio estimator calculation for the number of motors per subsector is as follows. The numerator (total_motors) represents the total number of motors per subsector. The denominator (SI_MWh) is the total site level electricity consumption in MWh per subsector.
The resulting ratio is the number of motors per site-level MWh. The magnitude calculation for the number of motors per subsector is as follows:
YTOTk = RykXTOTk
YTOT = Σk YTOTk = Σk RykXTOTk
YTOT MOTORS = Σk RMOTORSk SI_MWh The ratio estimator calculation for the total motor MWh consumption per subsector is as follows. The numerator (wt_sum_mtr_MWh) represents the weighted site level sum of motor MWh consumption per subsector. The denominator (SI_MWh) is the total site level electricity consumption in MWh per subsector.
The resulting ratio is the motor MWh per site-level MWh. The magnitude calculation for the total motor MWh consumption per subsector is as follows:
YTOTk = RykXTOTk
YTOT = Σk YTOTk = Σk RykXTOTk
YTOT MWH = Σk RMWHk SI_MWh
MSMA confidence limits The tables in this section (Table 53 through Table 64) and the next (Table 65 through Table 68) show the same results, but with different confidence limits. The difference in the confidence limits is that confidence intervals in this section includes only the errors associated with this MSMA study, while the next section shows the errors on which the confidence limits are based
B-20
and incorporates both this study’s error and the error associated with consumption estimates from MECS and CBECS. CI stands for confidence interval, LCL stands for lower confidence limit, and UCL stands for upper confidence limit. Table 53: Number of motors relative to the site level electricity consumption in MWh ratio results
and 90% confidence interval (CI) by sector Sector N Ratio Ratio 90%
CI LCL Ratio 90%
CI UCL
Industrial 246 0.01 0.01 0.01
Commercial 123 0.03 0.03 0.04
All 369 0.03 0.02 0.03
Table 54: Magnitude of the number of motors and 90% confidence interval (CI) by sector Sector N Number of
Motors Number of
Motors 90%
CI LCL
Number of Motors
90% CI UCL
Industrial 246 10,832,523 9,775,140 11,889,907
Commercial 123 41,683,816 37,283,498 46,084,135
All 369 52,516,340 47,990,761 57,041,919
Table 55: Cumulative motor MWh consumption relative to site level electricity consumption in MWh ratio results and 90% confidence interval (CI) by sector
Sector N Ratio Ratio 90% CI LCL
Ratio 90% CI UCL
Industrial 246 0.66 0.71 0.69
Commercial 123 0.40 0.45 0.43
All 369 0.51 0.55 0.53
Table 56: Cumulative motor MWh consumption magnitude results and 90% confidence interval (CI) by sector
Furniture and Related Products 7 81,503 46,867 116,138
Miscellaneous 13 194,775 71,006 318,544
Municipal Wastewater 10 100,599 3,637 197,561
B-23
Table 59: Industrial cumulative motor MWh consumption relative to site level electricity consumption in MWh ratio results and 90% confidence interval (CI) by subsector
Subsector N Ratio Ratio 90% CI LCL
Ratio 90% CI UCL
Food Products 18 0.66 0.55 0.77
Beverage and Tobacco Products 7 0.73 0.52 0.95
Textile Mills 7 0.79 0.77 0.82
Textile Product Mills 7 0.69 0.66 0.72
Apparel 7 0.48 0.17 0.78
Leather and Allied Products 4 0.77 0.71 0.83
Wood Products 8 0.92 0.86 0.97
Paper and Allied Products 13 0.80 0.73 0.88
Printing and Related Support 7 0.67 0.52 0.83
Petroleum and Coal Products 13 0.80 0.65 0.95
Chemicals 19 0.79 0.71 0.87
Plastic and Rubber Products 19 0.72 0.64 0.79
Nonmetallic Mineral Products 8 0.70 0.61 0.79 Primary Metals: Iron and Steel Mills and Ferroalloy Manufacturing
7 0.40 0.33 0.47
Primary Metals: Other 14 0.60 0.54 0.65
Fabricated Metal Products 21 0.61 0.47 0.75
Machinery 8 0.68 0.64 0.73
Computer and Electronic Products 8 0.38 0.26 0.49
Electrical Equipment and Appliances 7 0.67 0.63 0.70
Transportation Equipment 14 0.71 0.65 0.77
Furniture and Related Products 7 0.62 0.50 0.74
Miscellaneous 13 0.66 0.56 0.77
Municipal Wastewater 10 0.90 0.77 1.02
B-24
Table 60: Industrial cumulative motor MWh consumption magnitude and 90% confidence interval (CI) by subsector
Subsector N Motor Consumption
(MWh)
Motor Consumption (MWh) 90%
CI LCL
Motor Consumption (MWh) 90%
CI UCL
Food Products 18 47,585,342 39,731,627 55,439,057
Beverage and Tobacco Products 7 7,108,466 5,074,065 9,142,866
Mercantile: Retail (other than mall) 8 3,401,350 2,337,755 4,464,945
Mercantile: Enclosed and Strip Malls 5 6,307,752 5,880,181 6,735,324
Office 16 4,762,177 3,370,638 6,153,716
Public Assembly 9 2,525,907 1,050,487 4,001,327
Public Order and Safety 7 759,636 408,554 1,110,717
Religious Worship 7 1,941,057 906,899 2,975,216
Service 7 1,892,272 710,413 3,074,131
Warehouse and Storage 11 3,611,794 2,389,933 4,833,656 Other (Includes CBECS = Other, Laboratory) and Vacant
7 542,034 181,633 902,436
B-27
Table 63: Commercial cumulative motor MWh consumption relative to site level electricity consumption in MWh ratio results and 90% confidence interval (CI) by subsector
Subsector N Ratio Ratio 90% CI LCL
Ratio 90% CI UCL
Education 11 0.57 0.52 0.62
Food Sales 7 0.39 0.33 0.44
Food Services 7 0.43 0.38 0.47
Health Care: Inpatient 7 0.47 0.41 0.54
Health Care: Outpatient 7 0.60 0.47 0.73
Lodging (Includes Nursing) 7 0.66 0.56 0.77
Mercantile: Retail (other than mall) 8 0.37 0.32 0.42
Mercantile: Enclosed and Strip Malls 5 0.27 0.25 0.29
Office 16 0.37 0.28 0.46
Public Assembly 9 0.34 0.28 0.40
Public Order and Safety 7 0.55 0.51 0.60
Religious Worship 7 0.44 0.33 0.55
Service 7 0.19 0.16 0.21
Warehouse and Storage 11 0.48 0.37 0.59 Other (Includes CBECS = Other, Laboratory) and Vacant
7 0.45 0.40 0.50
B-28
Table 64: Commercial cumulative motor MWh consumption magnitude results and 90% confidence interval (CI) by subsector
Subsector N Motor Consumption
(MWh)
Motor Consumption (MWh) 90%
CI LCL
Motor Consumption (MWh) 90%
CI UCL
Education 11 76,338,893 69,891,707 82,786,078
Food Sales 7 23,642,670 20,267,234 27,018,105
Food Services 7 34,776,262 30,995,975 38,556,548
Health Care: Inpatient 7 34,759,383 29,958,510 39,560,256
Health Care: Outpatient 7 20,085,177 15,680,051 24,490,303
Mercantile: Retail (other than mall) 8 30,649,528 22,986,693 38,312,363
Mercantile: Enclosed and Strip Malls 5 33,771,833 23,504,768 44,038,898
Office 16 93,334,776 66,360,897 120,308,654
Public Assembly 9 27,552,463 19,902,041 35,202,885
Public Order and Safety 7 11,816,966 7,665,664 15,968,269
Religious Worship 7 10,487,390 6,792,420 14,182,361
Service 7 6,892,861 5,257,861 8,527,861
Warehouse and Storage 11 40,054,011 25,924,270 54,183,752
Other (Includes CBECS = Other, Laboratory) and Vacant
7 28,672,527 17,278,958 40,066,095
C-1
Appendix C: Field Assessment Questions This appendix documents the questions used by the engineering team (“assessor[s]”) at each site during the on-site motor system field assessment. Six sets of questions were used and are documented here:
• Basic motor inventory questions were used to gather motor inventory and operating characteristics for all motors across all systems observed at the facility (Table 69).
• Pump checklist questions were for pump systems greater than 20 hp and operating more than 2,000 hours. These were asked to provide more detailed information on the pump system and its operating characteristics (Table 70).
• Fan/blower questions were for fan/blower systems greater than 20 hp and operating more than 2,000 hours. These were asked to provide more detailed information on the fan/blower system and its operating characteristics (Table 71).
• Compressed air checklist questions were for compressed air systems greater than 20 hp and operating more than 2,000 hours. These were asked to provide more detailed information on the compressed air system and its operating characteristics (Table 72).
• Refrigeration checklist questions were for refrigeration systems greater than 20 hp and operating more than 2,000 hours. These were asked to provide more detailed information on the refrigeration system and its operating characteristics (Table 73).
• Facility general motor questions were used to gather information on general motor system energy management and maintenance protocols (Table 74).
The questions are documented in the form of six tables corresponding to each of the above. The first column (Field #) provides the question number, the second (Field Label) provides the question, the third (Field Type) provides the format for answering the question, the fourth (Field Description) provides further details on the Field Label, the fifth (Field Options) provides the answer choices when applicable, and the sixth (Other Notes) provides additional guidance on how the question should be answered.
C-2
Basic motor inventory questions
Table 69: Basic motor inventory Field # Field Label Field Type Field Description Field Options Other Notes 1.01 Department Dropdown Various
Departments previously entered in by assessor
List of assessor entered departments
1.02 Sub Department Description
Open Ended
An optional description of the area that the system is in. Intended to assist in identifying motor. Not intended for LBNL use.
1.03 Package Name
Open Ended
A required name
1.04 Quantity Numerical The number of identical systems that this entry encompasses. (All systems encompassed in the quantity have the same or nearly the same characteristics.)
1.05 Black Box Check Box If data regarding individual motors and motor-driven components within the package are inaccessible, then "Black Box" is selected. If "Black Box" is selected, the assessor collects operation and nameplate data for the complete package.
Single Checkbox (Black box or not) If selected, the following fields are hidden from collection: "Mechanical Transmission Type," "Component Size” 1 and 2, "Load Control Type," " Control Setting," "Motor Load Vary," "Motor Load Feedback," "Load varying output controls," and "System run unnecessarily," as well as all nameplate fields that hide when nameplate is "illegible."
1.06 Rated Power Numerical Open Ended
Nameplate rated nominal output power
1.07 Rated Power Unit
Dropdown Unit of nameplate rated power
HP, kW
C-3
Field # Field Label Field Type Field Description Field Options Other Notes 1.08 Rated Power
Source (unlabeled)
Radio Button
Source of rated power information
Observed, From Contact, Visually, Estimated, Other
1.09 End Use Component
Fixed Dropdown
Type of driven equipment. This category/type will be used to aggregate motor data by application and to associate motor end uses to other parameters such as NAICS
Pump, Centrifugal; Pump, Positive Displacement; Pump, Other; Fan, Centrifugal / Blower; Fan, Axial; Fan, Other; Blower, Positive Displacement; Vacuum Pump; Air Compressor, Rotary Screw; Air Compressor, Centrifugal; Air Compressor, Recip; Air Compressor, Other; Refrig Compressor, Screw; Refrig Compressor, Recip; Refrig Compressor, Hermetic; Refrig Compressor, Centrifugal; Material Handling; Material Processing; None of the Above
C-4
Field # Field Label Field Type Field Description Field Options Other Notes 1.10 Process Type Fixed
Dropdown A description of the application of the package in general terms
Refrigeration/Chiller Plant (including condensers/towers and primary pumps); Process/Equipment Cooling (including secondary pumps); Space Cooling (including secondary pumps); Cleaning In Place (CIP); Other Cleaning; Gas Compression (other than air or refrigerant); Compacting; Extrusion; Molding; Machining/Forming; Other Material Shaping; Grinding/Crushing/Shredding; Screening/Filtration/Separation; Mixing/Agitating; Other Processing; Compressed Air Plant; Hydraulic System; Conveying; Packaging; Product Transfer; Dry Waste Management (not including dust); Dust Collection; Wastewater Management; Hot Water/Steam Plant; Process Heating; Space Heating; Heatless Blowoff Drying (e.g., Air Knife); Aeration; Supply/Return Air Handling; Exhausting; None of the Above; Do Not Know
1.11 Schedule Fixed Dropdown
The name of the general schedule that the package operates with
List of assessor entered schedules Defaults to the schedule associated with the previously selected department
1.12 Annual Hours Numerical Annual hours that the equipment operation is based on
From 1 to 8,736 The "Annual Hours" is not necessarily the actual annul run time of the equipment. The "Annual Hours" multiplied by the "Cycling Factor" equate to the estimated actual run hours of the equipment.
C-5
Field # Field Label Field Type Field Description Field Options Other Notes 1.13 Cycling
Factor Percent The percent of the
"Annual Hours" that the equipment is energized and operating
1% to 100%
1.14 Facility Motor/Equip-ment Tag
Open Ended
Any facility produced code used to identify the equipment and/or motor.
Is used only for adding clarity to the inventory and report produced for the facility for their participation
1.15 Mechanical Transmission Type
Fixed Dropdown
The applicable mechanical drive type
Direct Shaft; Belt (Unknown Type); V belt; Cog Belt; Synchronous Belts; Gearbox; None of the Above; Do Not Know
Field is hidden if field number 1.05 ≠ "Yes"
1.16 Package Notes
Open Ended
For the assessor to write down any notes on the motor that can be used later to better clarify the performance and operation of the system
Field is hidden if field number 1.05 ≠ "Yes" and/or f field number 1.06 < 20 hp
1.17 Component Size 1 (Flow)
Numerical The rated nominal output of the driven equipment (flow only)
1.18 Component Size 1 Unit (Flow)
Editable Dropdown
The unit of the "Component Size 1"
GPM; CFM; ft/sec; Tons (Refrig)
Other units can be added to the list by the assessor, if necessary. Field is hidden if field number 1.05 ≠ "Yes" and/or if field number 1.06 < 20 hp
1.19 Component Size 2 (Press.)
The rated nominal output of the driven equipment (Pressure only). Typically, only used for equipment where both flow and pressure are critical points, e.g., Pumps and Air Compressors.
Field is hidden if field number 1.05 ≠ "Yes" and/or f field number 1.06 < 20 hp
C-6
Field # Field Label Field Type Field Description Field Options Other Notes 1.20 Component
Size 2 Unit (Press.)
Ft-Head-PSIG; Bar; In-Wg; In-Hg;
Other units can be added to the list by the assessor if necessary. Field is hidden if field number 1.05 ≠ "Yes" and/or f field number 1.06 < 20 hp
C-7
1.21 What is the Load Control Type?
Fixed Dropdown
The system, if any, used to control the output from the motor-driven component
Variable Frequency Drive; Throttle Valve; Inlet Vane; Inlet Damper; Outlet Damper; On/Off Cycling; Load/Unload; Multispeed Motor; Slide Valve; Hydraulic Drive; Eddy Current Drive; Adjustable Speed Gearbox; Mechanical Drive; Multiple Methods w/ VFD; Multiple Methods w/o VFD; None (bypass loop); None (constant load); None of the Above; Do Not Know
Field is hidden if field number 1.05 ≠ "Yes" and/or if field number 1.06 < 20 hp. Special instructions given to assessors: Even if the motor load does not fluctuate, indicate any output controls being utilized in the system. For example, a throttle valve set to 50% flow all the time. Equipment with "No Control”: For equipment that always run at full speed and have a constant load, select "None (constant load)." These systems are not likely candidates for control improvement. For example, a process chilled-water pump supplying a constant cooling load. For equipment that always run at full speed but have potential to fluctuate their output, select "None (bypass loop)." These systems may be candidates for control improvements. For example, a chilled water loop with a varying cooling load and 3-way bypass valves. On/Off Cycling: For fixed output equipment that cycle frequently
C-8
Field # Field Label Field Type Field Description Field Options Other Notes and are possible candidates for VFD. .control select "ON/Off Cycling". For example, evaporative condenser fans. For fixed output equipment that are automatically cycled, but infrequently, select "None (constant load)" or "None (bypass loop)", depending on the system design. For example, a constant load wastewater pump that only comes on-line during wet-weather flows.
C-9
Field # Field Label Field Type Field Description Field Options Other Notes 1.22 What is the
control setting?
Radio Button
If the input to the system operation is automatic or manual
Manual Automatic Do Not Know
Field is hidden if field number 1.05 ≠ "Yes" and/or f field number 1.06 < 20 hp. This is to indicate if the output of the equipment is being controlled based on an automatic feedback system, or is manually adjusted by an operator. An example of manual adjustment is when operators manually adjust the speed of VFD-controlled conveyer motors based on product loading. This is also to check for possible cases of incomplete commissioning of VFD or other control installations, where output should be automatically controlled, but for some reason is not.
C-10
Field # Field Label Field Type Field Description Field Options Other Notes 1.23 Does the
motor load vary over time?
Radio Button
This is to indicate if the motor brake horsepower ever fluctuates to different values during its typical operation. See "Other Notes" for further clarification and special circumstances of selection.
Yes; No; Do Not Know
Field is hidden if field number 1.05 ≠ "Yes" and/or if field number 1.06 < 20 hp. This is to indicate if the motor load changes significantly based on demand. Just because a piece of equipment is utilizing a control device, does not necessarily mean its output fluctuates. For example, a VFD-equipped fan that is set to constant speed. A note on "On/Off Cycling": Equipment that cycles frequently based on loading and are possible candidates for VFD control, for example condenser fans, should answer "Yes."
1.24 Percent Time Equipment (Not Motor) is below 40% Output:
Percent This is to indicate the amount of time that the equipment is on, but operating at below 40% of its designed output. This is not referring to the motor load factor.
1% to 100% An example of this is a fan designed to output 1,000 CFM at full power, but is controlled down to 250 CFM for 30% of its operating time.
1.25 Percent Time Equipment (Not Motor) is at 100% Output:
Percent This is to indicate the amount of time that the equipment is on, and operating at 100% of its designed output. This is not referring to the motor load factor.
1% to 100% An example of this is a fan designed to output 1,000 CFM at full power, and operates at design output (1,000 CFM) for 50% of its operating time.
C-11
1.26 Average Motor Load Factor
Percent Average percent (over the total annual run hours of the equipment) of the motor output brake power vs. its rated power.
1% to 125% This is the average MOTOR power output (brake power) divided by its rated output. The assessor should ask the contact for this data first. If the contact’s answer seems plausible to the assessor, considering the answers to the previous several questions, then the assessor should use this value. However, if the contact’s answer does not fit with answers to the previous control and profile answers, then the engineer should use his or her judgment. This field defaults to 75% because most motors are oversized for their typical operation. This default is typically only valid for motors that are known to only operate at full load whenever they are on. If any controls are being utilized on the equipment, whether these controls vary the load, then it is likely this value will likely be less. For controlled equipment that is difficult to assess, a good estimate will be 50%-60%. Certain types of equipment (for example, air compressors), commonly operate well above the "rated" motor power (Full-load load factor >120%)
C-12
Field # Field Label Field Type Field Description Field Options Other Notes 1.27 Is this system
a candidate for improved load-varying output controls?
Radio Button
This question is to indicate if a system is currently being run at a constant output, all the time, but has the potential to vary its output based on varying demand downstream.
Yes; No; Do Not Know
Field is hidden if field number 1.23 = “Yes," and/or field is hidden if field number 1.05 ≠ "Yes" and/or if field number 1.06 < 20 hp
1.28 Motor Load Feedback Parameter (What is the input to the control logic?)
Editable Dropdown
This is the parameter that the equipment is being controlled to.
Air Pressure; Automatic Sequencer; Conveyer Load; Differential Pressure; Dissolved Gas Level; Production Loading (e.g., sawmill saw); Gas Concentration Level; Hydraulic Load; Liquid Level Setpoint; Outdoor Ambient Conditions; HVAC Factors (Indoor and Outdoor Conditions); Process Pressure; Process Temperature; None (Manual Control); Do Not Know
Field is hidden if field number 1.23 ≠ "Yes," and/or field is hidden if field number 1.05 ≠ "Yes" and/or if field number 1.06 < 20 hp
1.29 Does the equipment ever run unnecessar-ily? (i.e., Is this system a candidate for improved runtime controls?)
Radio Button
This is to indicate if a piece of equipment can be controlled to turn off, based on the operation of other equipment, by using interlocking controls or timers.
Yes; No; Do Not Know
Field is hidden if field number 1.05 ≠ "Yes," and/or field is hidden if field number 1.05 ≠ "Yes" and/or field number 1.06 < 20 hp
1.30 Is this a DC Motor?
Indicates if the motor is a DC motor
Yes; No; Do Not Know
1.31 Is Motor Nameplate Legible?
This is to indicate if the motor nameplate information is mostly illegible for any reason.
Yes; No
Field is hidden if field number 1.05 ≠ "Yes"
1.32 Motor Manufacturer
Open Ended
Manufacturer of the motor
Field is hidden if field number 1.05 and/or 1.31 ≠ "Yes"
1.33 Motor Manufacture Country
Editable Dropdown
Country of motor manufacture
U.S.A.; Japan; China; Mexico; Germany
Field is hidden if field number 1.05 and/or 1.31 ≠ "Yes"
C-13
Field # Field Label Field Type Field Description Field Options Other Notes 1.34 Motor
Efficiency Label
Manufacturer produced label indicating relative level of motor efficiency
Premium; Energy Efficient; Standard; No Label
Field is hidden if field number 1.05 and/or 1.31 ≠ "Yes." This is any labeling that is not necessarily attributed to NEMA official labeling. If you see the official "NEMA Premium" stamp, select "Premium" in this field and select "Yes" in the next field. If the motor label says "Premium Efficient" or something similar, but does not display the official "NEMA Premium" stamp, select "Premium" and select "No" in the next field (1.35).
1.35 Does the motor have the official NEMA Premium Stamp?
Radio Button
To indicate if the motor nameplate includes the official NEMA "Premium" stamp indicating that the motor has been certified by NEMA to be of premium energy performance.
Yes; No
Field is hidden if field number 1.05 and/or 1.31 ≠ "Yes."
1.36 NEMA Nominal Motor Efficiency %
Percent The NEMA rated nominal efficiency of the motor
1% to 100%
NEMA Nominal Motor Efficiency % Source
Radio Button
Source of nominal efficiency information
Observed; From Contact; Visually Estimated; Other
1.37 Number of Poles (Sync Speed)
Fixed Dropdown
The number of poles in the motor (or the corresponding synchronous speed)
Hidden if 2.15 ≠ "Motor Controlled Valve Throttling" OR "Manual Valve Throttling" OR "Mix of Throttles and Bypass"
C-18
Field # Field Label Field Type Field Description Field Options Other Notes
2.17 What is the observed speed?
Percent
Observed speed of the pump relative to the rated speed
Hidden if 2.15 ≠ "VFD" OR "Multiple Methods w/ VFD"
2.18 What is the throttle valve type?
Fixed Dropdown
What is the valve technology of the throttle valve?
Ball ; Butterfly; Gate; Other; Do Not Know
Hidden if 2.15 ≠ "Motor Controlled Valve Throttling" OR "Manual Valve Throttling" OR "Mix of Throttles and Bypass"
2.19
Is the VFD appropriate? (or is the pump at full speed all the time?)
Radio Buttons
Attempts to clarify if this pump is appropriately utilizing the VFD (for permanent or temporary part loading of the pump) or if the pump operates at full speed all the time.
Yes; No; Do Not Know
Hidden if 2.15 ≠ "VFD" OR "Multiple Methods w/ VFD"
2.20 Is the throttling valve ever adjusted?
Radio Buttons
Clarifies if the throttle valves are ever adjusted or remain at a fixed position, year-round.
Yes; No; Do Not Know
Hidden if 2.15 ≠ "Motor Controlled Valve Throttling" OR "Manual Valve Throttling" OR "Mix of Throttles and Bypass"
2.21
Is the current pump system size appropriate for the load?
Radio Buttons
Asks the contact if the pump is appropriately sized for its current duty.
Yes; No; Do Not Know
2.22
Is this pump part of a lead/lag system?
Radio Buttons
Does the pump operate in conjunction with other pumps discharging to the same header and cycle on and off based on system loading?
Yes; No; Do Not Know
2.23
Does your facility keep a pump curve for this pump on file?
Radio Buttons
Yes; No; Do Not Know
C-19
Field # Field Label Field Type Field Description Field Options Other Notes
2.24
Which of these were done in the last 2 years? (check all that apply):
Checkbox
Bearings lubricated or replaced; Mechanical seal replaced; Packing tightened or replaced; Wear ring adjusted or replaced; Impeller replaced; Another repair; Do Not Know
2.25
Which of the following were considered when selecting this pump? (select all that apply)
Checkbox
To ensure all pressure and flow requirements would be met; Best Efficiency Point; Lowest Implementation Cost; Lowest Running Cost; Corporate Requirement; Meeting Specs of Replaced Pump; Preference for Vendor; Preference for Manufacturer; Utility or Other Rebate; Overall System Energy Efficiency; Included in Package; Do Not Know
2.26
Assessor estimate of system efficiency compared to best available technology and best maintenance practices:
Fixed Dropdown
Assessors on the spot assessment of the efficiency if the system
Very Poor; Poor; Fair; Good; Excellent
2.27 Feasible energy savings potential?
Fixed Dropdown
Assessors on the spot assessment of the energy savings potential of the system
0-10%; 10-20%; 20-30%; 30-40%; More than 40%; Cannot reasonably estimate
C-20
Fan/blower checklist
Table 71: Fan/blower checklist Field # Field Label Field Type Field Description Field Options Other Notes
Exhaust Gases; Ventilation – Supply; Ventilation – Return; Air Handling; Process Heating; Process Cooling; Process Ventilation; Materials Conveying; Refrigeration (Evaporator); Cooling Tower/Condenser; High Pressure Blower; Combustion Blower; Aeration; Mixing/Agitation; None of the Above; Do Not Know
3.03 Fan Manufacturer
Editable Dropdown
Fan Manufacturer Greenheck; New Your Blower; Twin City Blower
Assessor can add to the available options.
3.04 Country of Manufacture
Editable Dropdown
Country of Manufacture U.S.A.; Japan; China; Mexico
Assessor can add to the available options.
3.05 Fan Manufacture Year
Numerical Open Ended
Nameplate year of manufacture
C-21
Field # Field Label Field Type Field Description Field Options Other Notes
3.06
Approximate fan age in years (if year is unavailable)
Radio Buttons
Estimated age of fan if exact year is unknown 0-5;
6-10; 11-20; 21+
3.07 Rated flow rate (CFM)
Numerical Open Ended
Rated flow capacity of the fan at design conditions
3.08 Rated Static Pressure (in-WG)
Numerical Open Ended
Rated head pressure capacity of the fan at design conditions
3.09 Fan Diameter (in)
Numerical Open Ended
Diameter of fan impeller
3.10
Fan Full Load Speed (RPM, not motor)
Numerical Open Ended
Rated speed of the fan at design conditions
3.11 Is the fan on a flow meter?
Radio Buttons
If there is a flow meter installed on the output of this specific fan
Yes; No; Do Not Know
3.12 What does the flow meter read?
Numerical Open Ended
What is the reading of the fan specific flow meter?
Hidden if 3.11 ≠ "Yes"
3.13
From staff, was the fan operating under typical conditions?
Radio Buttons
Yes; No; Do Not Know
3.14 Flow output controls:
Fixed Dropdown
What is the primary control method for this specific fan?
VFD; Dampers; Inlet Vain; Disc Throttle; Variable Pitch; Multispeed Motor; Multiple Fans; Multiple Methods w/ VFD; Multiple Methods w/o VFD; None (Constant Load); None (Bypass or Open Flow); Other; Do Not Know
3.15 Does the fan flow vary over time?
Radio Buttons
Clarifies if flow output of the fan varies over time.
Yes; No; Do Not Know
C-22
Field # Field Label Field Type Field Description Field Options Other Notes
3.16
Is this fan part of a lead/lag system?
Radio Buttons
Does the fan operate in conjunction with other fans discharging to the same distribution system and cycle on and off based on system loading?
Yes; No; Do Not Know
3.17
What was the observed damper position?
Fixed Dropdown
If the flow is controlled by a damper or veins, what was the observed position?
Hidden if 3.14 ≠ "Inlet Vain" OR "Disc Throttle" OR "Variable Pitch" OR "Dampers"
3.18 What is the observed speed?
Percent Observed speed of the fan relative to the rated speed
Hidden if 3.14 ≠ "VFD" OR "Multiple Methods w/ VFD"
3.19
Is the VFD appropriate? (or is the fan at full speed all the time?)
Radio Buttons
Attempts to clarify if this fan is appropriately utilizing the VFD (for permanent or temporary part load operation of the fan) or if the fan operates at full speed all the time.
Yes; No; Do Not Know
Hidden if 3.14 ≠ "VFD" OR "Multiple Methods w/ VFD"
3.20
Is the current fan system size appropriate for the load?
Radio Buttons
Ask the contact if the fan is appropriately sized for its current duty.
Yes; No; Do Not Know
3.21
Is the throttling damper ever adjusted?
Radio Buttons
Clarify if the throttle dampers or veins are ever adjusted or remain at a fixed position, year-round.
Yes; No; Do Not Know
Hidden if 3.14 ≠ "Inlet Vain" OR "Disc Throttle" OR "Variable Pitch" OR "Dampers"
3.22
Does your facility keep a fan curve for this fan on file?
Radio Buttons
Yes; No; Do Not Know
3.23
Which of these were done in the last 2 years? (check all that apply):
Checkbox
Bearings lubricated or replaced; Cleaned; Blades replaced; Other repair; Do Not Know
C-23
Field # Field Label Field Type Field Description Field Options Other Notes
3.24
Which of the following were considered when selecting this fan (select all that apply)?
Checkbox
To ensure all pressure and flow requirements would be met; Based on air conditions (e.g., contaminant, moisture, etc.); Minimize noise; Best Efficiency Point; Lowest Implementation Cost; Lowest Running Cost; Corporate Requirement; Meeting Specs of Replaced Fan; Preference for Vendor; Preference for Manufacturer; Utility or Other Rebate; Overall System Energy Efficiency; Included in Package; Do Not Know
3.25
Assessor estimate of system efficiency compared to best available technology and best maintenance practices:
Fixed Dropdown
Assessors on the spot assessment of the energy efficiency of the system Very Poor;
Poor; Fair; Good; Excellent
3.26
Feasible energy savings potential?
Fixed Dropdown
Assessors on the spot assessment of the energy savings potential of the system
0-10%; 10-20%; 20-30%; 30-40%; More than 40%; Cannot reasonably estimate
C-24
Compressed air checklist
Table 72: Compressed air checklist
Field # Field Label Field Type Field Description Field Options Other Notes
4.01 Manufacturer Editable Dropdown
Compressor manufacturer Atlas Copco; Boge; Chicago Pneumatic; compare; FS Curtis; Gardner Denver; Ingersoll Rand; Kaeser; Mattei; Quincy; Sullair; Sullivan-Palatek; Do Not Know
Assessor can add to the available options.
4.02 Model Number Open Ended
Compressor model number
4.03 Type Fixed Dropdown
Type of air compressor technology
Rotary Screw; Reciprocating – Single Acting; Reciprocating – Double Acting; Centrifugal; Do Not Know
4.04 CFM Rating Numerical Open Ended
Nameplate CFM rating of this specific compressor
4.05 PSI Rating Numerical Open Ended
Nameplate PSI rating of this specific compressor
4.06 Year of Manufacture
Numerical Open Ended
4.07 Lubrication Radio Button
Type of air cooling/lubrication technology
Oil Injected; Oil-free; Do Not Know
4.08 Cooling Radio Button
Type of air compressor unit heat rejection
Air-cooled; Water-cooled; Do Not Know
C-25
Field # Field Label Field Type Field Description Field Options Other Notes
4.09 Capacity Control Fixed Dropdown
Type of compressor output capacity control technology
Start/Stop; Load/Unload w/Shutdown Timer; Load/Unload w/o Shutdown Timer; Modulating; Variable Displacement; VFD; None of the Above; Do Not Know
4.10 Pressure Setpoint Numerical Open Ended
Setpoint pressure for this specific pressure
4.11 Cut-in pressure Numerical Open Ended
Lower end of the control band for the compressor at which the compressor will start discharging air to the system.
4.12 Cut-out pressure Numerical Open Ended
Upper end of the control band for the compressor at which the compressor will stop discharging air to the system.
4.13 Observed compressor output pressure
Numerical Open Ended
Observed discharge pressure of the compressor at the time of observation
4.14 Sequencing stage Radio Button
Role of this specific compressor in the system level control strategy
Baseload; Trim; Unsequenced; Do Not Know
4.15
Is the compressor using outdoor air when colder than ambient?
Radio Button
Is the compressor located outside, in a well-ventilated compressor room, or have an intake duct from the outside?
Yes; No; Do Not Know; N/A
4.16
Is it feasible to duct outside air to the compressor?
Radio Button
If the compressor is not currently utilizing cooler outside air when available, is it feasible to duct or otherwise provide cooler air for intake when available?
Yes; No; Do Not Know; N/A
4.17
Is the intake located away from contaminants like dust?
Radio Button
Yes; No; Do Not Know; N/A
4.18 Is there an air filter on the incoming air?
Radio Button
Yes; No; Do Not Know; N/A
C-26
Field # Field Label Field Type Field Description Field Options Other Notes
4.19
Is the air filter replaced per manufacturer’s specifications?
Radio Button
Ask a knowledgeable contact.
Yes; No; Do Not Know; N/A
4.20
Any compressors arranged in series for multi-stage compression?
Radio Button
Is the system designed in a way where the output of one compressor is the input of another to raise the pressure of the air in multiple stages using multiple compressors? This is not asking if any of the compressor units are multistage themselves.
Yes; No; N/A; Do Not Know
4.21 What system level controls are in place?
Fixed Dropdown
What, if any, system level control technology is utilized to stage multiple compressors as compressed air load varies?
N/A (Single Compressor); Cascading Set Points; System Master Sequencing Controls; Network (Multi-Master) Controls; Automatic System Sequencing (Unknown Type); None (Manual Sequencing); None of the Above
4.22 Is there a main air receiver?
Radio Button
Is there a main air receiver at or near the compressed air plant?
Yes; No; N/A; Do Not Know
4.23 Main receiver height/length (ft):
Numerical Open Ended
Hides if 4.22 = no
4.24 Main receiver diameter (ft):
Numerical Open Ended
Hides if 4.22 = no
4.25 Main receiver volume (gal):
Numerical Open Ended
Will automatically calculate based on height and diameter. Can also be overwritten if the capacity is known. Hide if 4.22 = no.
C-27
Field # Field Label Field Type Field Description Field Options Other Notes
4.26
Does the system have a pressure/flow controller?
Radio Button
Does the system have an arrangement of control equipment consisting of: a large air storage receiver, precision motor driven control valve, pressure transducer or pneumatic servo pilot device, and control panel used to maintain a tight balance point pressure in the main compressed air header.
Yes; No; Do Not Know
4.27
What is the observed system pressure (preferably downstream of the compressed air plant)?
Numerical Open Ended
What is the pressure in the compressed air header near the main compressed air plant?
4.28 Type of dryer(s) Fixed Dropdown
Refrigerant Cycling; Refrigerant Non-Cycling; Regenerative Desiccant; Deliquescent; Heat-of-Compression; Membrane; Combination of Different Types; No Dryer; None of the Above; Do Not Know
4.29 Total CFM capacity of dryer(s) (CFM)
Numerical Open Ended
4.30
Are there controls installed that modulate dryer energy consumption based on compressed air demand?
Radio Button
Yes; No; N/A; Do Not Know
Hide if 4.28 = Regenerative Desiccant
4.31
Are desiccant dryer(s) controlled with dew point switching (DDS) controls?
Radio Button
Yes; No; N/A; Do Not Know
Hide if 4.28 ≠ Regenerative Desiccant
4.32 Total rated power of dryer(s) (HP or kW)
Numerical Open Ended
C-28
Field # Field Label Field Type Field Description Field Options Other Notes
4.33
Have you developed a pressure profile of your system to determine peak demand and dynamics of demand?
Radio Button
Yes; No; Do Not Know
4.34 When (with respect to question 4.33)?
Hides if 4.33 ≠ Yes
4.35
Does compressed air demand vary significantly over time?
Checkbox
Does the compressed air load vary over time or does it stay consistent, whenever the system is being utilized?
Shift-wise; Seasonally
4.36
Does the system stay pressurized for relatively small loads during non-production hours? (e.g., pneumatic controls, specialized equipment, etc.)
Radio Button
Is the main compressed air system being utilized to supply relatively small amounts of air for a few small loads when the main facility is not in production?
Yes; No; Do Not Know
4.37
What percentage of the typical non-production CFM goes to the loads in question 4.36?
Percent
Hides if 4.36 ≠ Yes
4.38
Have you adjusted your compressor controls in the last year?
Radio Button
Have any setpoints or control logic been changed in the last year?
Yes; No; Do Not Know
4.39
How capable is your current control strategy at meeting the facility’s load?
Fixed Dropdown
All the time able to meet load; Most of the time able to meet load; Frequently struggles to meet load
4.40
What is the highest pressure is required at the end-use points? (PSIG)
Numerical Open Ended
Of all the loads that the compressed air system serves, what is the highest required pressure at the point of use?
4.41
What fraction of the average plant demand requires this pressure?
Percent
C-29
Field # Field Label Field Type Field Description Field Options Other Notes
4.42
Do the end uses require significantly different pressures?
Radio Button
Is there a significant difference in the required point of use pressures for all the loads served by the compressed air system?
Yes; No; Do Not Know
4.43
Do you have a few high-pressure applications that determine the operating pressure for your entire plant?
Radio Button
Are the loads that dictate the supplied air pressure relatively small compared to the total load on the system (<10% CFM)
Yes; No; Do Not Know
4.44
Have you investigated ways to serve high pressure applications at a lower pressure?
Radio Button
Has the facility studied the feasibility of utilizing lower pressure for these loads?
Yes; No; Do Not Know
4.45
Are you using any of the following to supply intermittent, high volume applications?
Checkbox
Secondary Storage Receivers; Separate Compressor, Booster, or Amplifier
4.46
Does the system use production, or schedule-based pressure setbacks? (PSI or PSI range setback)
Radio Button
Does the facility set back the pressure set points based on varying production requirements
Yes; No; Do Not Know
4.47
Have you attempted to lower the system pressure any time in the last year?
Radio Button
Has the facility attempted to, and studied the effects of, lowering the compressed air plant discharge pressure in the last year?
Yes; No; Do Not Know
4.48 Was it successful? Radio Button
Yes; No; Do Not Know
4.49
Do you have end- use applications that require a significantly different level of air quality?
Radio Button
Is there a significant difference in the required point of use air quality for all the loads served by the compressed air system?
Yes; No; Do Not Know
C-30
Field # Field Label Field Type Field Description Field Options Other Notes
4.50
Do you have a few end use applications requiring high air quality that determine the air quality for the entire plant?
Radio Button
Are the loads that dictate the supplied air quality relatively small compared to the total load on the system (<10% CFM)
Yes; No; Do Not Know
4.51
Have you investigated ways to serve these high air quality applications with point-of-use solutions?
Radio Button
Yes; No; Do Not Know
4.52
Is oil-free air being used on end uses that do not require it?
Radio Button
Yes; No; N/A; Do Not Know
4.53
Do you use compressed air for any of the following?
Can you estimate how much compressed air these end uses consume compared to total production?
Percent
C-31
Field # Field Label Field Type Field Description Field Options Other Notes
4.55
Have you analyzed your end uses to make sure they could not be more efficiently served using alternative energy sources (blower air, mechanical drive)?
Radio Button
Yes; No; Do Not Know
4.56
Have you estimated the amount of leakage in your system?
Radio Button
Yes; No; Do Not Know
4.57
Do you have the equipment to detect leaks (e.g., ultrasonic leak detector) or do you outsource leak detection?
Checkbox
Detection Equip.; Outsource; Other; None; Do Not Know
4.58
Do you have an ongoing leak management program?
Radio Button
Yes; No; N/A; Do Not Know
4.59
How often does your leak management program call for finding and repairing air leaks?
Fixed Dropdown
Daily; Weekly; Monthly; Annually; Other
4.60
Do you adjust compressor controls after repairing leaks?
Radio Button
Yes; No; Do Not Know
4.61
Do you (the assessor) hear a significant number of leaks?
Radio Button
Yes; No; Do Not Know
4.62
What percent of your condensate drains are manual drain?
Percent
4.63
What percent of your condensate drains are disc drain?
Percent
4.64
What percent of your condensate drains are timed drain?
Percent
C-32
Field # Field Label Field Type Field Description Field Options Other Notes
4.65
What percent of your condensate drains are float traps?
Percent
4.66
What percent of your condensate drains are solenoid valves?
Percent
4.67
What percent of your condensate drains are zero loss traps?
Percent
4.68
Have you measured pressure at various points in the system to determine pressure drop?
Radio Button
Yes; No; Do Not Know
4.69 When? Fixed Dropdown
Continuously; Within Last Month; Within Last Quarter; Within Last 6 Months; Within Last Year; Within Last 2 Years; Within Last 5 Years; More Than 5 Years
4.70
Have you altered the system to reduce pressure drops? (For example: removing extra bends, increasing pipe diameter, looping main headers)
Radio Button
Has the facility recently modified the compressed air distribution piping to reduce pressure drops and allow the compressor plant to operate at a lower pressure?
Yes; No; Do Not Know
C-33
Field # Field Label Field Type Field Description Field Options Other Notes
4.71 When (with respect to 4.70)?
Fixed Dropdown
Continuously; Within Last Month; Within Last Quarter; Within Last 6 Months; Within Last Year; Within Last 2 Years; Within Last 5 Years; More Than 5 Years
4.72
Do you meet or exceed compressor and dryer manufacturer’s requirements for maintenance?
Radio Button
Yes; No; Do Not Know
4.73
Do you have a preventive maintenance program?
Radio Button
Yes; No; Do Not Know
4.74
How often do you inspect the condensate drains?
Fixed Dropdown
Daily; Weekly; Monthly; Annually; Other
4.75
Do you periodically inspect and replace end-use filters, check regulators, and lubricators to maintain functionality?
Radio Button
Yes; No; Do Not Know
4.76
In the past 5 years, has there been an energy efficiency assessment performed on the compressed air system?
Radio Button
Yes; No; Do Not Know
4.77
What percentage of the recommendations were implemented? (estimate, in terms of energy savings potential)
Percent
C-34
Field # Field Label Field Type Field Description Field Options Other Notes
4.78
Assessor’s estimate of efficiency of system compared to Best Available Technology and best maintenance practices:
Fixed Dropdown
Assessors on the spot assessment of the efficiency of the system Very Poor;
Poor; Fair; Good; Excellent
4.79 Feasible energy savings potential?
Fixed Dropdown
Assessors on the spot assessment of the energy savings potential of the system
0-10%; 10-20%; 20-30%; 30-40%; More than 40%; Cannot reasonably estimate
C-35
Refrigeration checklist
Table 73: Refrigeration checklist
Field # Field Label Field Type Field Description Field Options Other Notes
5.01 Manufacturer Editable Dropdown
Compressor/Chiller manufacturer
Frick; Vilter; GEA; Trane; Copeland; York; Carrier; McQuay; Do Not Know
Assessor can add to the available options
5.02 Model Number Open Ended Compressor/Chiller model number
5.03 Year of Manufacture Numerical Open Ended
5.04 Type Fixed Dropdown
Type of air compressor/chiller technology
Recip; Screw; Rotary Vane; Centrifugal; None of the Above; Do Not Know
5.05 Primary Application
Single Stage; High Stage; Low (Booster) Stage; Swing
5.06 Design COP Numerical Open Ended
Nameplate COP rating of this specific compressor/chiller at design
5.07 Cooling Output Rating Numerical Open Ended
Nameplate cooling capacity rating of this specific compressor/chiller
5.08 Type of Oil Cooling Radio Button
Type of oil cooling technology
Direct Oil Injection; External Heat Exchanger; Thermosiphon; Do Not Know
C-36
Field # Field Label Field Type Field Description Field Options Other Notes
5.09 Capacity Control Fixed Dropdown
Type of compressor/chiller output capacity control technology
Role of this specific compressor/chiller in the system level control strategy
Baseload; Trim; Unsequenced; Do Not Know
5.11
Observed suction pressure? (see compressor digital display or analog gauge)
Numerical Open Ended
5.12
Observed discharge pressure? (see compressor digital display or analog gauge)
Numerical Open Ended
5.13 Cooling load end use (select all that apply): Checkbox
What are the primary cooling end uses that this system serves?
Process Cooling; Refrigerated Warehouse; HVAC; Equipment Cooling; Do Not Know
5.14 Type of evaporator systems (select all that apply):
Checkbox
Primary evaporator technologies that exchange heat to the refrigeration cycle?
Liquid Chiller (Chilled Water / Chilled Glycol); Direct Air Cooling (unknown evaporator type); Direct Expansion; Liquid Overfeed; Flooded; Do Not Know
C-37
Field # Field Label Field Type Field Description Field Options Other Notes
5.15 Type of defrost Fixed Dropdown
Hot Gas; Electric; Water; N/A; Do Not Know
Hide if 5.14 only = "Liquid Chiller (Chilled water / Chilled Glycol)"
5.16 System Refrigerant Fixed Dropdown
Ammonia; R22; Other; Do Not Know
5.17 System Stages Fixed Dropdown
Primary design of the system, in regard to compression and expansion stages.
1-Stg. Compression and Liquid Expansion; 1-Stg. Compression and 2-Stg. Liquid Exp.; 2-Stg. Compression and Liquid Expansion; 2-Stg. Compression; Other; Do Not Know
5.18 (Low Stage) Suction pressure setpoint Numerical Open Ended
5.19
(Low stage) Suction temperature setpoint (only if pressure is unavailable)
Numerical Open Ended
Hide if 5.18 = "unable to collect"
5.20 High stage suction pressure Numerical Open Ended
If the system is a two-stage system, what is the high stage suction pressure?
Hide if 5.17 = "1-Stg. Compression and Liquid Expansion"
5.21 High stage suction Temperature Numerical Open Ended
If the system is a two-stage system, what is the high stage suction temperature?
Hide if 5.20 = "unable to collect"
5.22 Constant or variable chiller flow Radio Button
If the system produces chilled water, glycol, or other liquid media, does the flow through the refrigerant to liquid heat exchanger vary, or stay constant?
Constant Flow; Variable Flow; Do Not Know
Hide if 5.14 ≠ "Liquid Chiller (Chilled water / Chilled Glycol)"
C-38
Field # Field Label Field Type Field Description Field Options Other Notes
5.23 Average or observed chilled water supply temperature
Numerical Open Ended
Hide if 5.14 ≠ "Liquid Chiller (Chilled water / Chilled Glycol)"
5.24 Average or observed chilled water return temperature
Numerical Open Ended
Hide if 5.14 ≠ "Liquid Chiller (Chilled water / Chilled Glycol)"
5.25 What is the setpoint temperature of the coldest load?
Numerical Open Ended
What is the temperature that dictates the suction temperature of the system?
5.26
What is the setpoint temperature of the largest higher-temperature load?
Numerical Open Ended
What is the temperature of the most significant load that does not require the lowest temperature set point?
5.27 Heat rejection method Fixed Dropdown
Evaporative Condenser; Air Cooled Condenser; Water Cooled (Cooling Tower); Water Cooled (Dry Cooler); Do Not Know
5.28 Total condenser/cooling tower fan capacity (hp) Numerical Open Ended
What is the total hp capacity of the heat rejection fans?
5.29
What is the current approach temperature? (at design conditions, if fixed head)
Numerical Open Ended
If the system has a fixed head, this is the approach temperature at design conditions. If this is a floating head system, this is the setpoint approach temperature.
C-39
Field # Field Label Field Type Field Description Field Options Other Notes
5.30
Does the current sequencing strategy ensure that no screw compressor operates below 50% capacity?
Radio Button
Is the current sequencing technology and logic capable of ensuring that no screw compressor runs below 50% capacity?
Yes; No; N/A; Do Not Know
5.31
Does the system utilize floating head (discharge) pressure (or condenser water temperature reset)?
Radio Button
Yes; No; Do Not Know
5.32 What is your current minimum discharge pressure?
Numerical Open Ended
What is the lowest discharge pressure that the system can handle without causing issues?
5.33 What is likely the cause of discharge pressure lower limit?
Editable Dropdown
What parameter currently dictates the lowest that the discharge pressure can go?
Hot Gas Defrost; Injected Oil Cooling; Condenser Capacity; Oil Separator Performance; Heated Zones or Underfloor Heating; Do Not Know Other
5.34 Does the system utilize floating suction pressure? Radio Button
Does the system vary its suction pressure over time based on varying production requirements?
Yes; No; Do Not Know
5.35 Highest achievable suction pressure Numerical Open Ended
5.36
Percent of evaporator (or Air Handler) fan motor controls that are on/off cycling?
Percent
Shift-wise; Seasonally;
Hide if 5.14 only = "Liquid Chiller (Chilled water / Chilled Glycol)"
5.37
Percent of evaporator (or air handler) fan motor controls that are 2 speed motors
Percent
Yes; No; Do Not Know
Hide if 5.14 only = "Liquid Chiller (Chilled water / Chilled Glycol)"
C-40
Field # Field Label Field Type Field Description Field Options Other Notes
5.38
Percent of evaporator (or air handler) fan motor controls that are VFD control
Percent
Hide if 5.14 only = "Liquid Chiller (Chilled water / Chilled Glycol)"
5.39
Percent of evaporator (or Air Handler) fan motor controls that have no fan control
Percent
Yes; No; Do Not Know
Hide if 5.14 only = "Liquid Chiller (Chilled water / Chilled Glycol)"
5.40 Do you use active defrost management? Radio Button
Yes; No; Do Not Know
Hide if 5.14 only = "Liquid Chiller (Chilled water / Chilled Glycol)"
5.41 Do you use liquid subcooling? Radio Button
Yes; No; Do Not Know
5.42 Do you use a desuperheater? Radio Button
Yes; No; Do Not Know
5.43 Do you use an autopurger? Radio Button
Yes; No; Do Not Know
5.44 Do you use electronic expansion valves on any evaporators?
Radio Button
Are the loads that dictate the supplied air pressure relatively small compared to the total load on the system (<10% CFM)?
All; Most; Some; None; N/A; Do Not Know
5.45 Does the load on the system vary significantly over time?
Radio Button Yes;
No; Do Not Know
5.46 Have any controls been adjusted in the last year? Radio Button
Yes; No; Do Not Know
5.47 Do suction setpoint(s) get adjusted based on production schedules?
Radio Button Yes;
No; Do Not Know
5.48 Do any refrigeration setpoints get adjusted seasonally?
Radio Button Yes;
No; Do Not Know
C-41
Field # Field Label Field Type Field Description Field Options Other Notes
5.49 Have the cooling loads of each shift been recently estimated?
Radio Button Yes;
No; Do Not Know
5.50
Has the feasibility of raising the suction temperature of the system been recently explored?
Radio Button
Yes; No; Do Not Know
5.51
Has the feasibility of lowering the discharge temperature of the system been recently explored?
Fixed Dropdown
No; Seasonally; Shift-Wise; Permanently
5.52
Are the compressor manufacturer’s requirements for maintenance met or exceeded?
Fixed Dropdown
Increase Condenser Capacity Float Head Pressure Other
5.53 Do you have a preventive maintenance program? Radio Button
Yes; No; N/A; Do Not Know
5.54
How often are heat exchangers (condensers/evaporators) inspected?
Fixed Dropdown
Weekly; Monthly; Yearly; >One Year; N/A; Do Not Know
5.55 How often is the system recharged? Fixed Dropdown
Weekly; Monthly; Yearly; Every 2 Years; Every 5 Years; Do Not Know
5.56
In the past 5 years, has there been an energy efficiency assessment performed on the system?
Radio Button
Yes; No; Do Not Know
5.78
What percentage of the recommendations were implemented? (estimate, in terms of energy savings potential)
Percent
5.79
Assessor estimate of energy efficiency of the system compared to Best Available Technology and Best Maintenance Practices:
Fixed Dropdown
Assessors on the spot assessment of the efficiency if the system
Very Poor; Poor; Fair; Good; Excellent
C-42
Field # Field Label Field Type Field Description Field Options Other Notes
5.80 Feasible energy savings potential? Fixed Dropdown
Assessors on the spot assessment of the energy savings potential of the system
0-10%; 10-20%; 20-30%; 30-40%; More than 40%; Cannot reasonably estimate
C-43
Facility general motor practices questions
Table 74: Facility general motor practices questions
Field # Field Label Field Type Field Description Field Options Other Notes
6.01 Are motor system related decisions made at the facility or outside of the facility?
Dropdown Primary decision hierarchy for motor system decisions
At facility; By corporate; Mix
6.02 Title of the person responsible for managing motor system energy
Dropdown Self-explanatory Plant/facility Manager; Maintenance Manager; Purchasing Manager; Plant Engineer; Energy Manager; Chief Electrician; President or General Manager
6.03 Is this person located at the facility?
Radio Button Self-explanatory Yes; No; Do Not Know
6.04 Is this person also in charge of motor and related equipment purchases?
Radio Button Self-explanatory Yes; No; Do Not Know
6.05 Percent of this person’s time dedicated to energy related issues
6.11 Does the facility use external energy assessors to identify energy efficiency improvements?
Radio Button Does the facility utilize outside consulting to help manage energy and identify energy efficiency improvement opportunities?
Yes; No; Do Not Know
6.12 Does the facility use Kaizen events to identify energy efficiency improvements?
Radio Button Self-explanatory Yes; No; Do Not Know
6.13 Does the facility use equipment manufacturer resources to identify energy efficiency improvements?
Radio Button For example: a compressed air audit by a compressed air manufacturer or vender.
Yes; No; Do Not Know
6.14 Does the facility use utility resources to identify energy efficiency improvements?
Radio Button For example: an energy audit performed or funded by the energy utility.
Yes; No; Do Not Know
6.15 Does the facility use state government resources to identify energy efficiency improvements?
Radio Button For example: an energy audit performed or funded by the State government.
Yes; No; Do Not Know
6.16 Does the facility use federal government resources to identify energy efficiency improvements?
Radio Button For example: an energy audit performed or funded by the Advance Manufacturing Office of the DOE.
Yes; No; Do Not Know
6.17 Does the facility use peer to peer knowledge sharing to identify energy efficiency improvements?
Radio Button For example: gaining knowledge through industry groups and trainings.
Yes; No; Do Not Know
C-45
Field # Field Label Field Type Field Description Field Options Other Notes
6.18 Does the facility use an energy efficiency service provider to identify energy efficiency improvements?
Radio Button Does the facility use contracted efficiency service providers to perform periodic energy related maintenance or retrocommissioning?
Yes; No; Do Not Know
6.19 Are motor system operators trained on motor system energy efficiency practices?
Radio Button Do any of the system operators receive training specific to the energy efficiency of the systems that they manage?
Yes; No; Do Not Know
6.20 Is the facility certified or participating in any of the following (select all that apply)?
Checkbox Is the facility currently certified to any of the following standards?
ISO 50001 certified; ISO 9001 certified; ISO 14001 certified; Better Plants Partner; Superior Energy Performance certified; ENERGY STAR Partner; LEED certified;
6.21 Estimated percent of motors that failed over the past year
Fixed Dropdown Estimated percentage of total motors that failed in the last year, by count.
0%; 1-10%; 11-20%; 21-30%; 31-40%; 41-50%; 51-60%; 61-70%; 71-80%; 81-90%; 91-99%; 100%; N/A; Do Not Know
6.22 Estimated total hours of unplanned downtime due to all motor system failures over the past year
Percentage Self-explanatory
6.23 Does your company use written specifications when purchasing motors?
Radio Button This indicates if the facility has specific, written specs that guide the purchasing of motors. See 3.24 for all the options.
Yes; No; Sometimes
C-46
Field # Field Label Field Type Field Description Field Options Other Notes
6.24 Which of the following concerns are addressed in those specifications? (check all that apply)
Checkbox Which of the provided specifications does the facility use to guide the purchase of new motors?
Temperature rise/insulation class; Maximum starting current; Minimum stall time; Power factor range; Efficiency and test standard; Load inertia; Expected number of starts; Suitability to your facility’s operating environment; Ease of repair (including availability and access to repair specs); Other
Field is hidden if field number 3.23 = "No"
6.25 Is there a policy guiding motor repair or replacement?
Radio Button Self-explanatory. See 6.26.
Yes; No; Do Not Know
6.26 Reasons guiding repair/replace policy
Fixed Dropdown Primary driver of the facility’s decision to repair or replace a burnt-out motor.
6.27 Does facility use an EASA accredited or Green Motor Practices Group Member motor service center?
Fixed Dropdown Self-Explanatory Always; Mostly; Sometimes; Never; Do Not Know
6.28 How is the size of the new motor determined?
Editable Dropdown
What is the typical guiding principal when deciding on the size of a replacement motor?
Replace with previous size; Nearest motor size from spares inventory; Select per end use specification; Estimate of required load
6.29 Does the facility have a list of:
Checkbox Self-explanatory All motors (connected or otherwise); All connected motors; Pumps; Air compressors; Fans
6.30 Does the facility have a spare motor inventory?
Radio Button Indicates if the facility maintains a list of the current spare motors available on site.
Yes; No; Do Not Know
C-47
Field # Field Label Field Type Field Description Field Options Other Notes
6.31 In past 2 yrs., percent of motors repaired or maintained for motor rewind
Fixed Dropdown Percent by count of connected motors that were rewound in the last 2 years
0%; 1-10%; 11-20%; 21-30%; 31-40%; 41-50%; 51-60%; 61-70%; 71-80%; 81-90%; 91-99%; 100%; N/A; Do Not Know
6.32 In past 2 yrs., percent of motors repaired or maintained for motor bearing replacement
Fixed Dropdown Percent by count of connected motors that were maintained for motor bearing replacement in the last 2 years
0%; 1-10%; 11-20%; 21-30%; 31-40%; 41-50%; 51-60%; 61-70%; 71-80%; 81-90%; 91-99%; 100%; N/A; Do Not Know
6.33 In past 2 yrs., percent of motors repaired or maintained for motor shaft alignment
Fixed Dropdown Percent by count of connected motors that were maintained for motor shaft alignment in the last 2 years
0%; 1-10%; 11-20%; 21-30%; 31-40%; 41-50%; 51-60%; 61-70%; 71-80%; 81-90%; 91-99%; 100%; N/A; Do Not Know
6.34 In past 2 yrs., percent of motors repaired or maintained for motor belt maintenance
Fixed Dropdown Percent by count of connected motors that were maintained for motor belt maintenance in the last 2 years
0%; 1-10%; 11-20%; 21-30%; 31-40%; 41-50%; 51-60%; 61-70%; 71-80%; 81-90%; 91-99%; 100%; N/A; Do Not Know
C-48
Field # Field Label Field Type Field Description Field Options Other Notes
6.35 In past 2 yrs., percent of motors repaired or maintained for other motor repair
Fixed Dropdown Percent by count of connected motors that had any other motor maintenance performed in the last 2 years
0%; 1-10%; 11-20%; 21-30%; 31-40%; 41-50%; 51-60%; 61-70%; 71-80%; 81-90%; 91-99%; 100%; N/A; Do Not Know
6.36 In past 2 yrs., percent of pumps repaired or maintained for pump bearing lube and replacement
Fixed Dropdown Percent by count of connected pumps that had pump bearings lubed and/or replaced performed in the last 2 years
0%; 1-10%; 11-20%; 21-30%; 31-40%; 41-50%; 51-60%; 61-70%; 71-80%; 81-90%; 91-99%; 100%; N/A; Do Not Know
6.37 In past 2 yrs., percent of pumps repaired or maintained for pump mechanical seal replacement
Fixed Dropdown Percent by count of connected pumps that had a pump mechanical seal replacement performed in the last 2 years
0%; 1-10%; 11-20%; 21-30%; 31-40%; 41-50%; 51-60%; 61-70%; 71-80%; 81-90%; 91-99%; 100%; N/A; Do Not Know
6.38 In past 2 yrs., percent of pumps repaired or maintained for pump packing tightening or replacement
Fixed Dropdown Percent by count of connected pumps that had a pump packing tightened or replaced in the last 2 years
0%; 1-10%; 11-20%; 21-30%; 31-40%; 41-50%; 51-60%; 61-70%; 71-80%; 81-90%; 91-99%; 100%; N/A; Do Not Know
C-49
Field # Field Label Field Type Field Description Field Options Other Notes
6.39 In past 2 yrs., percent of pumps repaired or maintained for pump wear ring adjustment or replacement
Fixed Dropdown Percent by count of connected pumps that had a pump wear ring adjusted or replaced in the last 2 years
0%; 1-10%; 11-20%; 21-30%; 31-40%; 41-50%; 51-60%; 61-70%; 71-80%; 81-90%; 91-99%; 100%; N/A; Do Not Know
6.40 In past 2 yrs., percent of pumps repaired or maintained for pump impeller replacement
Fixed Dropdown Percent by count of connected pumps that had pump impeller replacement performed in the last 2 years
0%; 1-10%; 11-20%; 21-30%; 31-40%; 41-50%; 51-60%; 61-70%; 71-80%; 81-90%; 91-99%; 100%; N/A; Do Not Know
6.41 In past 2 yrs., percent of pumps repaired or maintained for other pump repair
Fixed Dropdown Percent by count of connected pumps that had any other pump repair performed in the last 2 years
0%; 1-10%; 11-20%; 21-30%; 31-40%; 41-50%; 51-60%; 61-70%; 71-80%; 81-90%; 91-99%; 100%; N/A; Do Not Know
6.42 In past 2 yrs., percent of air compressors repaired or maintained for lube and filter replacement
Fixed Dropdown Percent by count of connected air compressors that had a lube and filter replacement performed in the last 2 years
0%; 1-10%; 11-20%; 21-30%; 31-40%; 41-50%; 51-60%; 61-70%; 71-80%; 81-90%; 91-99%; 100%; N/A; Do Not Know
C-50
Field # Field Label Field Type Field Description Field Options Other Notes
6.43 In past 2 yrs., percent of air compressors repaired or maintained for compressed air trap inspection
Fixed Dropdown Percent by count of connected air compressors that had a compressed air trap inspection performed in the last 2 years
0%; 1-10%; 11-20%; 21-30%; 31-40%; 41-50%; 51-60%; 61-70%; 71-80%; 81-90%; 91-99%; 100%; N/A; Do Not Know
6.44 In past 2 yrs., percent of air compressors repaired or maintained for air filter replacement
Fixed Dropdown Percent by count of connected air compressors that had an air filter replaced in the last 2 years
0%; 1-10%; 11-20%; 21-30%; 31-40%; 41-50%; 51-60%; 61-70%; 71-80%; 81-90%; 91-99%; 100%; N/A; Do Not Know
6.45 In past 2 yrs., percent of fans repaired or maintained for fan bearing lubrication and replacement
Fixed Dropdown Percent by count of connected fans that had a fan bearings lubricated and/or replaced in the last 2 years
0%; 1-10%; 11-20%; 21-30%; 31-40%; 41-50%; 51-60%; 61-70%; 71-80%; 81-90%; 91-99%; 100%; N/A; Do Not Know
6.46 In past 2 yrs., percent of fans repaired or maintained for fan cleaning
Fixed Dropdown Percent by count of connected fans that had a fan cleaning performed in the last 2 years
0%; 1-10%; 11-20%; 21-30%; 31-40%; 41-50%; 51-60%; 61-70%; 71-80%; 81-90%; 91-99%; 100%; N/A; Do Not Know
C-51
Field # Field Label Field Type Field Description Field Options Other Notes
6.47 How often is there a systematic visual inspection of the general condition of motors?
Fixed Dropdown Self-explanatory Weekly; Bi-Weekly; Monthly; Quarterly; Every 6 months; Annually; Every 2 years; More than every 2 years; Never; N/A; Do Not Know
6.48 How often is there a systematic inspection of motor vibration noise?
Fixed Dropdown Self-explanatory Weekly; Bi-Weekly; Monthly; Quarterly; Every 6 months; Annually; Every 2 years; More than every 2 years; Never; N/A; Do Not Know
6.49 How often is there a systematic inspection of motor temperature?
Fixed Dropdown Self-explanatory Weekly; Bi-Weekly; Monthly; Quarterly; Every 6 months; Annually; Every 2 years; More than every 2 years; Never; N/A; Do Not Know
6.50 How often is there a systematic inspection of pump system valves including throttles?
Fixed Dropdown Self-explanatory Weekly; Bi-Weekly; Monthly; Quarterly; Every 6 months; Annually; Every 2 years; More than every 2 years; Never; N/A; Do Not Know
6.51 How often is there a systematic inspection of fan damper functionality?
Fixed Dropdown Self-explanatory Weekly; Bi-Weekly; Monthly; Quarterly; Every 6 months; Annually; Every 2 years; More than every 2 years; Never; N/A; Do Not Know
C-52
Field # Field Label Field Type Field Description Field Options Other Notes
6.52 Are dead ends in the compressed air distribution system isolated?
Fixed Dropdown Self-explanatory Yes, all have been isolated (100%); generally (50%-99%); some, but not the majority (1%-49%); no (0%)
6.53 For the pump system distribution system, are flow paths to non-operating equipment isolated?
Fixed Dropdown Self-explanatory Yes, all have been isolated (100%); generally (50%-99%); some, but not the majority (1%-49%); no (0%)
6.54 Are booster pumps used for loads with requirements well above balance of plant requirements?
Radio Button Indicates if the facility uses any mechanical pumping to raise a pumped systems pressure above what is provided to the facility
Yes; No; Do Not Know
6.55 What fraction of the facility’s water load is boosted?
Fixed Dropdown Indicates what fraction of the facility’s pumped systems are mechanically boosted.
All instances; 51%-99% instances; 1%-50% of the instances; Do Not Know; None
6.56 How are leaks in pumping systems identified?
Fixed Dropdown Self-explanatory Periodic Inspection Program; Employees/Operators identify; Multiple Methods; None; N/A; Do Not Know
6.57 How are leaks in the compressed air systems identified?
Fixed Dropdown Self-explanatory Periodic Inspection Program; Employees/Operators identify; Multiple Methods; None; N/A; Do Not Know
6.58 How are leaks in the ductwork identified?
Fixed Dropdown Self-explanatory Periodic Inspection Program; Employees/Operators identify; Multiple Methods; None; N/A; Do Not Know
C-53
Field # Field Label Field Type Field Description Field Options Other Notes
6.59 How often are pump system distributions inspected for efficiency of layout?
Fixed Dropdown Indicates how often pump systems are typically reviewed for the energy efficiency of their design and layout
Weekly; Bi-Weekly; Monthly; Quarterly; Every 6 months; Annually; Every 2 years; More than every 2 years; Never; N/A; Do Not Know
6.60 How often is the compressed air system distribution inspected for efficiency of layout?
Fixed Dropdown Indicates how often compressed air distribution systems are typically reviewed for the energy efficiency of their design and layout
Weekly; Bi-Weekly; Monthly; Quarterly; Every 6 months; Annually; Every 2 years; More than every 2 years; Never; N/A; Do Not Know
6.61 How often is the air duct distribution inspected for efficiency of layout?
Fixed Dropdown Indicates how often blower driven duct distribution systems are typically reviewed for the energy efficiency of their design and layout
Weekly; Bi-Weekly; Monthly; Quarterly; Every 6 months; Annually; Every 2 years; More than every 2 years; Never; N/A; Do Not Know
C-54
Field # Field Label Field Type Field Description Field Options Other Notes
6.62 Rate the condition of the pump system distribution
Fixed Dropdown Indicates the assessor’s rating of the typical pumped system’s condition
Best practice; Good; Fair; Poor; N/A
Best practice - no leakage observed; where installed, insulation in excellent condition Good - minimal leakage observed; where installed, insulation has been maintained; current maintenance practices appear to be sufficient Fair - leakage observed but not throughout the plant; where installed, insulation often found in need of repair; current maintenance practices could be improved Poor - many instances of leakage observed; where installed, insulation in need of repair; no evidence of existing maintenance practices
6.63 Rate the condition of the compressed air distribution system
Fixed Dropdown Indicates the assessor’s rating of the typical compressed air distribution system’s condition
Best practice; Good; Fair; Poor; N/A
Best Practice - no leaks observed; air is free from moisture Good - minimal leaks observed; air is mostly dry Fair - leaks observed but not throughout the plant; moisture is found in the air, but evidence that air has been dried Poor - many instances of leaks observed; no evidence that air has been dried was observed; where installed, insulation in need of repair; no evidence of existing maintenance practices
C-55
Field # Field Label Field Type Field Description Field Options Other Notes
6.64 Rate the condition of the air ducts
Fixed Dropdown Indicates the assessor’s rating of the typical ducted system’s condition
Best practice; Good; Fair; Poor; N/A
Best practice - no leakage observed; where installed, insulation in excellent condition Good - minimal leakage observed; where installed, insulation has been maintained; current maintenance practices appear to be sufficient Fair - leakage observed but not throughout the plant; where installed, insulation often found in need of repair; current maintenance practices could be improved Poor - many instances of leakage observed; where installed, insulation in need of repair; no evidence of existing maintenance practices
C-56
Field # Field Label Field Type Field Description Field Options Other Notes
6.65 Rate the design of the pump system distribution
Fixed Dropdown Indicates the assessor’s rating of the typical pumped system distribution system’s design
Best practice; Good; Fair; Poor; N/A
Best practice - minimal elbows or sufficient distance between elbow and pump inlets and outlets; minimal dead ends; pipe sizing appropriate for flow conditions; where required, insulation exists Good - some elbows but flow into and out of pump generally unaffected; some dead ends; pipe sizing generally appropriate; where required, insulation mostly exists Fair - elbows throughout and flow into and out of pump is affected; dead ends throughout; varying pipe sizing found throughout the plant; where required, insulation may be observed Poor - excessive elbows with many impacting pump inlet and outlet; excessive dead ends; multiple pipe sizes along the same flow path; where required, insulation does not exist
C-57
Field # Field Label Field Type Field Description Field Options Other Notes
6.66 Rate the design of the compressed air distribution system
Fixed Dropdown Indicates the assessor’s rating of the typical compressed air distribution system’s design
Best practice; Good; Fair; Poor; N/A
Best practice - minimal elbows; minimal dead ends; receiver tanks used where beneficial; dryers used throughout Good - some elbows; some dead ends; receiver tanks used, but could be used more frequently; dryers installed but capacity could be increased Fair - elbows throughout; dead ends throughout; receiver tanks used but sporadically; dryers used sporadically Poor - excessive elbows; excessive dead ends; receiver tanks generally not used or inadequate; dryers generally not used or inadequate
C-58
Field # Field Label Field Type Field Description Field Options Other Notes
6.67 Rate the design of the air ducts
Fixed Dropdown Indicates the assessor’s rating of the typical ducted system’s design
Best practice; Good; Fair; Poor; N/A
Best practice - minimal elbows or sufficient distance between elbow and fan inlets and outlets; minimal dead ends; duct sizing appropriate for flow conditions; where required, insulation exists Good - some elbows but flow into and out of fan generally unaffected; some dead ends; duct sizing generally appropriate; where required, insulation mostly exists Fair - elbows throughout and flow into and out of fan is affected; dead ends throughout; varying duct sizing found throughout the plant; where required, insulation may be observed Poor - excessive elbows with many impacting fan inlet and outlet; excessive dead ends; multiple duct sizes along the same flow path; where required, insulation does not exist