U.S. International Business Travel: Its Impact on U.S. Merchandise Exports by Maksim Belenkiy and David Riker Office of Competition and Economic Analysis November 2012 Manufacturing and Services Economics Briefs are produced by the Office of Competition and Economic Analysis of the International Trade Administration’s Manufacturing and Services unit. A complete list of reports, along with links to other trade data and analysis, is available at www.trade.gov/mas/ian.
Transcript
U.S. International Business Travel:
Its Impact on U.S. Merchandise Exports
by Maksim Belenkiy and David Riker
Office of Competition and Economic Analysis
November 2012
Manufacturing and Services Economics Briefs are produced by the Office of Competition and Economic Analysis of the International Trade Administration’s Manufacturing and Services unit. A complete list of reports, along with links to other trade data and analysis, is available at www.trade.gov/mas/ian.
Manufacturing and Services Economics Brief No. 10
ii U.S. International Business Travel – Novemeber2012
Acknowledgements
We would like to thank Alis Asadurian, Joseph Flynn, Phillip McCalman and the Office
of Travel and Tourism Industries for helpful suggestions.
International Trade Administration
U.S. International Business Travel iii
Contents Acknowledgements ......................................................................................................................... ii
Contents ......................................................................................................................................... iii
Executive Summary ........................................................................................................................ v
Table 1 - List of Regions Included in the Analysis ........................................................................ 2 Table 2 - 2009 Share of U.S. Business Travelers, Leisure Travelers, and Exports by Region ...... 3 Table 3 - OLS Econometric Model of Exports ............................................................................... 4 Table 4 - First-Stage Model of the Number of Business Travelers ................................................ 5 Table 5 - Second-Stage Model of U.S. Merchandise Exports ........................................................ 6 Table 6 - Alternative IV Model With Lagged Effect on Business Travel ...................................... 7 Table 7 - Instrumental Variables Model of Exports Without Trade Cost ....................................... 8 Table 8 - Marginal Returns to Business Travel in 2009 ................................................................. 9
Manufacturing and Services Economics Brief No. 10
iv U.S. International Business Travel – Novemeber2012
<Page intentionally left blank>
International Trade Administration
U.S. International Business Travel v
Executive Summary
Achieving the National Export Initiative goal of doubling U.S. exports within five years
will require market strategies that increase the competiveness of U.S. industries. Outbound U.S.
international business travel is likely to have a key role. It helps U.S. industries establish their
presence and brand appeal abroad. It brings them face-to-face with qualified potential buyers,
agents, distributors, and other business partners and provides them with first-hand knowledge of
overseas markets. U.S. international business travel, in turn, is facilitated by government-
sponsored trade missions and private industry efforts. In this economics brief, we quantify the
economic benefits of U.S. international business travel in terms of the dollar value of U.S.
merchandise exports that it generates.
We find that:
U.S. outbound international business travel has a significant, positive effect on the U.S.
merchandise exports;
The impact of outbound international business travel on trade is generally higher for countries
that are likely more dissimilar to the United States in terms of culture, language and other
factors that influence U.S. brand knowledge;
Each additional international business trip increases U.S. merchandise exports to the visited
country by $36,693 per year, on average.
For the National Export Initiative priority countries of Brazil, China and India, U.S.
merchandise exports will increase by an average of $53,338, $66,587, and $26,176,
respectively, for each additional outbound international business trip.
Manufacturing and Services Economics Brief No. 10
vi U.S. International Business Travel – Novemeber2012
<Page intentionally left blank>
International Trade Administration
U.S. International Business Travel 1
Introduction
Ninety-five percent of the world’s consumers reside outside of the United States.1 This
fact suggests vast opportunities for U.S. firms to expand into foreign markets. To be a successful
exporter, a firm needs to make its goods and services visible in foreign markets and to establish
international distribution channels. U.S. international business travelers facilitate trade in
manufactured goods through face-to-face interactions. They negotiate sales, promote brands,
and establish joint ventures. The resulting expansion of a country’s exports can generate
significant benefits for the U.S. economy. Although the expenditures of outbound U.S.
international business travelers are counted as U.S. services imports, these marketing efforts are
likely to facilitate a significant expansion of U.S. exports of goods and services.
In this economics brief, we specifically ask: How large is the increase in U.S.
merchandise exports generated by outbound U.S. international business travel? We answer this
question using an econometric model of the relationship between outbound U.S. international
business travel and U.S. merchandise exports. We derive our econometric specification by
incorporating international business travel into a model of international trade.2 In this model, the
number of international business travelers to each country is a choice of each firm, with costs
and benefits. We assume that firms undertake marketing in order to reach an expanded set of
consumers in foreign markets. Insufficient knowledge about U.S. brands may limit demand for
U.S. merchandise exports. In response, firms increase international business travel. Thus, in our
model U.S. merchandise exports and U.S. international business travel are jointly determined.
The results of our model establish a positive relationship between U.S. outbound
international business travel and merchandise trade without observing whether each business trip
directly contributed directly to additional sales. We find that the effect of business travel on
merchandise trade is higher for countries that are likely more dissimilar to the United States in
terms of language and culture.
1Report to the President on the National Export Initiative, U.S. Department of Commerce (2010). 2Theoretical model of international business travel and trade available from the authors upon request.
Manufacturing and Services Economics Brief No. 10
2 U.S. International Business Travel – November 2012
Data on International Travel and Trade
The data on business and leisure travel are from the outbound U.S. travel and tourism
statistics published by the Office of Travel and Tourism (OTTI) of the U.S. Department of
Commerce. This publication provides a summary of responses to OTTI’s annual Survey of
International Air Travelers (SIAT). OTTI reports the fraction of business and leisure travelers to
thirty-six regions (defined as either a single country or a set of countries). To construct the
numbers of business and leisure travelers, we multiply the shares of business and leisure
travelers for each region and year by the total numbers of travelers by type and year. The
From these thirty-six regions, we focus on the twenty-one regions listed in Table 1, which
all have complete data for the period from 1996 to 2009. Canada and Mexico are not included in
our analysis. The SIAT only includes international air travelers from the United States. Since
Canada and Mexico can be easily reached by land, the volume of business travel to these two
countries is undercounted by the air travel survey.
Table 1 - List of Regions Included in the Analysis
Africa Hong Kong South Korea Australia India Spain
Caribbean Ireland Switzerland Central America Italy Taiwan
China Japan United Kingdom
Eastern Europe Middle East
France Netherlands
Germany South America
We examine bilateral export volumes between the United States and the twenty-one
regions for the period from 1996 to 2009. We aggregate the FAS value of U.S. merchandise
exports to the six multi-country regions (Africa, Caribbean, Central America, Eastern Europe,
Middle East and South America) by adding the corresponding value of exports to the countries in
these regions. The total FAS value of U.S. merchandise exports in 2009 was $651 billon. After
aggregating and matching the data to the international travel counts, the total FAS value of U.S.
International Trade Administration
U.S. International Business Travel 3
merchandise exports from our set of twenty-one regions is $554 billion in 2009, which is 85
percent of the global total.
Table 2 reports the share of U.S. business travelers, leisure travelers, and merchandise
exports by region in 2009. The regions that account for the largest shares of U.S. merchandise
exports – China, Japan, the Middle East, South America, and the United Kingdom – also account
for some of the largest shares of business travelers.
Table 2 - 2009 Share of U.S. Business Travelers, Leisure Travelers, and Exports by Region
Region Share of Total
Business Travelers Leisure Travelers U.S. Exports Africa 5% 3% 4% Australia 2% 2% 3% Caribbean 8% 19% 3% Central America 4% 6% 3% China 6% 4% 10% Eastern Europe 4% 4% 1% France 5% 6% 4% Germany 7% 5% 6% Hong Kong 4% 2% 2% India 4% 4% 2% Ireland 2% 2% 1% Italy 4% 6% 2% Japan 9% 4% 7% Korea 4% 6% 4% Middle East 7% 2% 7% Netherlands 3% 8% 4% South America 7% 2% 9% Spain 2% 4% 1% Switzerland 3% 2% 2% Taiwan 3% 2% 3%
United Kingdom 10% 8% 6% Source: Authors calculations
We construct measures of shipping costs and aggregate demand in each region to control
for determinants of the volume of international merchandise trade in conventional gravity
models. We measure the size of the market in each region as the GDP of the country or the
Manufacturing and Services Economics Brief No. 10
4 U.S. International Business Travel – November 2012
combined GDPs of the group of countries. The GDP data are from United Nations national
accounts. We use the ratio of the CIF value of U.S. imports from the region to the customs value
of these imports as a proxy for the cost of shipping the goods from the United States to the
region in each year. The CIF ratio reflects the international distance and transport and insurance
costs per unit of distance. The ratios in the sample range from 1.009 to 1.077.
The Effect of Outbound Business Travel on U.S. Exports
We use the panel dataset to estimate the effect of business travel on U.S. merchandise
exports. To control for a variety of country characteristics, including barriers to merchandise
trade, our econometric specification controls for country fixed effects. Since the United States is
the source country for all of the trade flows in the dataset, the year fixed effects in the
specification control for the size of the U.S. production base and production costs. We apply
ordinary least squares (OLS) to obtain the baseline estimates. We report these estimates in Table
3. The OLS estimate implies that a 10 percent increase in the number of business travelers,
holding constant the other explanatory variables, increases U.S. merchandise exports by
approximately 2.84 percent.
Table 3 - OLS Econometric Model of Exports* Variables Coefficients
Gross Domestic Product
0.579 (0.064)
Trade Cost
-4.875 (1.914)
Business Travelers
0.284 (0.042)
Year Fixed Effects Included Region Fixed Effects Included R-Squared 0.97 Number of Observations 294
*All variables in logs (standard error in parentheses). The dependant variable is U.S. exports to the region in the year. Source: Author’s calculations
However, our theoretical model indicates that the OLS estimates will be biased, since
U.S. international business travel is jointly determined with U.S. merchandise exports. To
International Trade Administration
U.S. International Business Travel 5
correct this bias, we use the number of leisure travelers to the region as an instrument for the
number of U.S. business travelers to the region. We present the instrumental variables (IV)
estimates in two stages. In the first-stage, we confirm that the number of international leisure
travelers to a region is correlated with the number of U.S. business travelers to the region. This
is the first requirement of a valid instrumental variable and Table 4 reports the results of the first-
stage estimation. The results of the second-stage estimation are reported in Table 5. We find
that the estimated coefficient on the number of international business travelers increases to 0.46.
This elasticity implies that a 10 percent increase in the number of business travelers increases the
value of U.S. merchandise exports by approximately 4.6 percent.3
Table 4 - First-Stage Model of the Number of Business Travelers*
Variables Coefficients
Gross Domestic Product 0.276
(0.082)
Trade Cost 4.385
(2.610)
Leisure Travelers 0.515
(0.063) Year Fixed Effects Included Region Fixed Effects Included
R-Squared 0.871 Number of Observations 294 *All variables in logs (standard error in parentheses). The dependant variable is the number of business travelers. The instrumental variable is the number of leisure travelers to the region in the year. Source: Author’s calculations
As a sensitivity analysis, we re-estimated our model in Table 5 omitting China and then
South America from the estimation sample. The purpose of this analysis was to test whether the
estimated elasticity is sensitive to the inclusion of these two large destination regions, which
could be outliers that drive the elasticity estimate. We find that the estimated elasticity is 0.436
when China is excluded and 0.435 when South American is excluded. In both cases, these
elasticities are close to the elasticity reported in Table 5. The results indicate that the elasticity
estimate is not sensitive to the set of countries included in the estimation sample. 3 We performed a Hausman test of whether OLS or IV is an appropriate estimator for our econometric specification. We reject the null hypothesis of the Hausman test (that the OLS estimator is consistent) in favor of the IV estimates.
Manufacturing and Services Economics Brief No. 10
6 U.S. International Business Travel – November 2012
Table 5 - Second-Stage Model of U.S. Merchandise Exports*
Variables Coefficients
Gross Domestic Product 0.518
(0.069)
Trade Cost -5.552 (1.878)
Business Travelers 0.460
(0.087) Year Fixed Effects Included Region Fixed Effects Included R-Squared 0.968 Number of Observations 294
*All variables in logs (standard error in parentheses). The dependant variables are the U.S. exports to the region in the year and the number of business travelers. The instrumental variable is the number of leisure travelers to the region in the year. Source: Author’s calculations
We performed a second sensitivity analysis to provide further support for the validity of
the instrumental variable. The second requirement of a valid instrumental variable is that it
should not be correlated with the error term in the export equation. This issue is addressed in
part by including the shipping cost measure in our econometric specification. The number of
leisure travelers could be correlated with the cost of shipping merchandise. By controlling for
the cost of shipping goods, we ensure that the error term does not include shipping costs and is
not likely to be correlated with the number of leisure travelers to the region. We also considered
using lagged correlation as a way to further reduce the likelihood of estimation bias.
Specifically, we model exports in each year as a function of the number of business travelers in
the prior year. In this case, the instrumental variable is the number of leisure travelers in the
prior year. This should further reduce or eliminate correlation between the number of business
travelers and the error term of the export equation. Table 6 reports this analysis. The elasticity
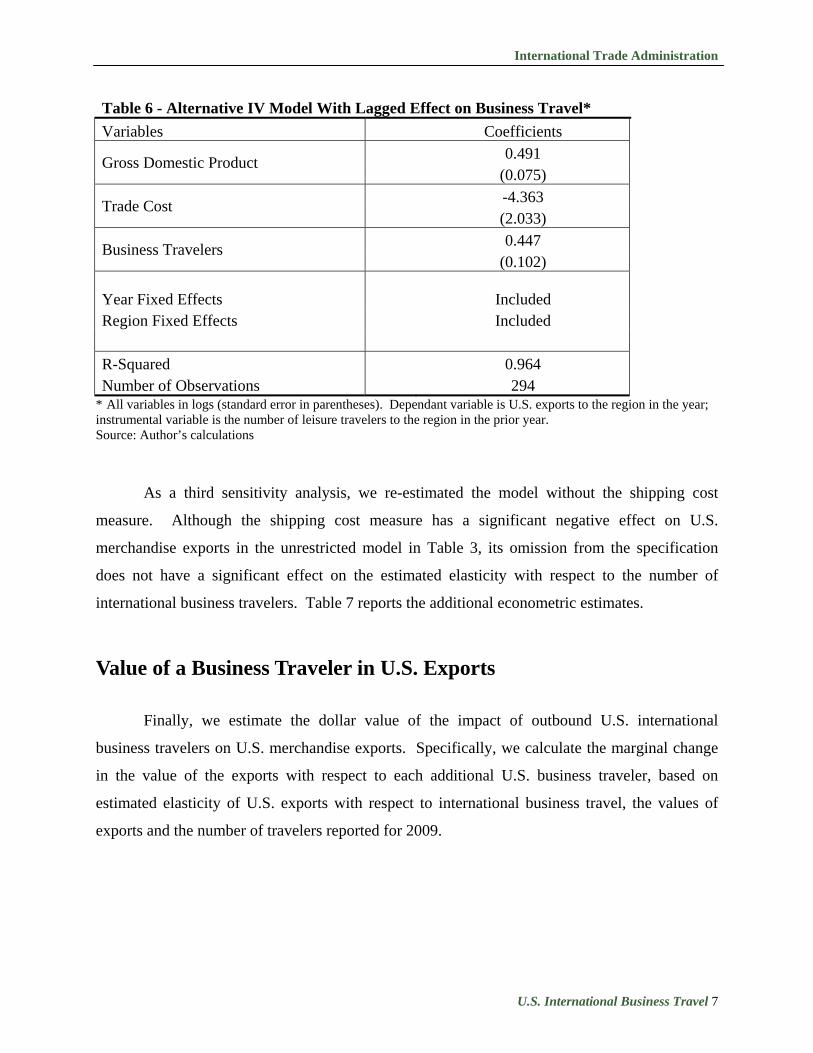
estimate for this alternative specification is 0.447, which is still close to the estimate in Table 5.
International Trade Administration
U.S. International Business Travel 7
Table 6 - Alternative IV Model With Lagged Effect on Business Travel*
Variables Coefficients
Gross Domestic Product 0.491
(0.075)
Trade Cost -4.363 (2.033)
Business Travelers 0.447
(0.102) Year Fixed Effects Included Region Fixed Effects Included R-Squared 0.964 Number of Observations 294
* All variables in logs (standard error in parentheses). Dependant variable is U.S. exports to the region in the year; instrumental variable is the number of leisure travelers to the region in the prior year. Source: Author’s calculations
As a third sensitivity analysis, we re-estimated the model without the shipping cost
measure. Although the shipping cost measure has a significant negative effect on U.S.
merchandise exports in the unrestricted model in Table 3, its omission from the specification
does not have a significant effect on the estimated elasticity with respect to the number of
international business travelers. Table 7 reports the additional econometric estimates.
Value of a Business Traveler in U.S. Exports
Finally, we estimate the dollar value of the impact of outbound U.S. international
business travelers on U.S. merchandise exports. Specifically, we calculate the marginal change
in the value of the exports with respect to each additional U.S. business traveler, based on
estimated elasticity of U.S. exports with respect to international business travel, the values of
exports and the number of travelers reported for 2009.
Manufacturing and Services Economics Brief No. 10
8 U.S. International Business Travel – November 2012
Table 7 - Instrumental Variables Model of Exports Without Trade Cost*
Variables Coefficients
Gross Domestic Product 0.554
(0.067)
Trade Cost Not Included
Business Travelers 0.466
(0.089) Year Fixed Effects Included
Region Fixed Effects Included
R-Squared 0.966
Number of Observations 294 * All variables in logs (standard error in parentheses). Dependant variable is U.S. exports to the region in the year; instrumental variable is the number of leisure travelers to the region in the prior year. Source: Author’s calculations
We find that a U.S. business traveler generates $36,693 in additional U.S. exports on
average across the countries. We note, for example, the values for China and the Netherlands
($66,587 and $69,590) are far above the average; and the value for the United Kingdom
($27,321) is below the average. Table 8 reports the results for each of the twenty-one regions.
The estimates can be further refined using a measure of the intensity of each international
business trip, like the number the nights spent in the country. In our main estimation, the region
and year fixed effects account for systematic differences in travel intensity between regions and
between years. However, the estimated dollar values in Table 8 do not account for travel
intensity. They represent the marginal contribution of each business trip, not the marginal
contribution of each travel day. To approximate the latter, we divide the dollar-value estimates
in Table 8 by 18.4, the average number of nights of U.S. overseas business trips in 2009.
International Trade Administration
U.S. International Business Travel 9
Table 8 - Marginal Returns to Business Travel in 2009
Region Returns per Trip (US$) Returns per Travel Day (US$)
Africa $33,467 $1,819
Australia $65,288 $3,548
Caribbean $13,353 $736
Central America $38,414 $2,088
China $66,587 $3,619
Eastern Europe $10,088 $548
France $29,067 $1,580
Germany $35,991 $1,956
Hong Kong $27,232 $1,480
India $26,176 $1,423
Ireland $24,941 $1,355
Italy $20,045 $1,089
Japan $33,692 $1,831
Korea $48,444 $2,633
Middle East $40,991 $2,228
Netherlands $69,596 $3,782
South America $53,338 $2,899
Spain $29,997 $1,630
Switzerland $36,656 $1,992
Taiwan $39,871 $2,166
United Kingdom $27,321 $1,485
Average $36,693 $1,994 Source: Author’s calculations
Concluding Remarks
The results of our model establish a positive relationship between U.S. outbound
international business travel and merchandise trade without observing whether each business trip
directly contributed directly to additional sales. By calculating marginal dollar value of a
business trip to a set of countries and regions, we find that the effect of business travel on
merchandise trade is higher for countries that are likely more dissimilar to the United States in
terms of language and culture. This dissimilarly may contribute to lower brand knowledge of
U.S. products. Accordingly, our results may provide a guide of how to allocate scarce business
travel resources. This analysis may be particularly useful for small and medium size businesses
Manufacturing and Services Economics Brief No. 10
10 U.S. International Business Travel – November 2012
that are looking to enter export markets without direct access to global distribution and
marketing networks.
We estimate that each additional international business trip will increase U.S.
merchandise exports to the visited country by $36,693 per year, on average. For the NEI priority
countries of Brazil (as proxied by South America), China and India, U.S. merchandise exports
will increase by $53,338, $66,587, and $26,176, respectively, on average. The impact of
outbound business travel on trade varies considerably across the twenty-one destination regions
that we analyze.
Based on these estimates, we conclude that trade missions and private industry efforts
that provide first-hand knowledge of overseas markets and bring U.S. companies face-to-face
with qualified potential buyers, agents, distributors, and other business partners can provide a
significant boost to U.S. exports of goods, and probably also to U.S. exports of services, by
facilitating outbound international business travel.
International Trade Administration
U.S. International Business Travel 11
References
Anderson, James E. and Eric van Wincoop (2003). “Gravity with Gravitas: A Solution to the Border Puzzle,” American Economic Review, 93: 170-192.
Aradhyula, Satheesh and Russell Tronstad (2003). “Does Tourism Promote Cross-Border Trade?” American Journal of Agricultural Economics, 35: 569-579.
Arkolakis, Costas (2008). “Market Penetration Costs and the New Consumer Margin in International Trade.” Yale Working Paper.
Bagwell, Kyle (2007). “The Economic Analysis of Advertising.” Handbook of Industrial Organization. Amsterdam: North-Holland.
Bernard, Andrew B., J. Bradford Jensen, Stephen J. Redding, and Peter K. Schott (2007). “Firms in International Trade.” Journal of Economic Perspectives 21: 105-130.
Chaney, Thomas (2008). “Distorted Gravity: The Intensive and Extensive Margins of International Trade.” American Economic Review, 98: 1707-1721.
Cristea, Anca (2011). “Buyer-Seller Relationships in International Trade: Evidence from U.S. States' Exports and Business Class Travel.” University of Oregon manuscript.
Eaton, Jonathan, Samuel Kortum, and Francis Kramarz (2004). “ Dissecting Trade: Firms, Industries, and Export Destinations.” NBER Working Paper 10344.
Gray, H.P. (1970). International Arrivals: International Trade. Lexington, MA: D.C. Heath.
Helpman, Elhanan, Marc Melitz and Yona Rubinstein (2008). “Estimating Trade Flows: Trading Partners and Trading Volumes.” Quarterly Journal of Economics, 123: 441-487.
Helpman, Elhanan, Marc J. Melitz and Stephen R. Yeaple (2004). “"Export versus FDI with Heterogeneous Firms." American Economic Review, 94: 300-316.
Keintz, Rita M. (1971). “A Study of the Demand for International Travel to and from the United States.” American Economist, 15: 551-59.
Khan, Habibullah, Rex S. Toh and Lyndon Chua (2005). “Tourism and Trade: Cointegration and Granger Causality Tests.” Journal of Travel Research, 44: 171-176.
Krugman, Paul R. (1980). “Scale Economies, Product Differentiation, and the Pattern of Trade.” American Economic Review, 5: 950-959.
Kulendran, Nada, and Kenneth Wilson (2000). “Is There a Relationship Between International Trade and International Travel.” Applied Economics, 32: 1001-1009.
Kulendran, Nada, and Stephen F. Witt (2003). “Forecasting the Demand for International Business Tourism.” Journal of Travel Research, 41: 265-271.
Manufacturing and Services Economics Brief No. 10
12 U.S. International Business Travel – November 2012
Melitz, Marc J. (2003). “The Impact of Trade on Aggregate Industry Productivity and Intra-Industry Reallocations.” Econometrica 71: 1695-1725.
Poole, Jennifer P. (2010). “Business Travel as an Input to International Trade.” UC Santa Cruz Working Paper.
Shan, Jordan and Kenneth Wilson (2001). “Causality between Trade and Tourism: Empirical Evidence from China.” Applied Economics Letters, 8: 279-283.
International Trade Administration
U.S. International Business Travel 13
Technical Appendix Econometric Specification
From the theoretical model, we determine the coefficients in the following system of log-
linear equations, with lower-case variables indicating the natural logs of the variables:
(1)
(2)
For example, the coefficient is the elasticity of the value of U.S. exports with respect
to the number of business travelers to country j in year t. The system of log-linear equations in
(8) and (9) jointly determines the number of business travelers to country and the value of U.S.
exports to the country. The number of business travelers is increasing in income, brand
awareness and the proximity and size of country , and it is decreasing in the cost of the
international travel. Similarly, the value of U.S. exports is increasing in the volume of business
travel and country size and is decreasing in the cost of international shipping.
The key empirical implication of the log-linear system of equations in (1) and (2) is that
business travel is not an independent determinant of export volume to country , because exports
and the number of business travelers are both determined by the unobservable export demand
factors, represented in these equations by the variables and . This joint endogeneity needs
to be addressed in the econometric analysis.
In our econometric estimation, we use the specification in (3) to estimate the
parameters in (2).
(3)
The variables and represent country and time fixed effects. The error term of the
econometric model, , includes and . OLS estimation of this elasticity based on
equation (10), with unobservable and in the error term, will generate a biased estimate of
as long as and are not equal to zero.
Manufacturing and Services Economics Brief No. 10
14 U.S. International Business Travel – November 2012
To obtain an unbiased estimate of , we use an instrumental variable. The instrumental
variable should be correlated with the number of international business travelers but should not
depend on any other factors that affect the demand for exports, including the variables
represented by and . We propose that the annual count of leisure travelers from the United
States to country satisfies these requirements. We expect that the number of leisure travelers is
affected by the cost of traveling to the country as well as many other factors that we do not
directly observe, including the quality of historical and cultural attractions that are unrelated to
commercial opportunities to export to country . We use the variable to represent the count
of leisure travelers. We expect that is positively correlated with , since both types of
international travelers reflect the cost of travel from the United States to the country , but is not
correlated with or .
In the first stage of the estimation, we regress the number of business travelers on the
number of leisure travelers, using the specification in (4).
(4)
The variables and represent country and year fixed effects in the first-stage
specification. Then we substitute the predicted values of into (3). This two-stage procedure
is equivalent to instrumental variable (IV) regression where the number of business travelers is
instrumented with the number of leisure travelers.
International Trade Administration
U.S. International Business Travel 15
<Page intentionally left blank>
About the Office of Competition and Economic Analysis
The Office of Competition and Economic Analysis (OCEA), a part of the International Trade Administration’s Manufacturing and Services unit, provides industry and policy decision makers with information on the impacts of economic and regulatory policies on U.S. manufacturing and services industries. Its staff of specialists perform in-depth industry analysis on the effects of both domestic and foreign policy developments on U.S. business competitiveness. For more information, or to access other OCEA reports, visit www.trade.gov/mas/ian, or contact the office at (202) 482-5145.
The International Trade Administration's mission is to create prosperity by strengthening the competitiveness of U.S. industry, promoting trade and investment, and ensuring fair trade and compliance with trade laws and agreements.