+ All Categories
Home > Documents > U.S. Liquids-Focused Threshold Economics -...

U.S. Liquids-Focused Threshold Economics -...

Date post: 03-Apr-2018
Category:
Upload: buidung
View: 214 times
Download: 1 times
Share this document with a friend
58
David W. Kistler 713-546-7237 [email protected] Pearce W. Hammond, CFA 713-546-7269 [email protected] Scott M. Wilmoth 713-546-7244 [email protected] Adam T. Lawlis 713-546-7249 [email protected] *Important Disclosures Appear in Appendix D © 2011 Simmons & Company International. All rights reserved. No part of this report may be reproduced or transmitted in any form or by any means, electronic or mechanical, including photocopying or by any information storage and retrieval system, without permission in writing from Simmons & Company International. Energy Industry Research August 25, 2011 U.S. Liquids-Focused Threshold Economics With recent economic weakness leading to a nearly 15% retrenchment in WTI since 7/22, investors have been increasingly curious as to the threshold oil price that would induce E&Ps to reduce U.S. drilling activity. As such, we analyzed both half- cycle and full cycle (includes land and G&A) economics for 18 liquids-focused plays across the U.S to determine the threshold WTI prices necessary to generate a 10% after-tax rate of return (ATROR). While there is always abundant variability within each play in terms of IPs, EURs, well costs, etc., we have aggregated results from both ends of the spectrum to derive representative price ranges to best reflect current threshold economics. The results of our full-cycle economics analysis yields a range of threshold prices from $52/bbl to $78/bbl, with the average across all plays of $65/bbl. Our half-cycle economic analysis yielded a threshold price range of $43/bbl to $63/bbl, with the average across all plays of $52/bbl. Based on a flat price deck of $85/bbl and $4.50/mcf, we estimate the plays are currently yielding half-cycle IRRs in the range of 17% to 86%, with a rig-weighted average IRR of ~30%. Key Highlights from our Analysis: These 18 plays account for 675 rigs, or ~70% of the current liquids-rich rig count in the L48. Of these 675 rigs, we estimate that ~55% are currently running in the $65-$75/bbl threshold range. Many of the more economic plays currently (Colony Granite Wash, Yeso, Parshall/Sanish Bakken, Monument Butte, Central Basin Platform) have some limiting factors which likely prevent a meaningful rig ramp in the future: 1) Scalability (size of the play or a lack of running room), 2) Vertical plays with low cycle times where rigs and completion activity is not a constraint, but operating logistics are challenging as many companies are already running as fast as they can. Plays that have experienced severe cost inflation (driven by rig count growth and completion intensity) have moved up the cost curve and are now the most marginal plays (Bakken, Panhandle Granite Wash). There are many factors external to well economics which could lead operators to drill through prices with unattractive well economics (joint venture carries, drilling to maintain leasehold, etc). We expect the Eagle Ford and Bakken drilling activity to be largely price resilient as strong balance sheets and joint venture capital (primarily Eagle Ford) should prevail, as companies need to drill to hold acreage. Overall, our analysis reveals that rates of return in the current oil price and service cost environment vary significantly across a number of plays with many plays yielding less attractive returns than many E&Ps publicize. Further, should service cost inflation continue or WTI continue to contract, returns and, correspondingly, activity could be threatened in a number of plays. However, when looking at our well economics in tandem with our expectations for future rig activity, the largest governor for E&P drilling activity remains access to capital as well as cash flows, as E&Ps continue to spend in excess of cash flow generation. With the recent pull back in the crude strip, E&P cash flows are now anticipated to be lower than previously expected. However, given the relative health of E&P balance sheets, and seemingly insatiable appetite of both the M&A market (JVs and divestitures) and financing markets, we would not anticipate a material change in rig activity from Independent E&Ps or the Majors in 2H’11 as capital budgets are largely set at this point of the year and supported by commodity hedges. However, should crude prices dip below $80/bbl, we would not be surprised to see Private operators (40% of oil rig count) trim activity in less economic plays. For 2012, with the WTI strip currently at ~$90/bbl, our threshold analysis leads us to believe that the prospect for continued robust growth in the oil rig count is not as likely as it was a month ago when WTI was north of $100/bbl. In short, we do not expect the same kind of activity ramp in 2012 as witnessed in 2011, and we would expect activity to moderate modestly should WTI fall below $80/bbl, with a more significant leg down in the rig count if WTI falls below $70/bbl. Finally, should oil prices continue to stagnate or contract through YE’11, there is the likelihood that returns stated in this report further erode with additional cost inflation.
Transcript

David W. Kistler 713-546-7237

[email protected]

Pearce W. Hammond, CFA 713-546-7269

[email protected]

Scott M. Wilmoth 713-546-7244

[email protected]

Adam T. Lawlis 713-546-7249

[email protected]

*Important Disclosures Appear in Appendix D © 2011 Simmons & Company International. All rights reserved. No part of this report may be reproduced or transmitted in any form or by any means, electronic or mechanical, including photocopying or by any information storage and retrieval system, without permission in writing from Simmons & Company International.

Energy Industry ResearchAugust 25, 2011

U.S. Liquids-Focused Threshold Economics With recent economic weakness leading to a nearly 15% retrenchment in WTI since 7/22, investors have been increasingly curious as to the threshold oil price that would induce E&Ps to reduce U.S. drilling activity. As such, we analyzed both half-cycle and full cycle (includes land and G&A) economics for 18 liquids-focused plays across the U.S to determine the threshold WTI prices necessary to generate a 10% after-tax rate of return (ATROR). While there is always abundant variability within each play in terms of IPs, EURs, well costs, etc., we have aggregated results from both ends of the spectrum to derive representative price ranges to best reflect current threshold economics. The results of our full-cycle economics analysis yields a range of threshold prices from $52/bbl to $78/bbl, with the average across all plays of $65/bbl. Our half-cycle economic analysis yielded a threshold price range of $43/bbl to $63/bbl, with the average across all plays of $52/bbl. Based on a flat price deck of $85/bbl and $4.50/mcf, we estimate the plays are currently yielding half-cycle IRRs in the range of 17% to 86%, with a rig-weighted average IRR of ~30%. Key Highlights from our Analysis:

• These 18 plays account for 675 rigs, or ~70% of the current liquids-rich rig count in the L48. Of these 675 rigs, we estimate that ~55% are currently running in the $65-$75/bbl threshold range.

• Many of the more economic plays currently (Colony Granite Wash, Yeso, Parshall/Sanish Bakken, Monument Butte, Central Basin Platform) have some limiting factors which likely prevent a meaningful rig ramp in the future: 1) Scalability (size of the play or a lack of running room), 2) Vertical plays with low cycle times where rigs and completion activity is not a constraint, but operating logistics are challenging as many companies are already running as fast as they can.

• Plays that have experienced severe cost inflation (driven by rig count growth and completion intensity) have moved up the cost curve and are now the most marginal plays (Bakken, Panhandle Granite Wash).

• There are many factors external to well economics which could lead operators to drill through prices with unattractive well economics (joint venture carries, drilling to maintain leasehold, etc).

• We expect the Eagle Ford and Bakken drilling activity to be largely price resilient as strong balance sheets and joint venture capital (primarily Eagle Ford) should prevail, as companies need to drill to hold acreage.

Overall, our analysis reveals that rates of return in the current oil price and service cost environment vary significantly across a number of plays with many plays yielding less attractive returns than many E&Ps publicize. Further, should service cost inflation continue or WTI continue to contract, returns and, correspondingly, activity could be threatened in a number of plays. However, when looking at our well economics in tandem with our expectations for future rig activity, the largest governor for E&P drilling activity remains access to capital as well as cash flows, as E&Ps continue to spend in excess of cash flow generation. With the recent pull back in the crude strip, E&P cash flows are now anticipated to be lower than previously expected. However, given the relative health of E&P balance sheets, and seemingly insatiable appetite of both the M&A market (JVs and divestitures) and financing markets, we would not anticipate a material change in rig activity from Independent E&Ps or the Majors in 2H’11 as capital budgets are largely set at this point of the year and supported by commodity hedges. However, should crude prices dip below $80/bbl, we would not be surprised to see Private operators (40% of oil rig count) trim activity in less economic plays. For 2012, with the WTI strip currently at ~$90/bbl, our threshold analysis leads us to believe that the prospect for continued robust growth in the oil rig count is not as likely as it was a month ago when WTI was north of $100/bbl. In short, we do not expect the same kind of activity ramp in 2012 as witnessed in 2011, and we would expect activity to moderate modestly should WTI fall below $80/bbl, with a more significant leg down in the rig count if WTI falls below $70/bbl. Finally, should oil prices continue to stagnate or contract through YE’11, there is the likelihood that returns stated in this report further erode with additional cost inflation.

2

Table of Contents

Lower 48 Shale Plays Map ........................................................................................................... 3 

Assumptions Summary ................................................................................................................ 3 

Threshold Prices Summary .......................................................................................................... 4 

Threshold Economics vs. Rig Count ............................................................................................ 8 

Limitations of Threshold Economics ......................................................................................... 10 

Emerging Oil Plays ..................................................................................................................... 13 

Bakken ....................................................................................................................................... 14 

Bakken Parshall Sanish ............................................................................................................. 16 

DJ Niobrara ................................................................................................................................ 18 

DJ Niobrara Wattenberg ............................................................................................................ 20 

Eagle Ford Condensate .............................................................................................................. 22 

Eagle Ford Oil ............................................................................................................................. 24 

Granite Wash - Colony ................................................................................................................ 26 

Granite Wash - Panhandle .......................................................................................................... 28 

Mississippi Lime ........................................................................................................................ 30 

Permian—Central Basin Platform Vertical ................................................................................ 32 

Permian—Spraberry Vertical ..................................................................................................... 34 

Permian—Yeso Vertical ............................................................................................................. 36 

Permian—Avalon ........................................................................................................................ 38 

Permian—New Mexico Bone Spring .......................................................................................... 40 

Permian—Texas Bone Spring .................................................................................................... 42 

Permian—Wolfbone Vertical ...................................................................................................... 44 

Uinta--Monument Butte Vertical ................................................................................................ 46 

Uinta—Wasatch Vertical ............................................................................................................ 48 

Appendix A: Liquids Focused Play Summary ............................................................................ 50 

Appendix B: Additional Liquids Rich Well Economics ............................................................... 51 

Cana Woodford ........................................................................................................................... 51 

Northwest Cana Woodford ......................................................................................................... 53 

Marcellus Liquids Rich ............................................................................................................... 54 

Appendix D ................................................................................................................................. 57 

.

3

Lower 48 Shale Plays Map

Assumptions Summary

Source: Company Filings, HPDI and Simmons & Company Estimates.

*Please note that unless otherwise stated all analysis above assumes horizontal drilling.

Assumptions Avalon BakkenBakken Parshall 

SanishCentral Basin 

Platform VerticalColony Granite 

WashDJ Niobrara

Eagle Ford Condensate

Eagle Ford Oil Mississippi Lime

Well Cost ($MM) $5.0 $9.0 $7.3 $0.8 $7.5 $4.0 $7.5 $8.0 $3.0EUR Per Well (Mboe) 400.0 450.0 784.0 83.0 1000.0 225.0 922.9 500.0 400.0

Implied F&D Cost ($/boe) $15.63 $25.00 $11.69 $11.45 $9.37 $22.22 $10.16 $20.00 $9.9730‐Day IP Rate (boe/d) 402.2 713.0 731.5 65.0 1453.0 351.5 810.0 870.0 238.6

Production Costs ($/boe) $5.00 $8.00 $8.00 $12.70 $6.00 $8.00 $7.50 $8.00 $8.00Production Taxes ($/boe) 6% 11% 11% 5% 7% 4% 6% 5% 7%

1st Year Decline (%) ‐56% ‐75% ‐71% ‐50% ‐75% ‐78% ‐69% ‐78% ‐56%2nd Year Decline (%) ‐37% ‐43% ‐34% ‐32% ‐37% ‐41% ‐32% ‐42% ‐28%3rd Year Decline (%) ‐27% ‐32% ‐23% ‐26% ‐25% ‐29% ‐22% ‐30% ‐20%

Well % Oil 33% 86% 86% 70% 18% 80% 35% 77% 52%Oil Diff to WTI (%) ‐6% ‐10% ‐10% ‐6% ‐8% ‐14% ‐10% ‐10% ‐6%

Well % NGLs 33% 8% 8% 9% 30% 12% 25% 11% 15%Well % Gas 33% 6% 6% 21% 52% 8% 40% 12% 33%

Threshold Oil Price Necessary for 10% ATROR $57.01 $62.86 $44.13 $45.59 $43.16 $59.30 $51.53 $53.31 $48.4515% ATROR $69.44 $71.48 $51.59 $51.69 $56.17 $68.23 $64.49 $60.99 $59.9020% ATROR $80.30 $78.92 $58.06 $57.15 $67.21 $75.86 $75.74 $67.51 $70.0525% ATROR $90.02 $85.53 $63.79 $62.13 $76.82 $82.56 $85.70 $73.23 $79.17

AssumptionsMonument Butte 

VerticalNM Bone Spring

Panhandle Granite Wash

Spraberry Vertical TX Bone SpringWasatch Vertical 

UintaWattenberg Niobrara

Wolfbone Vertical Yeso Vertical

Well Cost ($MM) $0.9 $6.0 $8.5 $1.7 $7.0 $2.8 $4.5 $5.0 $1.6EUR Per Well (Mboe) 75.0 400.0 1000.2 140.0 600.0 260.0 325.0 300.0 145.0

Implied F&D Cost ($/boe) $15.50 $18.75 $10.62 $15.18 $14.58 $13.46 $17.31 $20.83 $13.7930‐Day IP Rate (boe/d) 82.0 402.2 1552.0 78.3 603.3 470.0 507.7 325.0 125.0

Production Costs ($/boe) $10.00 $8.00 $6.00 $10.00 $8.00 $10.00 $6.00 $10.00 $10.00Production Taxes ($/boe) 6% 5% 6% 5% 5% 6% 4% 5% 7%

1st Year Decline (%) ‐38% ‐56% ‐79% ‐50% ‐56% ‐81% ‐78% ‐56% ‐50%2nd Year Decline (%) ‐35% ‐37% ‐35% ‐28% ‐37% ‐36% ‐41% ‐38% ‐34%3rd Year Decline (%) ‐32% ‐27% ‐23% ‐21% ‐27% ‐24% ‐29% ‐31% ‐28%

Well % Oil 92% 70% 11% 70% 70% 85% 40% 70% 70%Oil Diff to WTI (%) ‐22% ‐6% ‐8% ‐6% ‐6% ‐22% ‐14% ‐6% ‐6%

Well % NGLs 0% 20% 38% 20% 20% 0% 20% 15% 12%Well % Gas 8% 10% 51% 10% 10% 15% 40% 15% 18%

Threshold Oil Price Necessary for 10% ATROR $44.75 $55.78 $60.41 $59.67 $45.74 $53.83 $51.22 $54.77 $43.3015% ATROR $49.23 $64.95 $78.26 $71.36 $52.88 $62.15 $63.11 $59.82 $47.5620% ATROR $53.40 $72.97 $93.36 $81.80 $59.11 $69.13 $73.27 $64.34 $51.3925% ATROR $57.33 $80.14 $106.44 $91.26 $64.69 $75.16 $82.20 $68.46 $54.89

4

Threshold Prices Summary

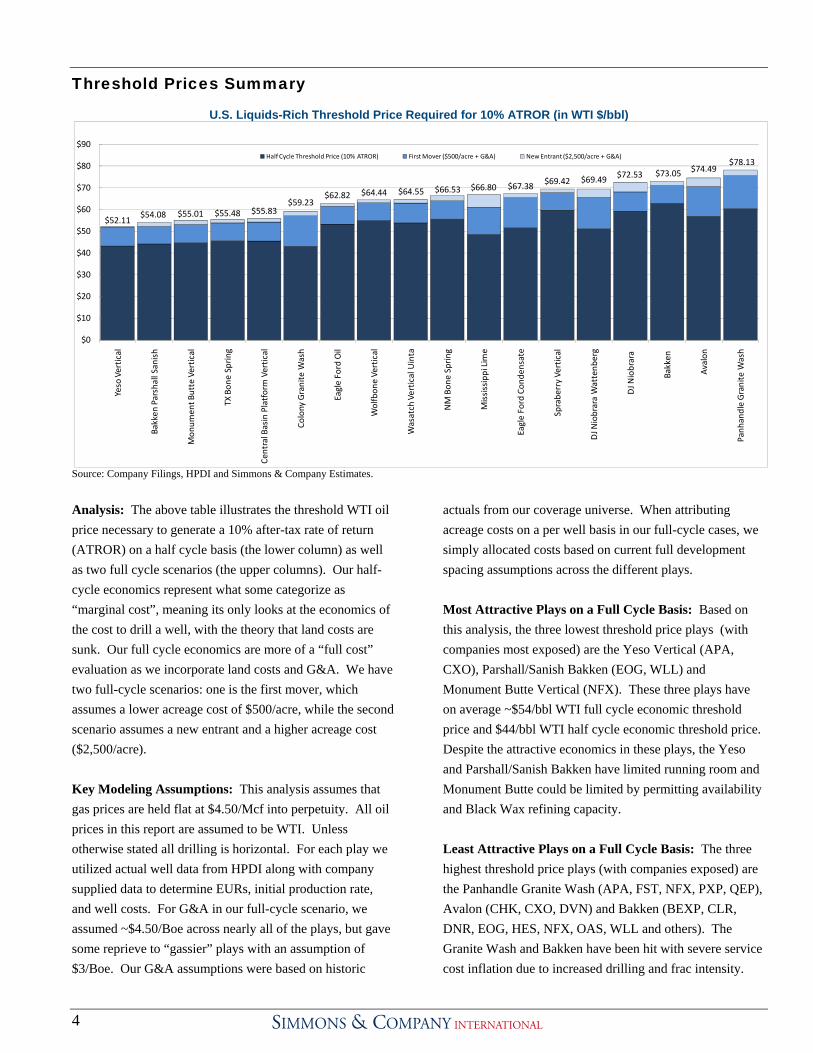
U.S. Liquids-Rich Threshold Price Required for 10% ATROR (in WTI $/bbl)

Source: Company Filings, HPDI and Simmons & Company Estimates. Analysis: The above table illustrates the threshold WTI oil price necessary to generate a 10% after-tax rate of return (ATROR) on a half cycle basis (the lower column) as well as two full cycle scenarios (the upper columns). Our half-cycle economics represent what some categorize as “marginal cost”, meaning its only looks at the economics of the cost to drill a well, with the theory that land costs are sunk. Our full cycle economics are more of a “full cost” evaluation as we incorporate land costs and G&A. We have two full-cycle scenarios: one is the first mover, which assumes a lower acreage cost of $500/acre, while the second scenario assumes a new entrant and a higher acreage cost ($2,500/acre). Key Modeling Assumptions: This analysis assumes that gas prices are held flat at $4.50/Mcf into perpetuity. All oil prices in this report are assumed to be WTI. Unless otherwise stated all drilling is horizontal. For each play we utilized actual well data from HPDI along with company supplied data to determine EURs, initial production rate, and well costs. For G&A in our full-cycle scenario, we assumed ~$4.50/Boe across nearly all of the plays, but gave some reprieve to “gassier” plays with an assumption of $3/Boe. Our G&A assumptions were based on historic

actuals from our coverage universe. When attributing acreage costs on a per well basis in our full-cycle cases, we simply allocated costs based on current full development spacing assumptions across the different plays. Most Attractive Plays on a Full Cycle Basis: Based on this analysis, the three lowest threshold price plays (with companies most exposed) are the Yeso Vertical (APA, CXO), Parshall/Sanish Bakken (EOG, WLL) and Monument Butte Vertical (NFX). These three plays have on average ~$54/bbl WTI full cycle economic threshold price and $44/bbl WTI half cycle economic threshold price. Despite the attractive economics in these plays, the Yeso and Parshall/Sanish Bakken have limited running room and Monument Butte could be limited by permitting availability and Black Wax refining capacity. Least Attractive Plays on a Full Cycle Basis: The three highest threshold price plays (with companies exposed) are the Panhandle Granite Wash (APA, FST, NFX, PXP, QEP), Avalon (CHK, CXO, DVN) and Bakken (BEXP, CLR, DNR, EOG, HES, NFX, OAS, WLL and others). The Granite Wash and Bakken have been hit with severe service cost inflation due to increased drilling and frac intensity.

$52.11$54.08 $55.01 $55.48 $55.83

$59.23$62.82 $64.44 $64.55 $66.53 $66.80 $67.38 $69.42 $69.49 $72.53 $73.05 $74.49

$78.13

$0

$10

$20

$30

$40

$50

$60

$70

$80

$90

Yeso Vertical

Bakken

 Parshall Sanish

Mon

umen

t Butte Vertical

TX Bon

e Sprin

g

Central Basin Platform Vertical

Colony Granite W

ash

Eagle Ford Oil

Wolfbon

e Vertical

Wasatch Vertical Uinta

NM Bon

e Sprin

g

Mississippi Lim

e

Eagle Ford Con

densate

Sprabe

rry Vertical

DJ N

iobrara Wattenb

erg

DJ N

iobrara 

Bakken


Avalon

Panh

andle Granite W

ash

Half Cycle Threshold Price (10% ATROR) First Mover ($500/acre + G&A) New Entrant ($2,500/acre + G&A)

5

Threshold Prices Summary (continued)

U.S. Liquids-Rich Threshold Price Required for 10% and 20% ATROR (in WTI $/bbl) Note: Bar Chart represents threshold price at 10% ATROR and Red Line represents threshold price at 20% ATROR

Source: Company Filings, HPDI and Simmons & Company Estimates.

Half-Cycle Analysis: The above table illustrates the threshold WTI price necessary to generate a 10% ATROR on half cycle economics (illustrated in the blue columns) while the red line illustrates the threshold price at a 20% ATROR. We thought it was useful to illustrate a 20% ATROR as many producers have internal targets of 15-25%, so activity could slow prior to reaching the 10% threshold. The red line is not linearly correlated as some of the plays are more levered to oil versus plays having a large mix of gas/NGLs. Hence, the “gassier” plays need a much higher crude oil price to reach the 20% ATROR. Most Attractive Plays on a Half Cycle Basis: Based on an analysis of the WTI price necessary to generate a 10% ATROR, the three lowest threshold price plays (with companies exposed) are the Colony Granite Wash (CHK), Yeso Vertical (APA, CXO) and the Parshall/Sanish Bakken (EOG, WLL). These three plays have on average a ~$44/bbl WTI half cycle economic threshold price. However, when you analyze the prices necessary for a 20%

ATROR, the Colony Granite Wash does not look as attractive, given the larger gas/NGL cut relative to the other lower cost plays which are more oil-weighted. Least Attractive Plays on a Half Cycle Basis: The three highest threshold price plays (with companies exposed) are similar to Full-Cycle with Bakken and Panhandle Granite Wash, but now include the Spraberry Vertical (APA, CXO, PXD). The Spraberry has not been immune from cost inflation as this has been an area of rapid rig growth in the last year.

$43.16 $43.30 $44.13 $44.75 $45.59 $45.74 $48.45 $51.22 $51.53 $53.31 $53.83 $54.77 $55.78 $57.01 $59.30 $59.67 $60.41 $62.86

$0

$10

$20

$30

$40

$50

$60

$70

$80

$90

$100

Colony Granite W

ash

Yeso Vertical

Bakken

 Parshall Sanish

Mon

ument B

utte Vertical

Central Basin Platform 

Vertical

TX Bon

e Sprin

g

Mississippi Lime

Wattenb

erg Niobrara

Eagle Ford Con

densate

Eagle Ford Oil

Wasatch Vertical Uinta

Wolfbon

e Vertical

NM Bon

e Sprin

g

Avalon

DJ N

iobrara 

Spraberry Vertical

Panh

andle Granite W

ash

Bakken


6

Threshold Prices Summary (continued)

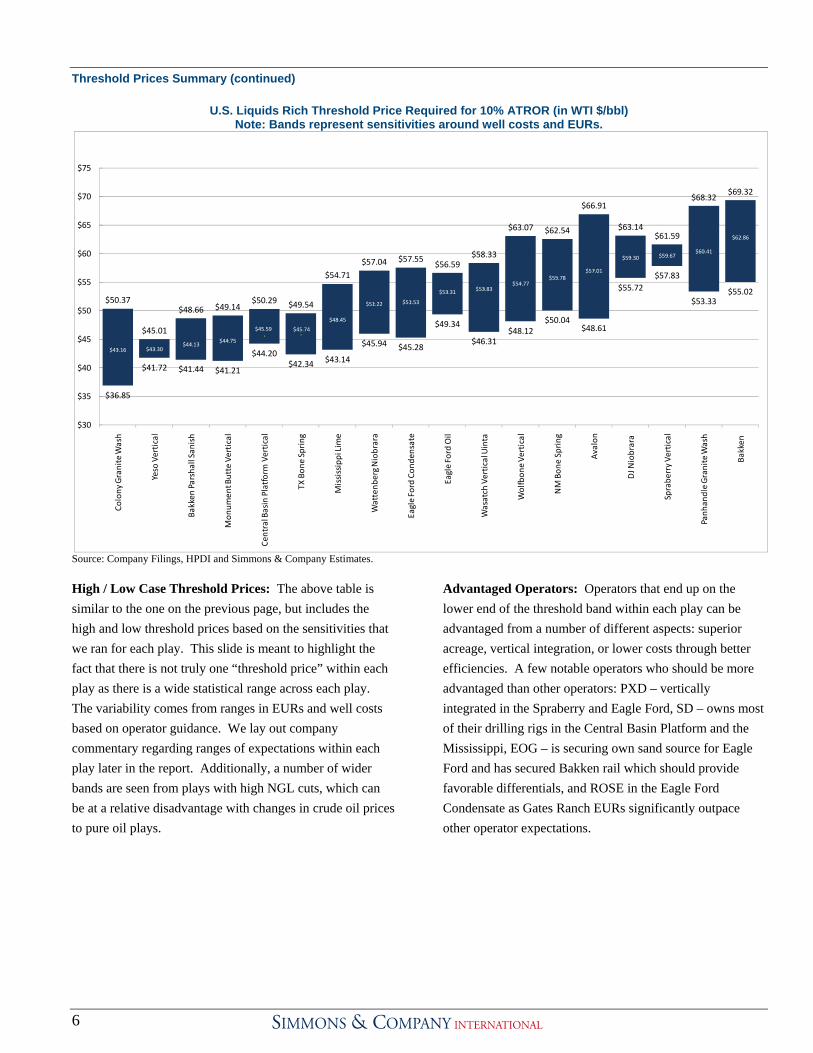
U.S. Liquids Rich Threshold Price Required for 10% ATROR (in WTI $/bbl) Note: Bands represent sensitivities around well costs and EURs.

Source: Company Filings, HPDI and Simmons & Company Estimates.

High / Low Case Threshold Prices: The above table is similar to the one on the previous page, but includes the high and low threshold prices based on the sensitivities that we ran for each play. This slide is meant to highlight the fact that there is not truly one “threshold price” within each play as there is a wide statistical range across each play. The variability comes from ranges in EURs and well costs based on operator guidance. We lay out company commentary regarding ranges of expectations within each play later in the report. Additionally, a number of wider bands are seen from plays with high NGL cuts, which can be at a relative disadvantage with changes in crude oil prices to pure oil plays.

Advantaged Operators: Operators that end up on the lower end of the threshold band within each play can be advantaged from a number of different aspects: superior acreage, vertical integration, or lower costs through better efficiencies. A few notable operators who should be more advantaged than other operators: PXD – vertically integrated in the Spraberry and Eagle Ford, SD – owns most of their drilling rigs in the Central Basin Platform and the Mississippi, EOG – is securing own sand source for Eagle Ford and has secured Bakken rail which should provide favorable differentials, and ROSE in the Eagle Ford Condensate as Gates Ranch EURs significantly outpace other operator expectations.

$50.37

$45.01

$48.66 $49.14$50.29 $49.54

$54.71

$57.04 $57.55$56.59

$58.33

$63.07 $62.54

$66.91

$63.14$61.59

$68.32$69.32

$36.85

$41.72 $41.44 $41.21

$44.20$42.34 $43.14

$45.94 $45.28

$49.34

$46.31$48.12

$50.04$48.61

$55.72$57.83

$53.33$55.02

$43.16 $43.30$44.13

$44.75

$45.59 $45.74

$48.45

$51.22 $51.53

$53.31 $53.83$54.77

$55.78$57.01

$59.30 $59.67$60.41

$62.86

$30

$35

$40

$45

$50

$55

$60

$65

$70

$75

Colony

 Granite Wash

Yeso Vertical

Bakken

 Parshall San

ish

Mon

umen

t Butte Vertical

Central Basin Platform Vertical

TX Bon

e Spring

Mississippi Lime

Wattenb

erg Niobrara

Eagle Ford Con

densate

Eagle Ford Oil

Wasatch Vertical Uinta

Wolfbon

e Ve

rtical

NM Bon

e Spring

Avalon

DJ N

iobrara 

Sprabe

rry Ve

rtical

Panh

andle Granite Wash

Bakken


7

Threshold Prices Summary (continued)

U.S. Liquids Rich Well Rates of Return at $85/bbl WTI and $4.50/Mcf Natural Gas

Source: Company Filings, HPDI and Simmons & Company Estimates.

Flat Price Analysis: The above chart illustrates the half-cycle rates of return at $85/bbl WTI and $4.50/Mcf natural gas, which is close to current commodity prices. While our natural gas assumption is a bit higher than current spot of ~$4/Mcf, it is not a huge driver to this exercise given the oil-weighted nature of these plays. As seen in this chart, the range of ATRORs is from 17%-86% with a rig-weighted average return at ~30% (based on current rig activity). NGL Heavy Plays Relatively Disadvantaged: The true oil plays are more advantaged as compared to plays that have a higher NGL/natural gas product mix. A specific example of this is the Eagle Ford, as the condensate window had a slightly lower threshold price ($52/bbl) as compared to the oil window ($53/bbl), but at an increased price deck the stronger margins from oil vs. NGLs drives the Eagle Ford Oil returns to 37% at $85/bbl, whereas the Eagle Ford Condensate is only 25%

Bakken Economics: While more recent commentary has been forthcoming regarding challenging economics in the play given increased service costs and decreased oil prices, our analysis confirms the NFX commentary that current rates of return in the Bakken are 20-30%. Conventional Vertical Plays Advantaged: Given the vast increase in horizontal oil drilling and rising frac intensity on a per well basis, conventional vertical wells have been less susceptible to service cost inflation relative to horizontal plays. That being said, the running room in many of these plays (Yeso, Monument Butte, Central Basin Platform) is challenged when compared to the prospects of the Bakken, Eagle Ford, and Horizontal Permian plays, so we do not expect to see a huge swing in drilling activity, but would expect this disparity to continue, if not widen, moving forward.

17%22% 22% 25% 25% 27% 27% 28% 29% 30%

35% 37%

48% 49% 49%53%

69%

86%

0%

10%

20%

30%

40%

50%

60%

70%

80%

90%Panh

andle Granite Wash

Spraberry Vertical

Avalon

Bakken

Eagle Ford Con

densate

Wattenb

erg Niobrara

DJ N

iobrara

Mississippi Lime

NM Bon

e Spring

Colony

 Granite Wash

Wasatch Vertical Uinta

Eagle Ford Oil

TX Bon

e Spring

Bakken

 Parshall Sanish

Wolfbon

e Vertical

Central Basin Platform 

Vertical

Mon

ument Butte Vertical

Yeso Vertical

ATRO

R at $85

 WTI

ATROR (%) Rig‐Weighted ATROR (%)

8

Threshold Economics vs. Rig Count Threshold Economics vs. Rig Count: We have compiled the current rigs working in the 18 liquids-focused plays that we are highlighting in this report. We have overlaid the threshold WTI price to come up with a “rig dispatch” snapshot that shows the number of working rigs that could be laid down should prices move below a particular threshold point for an extended period of time. While we have already mentioned several factors that can abnormally effect rig count for a certain period of time (JVs, need to hold acreage, balance sheet/hedging and change in service costs), in general, we believe the rig count will follow the laws of threshold economics over time. Again as we pointed out previously, there are better/worse areas of each play, more advantaged operators (vertically integrated, balance sheet, etc.), and potentially a wide range of threshold prices within each play. In an effort to capture some of this variability of EURs and well costs within each play, we attributed a $10/bbl band around each play’s full-cycle threshold price, and then evenly allocated the rigs in each play across the ten $1/bbl increments within their respective band. For plays with less than 10 rigs running, we narrowed the band. As an example, we estimate the Bakken (non Parshall/Sanish) rig count at ~175 rigs and believe the play currently has a $73/bbl full cycle threshold price on average. So across the range of $68-$78/bbl we evenly allocated the rigs to each $1/bbl increment, which resulted in ~17 rigs per increment. After implementing this process across each play, the group was aggregated within broader $5/bbl ranges.

It total, the 18 plays we modeled account for 675 rigs currently running, or ~70% of the current liquids rich rig count currently running in the L48 (oil rig count is ~900 rigs + ~100 rigs classified as gas but in liquids-driven plays). The results of the rig dispatch analysis have some interesting takeaways. The most glaring takeaway is that while our full cycle analysis yields 10 plays that have threshold prices at $65/bbl or below, we estimate that only 30% of the total rig count in all our plays would be running sub-$65/bbl. A few reasons for this anomaly: 1) scale – some of the most economic plays in our estimate do not have the size or running room left to garner a larger attention from the rig count. 2) vertical activity – some of the most economic plays are conventional vertical plays that have been more immune to severe cost inflation on completions. These plays tend to have faster cycle times, so an incremental rig has a more meaningful impact in well count, and more importantly – most operators in these plays are already running as fast as they can in these plays. The second key takeaway from this graph is that ~55% of the rig count is running in the $65-$75/bbl threshold price range, which is comprised mostly of the Bakken, Eagle Ford, Spraberry, and Mississippi Lime. This leads us to believe that should service costs remain static and WTI prices fall below $70/bbl, we would expect to see a meaningful reduction in the rig count.

9

Threshold Economics vs. Rig Count (continued) However, there are likely a few plays that are immune to rig cuts in the near term, largely the Eagle Ford and Bakken, which combined make up ~350 rigs in total. The reason we do not foresee a meaningful retreat in the Eagle Ford rig count is due primarily to JVs (CHK/CNOOC, PXD/Reliance, APC/KNOC) which support a large portion of drilling, and the need to hold acreage, as many large operators (COP, EOG HES, MUR, MRO, RDS, STO, TLM) have made significant investments and have the balance sheet to retain the acreage at any crude price. Additionally in the Bakken, while not fueled by JV dollars, operators still

have a couple years left to hold their acreage. Overall, should crude prices pull back to the $70-$75/bbl range, we believe we would see a marginal impact in the Eagle Ford (if any), and it would likely have a moderate affect on the Bakken rig count (~10%-20%). For the graph below, the bar for each WTI price represents the number of rigs that would theoretically become uneconomic at that price point. For example, we estimate 91 rigs running in the $75-$80/bbl range; as crude drops “sub $75/bbl”, those 91 rigs come at risk.

U.S. Rigs at Risk at Various WTI Prices

Source: HPDI and Simmons & Company Estimates.

2

41

66

98

183

182

91

12

0 20 40 60 80 100 120 140 160 180 200

Sub $45/bbl

Sub $50/bbl

Sub $55/bbl

Sub $60/bbl

Sub $65/bbl

Sub $70/bbl

Sub $75/bbl

Sub $80/bbl

Rigs

10

Limitations of Threshold Economics Threshold Prices Are Not Representative for All Cases: Our analysis suggests there are numerous plays that can generate a 10% ATROR on full cycle economics at prices in the $50/bbl WTI range. While we do believe the lower threshold plays would be more price resilient, we hesitate to say none of these plays would experience lower rig count should prices drop to $50/bbl, as that would not be realistic. First, our analysis is based on average play economics, which is an attempt to reflect the best and worst wells in the play. As such, it might be more instructive to focus on the range of threshold prices for each play (see page 6), which suggests that the threshold prices from low to high within a play could have a range of $5/bbl to $20/bbl. Second, our “full-cycle” analysis is not inclusive of all costs producers may have, including midstream, seismic, interest expenses to name a few examples; thus an absolute full cost threshold is likely higher than our “full cycle” threshold price. Third, each producer has an individual set of circumstances that could cause them to be more or less sensitive to threshold prices. This could be based on asset diversity, the need to hold acreage, hedging, balance sheet strength, liquidity, long term service contracts or a number of other circumstances. Hedging Can Limit the Utility of Threshold Prices: If a producer is more hedged, then threshold prices may be less relevant to their drilling plans. The hedges essentially can make their drilling plans “stickier” especially where the producer might be attempting to hold acreage by production. In a higher cost play such as the Bakken or Eagle Ford, if small cap producers are not adequately hedged then threshold economics will be especially relevant to their drilling plans. However, well hedged (and especially larger capitalization companies) are more likely to continue drilling (at least for a while) even if WTI prices move beyond a certain threshold.

2012 U.S. Oil Hedge Profile for Liquids Producers

Source: HPDI and Simmons & Company Estimates.

Threshold Economics and Our Coverage Universe: As we have previously highlighted, we believe drilling decisions will not simply be governed by long-term return economics but also by corporate financial capacity. More specifically, while our coverage universe appears to have ample dry powder with greater than $45 B in available liquidity (cash and undrawn credit facilities) as of 2Q’11, our projections highlight that current spending projections will cause E&P’s to 1). Reduce their liquidity. 2). Increase their leverage. 3) Potentially degrade return on capital employed in the future. Focusing on Liquidity: Based on company projections for capital spending, acquisitions and divestitures for 2H’11, we estimate that our coverage universe will outspend discretionary cash flow (DCF) by ~$7 B in 2H’11, leaving them with just under $39 B in available liquidity at YE’11. Looking toward 2012, based on a combination of SCI’s initial estimates for capital spending, acquisitions and divestitures, we anticipate that our coverage universe will outspend DCF by almost $17 B, which would leave the group with available liquidity of $22 B. However, this does not reflect all potential divestitures / JV proceeds or the fact that current borrowing bases will likely get revised higher over that time (assuming crude does not collapse).

Company Oil Hedging 2012E Mkt Cap (SMM)

Denbury Resources (DNR) 79% $5,869Rosetta Resources (ROSE) 77% $2,298Noble Energy (NBL) 77% $15,006Pioneer Natural Resources (PXD) 75% $8,833Newfield Exploration (NFX) 73% $6,525Plains Expl & Prod Co. (PXP) 69% $3,946SandRidge Energy (SD) 67% $3,323Continental Resources, Inc. (CLR) 65% $15,131Devon Energy (DVN) 58% $27,436Concho Resources, Inc. (CXO) 54% $8,673Stone Energy (SGY) 47% $1,140Bill Barrett Corp. (BBG) 37% $2,133Whiting Petroleum (WLL) 34% $5,330Goodrich Petroleum (GDP) 34% $553Oasis Petroleum (OAS) 26% $2,240Apache (APA) 23% $39,913Forest Oil (FST) 21% $2,024EOG Resources (EOG) 5% $24,218Chesapeake Energy (CHK) 3% $22,665Anadarko Petroleum (APC) 1% $34,360 Peer Group Total/Average 46%

11

Limitations of Threshold Economics (continued) Accordingly, liquidity at YE’12 is likely higher. Nonetheless, it does appear companies would become more stretched financially if they do not scale back their 2012 capex. While the borrowing bases will likely expand and thus provide additional firepower for capital spending, this could come at the price of encumbered balance sheets with considerably more debt. Looking at our estimates for D/TC at YE’11, our universe is likely to witness expanding ratios driven by their unquenchable appetite to continue to grow production. Based on current projects we estimate D/TC will expand to 43% at YE’11 and 45% at YE’12.

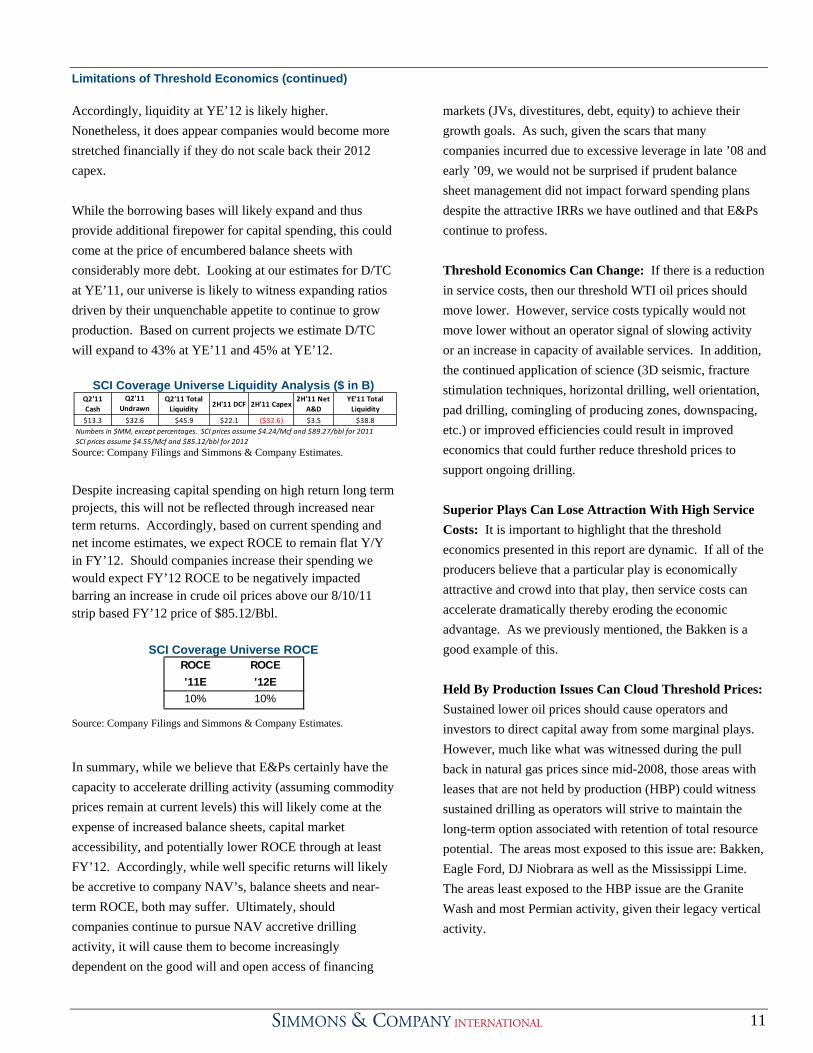
SCI Coverage Universe Liquidity Analysis ($ in B)

Source: Company Filings and Simmons & Company Estimates. Despite increasing capital spending on high return long term projects, this will not be reflected through increased near term returns. Accordingly, based on current spending and net income estimates, we expect ROCE to remain flat Y/Y in FY’12. Should companies increase their spending we would expect FY’12 ROCE to be negatively impacted barring an increase in crude oil prices above our 8/10/11 strip based FY’12 price of $85.12/Bbl.

SCI Coverage Universe ROCE

Source: Company Filings and Simmons & Company Estimates.

In summary, while we believe that E&Ps certainly have the capacity to accelerate drilling activity (assuming commodity prices remain at current levels) this will likely come at the expense of increased balance sheets, capital market accessibility, and potentially lower ROCE through at least FY’12. Accordingly, while well specific returns will likely be accretive to company NAV’s, balance sheets and near-term ROCE, both may suffer. Ultimately, should companies continue to pursue NAV accretive drilling activity, it will cause them to become increasingly dependent on the good will and open access of financing

markets (JVs, divestitures, debt, equity) to achieve their growth goals. As such, given the scars that many companies incurred due to excessive leverage in late ’08 and early ’09, we would not be surprised if prudent balance sheet management did not impact forward spending plans despite the attractive IRRs we have outlined and that E&Ps continue to profess. Threshold Economics Can Change: If there is a reduction in service costs, then our threshold WTI oil prices should move lower. However, service costs typically would not move lower without an operator signal of slowing activity or an increase in capacity of available services. In addition, the continued application of science (3D seismic, fracture stimulation techniques, horizontal drilling, well orientation, pad drilling, comingling of producing zones, downspacing, etc.) or improved efficiencies could result in improved economics that could further reduce threshold prices to support ongoing drilling. Superior Plays Can Lose Attraction With High Service Costs: It is important to highlight that the threshold economics presented in this report are dynamic. If all of the producers believe that a particular play is economically attractive and crowd into that play, then service costs can accelerate dramatically thereby eroding the economic advantage. As we previously mentioned, the Bakken is a good example of this. Held By Production Issues Can Cloud Threshold Prices: Sustained lower oil prices should cause operators and investors to direct capital away from some marginal plays. However, much like what was witnessed during the pull back in natural gas prices since mid-2008, those areas with leases that are not held by production (HBP) could witness sustained drilling as operators will strive to maintain the long-term option associated with retention of total resource potential. The areas most exposed to this issue are: Bakken, Eagle Ford, DJ Niobrara as well as the Mississippi Lime. The areas least exposed to the HBP issue are the Granite Wash and most Permian activity, given their legacy vertical activity.

Q2'11 Cash 

Q2'11 Undrawn 

Q2'11 Total Liquidity

2H'11 DCF 2H'11 Capex2H'11 Net 

A&DYE'11 Total Liquidity

$13.3 $32.6 $45.9 $22.1 ($32.6) $3.5 $38.8Numbers in $MM, except percentages.  SCI prices assume $4.24/Mcf and $89.27/bbl for 2011SCI prices assume $4.55/Mcf and $85.12/bbl for 2012

ROCE ROCE'11E '12E10% 10%

12

Limitations of Threshold Economics (continued)

Important Disclaimer: The threshold economics presented in this report are based on our model which takes inputs from various sources (HPDI, E&P’s and others). In addition, we do our best “smell test” to try to insure that both the inputs and outputs from our models are sensible. Inevitably the results from this process can lead to disenchantment from some producers who suggest that their well economics in a particular play are better than what is represented in this report. We fully expect these discrepancies to arise. However, it is important to note that we are illustrating average well results across an entire play rather than just one producer’s well results. As such, it is useful to focus on our graph on page 6 that details the high and low threshold price bands based upon the sensitivities that we ran, along with the individual play sensitivities on each play’s breakout page. This should help explain a large measure of the discrepancy a producer might have between their well results in a particular play and the play economics highlighted in this report

13

Emerging Oil Plays There are a number of plays from which we have limited or no well results. Thus, we thought it was premature to include them in our threshold oil price analysis until we have a better data set. However, we did build threshold economics models around the limited company provided data to back into what production makes these plays commercially viable.

Alberta Bakken: Armed only with vertical results, ROSE has released their initial horizontal expectations of 185 Mboe EURs at a cost of $4 MM per well, but current well costs are running $6.5-$7 MM per well. The company estimates pre-tax IRRs at 21% at $85/bbl, and that is assuming only $4 MM well costs. We estimate a 10% ATROR at ~$70/bbl with $4 MM well costs. If one were to assume the company could drive costs down to $5.5 MM per well, then the breakeven price would move to $90/bbl, but assuming current well costs of $6.5 MM per well, break even prices are ~$105/bbl. This is still an embryonic play, but early indications are not particularly encouraging as ROSE’s initial estimates would leave this play at the higher end of the cost curve. Future datapoints are likely to come from NFX for 2 horizontal wells they have yet to release. Players exposed to the U.S. side of the Alberta Bakken play: KWK, NFX, and ROSE.

Lower Smackover Brown Dense: On their 2Q call, SWN announced a 460k acre position in this emerging play. The company expects to have 2 horizontal wells drilled and completed by year end, and the potential to drill up to 10 additional wells in 2012. The company estimates well costs will run ~$7-$8 MM per well. At $80/bbl, we estimate SWN needs to deliver IPs >500 Boe/d, with EURs of ~300 Mboe in order to generate a 10% ATROR. While SWN has discussed some historic EOG wells and DVN has some exposure, SWN is currently the only public player actively discussing plans to drill horizontal tests.

Tuscaloosa Marine Shale: The Tuscaloosa Marine Shale is not a new target, as EAC drilled a horizontal several years ago when oil was >$100/bbl, but a large multistage frac had not been completed until recently. Many are skeptical of the play given its depth (11,000-14,000 ft) and high well costs

($8-$12 MM). ECAs’ recent Board of Education 1H well had a 24 hr IP of 534 Bo/d and was frac’d with 10 stages. ECA estimates drill and complete costs (CWC) of $8 MM, while DVN estimates well costs of $10-$12 MM. At a $10 MM CWC, IPs would need to be 600-700+ Boed with an EUR of 400-500 Mboe to achieve a 10% ATROR in an $80/bbl scenario. Other players with Tuscaloosa Marine Shale exposure: DNR and GDP. Uteland Butte: BBG and NFX have both released encouraging commentary on the horizontal potential in the Uteland Butte formation in Utah. BBG’s first well had a 30-day IP of 717 Boe/d, and NFX has had recent 24-hr IPs of 500 Boe/d. NFX released estimated EURs of 300 Mboe at a well cost of $2.8 MM per well. Based on NFX’s initial well assumptions, we estimate the Uteland Butte would be at the low end of the cost curve with a threshold price necessary to generate a 10% ATROR in the $40-$45/bbl range (assumes a 20% crude differential). Utica: Based on commentary that the Utica is an “Eagle Ford” look alike but in a more favorable pricing region, and GPOR’s best estimates ($6 MM CWC and 455-910 Mboe EURs), the Utica would have a $55/bbl threshold price for a 10% ATROR at the midpoint, but has a range of $40-$85/bbl given the wide EUR range. It remains too early to estimate the commerciality of the Utica and we await well results from CHK’s active drilling program. Other players with Utica exposure: DVN, EVEP, and GPOR. Permian Horizontal Wolfcamp Shale: Operators are currently testing the Wolfcamp horizontally in both the Midland Basin and Delaware Basin in the Permian. We have had only a handful of well results from operators to date and results have been mixed. However, EOG released encouraging commentary on their 2Q call regarding the potential the play has. EOG estimate EUR of 270 Mboe/well (42% oil, 30% NGL) with $5.5 MM well costs. We calculate a threshold price of ~$85/bbl at these assumptions, but assumed based on EOG’s commentary, their EUR estimates will be moving higher. Approach Resources estimates EURs of 450 Mboe. Threshold prices would be $52/bbl if this held true.

14

Bakken

The Bakken represented in this analysis is located only in North Dakota and Montana (excludes Canada), and we excluded the Parshall/Sanish fields as we broke those out separately. We based our type curves on all horizontal Bakken wells (outside of Parshall/Sanish) drilled in the last three years to generate the shape of our type curve, and then plugged in 2010 actual average IPs to generate our EUR. The Bakken has one of the highest threshold economics of any play in our analysis at ~$63/bbl WTI (range: $69-$55/bbl) on half cycle economics at a 10% ATROR. The play requires a ~$73/bbl WTI price to generate a 10% ATROR on full cycle economics. Both of these scenarios are based on gas at $4.50/Mcf. Some might be surprised with the poor relative well economics, but this has been driven primarily by intense service cost inflation.

Key Assumptions/Threshold Price on Half Cycle Basis

Source: Company Filings, HPDI and Simmons & Company Estimates.

Producer Disclosed EURs and Well Costs

Source: Company Filings.

Bakken Type Curve

NPV

Sources: HPDI and Simmons & Company Estimates.

AssumptionsBakken ex‐Parshall 

Sanish

Well Cost ($MM) $9.0EUR Per Well (Mboe) 450.0

Implied F&D Cost ($/boe) $25.0030‐Day IP Rate (boe/d) 713.0

Production Costs ($/boe) $8.00Production Taxes ($/boe) 11%

1st Year Decline (%) ‐75%2nd Year Decline (%) ‐43%3rd Year Decline (%) ‐32%

Well % Oil 86%Oil Diff to WTI (%) ‐10%

Well % NGLs 8%Well % Gas 6%

Threshold Oil Price Necessary for 10% ATROR $62.8615% ATROR $71.4820% ATROR $78.9225% ATROR $85.53

Operator EUR (Mboe) Well Cost ($ in MMs)BEXP 600 8.9CLR 603 8.0DNR 504 7.5EOG 362 8.0GEOI 425 8.0HES 550 10.0MRO 463 7.0NFX 504 8.5OAS 589 8.8QEP 520 7.8WLL 400 6.0

Average 502 8.0

0

100

200

300

400

500

600

700

800

1 11 21 31 41 51 61 71 81 91 101

111

121

131

141

151

161

171

181

191

201

211

221

231

241

251

261

271

281

291

301

311

321

331

341

351

361

Average

 Daily Produ

ction (Boe

/d)

Months

‐$10,000

‐$8,000

‐$6,000

‐$4,000

‐$2,000

$0

$2,000

0 5 10 15 20 25 30 35 40 45 50 55 60 65 70 75 80 85 90 95 100

105

110

115

Project N

PV ($

MM)

Month

15

Half-Cycle Sensitivities

Sensitivity 1&2: Threshold WTI Oil Price at Various EURs and Well Costs

Sensitivity 3&4: ATROR at Various WTI Oil Prices and EURs

Source: Company Filings, HPDI and Simmons & Company Estimates.

ATROR at Various Well Costs

Source: HPDI and Simmons & Company Estimates.

ATROR at Various EURs

Source: HPDI and Simmons & Company Estimates.

8.2 8.5 8.7 9.0 9.4 9.8 10.2350 $71.58 $73.47 $75.43 $77.39 $80.30 $83.20 $86.11384 $66.30 $68.03 $69.81 $71.60 $74.25 $76.90 $79.55417 $62.01 $63.59 $65.24 $66.88 $69.32 $71.76 $74.20450 $58.34 $59.81 $61.33 $62.86 $65.12 $67.38 $69.64516 $52.41 $53.69 $55.02 $56.36 $58.33 $60.30 $62.27582 $47.83 $48.97 $50.15 $51.33 $53.07 $54.82 $56.57650 $44.08 $45.10 $46.16 $47.21 $48.78 $50.34 $51.91

EUR (M

boe)

WELL COST ($MM)

Key Assumptions: 86% Oil, 6% Gas, 8% NGLs , Gas $4.5/mcf, NGLs 45% of WTI

8.2 8.5 8.7 9.0 9.4 9.8 10.2563 $70.69 $72.55 $74.48 $76.41 $79.27 $82.14 $85.00613 $65.90 $67.61 $69.38 $71.16 $73.79 $76.41 $79.04663 $61.83 $63.41 $65.05 $66.70 $69.13 $71.56 $73.99713 $58.34 $59.81 $61.33 $62.86 $65.12 $67.38 $69.64813 $52.64 $53.93 $55.27 $56.60 $58.59 $60.57 $62.55913 $48.19 $49.34 $50.53 $51.72 $53.48 $55.25 $57.011013 $44.62 $45.65 $46.72 $47.80 $49.39 $50.98 $52.5730

‐Day

 IP Rate (boe

)

WELL COST ($MM)

Key Assumptions: 86% Oil, 6% Gas, 8% NGLs , Gas $4.5/mcf, NGLs 45% of WTI

8.2 8.5 8.7 9.0 9.4 9.8 10.250 5.1% 4.3% 3.5% 2.8% 1.8% 1.0% 0.2%60 11.0% 10.1% 9.3% 8.5% 7.5% 6.6% 5.6%70 17.7% 16.4% 15.2% 14.1% 12.6% 11.3% 10.2%80 25.9% 24.1% 22.3% 20.8% 18.7% 16.9% 15.3%90 35.6% 33.1% 30.8% 28.7% 25.9% 23.5% 21.4%100 46.9% 43.7% 40.6% 37.9% 34.3% 31.2% 28.4%110 59.9% 55.8% 51.9% 48.5% 43.9% 39.9% 36.4%Key Assumptions: 86% Oil, 6% Gas, 8% NGLs , Gas $4.5/mcf, NGLs 45% of WTI ,450 MBOE EUR

NYM

EX Price 

($/boe

)

WELL COST ($MM)

350 384 417 450 516 582 65050 (1.8%) (0.4%) 1.1% 2.8% 6.4% 9.1% 12.2%60 2.4% 4.6% 6.8% 8.5% 12.3% 16.7% 21.8%70 7.1% 9.3% 11.6% 14.1% 19.7% 26.2% 33.9%80 11.1% 14.1% 17.3% 20.8% 28.7% 37.8% 48.7%90 15.8% 19.7% 24.0% 28.7% 39.3% 51.8% 66.6%100 21.1% 26.3% 31.8% 37.9% 51.8% 68.2% 87.9%110 27.2% 33.7% 40.7% 48.5% 66.2% 87.3% 113.1%Key Assumptions: 86% Oil, 6% Gas, 8% NGLs , Gas $4.5/mcf, NGLs 45% of WTI , $9 MM Well Cost

EUR (Mboe)

NYM

EX Price 

($/boe

)

0.0% 

10.0% 

20.0% 

30.0% 

40.0% 

50.0% 

60.0% 

70.0% 

$50.00 $60.00 $70.00 $80.00 $90.00 $100.00 $110.00

ATIRR

 (%)

NYMEX WTI Price ($/bbl)

8.2

8.5

8.7

9.0

9.4

9.8

10.2

(20.0%)

0.0% 

20.0% 

40.0% 

60.0% 

80.0% 

100.0% 

120.0% 

$50.00 $60.00 $70.00 $80.00 $90.00 $100.00 $110.00

ATIRR

 (%)

NYMEX WTI Price ($/bbl)

350

384

417

450

516

582

650

16

Bakken Parshall Sanish Parshall and Sanish fields in the Bakken we view as the core of the Bakken play and are located in Mountrail County, North Dakota. This play has some of the best economics in our analysis of 18 liquids-focused plays. This play requires ~$44/bbl WTI (range: $49-$41/bbl) in order to generate a 10% ATROR on half cycle economics. In order to achieve a 10% ATROR on full cycle economics, this play requires ~$54/bbl WTI. Both of these scenarios are based on gas at $4.50/Mcf.

Key Assumptions/Threshold Price on Half Cycle Basis

Source: Company Filings, HPDI and Simmons & Company Estimates.

Producer Disclosed EURs and Well Costs

Source: Company Filings.

Type Curve

Source: HPDI and Simmons & Company Estimates.

NPV

Source: HPDI and Simmons & Company Estimates.

Assumptions Bakken Parshall Sanish

Well Cost ($MM) $7.3EUR Per Well (Mboe) 784.0

Implied F&D Cost ($/boe) $11.6930‐Day IP Rate (boe/d) 731.5

Production Costs ($/boe) $8.00Production Taxes ($/boe) 11%

1st Year Decline (%) ‐71%2nd Year Decline (%) ‐34%3rd Year Decline (%) ‐23%

Well % Oil 86%Oil Diff to WTI (%) ‐10%

Well % NGLs 8%Well % Gas 6%

Threshold Oil Price Necessary for 10% ATROR $44.1315% ATROR $51.5920% ATROR $58.0625% ATROR $63.79

Operator EUR (Mboe) Well Cost ($ in MMs)EOG 914 6.0WLL 700 5.5

Average 807 5.8

0

100

200

300

400

500

600

700

800

1 11 21 31 41 51 61 71 81 9110

111

112

113

114

115

116

117

118

119

120

121

122

123

124

125

126

127

128

129

130

131

132

133

134

135

136

1

Average

 Daily Produ

ction (Boe

/d)

Months

‐$8,000

‐$6,000

‐$4,000

‐$2,000

$0

$2,000

$4,000

$6,000

0 5 10 15 20 25 30 35 40 45 50 55 60 65 70 75 80 85 90 95 100

105

110

115

Project N

PV ($

MM)

Month

17

Half-Cycle Sensitivities

Sensitivity 1&2: Threshold WTI Oil Price at Various EURs and Well Costs

Sensitivity 3&4: ATROR at Various WTI Oil Prices and EURs

Source: Company Filings, HPDI and Simmons & Company Estimates.

.

ATROR at Various Well Costs

Source: HPDI and Simmons & Company Estimates.

ATROR at Various EURs

Source: HPDI and Simmons & Company Estimates.

6.3 6.7 7.0 7.3 7.7 8.0 8.3584 $49.25 $51.25 $53.19 $55.13 $57.08 $59.02 $61.02652 $45.36 $47.16 $48.90 $50.64 $52.37 $54.11 $55.91718 $42.30 $43.93 $45.50 $47.08 $48.66 $50.24 $51.87784 $39.75 $41.24 $42.68 $44.13 $45.58 $47.02 $48.51817 $38.63 $40.06 $41.44 $42.83 $44.22 $45.61 $47.04850 $37.59 $38.97 $40.30 $41.64 $42.97 $44.30 $45.68884 $36.61 $37.93 $39.21 $40.50 $41.78 $43.06 $44.38

WELL COST ($MM)

EUR (M

boe)

Key Assumptions: 86% Oil, 6% Gas, 8% NGLs , Gas $4.5/mcf, NGLs 45% of WTI

6.3 6.7 7.0 7.3 7.7 8.0 8.3642 $43.64 $45.34 $46.99 $48.64 $50.29 $51.94 $53.64672 $42.23 $43.85 $45.43 $47.00 $48.58 $50.15 $51.78702 $40.93 $42.49 $44.00 $45.50 $47.01 $48.52 $50.08732 $39.75 $41.24 $42.68 $44.13 $45.58 $47.02 $48.51762 $38.65 $40.09 $41.48 $42.86 $44.25 $45.64 $47.08792 $37.64 $39.02 $40.36 $41.70 $43.03 $44.37 $45.75822 $36.71 $38.03 $39.32 $40.61 $41.90 $43.19 $44.51

WELL COST ($MM)

IP Rate (boe

)

Key Assumptions: 86% Oil, 6% Gas, 8% NGLs , Gas $4.5/mcf, NGLs 45% of WTI

6.3 6.7 7.0 7.3 7.7 8.0 8.350 18.3% 16.6% 15.1% 13.9% 12.7% 11.7% 10.8%60 28.6% 25.9% 23.6% 21.6% 19.9% 18.4% 17.0%70 41.3% 37.3% 34.0% 31.1% 28.5% 26.3% 24.3%80 56.7% 51.1% 46.4% 42.3% 38.8% 35.8% 33.0%90 75.1% 67.4% 61.1% 55.6% 50.9% 46.8% 43.1%100 97.0% 86.7% 78.3% 71.2% 65.0% 59.7% 54.8%110 122.9% 109.4% 98.5% 89.2% 81.3% 74.4% 68.3%

WELL COST ($MM)

NYM

EX Price 

($/boe

)

Key Assumptions: 86% Oil, 6% Gas, 8% NGLs , Gas $4.5/mcf, NGLs 45% of WTI ,784 MBOE EUR

584 652 718 784 817 850 88450 7.7% 9.7% 11.7% 13.9% 15.0% 16.2% 17.4%60 12.3% 15.2% 18.3% 21.6% 23.4% 25.2% 27.2%70 17.7% 21.8% 26.2% 31.1% 33.6% 36.3% 39.2%80 24.0% 29.6% 35.7% 42.3% 45.9% 49.7% 53.8%90 31.2% 38.6% 46.7% 55.6% 60.5% 65.6% 71.1%100 39.4% 49.0% 59.5% 71.2% 77.6% 84.3% 91.6%110 48.7% 60.8% 74.2% 89.2% 97.5% 106.2% 115.8%Key Assumptions: 86% Oil, 6% Gas, 8% NGLs , Gas $4.5/mcf, NGLs 45% of WTI , $7 MM Well Cost

EUR (Mboe)

NYM

EX Price 

($/boe

)

0.0% 

20.0% 

40.0% 

60.0% 

80.0% 

100.0% 

120.0% 

140.0% 

$50.00 $60.00 $70.00 $80.00 $90.00 $100.00 $110.00

ATIRR

 (%)

NYMEX WTI Price ($/bbl)

6.3

6.7

7.0

7.3

7.7

8.0

8.3

0.0% 

20.0% 

40.0% 

60.0% 

80.0% 

100.0% 

120.0% 

140.0% 

$50.00 $60.00 $70.00 $80.00 $90.00 $100.00 $110.00

ATIRR

 (%)

NYMEX WTI Price ($/bbl)

584

652

718

784

817

850

884

18

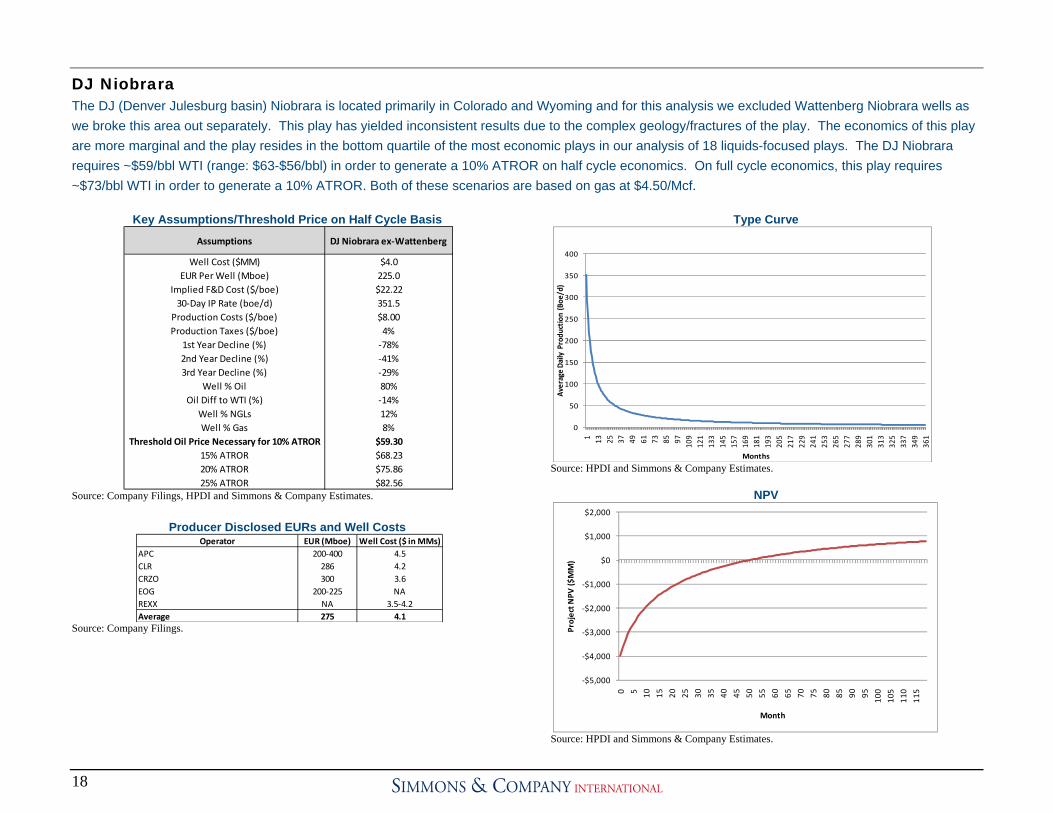
DJ Niobrara The DJ (Denver Julesburg basin) Niobrara is located primarily in Colorado and Wyoming and for this analysis we excluded Wattenberg Niobrara wells as we broke this area out separately. This play has yielded inconsistent results due to the complex geology/fractures of the play. The economics of this play are more marginal and the play resides in the bottom quartile of the most economic plays in our analysis of 18 liquids-focused plays. The DJ Niobrara requires ~$59/bbl WTI (range: $63-$56/bbl) in order to generate a 10% ATROR on half cycle economics. On full cycle economics, this play requires ~$73/bbl WTI in order to generate a 10% ATROR. Both of these scenarios are based on gas at $4.50/Mcf.

Key Assumptions/Threshold Price on Half Cycle Basis

Source: Company Filings, HPDI and Simmons & Company Estimates.

Producer Disclosed EURs and Well Costs

Source: Company Filings.

Type Curve

Source: HPDI and Simmons & Company Estimates.

NPV

Source: HPDI and Simmons & Company Estimates.

Assumptions DJ Niobrara ex‐Wattenberg

Well Cost ($MM) $4.0EUR Per Well (Mboe) 225.0

Implied F&D Cost ($/boe) $22.2230‐Day IP Rate (boe/d) 351.5

Production Costs ($/boe) $8.00Production Taxes ($/boe) 4%

1st Year Decline (%) ‐78%2nd Year Decline (%) ‐41%3rd Year Decline (%) ‐29%

Well % Oil 80%Oil Diff to WTI (%) ‐14%

Well % NGLs 12%Well % Gas 8%

Threshold Oil Price Necessary for 10% ATROR $59.3015% ATROR $68.2320% ATROR $75.8625% ATROR $82.56

Operator EUR (Mboe) Well Cost ($ in MMs)APC 200‐400 4.5CLR 286 4.2CRZO 300 3.6EOG 200‐225 NAREXX NA 3.5‐4.2Average 275 4.1

0

50

100

150

200

250

300

350

400

1 13 25 37 49 61 73 85 97 109

121

133

145

157

169

181

193

205

217

229

241

253

265

277

289

301

313

325

337

349

361

Average

 Daily Produ

ction (Boe

/d)

Months

‐$5,000

‐$4,000

‐$3,000

‐$2,000

‐$1,000

$0

$1,000

$2,000

0 5 10 15 20 25 30 35 40 45 50 55 60 65 70 75 80 85 90 95 100

105

110

115

Project N

PV ($

MM)

Month

19

Half-Cycle Sensitivities

Sensitivity 1&2: Threshold WTI Oil Price at Various EURs and Well Costs

Sensitivity 3&4: ATROR at Various WTI Oil Prices and EURs

Source: Company Filings, HPDI and Simmons & Company Estimates.

ATROR at Various Well Costs

Source: HPDI and Simmons & Company Estimates.

ATROR at Various EURs

Source: HPDI and Simmons & Company Estimates.

3.5 3.7 3.8 4.0 4.2 4.3 4.5200 $58.53 $61.01 $63.22 $65.42 $67.63 $69.83 $72.31209 $56.45 $58.83 $60.94 $63.05 $65.16 $67.27 $69.64217 $54.75 $57.04 $59.07 $61.10 $63.14 $65.17 $67.46225 $53.17 $55.38 $57.34 $59.30 $61.26 $63.22 $65.42233 $51.70 $53.83 $55.72 $57.61 $59.51 $61.40 $63.53241 $50.32 $52.38 $54.21 $56.04 $57.87 $59.70 $61.76250 $48.88 $50.87 $52.63 $54.40 $56.16 $57.93 $59.91

WELL COST ($MM)

EUR (M

boe)

Key Assumptions: 80% Oil, 8% Gas, 12% NGLs , Gas $4.5/mcf, NGLs 45% of WTI

3.5 3.7 3.8 4.0 4.2 4.3 4.5312 $58.52 $61.00 $63.21 $65.41 $67.62 $69.82 $72.30325 $56.60 $58.98 $61.10 $63.21 $65.33 $67.45 $69.83338 $54.82 $57.11 $59.14 $61.18 $63.22 $65.25 $67.54351 $53.17 $55.38 $57.34 $59.30 $61.26 $63.22 $65.42364 $51.64 $53.77 $55.66 $57.55 $59.44 $61.33 $63.46377 $50.22 $52.27 $54.10 $55.92 $57.75 $59.57 $61.63390 $48.89 $50.87 $52.64 $54.40 $56.17 $57.93 $59.92

WELL COST ($MM)

30‐Day

 IP Rate (boe

)

Key Assumptions: 80% Oil, 8% Gas, 12% NGLs , Gas $4.5/mcf, NGLs 45% of WTI

3.5 3.7 3.8 4.0 4.2 4.3 4.550 8.2% 7.2% 6.4% 5.6% 4.8% 3.9% 3.1%60 14.3% 12.7% 11.5% 10.4% 9.4% 8.5% 7.6%70 21.9% 19.5% 17.7% 16.1% 14.7% 13.4% 12.2%80 31.2% 27.8% 25.3% 23.0% 21.0% 19.3% 17.5%90 42.3% 37.8% 34.3% 31.2% 28.6% 26.2% 23.9%100 55.5% 49.4% 44.9% 40.9% 37.4% 34.3% 31.3%110 70.8% 63.0% 57.1% 52.0% 47.6% 43.6% 39.8%

WELL COST ($MM)

NYM

EX Price 

($/boe

)

Key Assumptions: 80% Oil, 8% Gas, 12% NGLs , Gas $4.5/mcf, NGLs 45% of WTI ,225 MBOE EUR

200 209 217 225 233 241 25050 3.1% 4.0% 4.9% 5.6% 6.3% 6.9% 7.6%60 7.6% 8.6% 9.5% 10.4% 11.3% 12.3% 13.4%70 12.2% 13.5% 14.8% 16.1% 17.5% 18.9% 20.5%80 17.5% 19.4% 21.2% 23.0% 24.9% 26.9% 29.3%90 23.9% 26.4% 28.8% 31.2% 33.8% 36.5% 39.7%100 31.3% 34.6% 37.6% 40.9% 44.3% 47.8% 52.0%110 39.8% 44.0% 47.9% 52.0% 56.4% 60.9% 66.3%

Key Assumptions: 80% Oil, 8% Gas, 12% NGLs , Gas $4.5/mcf, NGLs 45% of WTI , $4 MM Well Cost

EUR (Mboe)

NYM

EX Price 

($/boe

)

0.0% 

10.0% 

20.0% 

30.0% 

40.0% 

50.0% 

60.0% 

70.0% 

80.0% 

$50.00 $60.00 $70.00 $80.00 $90.00 $100.00 $110.00

ATIRR

 (%)

NYMEX WTI Price ($/bbl)

3.5

3.7

3.8

4.0

4.2

4.3

4.5

0.0% 

10.0% 

20.0% 

30.0% 

40.0% 

50.0% 

60.0% 

70.0% 

$50.00 $60.00 $70.00 $80.00 $90.00 $100.00 $110.00

ATIRR

 (%)

NYMEX WTI Price ($/bbl)

200

209

217

225

233

241

250

20

DJ Niobrara Wattenberg The DJ (Denver Julesburg basin) Niobrara Wattenberg is located in Colorado with economics that are middle of the range in our analysis of 18 liquids-focused plays. This play requires a ~$51/bbl WTI price (range: $57-$46/bbl) in order to generate a 10% ATROR on a half cycle basis. On a full cycle basis, this play requires ~$69/bbl WTI to earn a 10% ATROR. Both of these scenarios are based on gas at $4.50/Mcf.

Key Assumptions/Threshold Price on Half Cycle Basis

Source: Company Filings, HPDI and Simmons & Company Estimates.

Producer Disclosed EURs and Well Costs

Source: Company Filings.

Type Curve

Source: HPDI and Simmons & Company Estimates.

NPV

Source: HPDI and Simmons & Company Estimates.

Assumptions Wattenberg Niobrara

Well Cost ($MM) $4.5EUR Per Well (Mboe) 325.0

Implied F&D Cost ($/boe) $17.3130‐Day IP Rate (boe/d) 507.7

Production Costs ($/boe) $6.00Production Taxes ($/boe) 4%

1st Year Decline (%) ‐78%2nd Year Decline (%) ‐41%3rd Year Decline (%) ‐29%

Well % Oil 40%Oil Diff to WTI (%) ‐14%

Well % NGLs 20%Well % Gas 40%

Threshold Oil Price Necessary for 10% ATROR $51.2215% ATROR $63.1120% ATROR $73.2725% ATROR $82.20

Operator EUR (Mboe) Well Cost ($ in MMs)APC 200‐400 4.0‐4.5NBL 310 4.5PETD 300+ NA

Average 307 4.4

0

100

200

300

400

500

600

1 13 25 37 49 61 73 85 9710

912

113

314

515

716

918

119

320

521

722

924

125

326

527

728

930

131

332

533

734

936

1

Average

 Daily Produ

ction (Boe

/d)

Months

‐$5,000

‐$4,000

‐$3,000

‐$2,000

‐$1,000

$0

$1,000

$2,000

0 5 10 15 20 25 30 35 40 45 50 55 60 65 70 75 80 85 90 95 100

105

110

115

Project N

PV ($

MM)

Month

21

Half-Cycle Sensitivities

Sensitivity 1&2: Threshold WTI Oil Price at Various EURs and Well Costs

Sensitivity 3&4: ATROR at Various WTI Oil Prices and EURs

Source: Company Filings, HPDI and Simmons & Company Estimates.

ATROR at Various Well Costs

Source: HPDI and Simmons & Company Estimates.

ATROR at Various EURs

Source: HPDI and Simmons & Company Estimates.

4.0 4.2 4.3 4.5 4.7 4.8 5.0275 $54.51 $57.60 $60.34 $63.08 $65.82 $68.57 $71.65293 $50.30 $53.20 $55.77 $58.35 $60.92 $63.49 $66.39309 $46.97 $49.72 $52.16 $54.60 $57.04 $59.48 $62.22325 $43.97 $46.58 $48.90 $51.22 $53.54 $55.86 $58.47341 $41.25 $43.73 $45.94 $48.16 $50.37 $52.58 $55.07357 $38.77 $41.14 $43.26 $45.37 $47.48 $49.59 $51.97375 $36.23 $38.50 $40.51 $42.52 $44.53 $46.54 $48.80

Key Assumptions: 40% Oil, 40% Gas, 20% NGLs , Gas $4.5/mcf, NGLs 45% of WTI

WELL COST ($MM)

EUR (M

boe)

4.0 4.2 4.3 4.5 4.7 4.8 5.0433 $54.02 $57.08 $59.81 $62.53 $65.25 $67.97 $71.04458 $50.30 $53.20 $55.77 $58.35 $60.92 $63.49 $66.39483 $46.97 $49.72 $52.16 $54.60 $57.04 $59.48 $62.22508 $43.97 $46.58 $48.90 $51.22 $53.54 $55.86 $58.47533 $41.25 $43.73 $45.94 $48.16 $50.37 $52.58 $55.07558 $38.77 $41.14 $43.26 $45.37 $47.48 $49.59 $51.97583 $36.50 $38.78 $40.80 $42.82 $44.84 $46.86 $49.14

Key Assumptions: 40% Oil, 40% Gas, 20% NGLs , Gas $4.5/mcf, NGLs 45% of WTI

WELL COST ($MM)

30‐Day

 IP Rate (boe

)

4.0 4.2 4.3 4.5 4.7 4.8 5.050 12.7% 11.5% 10.4% 9.5% 8.7% 8.0% 7.2%60 17.9% 16.2% 14.8% 13.6% 12.5% 11.5% 10.5%70 24.0% 21.7% 19.9% 18.3% 16.9% 15.6% 14.3%80 31.0% 28.1% 25.8% 23.7% 21.9% 20.3% 18.6%90 39.0% 35.3% 32.4% 29.9% 27.6% 25.5% 23.5%100 48.1% 43.5% 39.9% 36.8% 34.0% 31.5% 28.9%110 58.3% 52.7% 48.4% 44.5% 41.1% 38.1% 35.0%Key Assumptions: 40% Oil, 40% Gas, 20% NGLs , Gas $4.5/mcf, NGLs 45% of WTI ,325 MBOE EUR

WELL COST ($MM)

NYM

EX Price 

($/boe

)

275 293 309 325 341 357 37550 6.1% 7.3% 8.4% 9.5% 10.8% 12.0% 13.5%60 9.0% 10.6% 12.1% 13.6% 15.2% 17.0% 19.0%70 12.4% 14.4% 16.3% 18.3% 20.5% 22.7% 25.4%80 16.1% 18.7% 21.1% 23.7% 26.5% 29.4% 32.9%90 20.4% 23.6% 26.6% 29.9% 33.3% 37.0% 41.3%100 25.2% 29.1% 32.8% 36.8% 41.0% 45.6% 51.0%110 30.5% 35.2% 39.7% 44.5% 49.7% 55.2% 61.8%Key Assumptions: 40% Oil, 40% Gas, 20% NGLs , Gas $4.5/mcf, NGLs 45% of WTI , $5 MM Well Cost

EUR (Mboe)

NYM

EX Price 

($/boe

)

0.0% 

10.0% 

20.0% 

30.0% 

40.0% 

50.0% 

60.0% 

70.0% 

$50.00 $60.00 $70.00 $80.00 $90.00 $100.00 $110.00

ATIRR

 (%)

NYMEX WTI Price ($/bbl)

4.0

4.2

4.3

4.5

4.7

4.8

5.0

0.0% 

10.0% 

20.0% 

30.0% 

40.0% 

50.0% 

60.0% 

70.0% 

$50.00 $60.00 $70.00 $80.00 $90.00 $100.00 $110.00

ATIRR

 (%)

NYMEX WTI Price ($/bbl)

275

293

309

325

341

357

375

22

Eagle Ford Condensate The Eagle Ford is located in South Texas. There are three primary hydrocarbon windows: dry gas (little current development occurring), condensate and oil. The Eagle Ford Condensate play has economics that are middle of the range in our analysis of 18 liquids-focused plays. However, this play can vary widely with different EURs and product mixes across different areas of the play. This plays requires a ~$52/bbl WTI price (ranges: $58-$45/bbl) in order to generate a 10% ATROR on half cycle economics. This play requires ~67/bbl WTI in order to generate a 10% ATROR on a full cycle basis. Both of these scenarios are based on gas at $4.50/Mcf.

Key Assumptions/Threshold Price on Half Cycle Basis

Source: Company Filings, HPDI and Simmons & Company Estimates.

Producer Disclosed EURs and Well Costs

Source: Company Filings.

Type Curve

Source: HPDI and Simmons & Company Estimates.

NPV

Source: HPDI and Simmons & Company Estimates.

AssumptionsEagle Ford Condensate

Well Cost ($MM) $7.5EUR Per Well (Mboe) 922.9

Implied F&D Cost ($/boe) $10.1630‐Day IP Rate (boe/d) 810.0

Production Costs ($/boe) $7.50Production Taxes ($/boe) 6%

1st Year Decline (%) ‐69%2nd Year Decline (%) ‐32%3rd Year Decline (%) ‐22%

Well % Oil 35%Oil Diff to WTI (%) ‐10%

Well % NGLs 25%Well % Gas 40%

Threshold Oil Price Necessary for 10% ATROR $51.5315% ATROR $64.4920% ATROR $75.7425% ATROR $85.70

Operator EUR Well Cost ($ in MMs)APC 450+ Mboe 5.5HK 5.2‐6.4 Bcfe 7.5‐8.5PXD NA 7.0‐8.0ROSE 10 Bcfe 7.5‐8.5SFY 377‐524 Mboe 8.5‐9.5SM 6.6‐7.5 Bcfe 6.5‐7.5

Average NMF 7.5

0

100

200

300

400

500

600

700

800

900

111 21 31 41 51 61 71 81 91 101

111

121

131

141

151

161

171

181

191

201

211

221

231

241

251

261

271

281

291

301

311

321

331

341

351

361

Average

 Daily Produ

ction (Boe

/d)

Months

‐$8,000

‐$6,000

‐$4,000

‐$2,000

$0

$2,000

$4,000

0 5 10 15 20 25 30 35 40 45 50 55 60 65 70 75 80 85 90 95 100

105

110

115

Project N

PV ($

MM)

Month

23

Half-Cycle Sensitivities

Sensitivity 1&2: Threshold WTI Oil Price at Various EURs and Well Costs

Sensitivity 3&4: ATROR at Various WTI Oil Prices and EURs

Source: Company Filings, HPDI and Simmons & Company Estimates.

ATROR at Various Well Costs

Source: HPDI and Simmons & Company Estimates.

ATROR at Various EURs

Source: HPDI and Simmons & Company Estimates.

6.5 6.8 7.2 7.5 7.8 8.2 8.5750 $55.05 $57.99 $60.85 $63.71 $66.57 $69.42 $72.37807 $51.07 $53.81 $56.46 $59.12 $61.78 $64.43 $67.17865 $47.57 $50.12 $52.60 $55.07 $57.55 $60.03 $62.58923 $44.50 $46.89 $49.21 $51.53 $53.86 $56.18 $58.571001 $40.93 $43.14 $45.28 $47.42 $49.56 $51.70 $53.911079 $37.89 $39.93 $41.92 $43.90 $45.89 $47.88 $49.921156 $35.28 $37.19 $39.04 $40.90 $42.75 $44.60 $46.51

WELL COST ($MM)

EUR (M

boe)

Key Assumptions: 35% Oil, 40% Gas, 25% NGLs , Gas $4.5/mcf, NGLs 45% of WTI

6.5 6.8 7.2 7.5 7.8 8.2 8.5648 $55.93 $58.92 $61.82 $64.73 $67.63 $70.53 $73.52702 $51.53 $54.29 $56.97 $59.65 $62.33 $65.01 $67.77756 $47.76 $50.33 $52.82 $55.30 $57.79 $60.28 $62.84810 $44.50 $46.89 $49.21 $51.53 $53.86 $56.18 $58.57878 $40.96 $43.16 $45.31 $47.45 $49.59 $51.73 $53.94946 $37.92 $39.97 $41.96 $43.95 $45.94 $47.92 $49.971013 $35.33 $37.25 $39.10 $40.96 $42.82 $44.67 $46.59

WELL COST ($MM)

30‐Day

 IP Rate (boe

)

Key Assumptions: 35% Oil, 40% Gas, 25% NGLs , Gas $4.5/mcf, NGLs 45% of WTI

6.5 6.8 7.2 7.5 7.8 8.2 8.550 12.4% 11.2% 10.3% 9.5% 8.7% 8.0% 7.4%60 17.1% 15.6% 14.3% 13.2% 12.2% 11.3% 10.5%70 22.5% 20.5% 18.8% 17.4% 16.1% 14.9% 13.8%80 28.7% 26.1% 24.0% 22.1% 20.4% 18.9% 17.6%90 35.7% 32.5% 29.7% 27.3% 25.2% 23.4% 21.7%100 43.6% 39.5% 36.1% 33.2% 30.6% 28.4% 26.3%110 52.4% 47.4% 43.3% 39.7% 36.6% 33.8% 31.3%

WELL COST ($MM)

NYM

EX Price 

($/boe

)

Key Assumptions: 35% Oil, 40% Gas, 25% NGLs , Gas $4.5/mcf, NGLs 45% of WTI ,923 MBOE EUR

750 807 865 923 1001 1079 115650 6.2% 7.3% 8.3% 9.5% 11.0% 12.7% 14.4%60 8.9% 10.3% 11.7% 13.2% 15.3% 17.5% 19.9%70 11.9% 13.6% 15.4% 17.4% 20.1% 23.1% 26.2%80 15.1% 17.3% 19.6% 22.1% 25.6% 29.4% 33.5%90 18.7% 21.3% 24.2% 27.3% 31.8% 36.6% 41.8%100 22.6% 25.8% 29.4% 33.2% 38.7% 44.7% 51.2%110 26.9% 30.8% 35.1% 39.7% 46.4% 53.8% 61.7%

Key Assumptions: 35% Oil, 40% Gas, 25% NGLs , Gas $4.5/mcf, NGLs 45% of WTI , $8 MM Well Cost

EUR (Mboe)

NYM

EX Price 

($/boe

)

0.0% 

10.0% 

20.0% 

30.0% 

40.0% 

50.0% 

60.0% 

$50.00 $60.00 $70.00 $80.00 $90.00 $100.00 $110.00

ATIRR

 (%)

NYMEX WTI Price ($/bbl)

6.5

6.8

7.2

7.5

7.8

8.2

8.5

0.0% 

10.0% 

20.0% 

30.0% 

40.0% 

50.0% 

60.0% 

70.0% 

$50.00 $60.00 $70.00 $80.00 $90.00 $100.00 $110.00

ATIRR

 (%)

NYMEX WTI Price ($/bbl)

750

807

865

923

1001

1079

1156

24

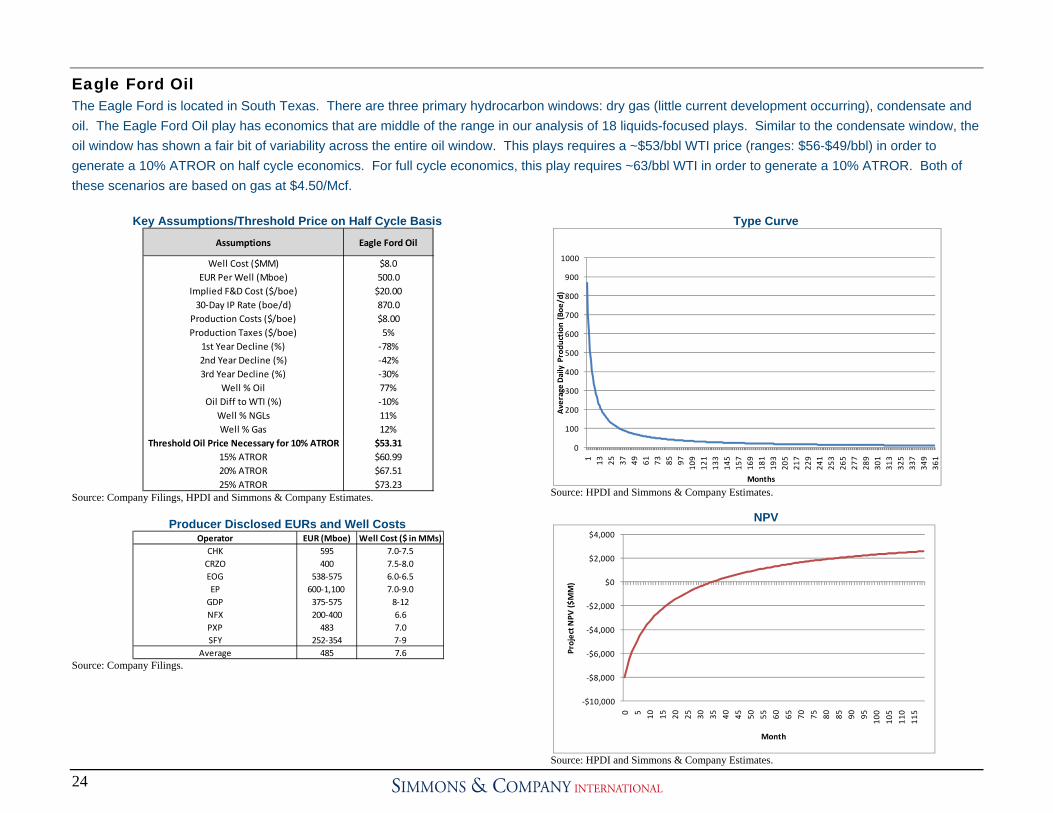
Eagle Ford Oil The Eagle Ford is located in South Texas. There are three primary hydrocarbon windows: dry gas (little current development occurring), condensate and oil. The Eagle Ford Oil play has economics that are middle of the range in our analysis of 18 liquids-focused plays. Similar to the condensate window, the oil window has shown a fair bit of variability across the entire oil window. This plays requires a ~$53/bbl WTI price (ranges: $56-$49/bbl) in order to generate a 10% ATROR on half cycle economics. For full cycle economics, this play requires ~63/bbl WTI in order to generate a 10% ATROR. Both of these scenarios are based on gas at $4.50/Mcf.

Key Assumptions/Threshold Price on Half Cycle Basis

Source: Company Filings, HPDI and Simmons & Company Estimates.

Producer Disclosed EURs and Well Costs

Source: Company Filings.

Type Curve

Source: HPDI and Simmons & Company Estimates.

NPV

Source: HPDI and Simmons & Company Estimates.

Assumptions Eagle Ford Oil

Well Cost ($MM) $8.0EUR Per Well (Mboe) 500.0

Implied F&D Cost ($/boe) $20.0030‐Day IP Rate (boe/d) 870.0

Production Costs ($/boe) $8.00Production Taxes ($/boe) 5%

1st Year Decline (%) ‐78%2nd Year Decline (%) ‐42%3rd Year Decline (%) ‐30%

Well % Oil 77%Oil Diff to WTI (%) ‐10%

Well % NGLs 11%Well % Gas 12%

Threshold Oil Price Necessary for 10% ATROR $53.3115% ATROR $60.9920% ATROR $67.5125% ATROR $73.23

Operator EUR (Mboe) Well Cost ($ in MMs)CHK 595 7.0‐7.5CRZO 400 7.5‐8.0EOG 538‐575 6.0‐6.5EP 600‐1,100  7.0‐9.0GDP 375‐575 8‐12NFX 200‐400 6.6PXP 483 7.0SFY 252‐354 7‐9

Average 485 7.6

0

100

200

300

400

500

600

700

800

900

1000

1 13 25 37 49 61 73 85 9710

912

113

314

515

716

918

119

320

521

722

924

125

326

527

728

930

131

332

533

734

936

1

Average

 Daily Produ

ction (Boe

/d)

Months

‐$10,000

‐$8,000

‐$6,000

‐$4,000

‐$2,000

$0

$2,000

$4,000

0 5 10 15 20 25 30 35 40 45 50 55 60 65 70 75 80 85 90 95 100

105

110

115

Project N

PV ($

MM)

Month

25

Half-Cycle Sensitivities Sensitivity 1 & 2: Threshold WTI Oil Price at Various EURs and Well Costs

Sensitivity 3&4: ATROR at Various WTI Oil Prices and EURs

Source: Company Filings, HPDI and Simmons & Company Estimates.

ATROR at Various Well Costs

Source: HPDI and Simmons & Company Estimates.

ATROR at Various EURs

Source: HPDI and Simmons & Company Estimates.

6.5 7.0 7.5 8.0 8.3 8.7 9.0450 $49.09 $52.10 $55.12 $58.13 $60.12 $62.10 $64.15468 $47.59 $50.48 $53.38 $56.27 $58.19 $60.10 $62.07484 $46.34 $49.14 $51.94 $54.74 $56.59 $58.44 $60.34500 $45.18 $47.89 $50.60 $53.31 $55.10 $56.89 $58.73516 $44.08 $46.71 $49.34 $51.96 $53.70 $55.43 $57.22532 $43.06 $45.60 $48.15 $50.70 $52.38 $54.06 $55.80550 $41.97 $44.44 $46.90 $49.37 $50.99 $52.62 $54.29

WELL COST ($MM)

EUR (M

boe)

Key Assumptions: 77% Oil, 12% Gas, 11% NGLs , Gas $4.5/mcf, NGLs 45% of WTI

6.5 7.0 7.5 8.0 8.3 8.7 9.0795 $48.50 $51.47 $54.43 $57.40 $59.36 $61.32 $63.33820 $47.33 $50.20 $53.08 $55.95 $57.85 $59.75 $61.71845 $46.22 $49.01 $51.80 $54.59 $56.43 $58.28 $60.17870 $45.18 $47.89 $50.60 $53.31 $55.10 $56.89 $58.73895 $44.19 $46.83 $49.46 $52.10 $53.84 $55.58 $57.37920 $43.26 $45.82 $48.39 $50.95 $52.64 $54.34 $56.08945 $42.38 $44.88 $47.37 $49.87 $51.51 $53.16 $54.86

WELL COST ($MM)

30‐Day

 IP Rate (boe

)

Key Assumptions: 77% Oil, 12% Gas, 11% NGLs , Gas $4.5/mcf, NGLs 45% of WTI

6.5 7.0 7.5 8.0 8.3 8.7 9.050 13.8% 11.5% 9.6% 8.1% 7.3% 6.5% 5.8%60 23.5% 19.7% 16.7% 14.3% 13.0% 11.8% 10.7%70 36.0% 30.2% 25.7% 22.1% 20.1% 18.3% 16.7%80 51.6% 43.4% 36.9% 31.7% 28.9% 26.4% 24.1%90 70.9% 59.4% 50.5% 43.4% 39.4% 36.0% 32.9%100 94.5% 78.8% 66.7% 57.2% 52.0% 47.5% 43.4%110 123.0% 102.0% 86.1% 73.6% 66.8% 60.9% 55.6%

WELL COST ($MM)

NYM

EX Price 

($/boe

)

Key Assumptions: 77% Oil, 12% Gas, 11% NGLs , Gas $4.5/mcf, NGLs 45% of WTI ,500 MBOE EUR

450 468 484 500 516 532 55050 6.0% 6.7% 7.4% 8.1% 8.8% 9.6% 10.4%60 11.0% 12.2% 13.2% 14.3% 15.4% 16.6% 18.0%70 17.2% 18.9% 20.5% 22.1% 23.8% 25.6% 27.7%80 24.8% 27.2% 29.4% 31.7% 34.2% 36.7% 39.7%90 33.9% 37.1% 40.2% 43.4% 46.7% 50.2% 54.3%100 44.6% 48.9% 53.0% 57.2% 61.7% 66.3% 71.8%110 57.2% 62.8% 68.1% 73.6% 79.4% 85.6% 92.8%Key Assumptions: 77% Oil, 12% Gas, 11% NGLs , Gas $4.5/mcf, NGLs 45% of WTI , $8 MM Well Cost

EUR (Mboe)

NYM

EX Price 

($/boe

)

0.0% 

20.0% 

40.0% 

60.0% 

80.0% 

100.0% 

120.0% 

140.0% 

$50.00 $60.00 $70.00 $80.00 $90.00 $100.00 $110.00

ATIRR

 (%)

NYMEX WTI Price ($/bbl)

6.5

7.0

7.5

8.0

8.3

8.7

9.0

0.0% 

10.0% 

20.0% 

30.0% 

40.0% 

50.0% 

60.0% 

70.0% 

80.0% 

90.0% 

100.0% 

$50.00 $60.00 $70.00 $80.00 $90.00 $100.00 $110.00

ATIRR

 (%)

NYMEX WTI Price ($/bbl)

450

468

484

500

516

532

550

26

Granite Wash - Colony The Colony Granite Wash is located in the Anadarko Basin in Washita County, Oklahoma and is the most economic play in our analysis requiring ~$43/bbl WTI (range: $50-$$37/bbl) in order to generate a 10% ATROR on half cycle economics. On a full cycle basis, the Colony Granite Wash requires ~$59/bbl WTI in order to generate a 10% ATROR. Both of these scenarios are based on gas at $4.50/Mcf. Based on a lack of operators in the play, we had to rely heavily on CHK assumptions.

Key Assumptions/Threshold Price on Half Cycle Basis

Source: Company Filings, HPDI and Simmons & Company Estimates.

Producer Disclosed EURs and Well Costs

Source: Company Filings.

Type Curve

Source: HPDI and Simmons & Company Estimates.

NPV

Source: HPDI and Simmons & Company Estimates.

Assumptions Colony Granite Wash

Well Cost ($MM) $7.5EUR Per Well (Mboe) 1000.0

Implied F&D Cost ($/boe) $9.3730‐Day IP Rate (boe/d) 1453.0

Production Costs ($/boe) $6.00Production Taxes ($/boe) 7%

1st Year Decline (%) ‐75%2nd Year Decline (%) ‐37%3rd Year Decline (%) ‐25%

Well % Oil 18%Oil Diff to WTI (%) ‐8%

Well % NGLs 30%Well % Gas 52%

Threshold Oil Price Necessary for 10% ATROR $43.1615% ATROR $56.1720% ATROR $67.2125% ATROR $76.82

Operator EUR (Bcfe) Well Cost ($ in MMs)CHK 7.0 7.5

0

200

400

600

800

1000

1200

1400

1600

1 11 21 31 41 51 61 71 81 91 101

111

121

131

141

151

161

171

181

191

201

211

221

231

241

251

261

271

281

291

301

311

321

331

341

351

361

Average

 Daily Produ

ction (Boe

/d)

Months

‐$8,000

‐$6,000

‐$4,000

‐$2,000

$0

$2,000

$4,000

0 5 10 15 20 25 30 35 40 45 50 55 60 65 70 75 80 85 90 95 100

105

110

115

Project N

PV ($

MM)

Month

27

Half-Cycle Sensitivities

Sensitivity 1&2: Threshold WTI Oil Price at Various EURs and Well Costs

Sensitivity 3&4: ATROR at Various WTI Oil Prices and EURs

Source: Company Filings, HPDI and Simmons & Company Estimates.

ATROR at Various Well Costs

Source: HPDI and Simmons & Company Estimates.

ATROR at Various EURs

Source: HPDI and Simmons & Company Estimates.

6.5 6.8 7.2 7.5 7.8 8.2 8.5800 $48.26 $51.73 $55.09 $58.45 $61.82 $65.18 $68.65868 $43.07 $46.26 $49.36 $52.46 $55.57 $58.67 $61.86934 $38.75 $41.72 $44.60 $47.48 $50.37 $53.25 $56.221000 $35.01 $37.78 $40.47 $43.16 $45.85 $48.54 $51.321066 $31.72 $34.32 $36.85 $39.37 $41.90 $44.42 $47.031132 $28.82 $31.27 $33.65 $36.03 $38.41 $40.78 $43.231200 $26.17 $28.48 $30.72 $32.97 $35.21 $37.45 $39.76

WELL COST ($MM)

EUR (M

boe)

Key Assumptions: 18% Oil, 52% Gas, 30% NGLs , Gas $4.5/mcf, NGLs 45% of WTI

6.5 6.8 7.2 7.5 7.8 8.2 8.51153 $48.80 $52.29 $55.69 $59.08 $62.47 $65.86 $69.361253 $43.47 $46.68 $49.80 $52.93 $56.05 $59.17 $62.381353 $38.92 $41.90 $44.79 $47.68 $50.57 $53.46 $56.441453 $35.01 $37.78 $40.47 $43.16 $45.85 $48.54 $51.321553 $31.59 $34.19 $36.70 $39.22 $41.74 $44.26 $46.851653 $28.59 $31.03 $33.39 $35.76 $38.13 $40.49 $42.931753 $25.93 $28.23 $30.46 $32.69 $34.92 $37.15 $39.45

WELL COST ($MM)

IP Rate (boe

)

Key Assumptions: 18% Oil, 52% Gas, 30% NGLs , Gas $4.5/mcf, NGLs 45% of WTI

6.5 6.8 7.2 7.5 7.8 8.2 8.550 16.9% 15.2% 13.8% 12.5% 11.4% 10.5% 9.6%60 22.4% 20.2% 18.3% 16.7% 15.2% 14.0% 12.8%70 28.9% 25.9% 23.5% 21.4% 19.6% 18.0% 16.5%80 36.3% 32.6% 29.5% 26.8% 24.5% 22.5% 20.6%90 44.9% 40.2% 36.3% 32.9% 30.0% 27.5% 25.3%100 54.6% 48.8% 44.0% 39.9% 36.3% 33.2% 30.5%110 65.7% 58.5% 52.6% 47.6% 43.3% 39.6% 36.3%

WELL COST ($MM)

NYM

EX Price 

($/boe

)

Key Assumptions: 18% Oil, 52% Gas, 30% NGLs , Gas $4.5/mcf, NGLs 45% of WTI ,1000 MBOE EUR

800 868 934 1000 1066 1132 120050 7.7% 9.3% 10.8% 12.5% 14.3% 16.2% 18.3%60 10.4% 12.4% 14.5% 16.7% 19.0% 21.5% 24.3%70 13.5% 15.9% 18.6% 21.4% 24.4% 27.7% 31.4%80 16.8% 19.9% 23.2% 26.8% 30.7% 34.9% 39.6%90 20.6% 24.4% 28.5% 32.9% 37.8% 43.1% 49.0%100 24.8% 29.4% 34.4% 39.9% 45.8% 52.4% 59.7%110 29.4% 35.0% 41.0% 47.6% 54.9% 62.9% 71.9%

Key Assumptions: 18% Oil, 52% Gas, 30% NGLs , Gas $4.5/mcf, NGLs 45% of WTI , $8 MM Well Cost

EUR (Mboe)

NYM

EX Price 

($/boe

)

0.0% 

10.0% 

20.0% 

30.0% 

40.0% 

50.0% 

60.0% 

70.0% 

$50.00 $60.00 $70.00 $80.00 $90.00 $100.00 $110.00

ATIRR

 (%)

NYMEX WTI Price ($/bbl)

6.5

6.8

7.2

7.5

7.8

8.2

8.5

0.0% 

10.0% 

20.0% 

30.0% 

40.0% 

50.0% 

60.0% 

70.0% 

80.0% 

$50.00 $60.00 $70.00 $80.00 $90.00 $100.00 $110.00

ATIRR

 (%)

NYMEX WTI Price ($/bbl)

800

868

934

1000

1066

1132

1200

28

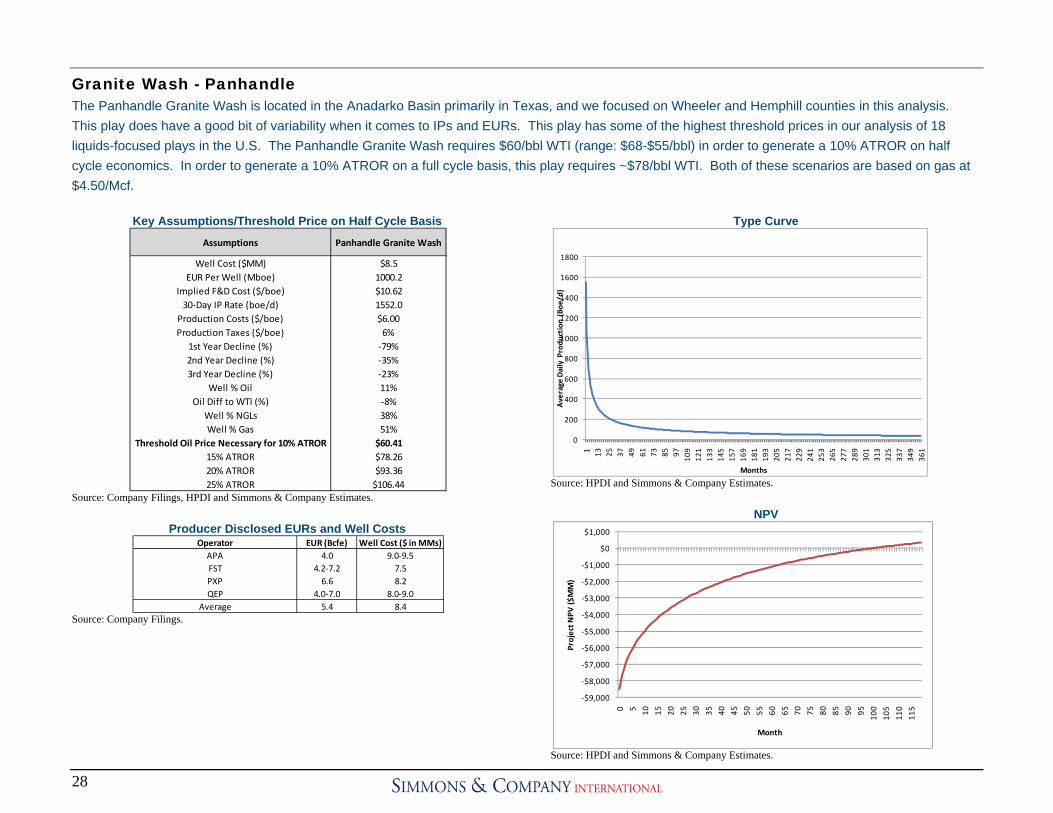
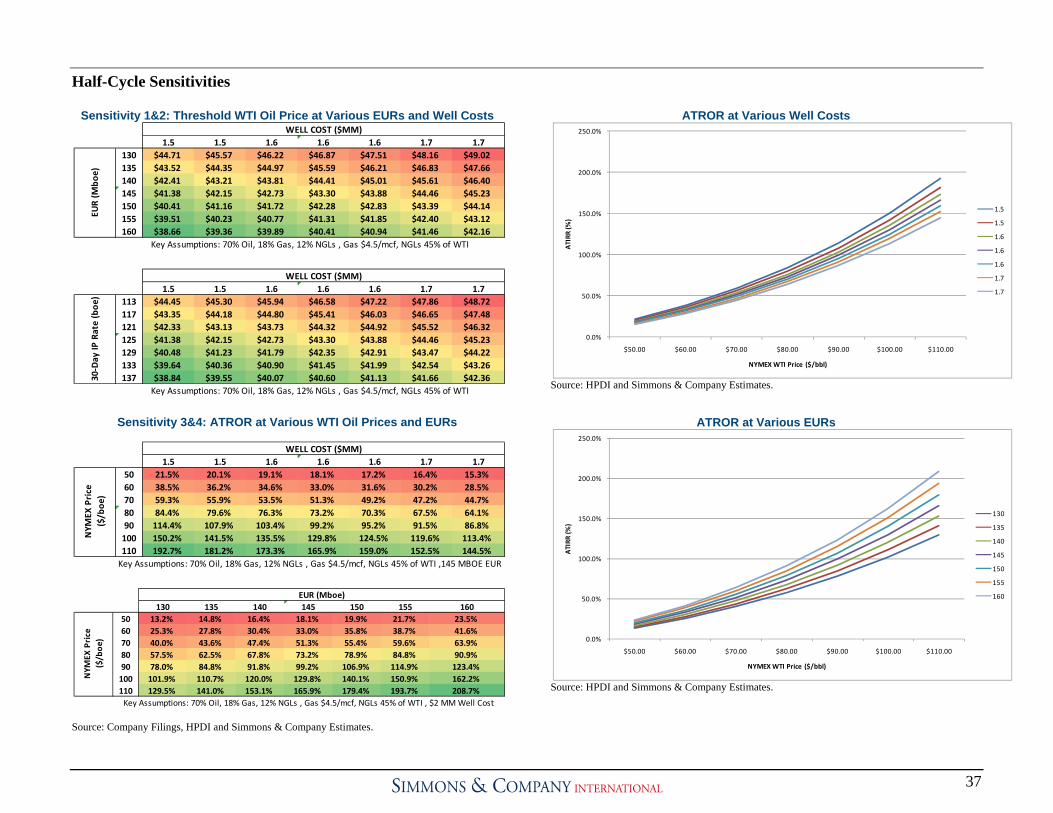
Granite Wash - Panhandle The Panhandle Granite Wash is located in the Anadarko Basin primarily in Texas, and we focused on Wheeler and Hemphill counties in this analysis. This play does have a good bit of variability when it comes to IPs and EURs. This play has some of the highest threshold prices in our analysis of 18 liquids-focused plays in the U.S. The Panhandle Granite Wash requires $60/bbl WTI (range: $68-$55/bbl) in order to generate a 10% ATROR on half cycle economics. In order to generate a 10% ATROR on a full cycle basis, this play requires ~$78/bbl WTI. Both of these scenarios are based on gas at $4.50/Mcf.

Key Assumptions/Threshold Price on Half Cycle Basis

Source: Company Filings, HPDI and Simmons & Company Estimates.

Producer Disclosed EURs and Well Costs

Source: Company Filings.

Type Curve

Source: HPDI and Simmons & Company Estimates.

NPV

Source: HPDI and Simmons & Company Estimates.

Assumptions Panhandle Granite Wash

Well Cost ($MM) $8.5EUR Per Well (Mboe) 1000.2

Implied F&D Cost ($/boe) $10.6230‐Day IP Rate (boe/d) 1552.0

Production Costs ($/boe) $6.00Production Taxes ($/boe) 6%

1st Year Decline (%) ‐79%2nd Year Decline (%) ‐35%3rd Year Decline (%) ‐23%

Well % Oil 11%Oil Diff to WTI (%) ‐8%

Well % NGLs 38%Well % Gas 51%

Threshold Oil Price Necessary for 10% ATROR $60.4115% ATROR $78.2620% ATROR $93.3625% ATROR $106.44

Operator EUR (Bcfe) Well Cost ($ in MMs)APA 4.0 9.0‐9.5FST 4.2‐7.2 7.5PXP 6.6 8.2QEP 4.0‐7.0 8.0‐9.0

Average 5.4 8.4

0

200

400

600

800

1000

1200

1400

1600

1800

1 13 25 37 49 61 73 85 97 109

121

133

145

157

169

181

193

205

217

229

241

253

265

277

289

301

313

325

337

349

361

Average

 Daily Produ

ction (Boe

/d)

Months

‐$9,000

‐$8,000

‐$7,000

‐$6,000

‐$5,000

‐$4,000

‐$3,000

‐$2,000

‐$1,000

$0

$1,000

0 5 10 15 20 25 30 35 40 45 50 55 60 65 70 75 80 85 90 95 100

105

110

115

Project N

PV ($

MM)

Month

29

Half-Cycle Sensitivities

Sensitivity 1&2: Threshold WTI Oil Price at Various EURs and Well Costs

Sensitivity 3&4: ATROR at Various WTI Oil Prices EURs

Source: Company Filings, HPDI and Simmons & Company Estimates.

ATROR at Various Well Costs

Source: HPDI and Simmons & Company Estimates.

ATROR at Various EURs

Source: HPDI and Simmons & Company Estimates.

7.5 7.8 8.2 8.5 8.8 9.2 9.5834 $65.03 $68.85 $72.55 $76.26 $79.97 $83.68 $87.50890 $59.73 $63.31 $66.78 $70.25 $73.73 $77.20 $80.78945 $55.13 $58.50 $61.78 $65.05 $68.32 $71.59 $74.961000 $51.04 $54.23 $57.32 $60.41 $63.51 $66.60 $69.781055 $47.38 $50.40 $53.33 $56.26 $59.19 $62.12 $65.141110 $44.08 $46.95 $49.74 $52.52 $55.31 $58.09 $60.961166 $41.04 $43.77 $46.43 $49.08 $51.73 $54.38 $57.11

WELL COST ($MM)

EUR (M

boe)

Key Assumptions: 11% Oil, 51% Gas, 38% NGLs , Gas $4.5/mcf, NGLs 45% of WTI

7.5 7.8 8.2 8.5 8.8 9.2 9.51294 $65.05 $68.88 $72.58 $76.29 $80.00 $83.71 $87.531380 $59.80 $63.39 $66.86 $70.34 $73.82 $77.29 $80.881466 $55.17 $58.54 $61.81 $65.09 $68.36 $71.63 $75.001552 $51.04 $54.23 $57.32 $60.41 $63.51 $66.60 $69.781638 $47.35 $50.37 $53.30 $56.23 $59.16 $62.09 $65.111724 $44.03 $46.90 $49.68 $52.47 $55.25 $58.03 $60.901810 $41.03 $43.76 $46.41 $49.06 $51.71 $54.36 $57.10

WELL COST ($MM)

IP Rate (boe

)

Key Assumptions: 11% Oil, 51% Gas, 38% NGLs , Gas $4.5/mcf, NGLs 45% of WTI

7.5 7.8 8.2 8.5 8.8 9.2 9.550 9.7% 8.9% 8.1% 7.5% 6.9% 6.3% 5.8%60 12.7% 11.7% 10.7% 9.9% 9.1% 8.5% 7.8%70 16.1% 14.8% 13.6% 12.6% 11.7% 10.8% 10.0%80 20.0% 18.3% 16.8% 15.5% 14.4% 13.4% 12.4%90 24.2% 22.2% 20.4% 18.8% 17.4% 16.2% 15.1%100 29.0% 26.5% 24.3% 22.5% 20.8% 19.3% 18.0%110 34.4% 31.3% 28.7% 26.5% 24.5% 22.7% 21.1%

WELL COST ($MM)

NYM

EX Price 

($/boe

)

Key Assumptions: 11% Oil, 51% Gas, 38% NGLs , Gas $4.5/mcf, NGLs 45% of WTI ,1000 MBOE EUR

834 890 945 1000 1055 1110 116650 4.9% 5.7% 6.6% 7.5% 8.4% 9.3% 10.3%60 6.7% 7.8% 8.8% 9.9% 11.0% 12.2% 13.5%70 8.7% 9.9% 11.2% 12.6% 14.0% 15.5% 17.1%80 10.8% 12.3% 13.9% 15.5% 17.3% 19.1% 21.1%90 13.1% 14.9% 16.8% 18.8% 21.0% 23.2% 25.7%100 15.6% 17.8% 20.0% 22.5% 25.0% 27.8% 30.8%110 18.3% 20.9% 23.6% 26.5% 29.6% 32.9% 36.5%

Key Assumptions: 11% Oil, 51% Gas, 38% NGLs , Gas $4.5/mcf, NGLs 45% of WTI , $9 MM Well Cost

EUR (Mboe)

NYM

EX Price 

($/boe

)

0.0% 

5.0% 

10.0% 

15.0% 

20.0% 

25.0% 

30.0% 

35.0% 

40.0% 

$50.00 $60.00 $70.00 $80.00 $90.00 $100.00 $110.00

ATIRR

 (%)

NYMEX WTI Price ($/bbl)

7.5

7.8

8.2

8.5

8.8

9.2

9.5

0.0% 

5.0% 

10.0% 

15.0% 

20.0% 

25.0% 

30.0% 

35.0% 

40.0% 

$50.00 $60.00 $70.00 $80.00 $90.00 $100.00 $110.00

ATIRR

 (%)

NYMEX WTI Price ($/bbl)

834

890

945

1000

1055

1110

1166

30

Mississippi Lime The Mississippi Lime is located in Oklahoma and Kansas. This play can have a very wide range of EURs and changes in production mix, so individual well economics can vary greatly from the average. This play is middle of the range on well economics as it requires $48/bbl WTI (range: $55-$43/bbl) in order to generate a 10% ATROR on half cycle economics. This play requires ~$67/bbl WTI in order to generate a 10% ATROR on a full cycle basis. Both of these scenarios are based on gas at $4.50/Mcf.

Key Assumptions/Threshold Price on Half Cycle Basis

Source: Company Filings, HPDI and Simmons & Company Estimates.

Producer Disclosed EURs and Well Costs

Source: Company Filings.

Type Curve

Source: HPDI and Simmons & Company Estimates.

NPV

Source: HPDI and Simmons & Company Estimates.

Assumptions Mississippi Lime

Well Cost ($MM) $3.0EUR Per Well (Mboe) 400.0

Implied F&D Cost ($/boe) $9.9730‐Day IP Rate (boe/d) 238.6

Production Costs ($/boe) $8.00Production Taxes ($/boe) 7%

1st Year Decline (%) ‐56%2nd Year Decline (%) ‐28%3rd Year Decline (%) ‐20%

Well % Oil 52%Oil Diff to WTI (%) ‐6%

Well % NGLs 15%Well % Gas 33%

Threshold Oil Price Necessary for 10% ATROR $48.4515% ATROR $59.9020% ATROR $70.0525% ATROR $79.17

Operator EUR (Mboe) Well Cost ($ in MMs)SD 300‐500 3.0CHK 415 3.0‐3.5RRC 400‐500 3.1

Eagle Energy 425 NAVitruvian 290‐650 NAAverage 432 3.1

0

50

100

150

200

250

300

1 13 25 37 49 61 73 85 97 109

121

133

145

157

169

181

193

205

217

229

241

253

265

277

289

301

313

325

337

349

361

Average

 Daily Produ

ction (Boe

/d)

Months

‐$3,500

‐$3,000

‐$2,500

‐$2,000

‐$1,500

‐$1,000

‐$500

$0

$500

$1,000

$1,500

0 5 10 15 20 25 30 35 40 45 50 55 60 65 70 75 80 85 90 95 100

105

110

115

Project N

PV ($

MM)

Month

31

Half-Cycle Sensitivities

Sensitivity 1&2: Threshold WTI Oil Price at Various EURs and Well Costs

Sensitivity 3&4: ATROR at Various WTI Oil Prices and EURs

Source: Company Filings, HPDI and Simmons & Company Estimates.

ATROR at Various Well Costs

Source: HPDI and Simmons & Company Estimates.

ATROR at Various EURs

Source: HPDI and Simmons & Company Estimates.

2.5 2.7 2.8 3.0 3.2 3.3 3.5300 $53.15 $56.53 $59.54 $62.55 $65.56 $68.57 $71.95334 $48.36 $51.40 $54.11 $56.81 $59.51 $62.21 $65.25367 $44.57 $47.33 $49.79 $52.25 $54.71 $57.17 $59.94400 $41.40 $43.93 $46.19 $48.45 $50.70 $52.96 $55.50433 $38.71 $41.05 $43.14 $45.22 $47.31 $49.39 $51.74466 $36.40 $38.58 $40.52 $42.46 $44.39 $46.33 $48.51500 $34.34 $36.38 $38.18 $39.99 $41.79 $43.60 $45.63

Key Assumptions: 52% Oil, 33% Gas, 15% NGLs , Gas $4.5/mcf, NGLs 45% of WTI

WELL COST ($MM)

EUR (M

boe)

2.5 2.7 2.8 3.0 3.2 3.3 3.5179 $53.24 $56.63 $59.64 $62.66 $65.67 $68.69 $72.08199 $48.50 $51.55 $54.26 $56.97 $59.68 $62.39 $65.44219 $44.62 $47.39 $49.86 $52.32 $54.78 $57.24 $60.01239 $41.40 $43.93 $46.19 $48.45 $50.70 $52.96 $55.50259 $38.67 $41.01 $43.09 $45.18 $47.26 $49.34 $51.68279 $36.33 $38.51 $40.44 $42.37 $44.31 $46.24 $48.41299 $34.31 $36.34 $38.14 $39.95 $41.75 $43.55 $45.58

Key Assumptions: 52% Oil, 33% Gas, 15% NGLs , Gas $4.5/mcf, NGLs 45% of WTI

WELL COST ($MM)

IP Rate (boe

)

2.5 2.7 2.8 3.0 3.2 3.3 3.550 14.5% 12.9% 11.7% 10.6% 9.7% 8.9% 8.1%60 20.4% 18.2% 16.5% 15.0% 13.8% 12.7% 11.6%70 27.1% 24.1% 21.9% 20.0% 18.3% 16.9% 15.5%80 34.7% 30.8% 27.9% 25.5% 23.4% 21.5% 19.7%90 43.3% 38.3% 34.7% 31.6% 28.9% 26.6% 24.3%100 52.8% 46.7% 42.2% 38.3% 35.0% 32.2% 29.4%110 63.3% 55.9% 50.4% 45.7% 41.8% 38.3% 35.0%Key Assumptions: 52% Oil, 33% Gas, 15% NGLs , Gas $4.5/mcf, NGLs 45% of WTI ,400 MBOE EUR

WELL COST ($MM)

NYM

EX Price 

($/boe

)

300 334 367 400 433 466 50050 6.3% 7.7% 9.2% 10.6% 12.2% 13.8% 15.5%60 9.2% 11.1% 13.0% 15.0% 17.2% 19.4% 21.8%70 12.4% 14.8% 17.3% 20.0% 22.8% 25.8% 29.0%80 15.8% 18.8% 22.1% 25.5% 29.1% 33.0% 37.2%90 19.5% 23.3% 27.3% 31.6% 36.2% 41.1% 46.5%100 23.5% 28.2% 33.1% 38.3% 44.0% 50.1% 56.8%110 27.9% 33.5% 39.3% 45.7% 52.6% 60.0% 68.2%Key Assumptions: 52% Oil, 33% Gas, 15% NGLs , Gas $4.5/mcf, NGLs 45% of WTI , $3 MM Well Cost

EUR (Mboe)

NYM

EX Price 

($/boe

)

0.0% 

10.0% 

20.0% 

30.0% 

40.0% 

50.0% 

60.0% 

70.0% 

$50.00 $60.00 $70.00 $80.00 $90.00 $100.00 $110.00

ATIRR

 (%)

NYMEX WTI Price ($/bbl)

2.5

2.7

2.8

3.0

3.2

3.3

3.5

0.0% 

10.0% 

20.0% 

30.0% 

40.0% 

50.0% 

60.0% 

70.0% 

80.0% 

$50.00 $60.00 $70.00 $80.00 $90.00 $100.00 $110.00

ATIRR

 (%)

NYMEX WTI Price ($/bbl)

300

334

367

400

433

466

500

32

Permian—Central Basin Platform Vertical The Permian-Central Basin Platform Vertical is located in the center of the Permian Basin in West Texas, in between the Midland and Delaware Basins. There are a variety of separate horizons within the CBP, but we have aggregated them to derive a generic type curve. This play requires ~$46/bbl WTI (range: $50-$44/bbl) for a 10% ATROR on half cycle economics. In order to generate a 10% ATROR on a full cycle basis, this play requires ~$56/bbl. Both of these scenarios are based on gas at $4.50/Mcf.

Key Assumptions/Threshold Price on Half Cycle Basis

Source: Company Filings, HPDI and Simmons & Company Estimates.

Producer Disclosed EURs and Well Costs

Source: Company Filings.

Type Curve

Source: HPDI and Simmons & Company Estimates.

NPV

Source: HPDI and Simmons & Company Estimates.

AssumptionsCentral Basin 

Platform VerticalWell Cost ($MM) $0.8

EUR Per Well (Mboe) 83.0Implied F&D Cost ($/boe) $11.4530‐Day IP Rate (boe/d) 65.0

Production Costs ($/boe) $12.70Production Taxes ($/boe) 5%

1st Year Decline (%) ‐50%2nd Year Decline (%) ‐32%3rd Year Decline (%) ‐26%

Well % Oil 70%Oil Diff to WTI (%) ‐6%

Well % NGLs 9%Well % Gas 21%

Threshold Oil Price Necessary for 10% ATROR $45.5915% ATROR $51.6920% ATROR $57.1525% ATROR $62.13

Operator EUR (Mboe) Well Cost ($ in MMs)SD 83 0.8

0

10

20

30

40

50

60

70

1 11 21 31 41 51 61 71 81 91 101

111

121

131

141

151

161

171

181

191

201

211

221

231

241

251

261

271

281

291

301

311

321

331

341

351

361

Average

 Daily Produ

ction (Boe

/d)

Months

‐$1,000

‐$800

‐$600

‐$400

‐$200

$0

$200

$400

$600

0 5 10 15 20 25 30 35 40 45 50 55 60 65 70 75 80 85 90 95 100

105

110

115

Project N

PV ($

MM)

Month

33

Half-Cycle Sensitivities

Sensitivity 1&2: Threshold WTI Oil Price at Various EURs and Well Costs

Sensitivity 3&4: ATROR at Various WTI Oil Prices and EURs

Source: Company Filings, HPDI and Simmons & Company Estimates.

ATROR at Various Well Costs

Source: HPDI and Simmons & Company Estimates.

ATROR at Various EURs

Source: HPDI and Simmons & Company Estimates.

0.7 0.7 0.8 0.8 0.9 0.9 1.073 $44.78 $46.98 $49.17 $49.61 $53.56 $55.75 $57.9477 $43.30 $45.38 $47.46 $47.88 $51.62 $53.70 $55.7880 $42.29 $44.29 $46.29 $46.69 $50.29 $52.29 $54.3083 $41.35 $43.28 $45.20 $45.59 $49.06 $50.99 $52.9286 $40.47 $42.33 $44.20 $44.57 $47.92 $49.78 $51.6489 $39.66 $41.45 $43.25 $43.61 $46.85 $48.65 $50.4593 $38.65 $40.37 $42.09 $42.44 $45.54 $47.26 $48.98

WELL COST ($MM)

EUR (M

boe)

Key Assumptions: 70% Oil, 21% Gas, 9% NGLs , Gas $4.5/mcf, NGLs 45% of WTI

0.7 0.7 0.7 0.8 0.8 0.8 0.960 $43.85 $45.53 $46.78 $48.03 $49.29 $50.54 $52.2161 $43.40 $45.05 $46.28 $47.51 $48.75 $49.98 $51.6363 $42.54 $44.13 $45.33 $46.52 $47.72 $48.91 $50.5065 $41.73 $43.28 $44.43 $45.59 $46.75 $47.91 $49.4567 $40.97 $42.47 $43.59 $44.72 $45.84 $46.96 $48.4669 $40.26 $41.71 $42.80 $43.89 $44.98 $46.07 $47.5370 $39.91 $41.35 $42.42 $43.50 $44.57 $45.65 $47.08

WELL COST ($MM)

30‐Day

 IP Rate (boe

)

Key Assumptions: 70% Oil, 21% Gas, 9% NGLs , Gas $4.5/mcf, NGLs 45% of WTI

0.7 0.7 0.7 0.8 0.8 0.8 0.950 18.1% 16.1% 14.7% 13.6% 12.5% 11.5% 10.4%60 29.9% 26.7% 24.7% 22.8% 21.2% 19.7% 17.9%70 43.9% 39.3% 36.4% 33.7% 31.4% 29.2% 26.7%80 60.3% 54.0% 50.0% 46.4% 43.2% 40.3% 36.8%90 79.2% 70.9% 65.5% 60.8% 56.6% 52.8% 48.3%100 100.9% 90.2% 83.2% 77.1% 71.7% 66.9% 61.2%110 125.8% 112.1% 103.3% 95.6% 88.8% 82.7% 75.6%

WELL COST ($MM)

NYM

EX Price 

($/boe

)

Key Assumptions: 70% Oil, 21% Gas, 9% NGLs , Gas $4.5/mcf, NGLs 45% of WTI ,83 MBOE EUR

73 77 80 83 86 89 9350 10.3% 11.6% 12.5% 13.6% 14.6% 15.7% 17.1%60 17.7% 19.7% 21.2% 22.8% 24.4% 26.1% 28.4%70 26.5% 29.3% 31.5% 33.7% 36.1% 38.4% 41.7%80 36.5% 40.3% 43.3% 46.4% 49.5% 52.8% 57.3%90 47.9% 52.9% 56.8% 60.8% 65.0% 69.3% 75.2%100 60.7% 67.0% 72.0% 77.1% 82.5% 88.0% 95.8%110 74.9% 82.8% 89.1% 95.6% 102.3% 109.4% 119.2%Key Assumptions: 70% Oil, 21% Gas, 9% NGLs , Gas $4.5/mcf, NGLs 45% of WTI , $1 MM Well Cost

EUR (Mboe)

NYM

EX Price 

($/boe

)

0.0% 

20.0% 

40.0% 

60.0% 

80.0% 

100.0% 

120.0% 

140.0% 

$50.00 $60.00 $70.00 $80.00 $90.00 $100.00 $110.00

ATIRR

 (%)

NYMEX WTI Price ($/bbl)

0.7

0.7

0.7

0.8

0.8

0.8

0.9

0.0% 

20.0% 

40.0% 

60.0% 

80.0% 

100.0% 

120.0% 

140.0% 

$50.00 $60.00 $70.00 $80.00 $90.00 $100.00 $110.00

ATIRR

 (%)

NYMEX WTI Price ($/bbl)

73

77

80

83

86

89

93

34

Permian—Spraberry Vertical The Permian Spraberry Vertical is located in the eastern portion of the Permian Basin (in the Midland Sub Basin) in West Texas. Spraberry can also be called the Wolfberry, and operators are now potentially comingling even lower zones (Strawn, Atoka). The Spraberry requires ~$60/bbl WTI (range: $62-$58/bbl) in order to generate a 10% ATROR on a half cycle basis. For a 10% ATROR on a full cycle basis, this play requires ~$69/bbl WTI.. Both of these scenarios are based on gas at $4.50/Mcf.

Key Assumptions/Threshold Price on Half Cycle Basis

Source: Company Filings, HPDI and Simmons & Company Estimates.

Producer Disclosed EURs and Well Costs

Source: Company Filings.

Type Curve

Source: HPDI and Simmons & Company Estimates.

NPV

Source: HPDI and Simmons & Company Estimates.

Assumptions Spraberry Vertical

Well Cost ($MM) $1.7EUR Per Well (Mboe) 140.0

Implied F&D Cost ($/boe) $15.1830‐Day IP Rate (boe/d) 78.3

Production Costs ($/boe) $10.00Production Taxes ($/boe) 5%

1st Year Decline (%) ‐50%2nd Year Decline (%) ‐28%3rd Year Decline (%) ‐21%

Well % Oil 70%Oil Diff to WTI (%) ‐6%

Well % NGLs 20%Well % Gas 10%

Threshold Oil Price Necessary for 10% ATROR $59.6715% ATROR $71.3620% ATROR $81.8025% ATROR $91.26

Operator EUR (Mboe) Well Cost ($ in MMs)APA 125 1.7PXD 140 1.5‐1.6CXO 140 1.6‐1.8

Average 135 1.7

0

10

20

30

40

50

60

70

80

90

1 13 25 37 49 61 73 85 97 109

121

133

145

157

169

181

193

205

217

229

241

253

265

277

289

301

313

325

337

349

361

Average

 Daily Produ

ction (Boe

/d)

Months

‐$2,000

‐$1,500

‐$1,000

‐$500

$0

$500

0 5 10 15 20 25 30 35 40 45 50 55 60 65 70 75 80 85 90 95 100

105

110

115

Project N

PV ($

MM)

Month

35

Half-Cycle Sensitivities

Sensitivity 1&2: Threshold WTI Oil Price at Various EURs and Well Costs

Sensitivity 3&4: ATROR at Various WTI Oil Prices and Well Costs

Source: Company Filings, HPDI and Simmons & Company Estimates.

ATROR at Various Well Costs

Source: HPDI and Simmons & Company Estimates.

ATROR at Various EURs

Source: HPDI and Simmons & Company Estimates.

1.6 1.6 1.7 1.7 1.7 1.8 1.8130 $60.29 $61.44 $62.31 $63.17 $64.04 $64.90 $66.05133 $59.11 $60.23 $61.08 $61.92 $62.76 $63.61 $64.73137 $58.02 $59.12 $59.94 $60.77 $61.59 $62.41 $63.51140 $56.99 $58.06 $58.86 $59.67 $60.47 $61.28 $62.35143 $56.00 $57.05 $57.83 $58.62 $59.40 $60.19 $61.24147 $55.06 $56.08 $56.85 $57.62 $58.39 $59.15 $60.18150 $54.13 $55.13 $55.88 $56.63 $57.38 $58.13 $59.13

WELL COST ($MM)

EUR (M

boe)

Key Assumptions: 70% Oil, 10% Gas, 20% NGLs , Gas $4.5/mcf, NGLs 45% of WTI

1.6 1.6 1.7 1.7 1.7 1.8 1.872 $60.55 $61.71 $62.58 $63.45 $64.32 $65.19 $66.3574 $59.30 $60.43 $61.27 $62.12 $62.97 $63.81 $64.9476 $58.11 $59.21 $60.04 $60.86 $61.69 $62.51 $63.6178 $56.99 $58.06 $58.86 $59.67 $60.47 $61.28 $62.3580 $55.92 $56.97 $57.75 $58.53 $59.32 $60.10 $61.1582 $54.91 $55.93 $56.69 $57.46 $58.22 $58.98 $60.0084 $53.94 $54.94 $55.68 $56.43 $57.18 $57.92 $58.92

WELL COST ($MM)

30‐Day

 IP Rate (boe

)

Key Assumptions: 70% Oil, 10% Gas, 20% NGLs , Gas $4.5/mcf, NGLs 45% of WTI

1.6 1.6 1.7 1.7 1.7 1.8 1.850 7.1% 6.8% 6.5% 6.3% 6.1% 5.8% 5.6%60 11.3% 10.8% 10.5% 10.1% 9.8% 9.5% 9.1%70 16.0% 15.3% 14.8% 14.4% 14.0% 13.5% 13.0%80 21.2% 20.3% 19.7% 19.1% 18.5% 18.0% 17.3%90 27.0% 25.8% 25.1% 24.3% 23.6% 22.9% 22.1%100 33.3% 31.9% 31.0% 30.0% 29.1% 28.3% 27.2%110 40.3% 38.6% 37.4% 36.3% 35.2% 34.2% 32.9%

WELL COST ($MM)

NYM

EX Price 

($/boe

)

Key Assumptions: 70% Oil, 10% Gas, 20% NGLs , Gas $4.5/mcf, NGLs 45% of WTI ,140 MBOE EUR

130 133 137 140 143 147 15050 5.3% 5.7% 6.0% 6.3% 6.6% 6.9% 7.2%60 8.8% 9.3% 9.7% 10.1% 10.6% 11.0% 11.5%70 12.6% 13.2% 13.8% 14.4% 15.0% 15.6% 16.2%80 16.8% 17.6% 18.3% 19.1% 19.9% 20.7% 21.5%90 21.4% 22.4% 23.3% 24.3% 25.3% 26.3% 27.3%100 26.5% 27.6% 28.8% 30.0% 31.2% 32.5% 33.8%110 31.9% 33.4% 34.8% 36.3% 37.7% 39.3% 40.8%Key Assumptions: 70% Oil, 10% Gas, 20% NGLs , Gas $4.5/mcf, NGLs 45% of WTI , $2 MM Well Cost

EUR (Mboe)

NYM

EX Price 

($/boe

)

0.0% 

5.0% 

10.0% 

15.0% 

20.0% 

25.0% 

30.0% 

35.0% 

40.0% 

45.0% 

$50.00 $60.00 $70.00 $80.00 $90.00 $100.00 $110.00

ATIRR

 (%)

NYMEX WTI Price ($/bbl)

1.6

1.6

1.7

1.7

1.7

1.8

1.8

0.0% 

5.0% 

10.0% 

15.0% 

20.0% 

25.0% 

30.0% 

35.0% 

40.0% 

45.0% 

$50.00 $60.00 $70.00 $80.00 $90.00 $100.00 $110.00

ATIRR

 (%)

NYMEX WTI Price ($/bbl)

130

133

137

140

143

147

150

36

Permian—Yeso Vertical The Permian Yeso Vertical is located in the western portion of the Permian Basin (Northwest Shelf) in New Mexico. This play is one of the most economic plays in our analysis of 18 liquids-focused plays in the U.S. However, there is not a vast amount of inventory life remaining in this play. The Yeso requires ~$43/bbl WTI (range: $45-$42/bbl) in order to generate a 10% ATROR on half cycle economics. For a 10% ATROR on a full cycle basis, this play requires ~$52/bbl WTI. Both of these scenarios are based on gas at $4.50/Mcf.

Key Assumptions/Threshold Price on Half Cycle Basis

Source: Company Filings, HPDI and Simmons & Company Estimates.

Producer Disclosed EURs and Well Costs

Source: Company Filings.

Type Curve

Source: HPDI and Simmons & Company Estimates.

NPV

Source: HPDI and Simmons & Company Estimates.

Assumptions Yeso Vertical

Well Cost ($MM) $1.6EUR Per Well (Mboe) 145.0

Implied F&D Cost ($/boe) $13.7930‐Day IP Rate (boe/d) 125.0

Production Costs ($/boe) $10.00Production Taxes ($/boe) 7%

1st Year Decline (%) ‐50%2nd Year Decline (%) ‐34%3rd Year Decline (%) ‐28%

Well % Oil 70%Oil Diff to WTI (%) ‐6%

Well % NGLs 12%Well % Gas 18%

Threshold Oil Price Necessary for 10% ATROR $43.3015% ATROR $47.5620% ATROR $51.3925% ATROR $54.89

Operator EUR (Mboe) Well Cost ($ in MMs)APA 83 1.6CXO 145 1.6

Average 114 1.6

0

20

40

60

80

100

120

140

1 13 25 37 49 61 73 85 97 109

121

133

145

157

169

181

193

205

217

229

241

253

265

277

289

301

313

325

337

349

361

Average

 Daily Produ

ction (Boe

/d)

Months

‐$2,000

‐$1,500

‐$1,000

‐$500

$0

$500

$1,000

$1,500

$2,000

0 5 10 15 20 25 30 35 40 45 50 55 60 65 70 75 80 85 90 95 100

105

110

115

Project N

PV ($

MM)

Month

37

Half-Cycle Sensitivities

Sensitivity 1&2: Threshold WTI Oil Price at Various EURs and Well Costs

Sensitivity 3&4: ATROR at Various WTI Oil Prices and EURs

Source: Company Filings, HPDI and Simmons & Company Estimates.

ATROR at Various Well Costs

Source: HPDI and Simmons & Company Estimates.

ATROR at Various EURs

Source: HPDI and Simmons & Company Estimates.

1.5 1.5 1.6 1.6 1.6 1.7 1.7130 $44.71 $45.57 $46.22 $46.87 $47.51 $48.16 $49.02135 $43.52 $44.35 $44.97 $45.59 $46.21 $46.83 $47.66140 $42.41 $43.21 $43.81 $44.41 $45.01 $45.61 $46.40145 $41.38 $42.15 $42.73 $43.30 $43.88 $44.46 $45.23150 $40.41 $41.16 $41.72 $42.28 $42.83 $43.39 $44.14155 $39.51 $40.23 $40.77 $41.31 $41.85 $42.40 $43.12160 $38.66 $39.36 $39.89 $40.41 $40.94 $41.46 $42.16

Key Assumptions: 70% Oil, 18% Gas, 12% NGLs , Gas $4.5/mcf, NGLs 45% of WTI

WELL COST ($MM)

EUR (M

boe)

1.5 1.5 1.6 1.6 1.6 1.7 1.7113 $44.45 $45.30 $45.94 $46.58 $47.22 $47.86 $48.72117 $43.35 $44.18 $44.80 $45.41 $46.03 $46.65 $47.48121 $42.33 $43.13 $43.73 $44.32 $44.92 $45.52 $46.32125 $41.38 $42.15 $42.73 $43.30 $43.88 $44.46 $45.23129 $40.48 $41.23 $41.79 $42.35 $42.91 $43.47 $44.22133 $39.64 $40.36 $40.90 $41.45 $41.99 $42.54 $43.26137 $38.84 $39.55 $40.07 $40.60 $41.13 $41.66 $42.36

Key Assumptions: 70% Oil, 18% Gas, 12% NGLs , Gas $4.5/mcf, NGLs 45% of WTI

WELL COST ($MM)

30‐Day

 IP Rate (boe

)

1.5 1.5 1.6 1.6 1.6 1.7 1.750 21.5% 20.1% 19.1% 18.1% 17.2% 16.4% 15.3%60 38.5% 36.2% 34.6% 33.0% 31.6% 30.2% 28.5%70 59.3% 55.9% 53.5% 51.3% 49.2% 47.2% 44.7%80 84.4% 79.6% 76.3% 73.2% 70.3% 67.5% 64.1%90 114.4% 107.9% 103.4% 99.2% 95.2% 91.5% 86.8%100 150.2% 141.5% 135.5% 129.8% 124.5% 119.6% 113.4%110 192.7% 181.2% 173.3% 165.9% 159.0% 152.5% 144.5%Key Assumptions: 70% Oil, 18% Gas, 12% NGLs , Gas $4.5/mcf, NGLs 45% of WTI ,145 MBOE EUR

WELL COST ($MM)

NYM

EX Price 

($/boe

)

130 135 140 145 150 155 16050 13.2% 14.8% 16.4% 18.1% 19.9% 21.7% 23.5%60 25.3% 27.8% 30.4% 33.0% 35.8% 38.7% 41.6%70 40.0% 43.6% 47.4% 51.3% 55.4% 59.6% 63.9%80 57.5% 62.5% 67.8% 73.2% 78.9% 84.8% 90.9%90 78.0% 84.8% 91.8% 99.2% 106.9% 114.9% 123.4%100 101.9% 110.7% 120.0% 129.8% 140.1% 150.9% 162.2%110 129.5% 141.0% 153.1% 165.9% 179.4% 193.7% 208.7%Key Assumptions: 70% Oil, 18% Gas, 12% NGLs , Gas $4.5/mcf, NGLs 45% of WTI , $2 MM Well Cost

EUR (Mboe)

NYM

EX Price 

($/boe

)

0.0% 

50.0% 

100.0% 

150.0% 

200.0% 

250.0% 

$50.00 $60.00 $70.00 $80.00 $90.00 $100.00 $110.00

ATIRR

 (%)

NYMEX WTI Price ($/bbl)

1.5

1.5

1.6

1.6

1.6

1.7

1.7

0.0% 

50.0% 

100.0% 

150.0% 

200.0% 

250.0% 

$50.00 $60.00 $70.00 $80.00 $90.00 $100.00 $110.00

ATIRR

 (%)

NYMEX WTI Price ($/bbl)

130

135

140

145

150

155

160

38

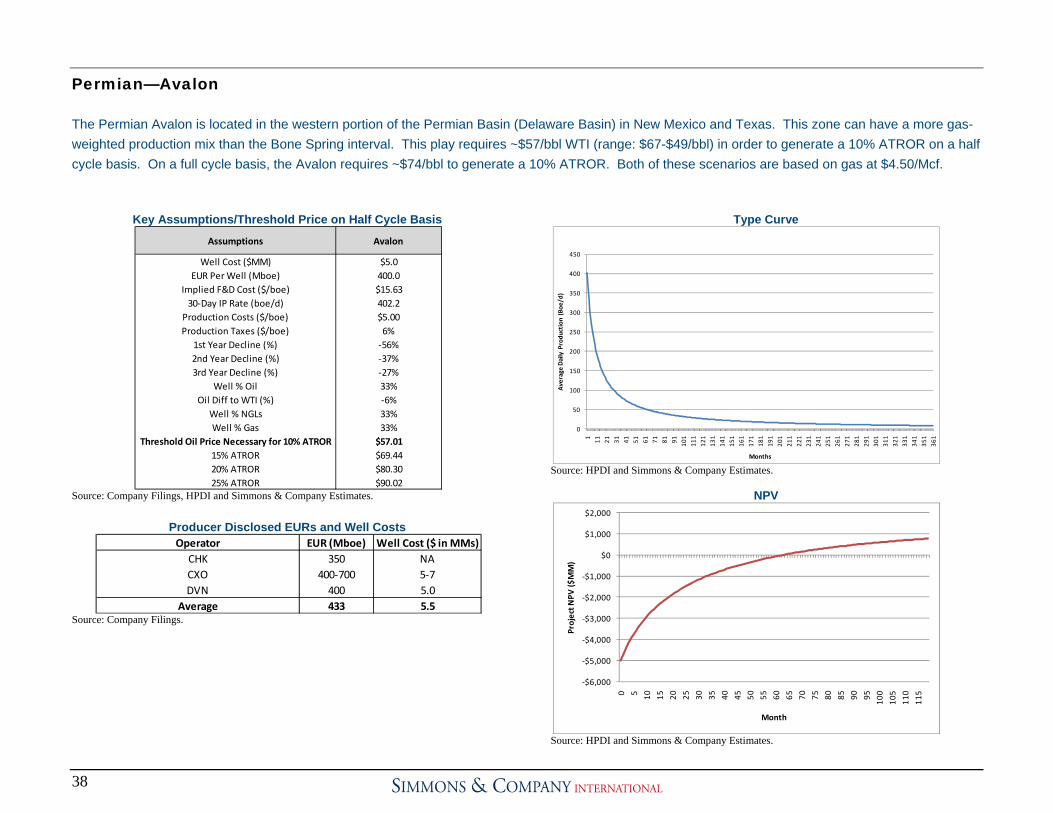
Permian—Avalon The Permian Avalon is located in the western portion of the Permian Basin (Delaware Basin) in New Mexico and Texas. This zone can have a more gas-weighted production mix than the Bone Spring interval. This play requires ~$57/bbl WTI (range: $67-$49/bbl) in order to generate a 10% ATROR on a half cycle basis. On a full cycle basis, the Avalon requires ~$74/bbl to generate a 10% ATROR. Both of these scenarios are based on gas at $4.50/Mcf.

Key Assumptions/Threshold Price on Half Cycle Basis

Source: Company Filings, HPDI and Simmons & Company Estimates.

Producer Disclosed EURs and Well Costs

Source: Company Filings.

Type Curve

Source: HPDI and Simmons & Company Estimates.

NPV

Source: HPDI and Simmons & Company Estimates.

Assumptions Avalon

Well Cost ($MM) $5.0EUR Per Well (Mboe) 400.0

Implied F&D Cost ($/boe) $15.6330‐Day IP Rate (boe/d) 402.2

Production Costs ($/boe) $5.00Production Taxes ($/boe) 6%

1st Year Decline (%) ‐56%2nd Year Decline (%) ‐37%3rd Year Decline (%) ‐27%

Well % Oil 33%Oil Diff to WTI (%) ‐6%

Well % NGLs 33%Well % Gas 33%

Threshold Oil Price Necessary for 10% ATROR $57.0115% ATROR $69.4420% ATROR $80.3025% ATROR $90.02

Operator EUR (Mboe) Well Cost ($ in MMs)CHK 350 NACXO 400‐700 5‐7DVN 400 5.0

Average 433 5.5

0

50

100

150

200

250

300

350

400

450

1 11 21 31 41 51 61 71 81 91 101

111

121

131

141

151

161

171

181

191

201

211

221

231

241

251

261

271

281

291

301

311

321

331

341

351

361

Average

 Daily Produ

ction (Boe

/d)

Months

‐$6,000

‐$5,000

‐$4,000

‐$3,000

‐$2,000

‐$1,000

$0

$1,000

$2,000

0 5 10 15 20 25 30 35 40 45 50 55 60 65 70 75 80 85 90 95 100

105

110

115

Project N

PV ($

MM)

Month

39

Half-Cycle Sensitivities

Sensitivity 1&2: Threshold WTI Oil Price at Various EURs and Well Costs

Sensitivity 3&4: ATROR at Various WTI Oil Prices and EURs

Source: Company Filings, HPDI and Simmons & Company Estimates.

ATROR at Various Well Costs

Source: HPDI and Simmons & Company Estimates.

ATROR at Various EURs

Source: HPDI and Simmons & Company Estimates.

4.0 4.3 4.7 5.0 5.3 5.7 6.0300 $61.08 $66.63 $72.01 $77.40 $82.78 $88.16 $93.71334 $54.44 $59.42 $64.26 $69.09 $73.93 $78.77 $83.75367 $49.17 $53.71 $58.11 $62.51 $66.91 $71.31 $75.84400 $44.77 $48.93 $52.97 $57.01 $61.04 $65.08 $69.24433 $41.04 $44.88 $48.61 $52.34 $56.07 $59.80 $63.65466 $37.84 $41.41 $44.88 $48.34 $51.81 $55.27 $58.84500 $34.98 $38.31 $41.54 $44.77 $48.00 $51.23 $54.56

Key Assumptions: 33% Oil, 33% Gas, 33% NGLs , Gas $4.5/mcf, NGLs 45% of WTI

WELL COST ($MM)

EUR (M

boe)

4.0 4.3 4.7 5.0 5.3 5.7 6.0302 $60.97 $66.50 $71.88 $77.25 $82.62 $88.00 $93.54336 $54.38 $59.36 $64.19 $69.02 $73.85 $78.68 $83.65369 $49.15 $53.68 $58.08 $62.47 $66.87 $71.27 $75.80402 $44.77 $48.93 $52.97 $57.01 $61.04 $65.08 $69.24435 $41.06 $44.90 $48.64 $52.37 $56.10 $59.83 $63.67468 $37.87 $41.45 $44.91 $48.38 $51.85 $55.32 $58.89502 $35.03 $38.36 $41.59 $44.82 $48.06 $51.29 $54.62

Key Assumptions: 33% Oil, 33% Gas, 33% NGLs , Gas $4.5/mcf, NGLs 45% of WTI

WELL COST ($MM)

30‐Day

 IP Rate (boe

)

4.0 4.3 4.7 5.0 5.3 5.7 6.050 12.5% 10.5% 8.8% 7.5% 6.4% 5.4% 4.6%60 18.0% 15.1% 12.9% 11.1% 9.6% 8.4% 7.3%70 24.2% 20.5% 17.6% 15.2% 13.3% 11.7% 10.2%80 31.3% 26.5% 22.8% 19.9% 17.4% 15.3% 13.5%90 39.3% 33.3% 28.7% 25.0% 21.9% 19.4% 17.2%100 48.1% 40.8% 35.2% 30.7% 26.9% 23.8% 21.2%110 58.0% 49.1% 42.4% 36.9% 32.4% 28.7% 25.5%Key Assumptions: 33% Oil, 33% Gas, 33% NGLs , Gas $4.5/mcf, NGLs 45% of WTI ,400 MBOE EUR

WELL COST ($MM)

NYM

EX Price 

($/boe

)

300 334 367 400 433 466 50050 2.6% 4.6% 6.0% 7.5% 9.1% 10.7% 12.5%60 5.5% 7.3% 9.2% 11.1% 13.3% 15.5% 18.0%70 8.0% 10.3% 12.7% 15.2% 18.0% 21.0% 24.2%80 10.7% 13.6% 16.6% 19.9% 23.4% 27.1% 31.3%90 13.7% 17.2% 21.0% 25.0% 29.4% 34.1% 39.3%100 17.0% 21.2% 25.8% 30.7% 36.0% 41.7% 48.1%110 20.6% 25.6% 31.0% 36.9% 43.3% 50.2% 58.0%Key Assumptions: 33% Oil, 33% Gas, 33% NGLs , Gas $4.5/mcf, NGLs 45% of WTI , $5 MM Well Cost

EUR (Mboe)

NYM

EX Price 

($/boe

)

0.0% 

10.0% 

20.0% 

30.0% 

40.0% 

50.0% 

60.0% 

70.0% 

$50.00 $60.00 $70.00 $80.00 $90.00 $100.00 $110.00

ATIRR

 (%)

NYMEX WTI Price ($/bbl)

4.0

4.3

4.7

5.0

5.3

5.7

6.0

0.0% 

10.0% 

20.0% 

30.0% 

40.0% 

50.0% 

60.0% 

70.0% 

$50.00 $60.00 $70.00 $80.00 $90.00 $100.00 $110.00

ATIRR

 (%)

NYMEX WTI Price ($/bbl)

300

334

367

400

433

466

500

40

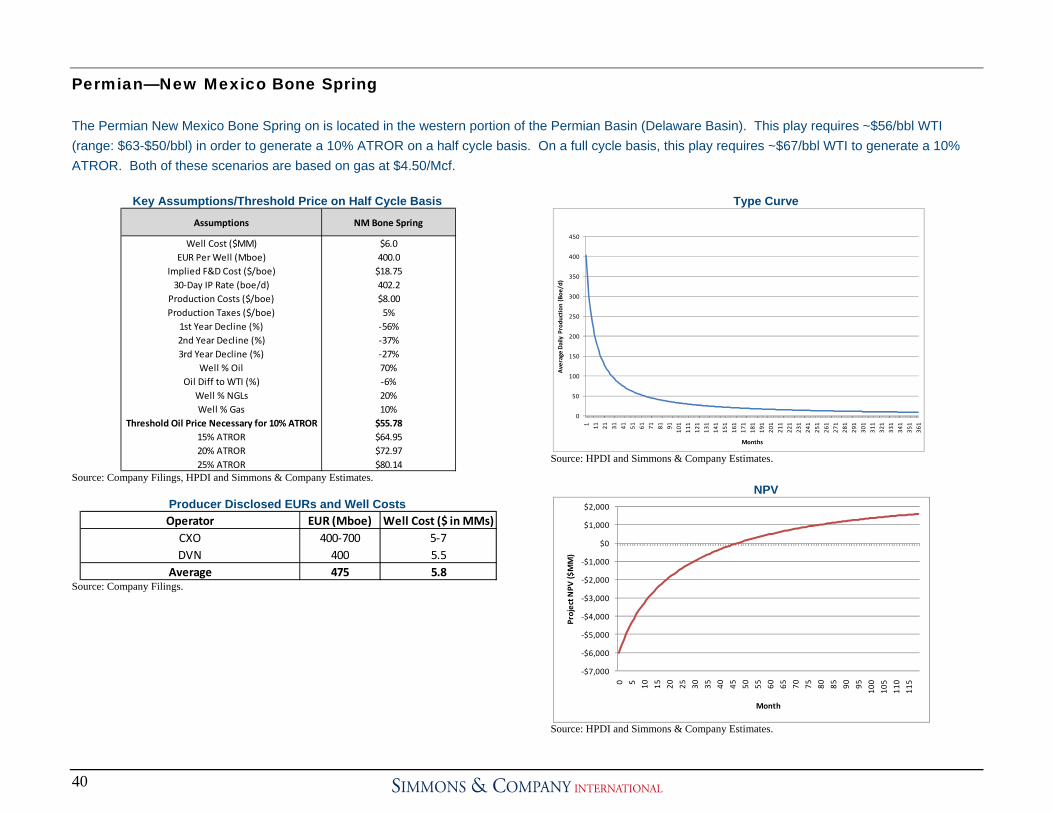
Permian—New Mexico Bone Spring The Permian New Mexico Bone Spring on is located in the western portion of the Permian Basin (Delaware Basin). This play requires ~$56/bbl WTI (range: $63-$50/bbl) in order to generate a 10% ATROR on a half cycle basis. On a full cycle basis, this play requires ~$67/bbl WTI to generate a 10% ATROR. Both of these scenarios are based on gas at $4.50/Mcf.

Key Assumptions/Threshold Price on Half Cycle Basis

Source: Company Filings, HPDI and Simmons & Company Estimates.

Producer Disclosed EURs and Well Costs

Source: Company Filings.

Type Curve

Source: HPDI and Simmons & Company Estimates.

NPV

Source: HPDI and Simmons & Company Estimates.

Assumptions NM Bone Spring

Well Cost ($MM) $6.0EUR Per Well (Mboe) 400.0

Implied F&D Cost ($/boe) $18.7530‐Day IP Rate (boe/d) 402.2

Production Costs ($/boe) $8.00Production Taxes ($/boe) 5%

1st Year Decline (%) ‐56%2nd Year Decline (%) ‐37%3rd Year Decline (%) ‐27%

Well % Oil 70%Oil Diff to WTI (%) ‐6%

Well % NGLs 20%Well % Gas 10%

Threshold Oil Price Necessary for 10% ATROR $55.7815% ATROR $64.9520% ATROR $72.9725% ATROR $80.14

Operator EUR (Mboe) Well Cost ($ in MMs)CXO 400‐700 5‐7DVN 400 5.5

Average 475 5.8

0

50

100

150

200

250

300

350

400

450

1 11 21 31 41 51 61 71 81 91 101

111

121

131

141

151

161

171

181

191

201

211

221

231

241

251

261

271

281

291

301

311

321

331

341

351

361

Average

 Daily Produ

ction (Boe

/d)

Months

‐$7,000

‐$6,000

‐$5,000

‐$4,000

‐$3,000

‐$2,000

‐$1,000

$0

$1,000

$2,000

0 5 10 15 20 25 30 35 40 45 50 55 60 65 70 75 80 85 90 95 100

105

110

115

Project N

PV ($

MM)

Month

41

Half-Cycle Sensitivities

Sensitivity 1&2: Threshold WTI Oil Price at Various EURs and Well Costs

Sensitivity 3&4: ATROR at Various WTI Oil Prices and EURs

Source: Company Filings, HPDI and Simmons & Company Estimates.

ATROR at Various Well Costs

Source: HPDI and Simmons & Company Estimates.

ATROR at Various EURs

Source: HPDI and Simmons & Company Estimates.

5.0 5.3 5.7 6.0 6.3 6.7 7.0300 $60.79 $64.20 $67.51 $70.83 $74.14 $77.45 $80.86334 $55.69 $58.75 $61.72 $64.70 $67.67 $70.65 $73.71367 $51.63 $54.42 $57.13 $59.84 $62.54 $65.25 $68.04400 $48.25 $50.81 $53.29 $55.78 $58.26 $60.74 $63.30433 $45.38 $47.75 $50.04 $52.34 $54.63 $56.92 $59.29466 $42.92 $45.12 $47.25 $49.38 $51.51 $53.64 $55.84500 $40.73 $42.77 $44.76 $46.75 $48.73 $50.72 $52.77

Key Assumptions: 70% Oil, 10% Gas, 20% NGLs , Gas $4.5/mcf, NGLs 45% of WTI

WELL COST ($MM)

EUR (M

boe)

5.0 5.3 5.7 6.0 6.3 6.7 7.0302 $60.70 $64.11 $67.41 $70.72 $74.02 $77.33 $80.73336 $55.64 $58.70 $61.67 $64.64 $67.61 $70.58 $73.64369 $51.61 $54.40 $57.11 $59.81 $62.52 $65.22 $68.01402 $48.25 $50.81 $53.29 $55.78 $58.26 $60.74 $63.30435 $45.40 $47.76 $50.06 $52.35 $54.65 $56.94 $59.31468 $42.95 $45.15 $47.28 $49.41 $51.54 $53.68 $55.88502 $40.76 $42.81 $44.80 $46.79 $48.77 $50.76 $52.81

Key Assumptions: 70% Oil, 10% Gas, 20% NGLs , Gas $4.5/mcf, NGLs 45% of WTI

WELL COST ($MM)

30‐Day

 IP Rate (boe

)

5.0 5.3 5.7 6.0 6.3 6.7 7.050 11.1% 9.5% 8.3% 7.2% 6.3% 5.5% 4.7%60 18.0% 15.7% 13.8% 12.2% 10.8% 9.7% 8.6%70 26.3% 23.0% 20.3% 18.1% 16.2% 14.5% 13.0%80 36.0% 31.5% 27.9% 24.9% 22.3% 20.1% 18.1%90 47.3% 41.4% 36.7% 32.7% 29.4% 26.5% 23.9%100 60.1% 52.6% 46.6% 41.6% 37.3% 33.7% 30.4%110 74.7% 65.3% 57.8% 51.5% 46.2% 41.7% 37.7%Key Assumptions: 70% Oil, 10% Gas, 20% NGLs , Gas $4.5/mcf, NGLs 45% of WTI ,400 MBOE EUR

WELL COST ($MM)

NYM

EX Price 

($/boe

)

300 334 367 400 433 466 50050 2.3% 4.4% 5.8% 7.2% 8.7% 10.4% 12.1%60 6.2% 8.1% 10.1% 12.2% 14.5% 16.9% 19.6%70 9.7% 12.3% 15.1% 18.1% 21.3% 24.8% 28.6%80 13.7% 17.2% 20.9% 24.9% 29.2% 33.9% 39.1%90 18.2% 22.7% 27.5% 32.7% 38.4% 44.5% 51.3%100 23.2% 28.9% 34.9% 41.6% 48.8% 56.6% 65.4%110 28.8% 35.8% 43.3% 51.5% 60.5% 70.3% 81.3%Key Assumptions: 70% Oil, 10% Gas, 20% NGLs , Gas $4.5/mcf, NGLs 45% of WTI , $6 MM Well Cost

EUR (Mboe)

NYM

EX Price 

($/boe

)

0.0% 

10.0% 

20.0% 

30.0% 

40.0% 

50.0% 

60.0% 

70.0% 

80.0% 

$50.00 $60.00 $70.00 $80.00 $90.00 $100.00 $110.00

ATIRR

 (%)

NYMEX WTI Price ($/bbl)

5.0

5.3

5.7

6.0

6.3

6.7

7.0

0.0% 

10.0% 

20.0% 

30.0% 

40.0% 

50.0% 

60.0% 

70.0% 

80.0% 

90.0% 

$50.00 $60.00 $70.00 $80.00 $90.00 $100.00 $110.00

ATIRR

 (%)

NYMEX WTI Price ($/bbl)

300

334

367

400

433

466

500

42

Permian—Texas Bone Spring The Permian Texas Bone Spring is located in the western portion of the Permian Basin (Delaware Basin). This play requires ~$46/bbl WTI (range: $50-$42/bbl) in order to generate a 10% ATROR on a half cycle basis. On a full cycle basis, ~$55/bbl WTI is required to generate a 10% ATROR. Both of these scenarios are based on gas at $4.50/Mcf.

Key Assumptions/Threshold Price on Half Cycle Basis

Source: Company Filings, HPDI and Simmons & Company Estimates.

Producer Disclosed EURs and Well Costs

Source: Company Filings.

Type Curve

Source: HPDI and Simmons & Company Estimates.

NPV

Source: HPDI and Simmons & Company Estimates.

Assumptions TX Bone Spring

Well Cost ($MM) $7.0EUR Per Well (Mboe) 600.0

Implied F&D Cost ($/boe) $14.5830‐Day IP Rate (boe/d) 603.3

Production Costs ($/boe) $8.00Production Taxes ($/boe) 5%

1st Year Decline (%) ‐56%2nd Year Decline (%) ‐37%3rd Year Decline (%) ‐27%

Well % Oil 70%Oil Diff to WTI (%) ‐6%

Well % NGLs 20%Well % Gas 10%

Threshold Oil Price Necessary for 10% ATROR $45.7415% ATROR $52.8820% ATROR $59.1125% ATROR $64.69

Operator EUR (Mboe) Well Cost ($ in MMs)CXO 400‐700 5‐7HK NA 7.5DVN 600 7.0

Average 575 6.8

0

100

200

300

400

500

600

700

1 11 21 31 41 51 61 71 81 91 101

111

121

131

141

151

161

171

181

191

201

211

221

231

241

251

261

271

281

291

301

311

321

331

341

351

361

Average

 Daily Produ

ction (Boe

/d)

Months

‐$8,000

‐$6,000

‐$4,000

‐$2,000

$0

$2,000

$4,000

$6,000

0 5 10 15 20 25 30 35 40 45 50 55 60 65 70 75 80 85 90 95 100

105

110

115

Project N

PV ($

MM)

Month

43

Half-Cycle Sensitivities

Sensitivity 1&2: Threshold WTI Oil Price at Various EURs and Well Costs

Sensitivity 3&4: ATROR at Various WTI Oil Prices and EURs

Source: Company Filings, HPDI and Simmons & Company Estimates.

ATROR at Various Well Costs

Source: HPDI and Simmons & Company Estimates.

ATROR at Various EURs

Source: HPDI and Simmons & Company Estimates.

6.0 6.3 6.7 7.0 7.3 7.7 8.0500 $46.75 $48.79 $50.78 $52.77 $54.75 $56.74 $58.79534 $44.45 $46.36 $48.22 $50.08 $51.94 $53.80 $55.72567 $42.48 $44.28 $46.04 $47.79 $49.54 $51.29 $53.10600 $40.73 $42.43 $44.09 $45.74 $47.40 $49.05 $50.76633 $39.16 $40.77 $42.34 $43.91 $45.48 $47.05 $48.67666 $37.74 $39.28 $40.77 $42.26 $43.75 $45.25 $46.78700 $36.43 $37.89 $39.31 $40.73 $42.15 $43.56 $45.03

Key Assumptions: 70% Oil, 10% Gas, 20% NGLs , Gas $4.5/mcf, NGLs 45% of WTI

WELL COST ($MM)

EUR (M

boe)

6.0 6.3 6.7 7.0 7.3 7.7 8.0503 $46.71 $48.75 $50.74 $52.72 $54.71 $56.69 $58.73537 $44.42 $46.34 $48.20 $50.06 $51.92 $53.77 $55.69570 $42.47 $44.27 $46.02 $47.78 $49.53 $51.28 $53.08603 $40.73 $42.43 $44.09 $45.74 $47.40 $49.05 $50.76636 $39.17 $40.78 $42.35 $43.92 $45.49 $47.06 $48.68669 $37.76 $39.30 $40.79 $42.28 $43.77 $45.26 $46.80703 $36.45 $37.91 $39.33 $40.75 $42.17 $43.59 $45.05

Key Assumptions: 70% Oil, 10% Gas, 20% NGLs , Gas $4.5/mcf, NGLs 45% of WTI

WELL COST ($MM)

30‐Day

 IP Rate (boe

)

6.0 6.3 6.7 7.0 7.3 7.7 8.050 17.9% 15.9% 14.3% 12.9% 11.7% 10.6% 9.6%60 28.4% 25.4% 22.9% 20.8% 18.9% 17.2% 15.7%70 41.3% 36.9% 33.3% 30.2% 27.5% 25.2% 23.0%80 56.5% 50.6% 45.6% 41.4% 37.7% 34.5% 31.6%90 74.5% 66.5% 60.0% 54.4% 49.5% 45.3% 41.5%100 95.4% 85.0% 76.5% 69.2% 63.0% 57.6% 52.7%110 119.8% 106.4% 95.5% 86.3% 78.4% 71.6% 65.5%Key Assumptions: 70% Oil, 10% Gas, 20% NGLs , Gas $4.5/mcf, NGLs 45% of WTI ,600 MBOE EUR

WELL COST ($MM)

NYM

EX Price 

($/boe

)

500 534 567 600 633 666 70050 8.5% 10.0% 11.4% 12.9% 14.5% 16.1% 17.9%60 14.2% 16.3% 18.5% 20.8% 23.2% 25.7% 28.4%70 20.9% 23.9% 27.0% 30.2% 33.7% 37.3% 41.3%80 28.6% 32.7% 36.9% 41.4% 46.1% 51.1% 56.5%90 37.6% 42.9% 48.5% 54.4% 60.6% 67.2% 74.5%100 47.8% 54.6% 61.7% 69.2% 77.3% 86.0% 95.4%110 59.2% 67.8% 76.7% 86.3% 96.5% 107.6% 119.8%Key Assumptions: 70% Oil, 10% Gas, 20% NGLs , Gas $4.5/mcf, NGLs 45% of WTI , $7 MM Well Cost

EUR (Mboe)

NYM

EX Price 

($/boe

)

0.0% 

20.0% 

40.0% 

60.0% 

80.0% 

100.0% 

120.0% 

140.0% 

$50.00 $60.00 $70.00 $80.00 $90.00 $100.00 $110.00

ATIRR

 (%)

NYMEX WTI Price ($/bbl)

6.0

6.3

6.7

7.0

7.3

7.7

8.0

0.0% 

20.0% 

40.0% 

60.0% 

80.0% 

100.0% 

120.0% 

140.0% 

$50.00 $60.00 $70.00 $80.00 $90.00 $100.00 $110.00

ATIRR

 (%)

NYMEX WTI Price ($/bbl)

500

534

567

600

633

666

700

44

Permian—Wolfbone Vertical The Permian Wolfbone Vertical is located in the western portion of the Permian Basin (Delaware Basin) in New Mexico and Texas. This play requires ~$55/bbl WTI (range: $63-$48/bbl) in order to generate a 10% ATROR on half cycle economics. On a full cycle basis, the play requires ~$64/bbl to generate a 10% ATROR. Both of these scenarios are based on gas at $4.50/Mcf.

Key Assumptions/Threshold Price on Half Cycle Basis

Source: Company Filings, HPDI and Simmons & Company Estimates.

Producer Disclosed EURs and Well Costs

Source: Company Filings.

Type Curve

Source: HPDI and Simmons & Company Estimates.

NPV

Source: HPDI and Simmons & Company Estimates.

Assumptions Wolfbone Vertical

Well Cost ($MM) $5.0EUR Per Well (Mboe) 300.0

Implied F&D Cost ($/boe) $20.8330‐Day IP Rate (boe/d) 325.0

Production Costs ($/boe) $10.00Production Taxes ($/boe) 5%

1st Year Decline (%) ‐56%2nd Year Decline (%) ‐38%3rd Year Decline (%) ‐31%

Well % Oil 70%Oil Diff to WTI (%) ‐6%

Well % NGLs 15%Well % Gas 15%

Threshold Oil Price Necessary for 10% ATROR $54.7715% ATROR $59.8220% ATROR $64.3425% ATROR $68.46

Operator EUR (Mboe) Well Cost ($ in MMs)CXO 200‐400 4‐6HK NA 3.0

Average 300 4.0

0

50

100

150

200

250

300

350

1 13 25 37 49 61 73 85 97 109

121

133

145

157

169

181

193

205

217

229

241

253

265

277

289

301

313

325

337

349

361

Average

 Daily Produ

ction (Boe

/d)

Months

‐$6,000

‐$5,000

‐$4,000

‐$3,000

‐$2,000

‐$1,000

$0

$1,000

$2,000

$3,000

0 5 10 15 20 25 30 35 40 45 50 55 60 65 70 75 80 85 90 95 100

105

110

115

Project N

PV ($

MM)

Month

45

Half-Cycle Sensitivities

Sensitivity 1&2: Threshold WTI Oil Price at Various EURs and Well Costs

Sensitivity 3&4: ATROR at Various WTI Oil Prices and EURs

Source: Company Filings, HPDI and Simmons & Company Estimates.

ATROR at Various Well Costs

Source: HPDI and Simmons & Company Estimates.

ATROR at Various EURs

Source: HPDI and Simmons & Company Estimates.

4.0 4.3 4.7 5.0 5.3 5.7 6.0200 $63.16 $67.44 $71.59 $75.74 $79.89 $84.04 $88.32234 $55.85 $59.50 $63.05 $66.60 $70.15 $73.70 $77.35267 $50.53 $53.74 $56.85 $59.96 $63.07 $66.18 $69.38300 $46.39 $49.24 $52.01 $54.77 $57.54 $60.31 $63.16333 $43.06 $45.63 $48.12 $50.62 $53.11 $55.60 $58.17366 $40.34 $42.67 $44.94 $47.21 $49.48 $51.75 $54.09400 $38.00 $40.14 $42.21 $44.29 $46.37 $48.44 $50.58

Key Assumptions: 70% Oil, 15% Gas, 15% NGLs , Gas $4.5/mcf, NGLs 45% of WTI

WELL COST ($MM)

EUR (M

boe)

4.0 4.3 4.7 5.0 5.3 5.7 6.0225 $61.30 $65.42 $69.41 $73.41 $77.41 $81.41 $85.53259 $54.94 $58.51 $61.99 $65.46 $68.93 $72.41 $75.98292 $50.18 $53.35 $56.43 $59.51 $62.59 $65.67 $68.85325 $46.39 $49.24 $52.01 $54.77 $57.54 $60.31 $63.16358 $43.29 $45.88 $48.40 $50.91 $53.42 $55.93 $58.52391 $40.72 $43.09 $45.39 $47.70 $50.00 $52.30 $54.67425 $38.49 $40.67 $42.79 $44.91 $47.02 $49.14 $51.32

Key Assumptions: 70% Oil, 15% Gas, 15% NGLs , Gas $4.5/mcf, NGLs 45% of WTI

WELL COST ($MM)

30‐Day

 IP Rate (boe

)

4.0 4.3 4.7 5.0 5.3 5.7 6.050 14.4% 10.8% 8.1% 5.8% 4.0% 2.5% 1.2%60 29.3% 23.4% 18.8% 15.2% 12.2% 9.7% 7.6%70 48.1% 39.2% 32.4% 27.0% 22.5% 18.8% 15.7%80 71.0% 58.4% 48.9% 41.2% 35.0% 29.9% 25.4%90 98.6% 81.3% 68.3% 58.0% 49.7% 42.8% 36.9%100 131.7% 108.5% 91.2% 77.6% 66.7% 57.7% 50.1%110 171.2% 140.5% 117.9% 100.3% 86.3% 74.8% 65.1%Key Assumptions: 70% Oil, 15% Gas, 15% NGLs , Gas $4.5/mcf, NGLs 45% of WTI ,300 MBOE EUR

WELL COST ($MM)

NYM

EX Price 

($/boe

)

200 234 267 300 333 366 40050 (2.8%) (0.2%) 2.7% 5.8% 9.4% 13.3% 17.8%60 1.5% 5.5% 10.0% 15.2% 21.0% 27.5% 34.8%70 6.6% 12.5% 19.3% 27.0% 35.6% 45.3% 56.3%80 12.7% 21.0% 30.5% 41.2% 53.4% 67.0% 82.7%90 19.9% 31.0% 43.6% 58.0% 74.5% 93.1% 114.9%100 28.2% 42.5% 58.8% 77.6% 99.3% 124.3% 153.8%110 37.6% 55.6% 76.2% 100.3% 128.5% 161.3% 200.7%Key Assumptions: 70% Oil, 15% Gas, 15% NGLs , Gas $4.5/mcf, NGLs 45% of WTI , $5 MM Well Cost

EUR (Mboe)

NYM

EX Price 

($/boe

)

0.0% 

20.0% 

40.0% 

60.0% 

80.0% 

100.0% 

120.0% 

140.0% 

160.0% 

180.0% 

$50.00 $60.00 $70.00 $80.00 $90.00 $100.00 $110.00

ATIRR

 (%)

NYMEX WTI Price ($/bbl)

4.0

4.3

4.7

5.0

5.3

5.7

6.0

(50.0%)

0.0% 

50.0% 

100.0% 

150.0% 

200.0% 

250.0% 

$50.00 $60.00 $70.00 $80.00 $90.00 $100.00 $110.00

ATIRR

 (%)

NYMEX WTI Price ($/bbl)

200

234

267

300

333

366

400

46

Uinta--Monument Butte Vertical (Green River) The Monument Butte Vertical (Green River) play is located in the Uinta Basin in Utah. This is one of the most economic plays in our analysis of 18 liquids-focused plays in the U.S. This play requires ~$45/bbl WTI (range: $49-$41/bbl) in order to generate a 10% ATROR on half cycle economics. On a full cycle basis, this play requires ~$55/bbl to generate a 10% ATROR. Both of these scenarios are based on gas at $4.50/Mcf.

Key Assumptions/Threshold Price on Half Cycle Basis

Source: Company Filings, HPDI and Simmons & Company Estimates.

Producer Disclosed EURs and Well Costs

Source: Company Filings.

Type Curve

Source: HPDI and Simmons & Company Estimates.

NPV

Source: HPDI and Simmons & Company Estimates.

AssumptionsMonument Butte 

VerticalWell Cost ($MM) $0.9

EUR Per Well (Mboe) 75.0Implied F&D Cost ($/boe) $15.5030‐Day IP Rate (boe/d) 82.0

Production Costs ($/boe) $10.00Production Taxes ($/boe) 6%

1st Year Decline (%) ‐38%2nd Year Decline (%) ‐35%3rd Year Decline (%) ‐32%

Well % Oil 92%Oil Diff to WTI (%) ‐22%

Well % NGLs 0%Well % Gas 8%

Threshold Oil Price Necessary for 10% ATROR $44.7515% ATROR $49.2320% ATROR $53.4025% ATROR $57.33

Operator EUR (Mboe) Well Cost ($ in MMs)NFX 75 0.93

0

10

20

30

40

50

60

70

80

90

1 11 21 31 41 51 61 71 81 91 101

111

121

131

141

151

161

171

181

191

201

211

221

231

241

251

261

271

281

291

301

311

321

331

341

351

361

Average

 Daily Produ

ction (Boe

/d)

Months

‐$1,200

‐$1,000

‐$800

‐$600

‐$400

‐$200

$0

$200

$400

$600

$800

0 5 10 15 20 25 30 35 40 45 50 55 60 65 70 75 80 85 90 95 100

105

110

115

Project N

PV ($

MM)

Month

47

Half-Cycle Sensitivities

Sensitivity 1&2: Threshold WTI Oil Price at Various EURs and Well Costs

Sensitivity 3&4: ATROR at Various WTI Oil Prices and EURs

Source: Company Filings, HPDI and Simmons & Company Estimates.

ATROR at Various Well Costs

Source: HPDI and Simmons & Company Estimates.

ATROR at Various EURs

Source: HPDI and Simmons & Company Estimates.

0.9 0.9 0.9 0.9 1.0 1.0 1.050 $55.46 $56.67 $57.93 $59.19 $60.45 $61.70 $62.9159 $49.42 $50.45 $51.52 $52.58 $53.65 $54.71 $55.7467 $45.42 $46.32 $47.26 $48.20 $49.14 $50.08 $50.9875 $42.27 $43.07 $43.91 $44.75 $45.59 $46.43 $47.2383 $39.72 $40.45 $41.21 $41.97 $42.73 $43.48 $44.2191 $37.63 $38.29 $38.98 $39.67 $40.36 $41.06 $41.72100 $35.67 $36.27 $36.90 $37.53 $38.16 $38.79 $39.39

Key Assumptions: 92% Oil, 8% Gas, 0% NGLs , Gas $4.5/mcf, NGLs 45% of WTI

EUR (M

boe)

WELL COST ($MM)

0.9 0.9 0.9 0.9 1.0 1.0 1.022 $114.25 $117.25 $120.38 $123.50 $126.63 $129.75 $132.7642 $67.40 $68.98 $70.62 $72.25 $73.89 $75.53 $77.1062 $50.78 $51.85 $52.96 $54.07 $55.17 $56.28 $57.3582 $42.27 $43.07 $43.91 $44.75 $45.59 $46.43 $47.23102 $37.09 $37.74 $38.41 $39.09 $39.76 $40.44 $41.09122 $33.61 $34.16 $34.72 $35.28 $35.85 $36.41 $36.95142 $31.12 $31.58 $32.07 $32.55 $33.03 $33.52 $33.98

Key Assumptions: 92% Oil, 8% Gas, 0% NGLs , Gas $4.5/mcf, NGLs 45% of WTI

WELL COST ($MM)

30‐Day

 IP Rate (boe

)

0.9 0.9 0.9 0.9 1.0 1.0 1.050 19.8% 18.4% 17.1% 15.9% 14.8% 13.7% 12.8%60 34.4% 32.3% 30.4% 28.6% 26.9% 25.3% 23.9%70 51.3% 48.4% 45.6% 43.1% 40.8% 38.6% 36.6%80 70.7% 66.8% 63.1% 59.7% 56.5% 53.6% 51.0%90 93.0% 87.8% 82.9% 78.4% 74.3% 70.5% 67.1%100 118.4% 111.7% 105.4% 99.7% 94.4% 89.5% 85.2%110 147.4% 138.9% 130.9% 123.6% 117.0% 110.9% 105.5%

Key Assumptions: 92% Oil, 8% Gas, 0% NGLs , Gas $4.5/mcf, NGLs 45% of WTI ,75 MBOE EUR

WELL COST ($MM)

NYM

EX Price 

($/boe

)

50 59 67 75 83 91 10050 0.9% 6.9% 11.8% 15.9% 20.3% 24.9% 30.4%60 10.6% 16.6% 22.4% 28.6% 35.2% 42.2% 50.6%70 18.2% 26.5% 34.5% 43.1% 52.4% 62.4% 74.6%80 26.7% 37.5% 48.1% 59.7% 72.3% 85.9% 102.8%90 36.0% 49.8% 63.4% 78.4% 95.0% 113.2% 135.9%100 46.2% 63.3% 80.5% 99.7% 121.0% 144.8% 174.9%110 57.3% 78.3% 99.6% 123.6% 150.8% 181.5% 220.8%Key Assumptions: 92% Oil, 8% Gas, 0% NGLs , Gas $4.5/mcf, NGLs 45% of WTI , $1 MM Well Cost

EUR (Mboe)

NYM

EX Price 

($/boe

)

0.0% 

20.0% 

40.0% 

60.0% 

80.0% 

100.0% 

120.0% 

140.0% 

160.0% 

$50.00 $60.00 $70.00 $80.00 $90.00 $100.00 $110.00

ATIRR

 (%)

NYMEX WTI Price ($/bbl)

0.9

0.9

0.9

0.9

1.0

1.0

1.0

0.0% 

50.0% 

100.0% 

150.0% 

200.0% 

250.0% 

$50.00 $60.00 $70.00 $80.00 $90.00 $100.00 $110.00

ATIRR

 (%)

NYMEX WTI Price ($/bbl)

50

59

67

75

83

91

100

48

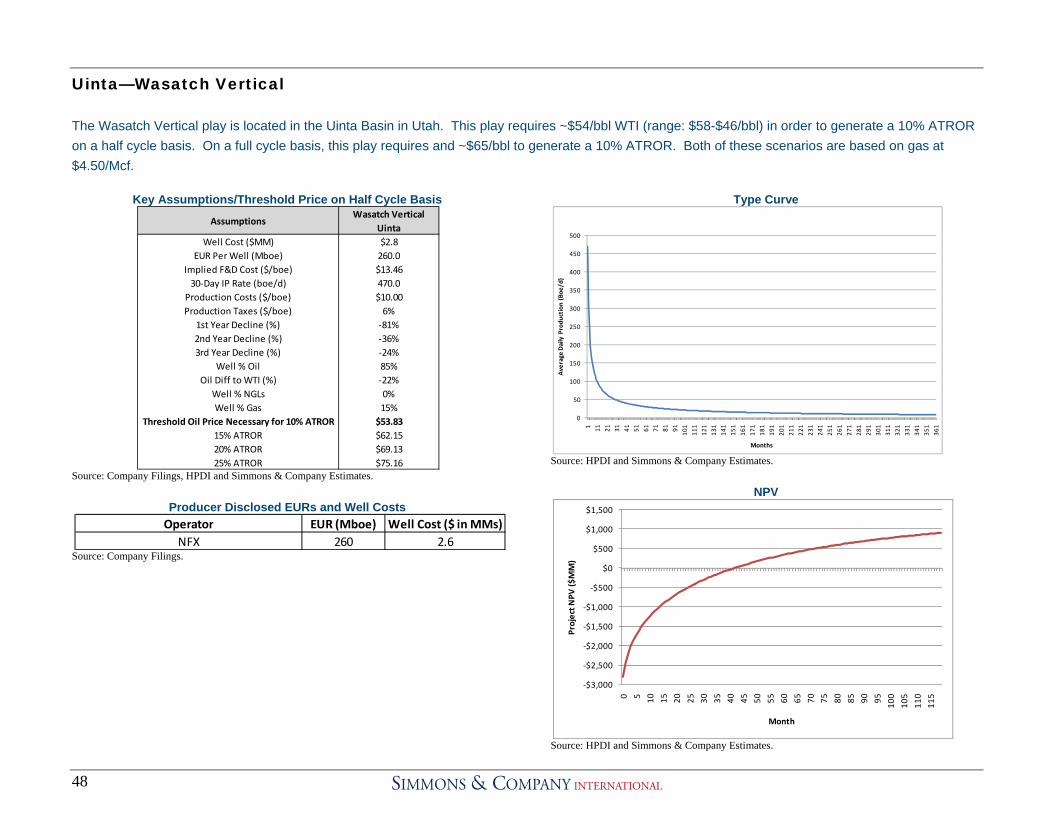
Uinta—Wasatch Vertical The Wasatch Vertical play is located in the Uinta Basin in Utah. This play requires ~$54/bbl WTI (range: $58-$46/bbl) in order to generate a 10% ATROR on a half cycle basis. On a full cycle basis, this play requires and ~$65/bbl to generate a 10% ATROR. Both of these scenarios are based on gas at $4.50/Mcf.

Key Assumptions/Threshold Price on Half Cycle Basis

Source: Company Filings, HPDI and Simmons & Company Estimates.

Producer Disclosed EURs and Well Costs

Source: Company Filings.

Type Curve

Source: HPDI and Simmons & Company Estimates.

NPV

Source: HPDI and Simmons & Company Estimates.

AssumptionsWasatch Vertical 

UintaWell Cost ($MM) $2.8

EUR Per Well (Mboe) 260.0Implied F&D Cost ($/boe) $13.4630‐Day IP Rate (boe/d) 470.0

Production Costs ($/boe) $10.00Production Taxes ($/boe) 6%

1st Year Decline (%) ‐81%2nd Year Decline (%) ‐36%3rd Year Decline (%) ‐24%

Well % Oil 85%Oil Diff to WTI (%) ‐22%

Well % NGLs 0%Well % Gas 15%

Threshold Oil Price Necessary for 10% ATROR $53.8315% ATROR $62.1520% ATROR $69.1325% ATROR $75.16

Operator EUR (Mboe) Well Cost ($ in MMs)NFX 260 2.6

0

50

100

150

200

250

300

350

400

450

500

1 11 21 31 41 51 61 71 81 91 101

111

121

131

141

151

161

171

181

191

201

211

221

231

241

251

261

271

281

291

301

311

321

331

341

351

361

Average

 Daily Produ

ction (Boe

/d)

Months

‐$3,000

‐$2,500

‐$2,000

‐$1,500

‐$1,000

‐$500

$0

$500

$1,000

$1,500

0 5 10 15 20 25 30 35 40 45 50 55 60 65 70 75 80 85 90 95 100

105

110

115

Project N

PV ($

MM)

Month

49

Half-Cycle Sensitivities

Sensitivity 1&2: Threshold WTI Oil Price at Various EURs and Well Costs

Sensitivity 3&4: ATROR at Various WTI Oil Prices and Well Costs

Source: Company Filings, HPDI and Simmons & Company Estimates.

ATROR at Various Well Costs

Source: HPDI and Simmons & Company Estimates.

ATROR at Various EURs

Source: HPDI and Simmons & Company Estimates.

1.6 2.0 2.4 2.8 2.9 3.1 3.2210 $42.40 $49.31 $56.23 $63.14 $65.38 $67.63 $70.05228 $40.22 $46.59 $52.95 $59.32 $61.39 $63.46 $65.68244 $38.55 $44.50 $50.45 $56.40 $58.33 $60.26 $62.34260 $37.09 $42.67 $48.25 $53.83 $55.65 $57.46 $59.42276 $35.79 $41.05 $46.31 $51.57 $53.28 $54.99 $56.83292 $34.64 $39.61 $44.58 $49.55 $51.17 $52.78 $54.52310 $33.49 $38.17 $42.85 $47.53 $49.05 $50.57 $52.21

WELL COST ($MM)

EUR (M

boe)

Key Assumptions: 85% Oil, 15% Gas, 0% NGLs , Gas $4.5/mcf, NGLs 45% of WTI

1.6 2.0 2.4 2.8 2.9 3.1 3.2445 $38.34 $44.24 $50.13 $56.03 $57.94 $59.86 $61.92454 $37.87 $43.65 $49.43 $55.21 $57.09 $58.97 $60.99462 $37.47 $43.15 $48.83 $54.51 $56.36 $58.20 $60.19470 $37.09 $42.67 $48.25 $53.83 $55.65 $57.46 $59.42478 $36.71 $42.20 $47.69 $53.18 $54.96 $56.75 $58.67486 $36.35 $41.75 $47.15 $52.55 $54.30 $56.06 $57.95495 $35.96 $41.26 $46.56 $51.86 $53.58 $55.31 $57.16

WELL COST ($MM)

30‐Day

 IP Rate (boe

)

Key Assumptions: 85% Oil, 15% Gas, 0% NGLs , Gas $4.5/mcf, NGLs 45% of WTI

1.6 2.0 2.4 2.8 2.9 3.1 3.250 26.1% 16.3% 11.1% 8.0% 7.2% 6.5% 5.9%60 45.5% 27.7% 18.8% 13.6% 12.4% 11.3% 10.3%70 72.9% 43.1% 28.8% 20.7% 18.8% 17.2% 15.6%80 111.2% 63.5% 41.6% 29.5% 26.8% 24.4% 22.2%90 164.7% 90.3% 57.8% 40.5% 36.6% 33.2% 30.1%100 239.6% 125.2% 78.1% 53.9% 48.5% 43.9% 39.7%110 345.6% 170.7% 103.6% 70.3% 63.0% 56.8% 51.2%

WELL COST ($MM)

NYM

EX Price 

($/boe

)

Key Assumptions: 85% Oil, 15% Gas, 0% NGLs , Gas $4.5/mcf, NGLs 45% of WTI ,260 MBOE EUR

210 228 244 260 276 292 31050 4.8% 5.9% 6.9% 8.0% 9.1% 10.3% 11.7%60 8.7% 10.3% 11.9% 13.6% 15.4% 17.3% 19.7%70 13.2% 15.7% 18.1% 20.7% 23.5% 26.5% 30.1%80 18.7% 22.3% 25.7% 29.5% 33.7% 38.1% 43.7%90 25.3% 30.3% 35.1% 40.5% 46.4% 52.8% 60.8%100 33.2% 39.9% 46.5% 53.9% 62.1% 71.1% 82.5%110 42.6% 51.4% 60.3% 70.3% 81.4% 93.9% 109.6%

Key Assumptions: 85% Oil, 15% Gas, 0% NGLs , Gas $4.5/mcf, NGLs 45% of WTI , $3 MM Well Cost

EUR (Mboe)

NYM

EX Price 

($/boe

)

0.0% 

50.0% 

100.0% 

150.0% 

200.0% 

250.0% 

300.0% 

350.0% 

400.0% 

$50.00 $60.00 $70.00 $80.00 $90.00 $100.00 $110.00

ATIRR

 (%)

NYMEX WTI Price ($/bbl)

1.6

2.0

2.4

2.8

2.9

3.1

3.2

0.0% 

20.0% 

40.0% 

60.0% 

80.0% 

100.0% 

120.0% 

$50.00 $60.00 $70.00 $80.00 $90.00 $100.00 $110.00

ATIRR

 (%)

NYMEX WTI Price ($/bbl)

210

228

244

260

276

292

310

50

Appendix A: Liquids Focused Play Summary

Source: Company Filings and Simmons & Company Estimates.

Play Location Well Costs ($ in MMs) EUR (in Mboe)* Major ProducersBakken Williston Basin (ND/MT) 8.0‐10.0 300‐600 BEXP, CLR, COM, COP, DNR, EOG, HES, MRO, OAS, WLL

Bakken (Parshall Sanish) Williston Basin (ND) 6.0‐8.0 600‐900 EOG, WLLCana Woodford    Anadarko Basin (OK) 8.0‐9.0 5.0‐8.0 Bcfe CLR, DVN, EXC, QEP

Cana Woodford (NW) Anadarko Basin (OK) 7.0‐9.0 6.0‐8.0 Bcfe CLR, DVNCentral Basin Platform Vertical Permian Basin (TX) 0.8 80 APA, SD

Colony Granite Wash Anadarko Basin (OK) 7.0‐8.0 5.5‐7.5 Bcfe CHKDelaware Basin Avalon Permian Basin (NM/TX) 4.0‐6.0 325‐500 CHK, CXO, DVN

NM Bone Spring Permian Basin (NM) 5.0‐7.0 400‐600 CXO, DVN TX Bone Spring Permian Basin (TX) 5.5‐7.5 400‐700 BHP, CXO, DVN

Wolfbone Vertical Permian Basin (NM/TX) 4.0‐6.0 200‐400 BHP, CXODJ Niobrara (ex‐Wattenberg) DJ Basin (CO/WY) 3.5‐4.5 200‐300 APC, CLR, CRZO, EOG, REXXDJ Niobrara (Wattenberg) DJ Basin (CO) 4.0‐5.0 200‐400 APC, NBL, PDCEagle Ford Condensate South Texas 6.5‐8.5 4.5‐7.0 Bcfe APC, BHP, PXD, ROSE, SFY, SM

Eagle Ford Oil South Texas 7.0‐9.0 350‐575 CHK, CRZO, EOG, EP, GDP, NFX, PXP, SFYMississippi Lime Anadarko Basin (OK/KS) 2.5‐3.5 300‐500 CHK, RRC, SD

Panhandle Granite Wash Anadarko Basin (OK) 7.5‐9.5 5.0‐7.0 Bcfe APA, FST, NFX, PXP, QEPMonument Butte Vertical Uinta Basin (UT) 0.93 75 NFX

Wasatch Vertical Uinta Basin (UT) 2.6 260 NFXMarcellus Liquids Rich Marcellus (PA) 4.5 5.5 CHK, CNX, EQT, NBL, RRCSpraberry Vertical Permian Basin (TX) 1.5‐1.8 130‐150 APA, CXO, PXDYeso Vertical Permian Basin (NM) 1.6 145 APA, CXO

*otherwise in Bcfe.

51

Appendix B: Additional Liquids Rich Well Economics Cana Woodford The Cana Woodford is located in the Anadarko Basin in Oklahoma. We did not include this play in our analysis of 18 liquids-focused plays due to the gassier nature of the play (~75% gas). This play requires ~$45/bbl WTI (range: $54-$36/bbl) in order to generate a 10% ATROR on half cycle economics. However, given the gassier nature of the play, the Cana Woodford requires nearly $100/bbl WTI in order to generate a 20% ATROR on half cycle economics. Both of these scenarios are based on gas at $4.50/Mcf.

Key Assumptions/Threshold Price on Half Cycle Basis

Source: Company Filings, HPDI and Simmons & Company Estimates.

Producer Disclosed EURs and Well Costs

Source: Company Filings.

Type Curve

Source: HPDI and Simmons & Company Estimates.

NPV

Source: HPDI and Simmons & Company Estimates.

Assumptions Cana Woodford

Well Cost ($MM) $8.5EUR Per Well (Mboe) 1166.0

Implied F&D Cost ($/boe) $9.1130‐Day IP Rate (boe/d) 866.3

Production Costs ($/boe) $4.00Production Taxes ($/boe) 7%

1st Year Decline (%) ‐63%2nd Year Decline (%) ‐29%3rd Year Decline (%) ‐19%

Well % Oil 20%Oil Diff to WTI (%) ‐4%

Well % NGLs 5%Well % Gas 75%

Threshold Oil Price Necessary for 10% ATROR $45.0615% ATROR $73.3520% ATROR $98.1425% ATROR $120.19

Operator EUR (Bcfe) Well Cost ($ in MMs)DVN 8.0 8.8MRO 4.1 7.5QEP 6.5 8.8XEC 7.5 8.0

Average 6.5 8.3

0

100

200

300

400

500

600

700

800

900

1000

1 11 21 31 41 51 61 71 81 91 101

111

121

131

141

151

161

171

181

191

201

211

221

231

241

251

261

271

281

291

301

311

321

331

341

351

361

Average

 Daily Produ

ction (Boe

/d)

Months

‐$9,000

‐$8,000

‐$7,000

‐$6,000

‐$5,000

‐$4,000

‐$3,000

‐$2,000

‐$1,000

$0

0 5 10 15 20 25 30 35 40 45 50 55 60 65 70 75 80 85 90 95 100

105

110

115

Project N

PV ($

MM)

Month

52

Half-Cycle Sensitivities

Sensitivity 1&2: Threshold WTI Oil Price at Various EURs and Well Costs

Sensitivity 3&4: ATROR at Various WTI Oil Prices and EURs

Source: Company Filings, HPDI and Simmons & Company Estimates.

ATROR at Various Well Costs

Source: HPDI and Simmons & Company Estimates.

ATROR at Various EURs

Source: HPDI and Simmons & Company Estimates.

7.5 7.8 8.2 8.5 8.8 9.2 9.51000 $48.09 $52.98 $57.74 $62.49 $67.24 $71.99 $76.891056 $42.36 $47.00 $51.50 $56.00 $60.50 $65.00 $69.631111 $37.30 $41.71 $45.98 $50.26 $54.54 $58.81 $63.221166 $32.71 $36.91 $40.99 $45.06 $49.14 $53.21 $57.411221 $28.54 $32.55 $36.44 $40.33 $44.23 $48.12 $52.131276 $24.73 $28.57 $32.29 $36.01 $39.74 $43.46 $47.301332 $21.17 $24.85 $28.41 $31.98 $35.55 $39.12 $42.79

Key Assumptions: 20% Oil, 75% Gas, 5% NGLs , Gas $4.5/mcf, NGLs 45% of WTI

WELL COST ($MM)

EUR (M

boe)

7.5 7.8 8.2 8.5 8.8 9.2 9.5776 $43.45 $48.14 $52.68 $57.23 $61.78 $66.33 $71.01806 $39.61 $44.12 $48.50 $52.87 $57.25 $61.63 $66.14836 $36.04 $40.39 $44.61 $48.83 $53.05 $57.27 $61.62866 $32.71 $36.91 $40.99 $45.06 $49.14 $53.21 $57.41896 $29.61 $33.67 $37.61 $41.55 $45.49 $49.43 $53.48926 $26.71 $30.64 $34.45 $38.26 $42.07 $45.89 $49.81956 $24.00 $27.80 $31.49 $35.18 $38.88 $42.57 $46.37

Key Assumptions: 20% Oil, 75% Gas, 5% NGLs , Gas $4.5/mcf, NGLs 45% of WTI

WELL COST ($MM)

IP Rate (boe

)

7.5 7.8 8.2 8.5 8.8 9.2 9.550 13.4% 12.4% 11.6% 10.8% 10.1% 9.5% 8.9%60 15.5% 14.4% 13.4% 12.6% 11.8% 11.1% 10.4%70 17.7% 16.5% 15.4% 14.4% 13.5% 12.7% 11.9%80 20.1% 18.7% 17.4% 16.3% 15.3% 14.4% 13.5%90 22.6% 21.0% 19.6% 18.3% 17.2% 16.1% 15.2%100 25.3% 23.4% 21.8% 20.4% 19.1% 18.0% 16.9%110 28.1% 26.0% 24.2% 22.6% 21.2% 19.9% 18.7%Key Assumptions: 20% Oil, 75% Gas, 5% NGLs , Gas $4.5/mcf, NGLs 45% of WTI ,1166 MBOE EUR

WELL COST ($MM)

NYM

EX Price 

($/boe

)

1000 1056 1111 1166 1221 1276 133250 8.3% 9.1% 10.0% 10.8% 11.7% 12.6% 13.6%60 9.6% 10.6% 11.6% 12.6% 13.6% 14.6% 15.7%70 11.1% 12.2% 13.2% 14.4% 15.5% 16.7% 18.0%80 12.6% 13.8% 15.0% 16.3% 17.6% 19.0% 20.4%90 14.1% 15.5% 16.9% 18.3% 19.8% 21.3% 22.9%100 15.7% 17.3% 18.8% 20.4% 22.1% 23.8% 25.6%110 17.4% 19.1% 20.8% 22.6% 24.5% 26.4% 28.5%

Key Assumptions: 20% Oil, 75% Gas, 5% NGLs , Gas $4.5/mcf, NGLs 45% of WTI , $9 MM Well Cost

EUR (Mboe)

NYM

EX Price 

($/boe

)

0.0% 

5.0% 

10.0% 

15.0% 

20.0% 

25.0% 

30.0% 

$50.00 $60.00 $70.00 $80.00 $90.00 $100.00 $110.00

ATIRR

 (%)

NYMEX WTI Price ($/bbl)

7.5

7.8

8.2

8.5

8.8

9.2

9.5

0.0% 

5.0% 

10.0% 

15.0% 

20.0% 

25.0% 

30.0% 

$50.00 $60.00 $70.00 $80.00 $90.00 $100.00 $110.00

ATIRR

 (%)

NYMEX WTI Price ($/bbl)

1000

1056

1111

1166

1221

1276

1332

53

Northwest Cana Woodford The Cana Woodford Northwest is located in Oklahoma in the Anadarko Basin. We did not include this play in our analysis of 18 liquids-focused plays due to the gassier nature of the play (~75% gas).. This play requires ~$46/bbl WTI (range: $54-$38/bbl) in order to generate a 10% ATROR on half cycle economics. However, given the gassier nature of the play, the Cana Woodford Northwest requires ~ $94/bbl WTI in order to generate a 20% ATROR on half cycle economics. Both of these scenarios are based on gas at $4.50/Mcf.

Key Assumptions/Threshold Price on Half Cycle Basis

Source: Company Filings, HPDI and Simmons & Company Estimates.

Producer Disclosed EURs and Well Costs

Source: Company Filings.

Type Curve

Source: HPDI and Simmons & Company Estimates.

NPV

Source: HPDI and Simmons & Company Estimates.

Assumptions NW Cana Woodford

Well Cost ($MM) $8.5EUR Per Well (Mboe) 1167.0

Implied F&D Cost ($/boe) $9.1030‐Day IP Rate (boe/d) 867.0

Production Costs ($/boe) $4.00Production Taxes ($/boe) 7%

1st Year Decline (%) ‐63%2nd Year Decline (%) ‐29%3rd Year Decline (%) ‐19%

Well % Oil 20%Oil Diff to WTI (%) ‐4%

Well % NGLs 10%Well % Gas 70%

Threshold Oil Price Necessary for 10% ATROR $45.8315% ATROR $71.4120% ATROR $93.8325% ATROR $113.77

Operator EUR (Bcfe) Well Cost ($ in MMs)CLR 6.9 7.1DVN 7.0 8.0

Average 7.0 7.6

0

100

200

300

400

500

600

700

800

900

1000

1 11 21 31 41 51 61 71 81 91 101

111

121

131

141

151

161

171

181

191

201

211

221

231

241

251

261

271

281

291

301

311

321

331

341

351

361

Average

 Daily Produ

ction (Boe

/d)

Months

‐$9,000

‐$8,000

‐$7,000

‐$6,000

‐$5,000

‐$4,000

‐$3,000

‐$2,000

‐$1,000

$0

$1,000

0 5 10 15 20 25 30 35 40 45 50 55 60 65 70 75 80 85 90 95 100

105

110

115

Project N

PV ($

MM)

Month

54

Half-Cycle Sensitivities

Sensitivity 1&2: Threshold WTI Oil Price at Various EURs and Well Costs

Sensitivity 3&4: ATROR at Various WTI Oil Prices and EURs

Source: Company Filings, HPDI and Simmons & Company Estimates.

ATROR at Various Well Costs

Source: HPDI and Simmons & Company Estimates.

ATROR at Various EURs

Source: HPDI and Simmons & Company Estimates

7.5 7.8 8.2 8.5 8.8 9.2 9.51000 $48.65 $53.08 $57.38 $61.68 $65.98 $70.28 $74.711055 $43.55 $47.75 $51.83 $55.91 $59.98 $64.06 $68.261111 $38.88 $42.87 $46.74 $50.61 $54.48 $58.36 $62.341167 $34.66 $38.46 $42.14 $45.83 $49.51 $53.20 $57.001223 $30.83 $34.45 $37.97 $41.48 $45.00 $48.52 $52.141279 $27.33 $30.79 $34.16 $37.52 $40.88 $44.24 $47.711334 $24.18 $27.50 $30.72 $33.95 $37.17 $40.39 $43.72

WELL COST ($MM)

EUR (M

boe)

Key Assumptions: 20% Oil, 70% Gas, 10% NGLs , Gas $4.5/mcf, NGLs 45% of WTI

7.5 7.8 8.2 8.5 8.8 9.2 9.5722 $51.48 $56.04 $60.47 $64.89 $69.32 $73.74 $78.30769 $45.34 $49.62 $53.77 $57.93 $62.08 $66.24 $70.52818 $39.68 $43.70 $47.61 $51.52 $55.42 $59.33 $63.35867 $34.66 $38.46 $42.14 $45.83 $49.51 $53.20 $57.00916 $30.18 $33.78 $37.26 $40.75 $44.24 $47.73 $51.32965 $26.16 $29.57 $32.88 $36.19 $39.50 $42.81 $46.221012 $22.66 $25.92 $29.07 $32.23 $35.39 $38.54 $41.80

WELL COST ($MM)

IP Rate (boe

)

Key Assumptions: 20% Oil, 70% Gas, 10% NGLs , Gas $4.5/mcf, NGLs 45% of WTI

7.5 7.8 8.2 8.5 8.8 9.2 9.550 13.3% 12.4% 11.5% 10.8% 10.1% 9.5% 8.9%60 15.7% 14.5% 13.6% 12.7% 11.9% 11.2% 10.5%70 18.2% 16.8% 15.7% 14.7% 13.8% 13.0% 12.2%80 20.8% 19.3% 18.0% 16.8% 15.8% 14.9% 14.0%90 23.6% 21.9% 20.4% 19.1% 17.9% 16.8% 15.8%100 26.6% 24.7% 23.0% 21.5% 20.1% 18.9% 17.8%110 29.8% 27.6% 25.7% 24.0% 22.5% 21.1% 19.9%

WELL COST ($MM)

NYM

EX Price 

($/boe

)

Key Assumptions: 20% Oil, 70% Gas, 10% NGLs , Gas $4.5/mcf, NGLs 45% of WTI ,1167 MBOE EUR

1000 1055 1111 1167 1223 1279 133450 8.2% 9.0% 9.9% 10.8% 11.7% 12.6% 13.5%60 9.7% 10.7% 11.7% 12.7% 13.7% 14.8% 15.9%70 11.3% 12.4% 13.5% 14.7% 15.9% 17.2% 18.4%80 13.0% 14.2% 15.5% 16.8% 18.2% 19.7% 21.1%90 14.7% 16.1% 17.6% 19.1% 20.7% 22.3% 24.0%100 16.6% 18.1% 19.8% 21.5% 23.3% 25.1% 27.0%110 18.5% 20.2% 22.1% 24.0% 26.0% 28.1% 30.3%

Key Assumptions: 20% Oil, 70% Gas, 10% NGLs , Gas $4.5/mcf, NGLs 45% of WTI , $9 MM Well Cost

EUR (Mboe)

NYM

EX Price 

($/boe

)

0.0% 

5.0% 

10.0% 

15.0% 

20.0% 

25.0% 

30.0% 

35.0% 

$50.00 $60.00 $70.00 $80.00 $90.00 $100.00 $110.00

ATIRR

 (%)

NYMEX WTI Price ($/bbl)

7.0

7.3

7.7

8.0

8.3

8.7

9.0

0.0% 

5.0% 

10.0% 

15.0% 

20.0% 

25.0% 

30.0% 

35.0% 

$50.00 $60.00 $70.00 $80.00 $90.00 $100.00 $110.00

ATIRR

 (%)

NYMEX WTI Price ($/bbl)

1000

1055

1111

1167

1223

1279

1334

55

Marcellus Liquids Rich The Marcellus Liquids Rich is located in southwestern Pennsylvania, primarily Greene, Fayette and Washington counties. This play requires ~$47/bbl WTI (range: $58-$40/bbl) in order to generate a 10% ATROR on half cycle economics. This play requires ~$77/bbl in order to generate a 20% ATROR. Both of these scenarios are based on gas at $4.50/Mcf.

Key Assumptions/Threshold Price on Half Cycle Basis

Source: Company Filings, HPDI and Simmons & Company Estimates.

Producer Disclosed EURs and Well Costs

Source: Company Filings.

Type Curve

Source: HPDI and Simmons & Company Estimates.

NPV

Source: HPDI and Simmons & Company Estimates.

Assumptions Marcellus Liquids‐Rich

Well Cost ($MM) $4.5EUR Per Well (Mboe) 917.0

Implied F&D Cost ($/boe) $6.1330‐Day IP Rate (boe/d) 667.0

Production Costs ($/boe) $10.10Production Taxes ($/boe) 8%

1st Year Decline (%) ‐48%2nd Year Decline (%) ‐31%3rd Year Decline (%) ‐25%

Well % Oil 5%Oil Diff to WTI (%) ‐10%

Well % NGLs 25%Well % Gas 70%

Threshold Oil Price Necessary for 10% ATROR $46.9415% ATROR $62.9120% ATROR $77.2325% ATROR $90.31

Operator EUR (Bcfe) Well Cost ($ in MMs)RRC 5.5 4.5

0

100

200

300

400

500

600

700

800

1 13 25 37 49 61 73 85 97 109

121

133

145

157

169

181

193

205

217

229

241

253

265

277

289

301

313

325

337

349

361

Average

 Daily Produ

ction (Boe

/d)

Months

‐$5,000

‐$4,000

‐$3,000

‐$2,000

‐$1,000

$0

$1,000

$2,000

0 5 10 15 20 25 30 35 40 45 50 55 60 65 70 75 80 85 90 95 100

105

110

115

Project N

PV ($

MM)

Month

56

Half-Cycle Sensitivities

Sensitivity 1&2: Threshold WTI Oil Price at Various EURs and Well Costs

Sensitivity 3&4: ATROR at Various WTI Oil Prices and Well Costs

Source: Company Filings, HPDI and Simmons & Company Estimates.

ATROR at Various Well Costs

Source: HPDI and Simmons & Company Estimates.

ATROR at Various EURs

Source: HPDI and Simmons & Company Estimates.

4.0 4.2 4.3 4.5 4.8 5.2 5.5750 $53.37 $57.00 $60.22 $63.44 $70.08 $76.73 $83.57805 $47.87 $51.24 $54.25 $57.25 $63.44 $69.63 $76.01861 $42.99 $46.14 $48.95 $51.76 $57.55 $63.33 $69.30917 $38.70 $41.67 $44.30 $46.94 $52.37 $57.81 $63.41973 $34.91 $37.71 $40.19 $42.67 $47.79 $52.92 $58.191029 $31.53 $34.18 $36.52 $38.87 $43.71 $48.56 $53.551084 $28.56 $31.06 $33.29 $35.52 $40.12 $44.72 $49.45

WELL COST ($MM)

EUR (M

boe)

Key Assumptions: 5% Oil, 70% Gas, 25% NGLs , Gas $4.5/mcf, NGLs 45% of WTI

4.0 4.2 4.3 4.5 4.8 5.2 5.5562 $51.01 $54.53 $57.66 $60.78 $67.23 $73.68 $80.33597 $46.43 $49.74 $52.68 $55.63 $61.70 $67.77 $74.03632 $42.35 $45.48 $48.26 $51.04 $56.78 $62.51 $68.42667 $38.70 $41.67 $44.30 $46.94 $52.37 $57.81 $63.41702 $35.42 $38.24 $40.74 $43.24 $48.41 $53.57 $58.89737 $32.45 $35.13 $37.51 $39.90 $44.82 $49.74 $54.80772 $29.74 $32.31 $34.58 $36.86 $41.55 $46.25 $51.09

WELL COST ($MM)

30‐Day

 IP Rate (boe

)

Key Assumptions: 5% Oil, 70% Gas, 25% NGLs , Gas $4.5/mcf, NGLs 45% of WTI

4.0 4.2 4.3 4.5 4.8 5.2 5.550 13.9% 12.7% 11.8% 10.9% 9.4% 8.0% 6.9%60 17.7% 16.3% 15.1% 14.0% 12.2% 10.6% 9.2%70 21.8% 20.1% 18.7% 17.4% 15.1% 13.3% 11.6%80 26.2% 24.2% 22.5% 21.0% 18.4% 16.1% 14.2%90 31.0% 28.5% 26.6% 24.9% 21.8% 19.2% 17.0%100 36.0% 33.2% 31.0% 29.0% 25.4% 22.4% 19.9%110 41.3% 38.1% 35.6% 33.3% 29.2% 25.9% 22.9%

WELL COST ($MM)

NYM

EX Price 

($/boe

)

Key Assumptions: 5% Oil, 70% Gas, 25% NGLs , Gas $4.5/mcf, NGLs 45% of WTI ,917 MBOE EUR

750 805 861 917 973 1029 108450 6.9% 8.2% 9.5% 10.9% 12.4% 13.9% 15.4%60 9.2% 10.7% 12.3% 14.0% 15.8% 17.6% 19.5%70 11.6% 13.4% 15.4% 17.4% 19.5% 21.7% 24.0%80 14.2% 16.3% 18.6% 21.0% 23.5% 26.1% 28.8%90 16.9% 19.4% 22.1% 24.9% 27.8% 30.8% 33.9%100 19.9% 22.7% 25.8% 29.0% 32.3% 35.8% 39.4%110 22.9% 26.2% 29.7% 33.3% 37.1% 41.1% 45.2%

Key Assumptions: 5% Oil, 70% Gas, 25% NGLs , Gas $4.5/mcf, NGLs 45% of WTI , $5 MM Well Cost

EUR (Mboe)

NYM

EX Price 

($/boe

)

0.0% 

5.0% 

10.0% 

15.0% 

20.0% 

25.0% 

30.0% 

35.0% 

40.0% 

45.0% 

$50.00 $60.00 $70.00 $80.00 $90.00 $100.00 $110.00

ATIRR

 (%)

NYMEX WTI Price ($/bbl)

4.0

4.2

4.3

4.5

4.8

5.2

5.5

0.0% 

5.0% 

10.0% 

15.0% 

20.0% 

25.0% 

30.0% 

35.0% 

40.0% 

45.0% 

50.0% 

$50.00 $60.00 $70.00 $80.00 $90.00 $100.00 $110.00

ATIRR

 (%)

NYMEX WTI Price ($/bbl)

750

805

861

917

973

1029

1084

57

Appendix D Analyst Certification: I, Pearce Hammond, hereby certify that the views expressed in this research report to the best of my knowledge, accurately reflect my personal views about the subject compan(ies) and its (their) securities; and that, I have not been, am not, and will not be receiving direct or indirect compensation in exchange for expressing the specific recommendation(s) or views in this research report. Important Disclosures: For detailed rating information, go to http://publicdisclosure.simmonsco-intl.com. Additional information is available upon request. Simmons & Company's ratings system categorizes individual stock performance as Underweight, Neutral or Overweight relative to the performance of the S&P 500 Index and its discrete energy sub-sector over a 12 month period. Research analysts compensation is based upon (among other things) the firm's general investment banking revenues. Simmons & Company International may seek compensation for investment banking services from other companies for which research coverage is provided. The firm would expect to receive compensation for any such services. Foreign Affiliate Disclosure: This report may be made available in the United Kingdom through distribution by Simmons & Company International Capital Markets Limited, a firm authorized and regulated by the Financial Services Authority to undertake designated investment business in the United Kingdom. Simmons & Company International Capital Markets Limited's policy on managing investment research conflicts is available by request. The research report is directed only at persons who have professional experience in matters relating to investments who fall within the definition of investment professionals in Article 19(5) Financial Services and Markets Act (Financial Promotion) Order 2001 (as amended) ("FPO"); persons who fall within Article 49(2)(a) to (d) FPO (high net worth companies, unincorporated associations etc.) or persons who are otherwise market counterparties or intermediate customers in accordance with the FSA Handbook of Rules and Guidance ("relevant persons"). The research report must not be acted on or relied upon by any persons who receive it within the EEA who are not relevant persons. Simmons & Company International Capital Markets Limited is located at 6 Arlington Street, London, United Kingdom. Disclaimer: This e-mail is based on information obtained from sources which Simmons & Company International believes to be reliable, but Simmons & Company does not represent or warrant its accuracy. The opinions and estimates contained in the e-mail represent the views of Simmons & Company as of the date of the e-mail, and may be subject to change without prior notice. Simmons & Company International will not be responsible for the consequence of reliance upon any opinion or statement contained in this e-mail. ©2011 Simmons & Company International. All rights reserved. No part of this electronic communication may be reproduced or transmitted in any form or by any means, electronic or mechanical, including photocopying or by any information storage and retrieval system, without permission in writing from Simmons & Company International.

Simmons & Company International Institutional Securities Group

www.simmonsco-intl.com

Simmons & Company International

Houston 700 Louisiana, Suite 1900

Houston, Texas 77002 Phone: (713) 223-7840

Fax: (713) 223-7846 Institutional Sales: (800) 856-5508 Trading – Listed: (800) 856-3241 Trading – OTC: (800) 856-3240

International Watts: (0800) 894-253

Email: [email protected]

Simmons & Company International Limited Aberdeen

Simmons House 22 Waverly Place

Aberdeen AB10 1XP Scotland

Phone: 011-44-224-202-300 Fax: 011-44-1224-202-303

Simmons & Company International Capital Markets Limited

London Sackville House

40 Piccadilly, Mezzanine London W1J ODR United Kingdom

Phone: 011-44-207-053-1000 Trading: 011-44-845-873-3333

Fax: 011-44-207-053-1026 Clearing Through

Pershing LLC 700 Louisiana, Suite 1900 Houston, Texas 77002 (713) 223-7840 Fax: (713) 223-7846


Recommended