22
OIL PRICE OUTLOOK US FEBRUARY 2017
| Date post: | 12-Apr-2018 |
| Category: |
Documents |
| Upload: | truonghanh |
| View: | 221 times |
| Download: | 2 times |

OIL PRICE
OUTLOOK
US
FEBRUARY 2017

U.S. OIL PRICE OUTLOOK │ FEBRUARY 2017
2
1. OPEC output deal may have a limited impact on prices. Despite signs
of compliance, implementation and monitoring is challenging in some
countries
2. Going forward, inventory correction and the lagged effect of CAPEX
cuts should lead to higher prices
3. The recovery of U.S. shale production is expected to prevent a steep
upturn in prices; nevertheless, there is uncertainty on the extent and
speed of the rebound
4. Little to no upside from demand. Demand growth continues to be
supported by emerging markets and the U.S., but it has eased
5. Slow recovery and convergence to $60/bbl, which would be a sweet
spot for both consumers and producers
Key Messages

U.S. OIL PRICE OUTLOOK │ FEBRUARY 2017 OPEC
OPEC DEAL
OPEC deal carries
prices back above
$50/bbl
3 Source: BBVA Research & Haver Analytics
• Deal should be seen as an
effort to stabilize the market
• Rather than triggering a rapid
and sustained increase in
prices, cuts imposed an
effective price floor
BRENT CRUDE OIL PRICES
$ per barrel
09
/20
/16
09
/27
/16
10
/04
/16
10
/11
/16
10
/18
/16
10
/25
/16
11
/01
/16
11
/08
/16
11
/15
/16
11
/22
/16
11
/29
/16
12
/06
/16
12
/13
/16
12
/20
/16
12
/27
/16
01
/03
/17
01
/10
/17
01
/17
/17
01
/24
/17
01
/31
/17
02
/07
/17
40
42
44
46
48
50
52
54
56
58
60OPEC
Meeting

U.S. OIL PRICE OUTLOOK │ FEBRUARY 2017 OPEC
30
35
40
45
50
55
60
1 2 3 4 5 6 7 8 9 10 11 12
Months Ahead
02/09/17
1 month ago
3 months ago
6 months ago
30
35
40
45
50
55
60
1 2 3 4 5 6 7 8 9 10 11 12
Months Ahead
02/09/17
1 month ago
3 months ago
6 months ago
WTI CRUDE FUTURES
$ per barrel BRENT CRUDE FUTURES
$ per barrel
Source : BBVA Research & Bloomberg 4
FUTURES
Futures rise as markets perceive that OPEC has retaken its role of
market stabilizer

U.S. OIL PRICE OUTLOOK │ FEBRUARY 2017 OPEC
5
OPEC MONITOR
January was first big test for OPEC production deal, with estimated
compliance more than halfway to target
*No production adjustment for Libya or Nigeria; Proposed production increase of 90K for Iran
OPEC PROGRESS TOWARDS PRODUCTION COMMITMENTS*
Production Cut
Goal (K, bbl/d) Goal Achieved? Status Update
Saudi Arabia 486 Estimated cuts of 500K bbl/d, surpassing target
Iraq 210
(120)
Kurdistan region unwilling to cooperate with cuts; difficulties in lowering output
without triggering contractual obligations to pay IOCs
UAE 139 Estimated cuts of 160K bbl/d, surpassing target
Kuwait 131 Estimated cuts of 150K bbl/d, surpassing target
Venezuela 95
(70)
Announced in late December that cut would be implemented starting Jan. 1, but
then Maduro announced plan to stabilize oil prices
Angola 78
(0)
State oil company has announced output cuts in accordance with deal
Algeria 50 Estimated cuts of 70K bbl/d, surpassing target
Qatar 30
(5)
Started informing customers in December of supply cuts starting Jan. 1
Ecuador 26
(20)
Reduction to be result of allowing production at mature oil fields to fall; peak
reductions to occur in March and April
Gabon 9 Estimated cuts of 15K bbl/d, surpassing target; rejoined OPEC in July; faced
falling oil production last year, headlined by a large-scale strike by oil workers
Source: BBVA Research, Bloomberg & news sources

U.S. OIL PRICE OUTLOOK │ FEBRUARY 2017 OPEC
6
NOPEC MONITOR
Bulk of non-OPEC production cuts to come from Russia, but
achievement of goal will take time
NON-OPEC PROGRESS TOWARDS PRODUCTION COMMITMENTS
Production Cut
Goal (K, bbl/d) Goal Achieved? Status Update
Russia 300
(117)
Surpassed Jan. goal of 50K; expect to reach 300K by end of 1H2017, but has
announced increase in oil exports in 2017
Mexico 100 ? Reduction to be result of allowing production at mature oil fields to fall
Oman 45 ? Energy minister said that daily production quotas for oil producing companies
have been set, but that country will maintain production of 1M bbl/d this year.
Azerbaijan 35
Began implementing production cuts on January 1. Energy minister said output
had been cut to 789K in Jan
Kazakhstan 20 Energy ministry stated that commitment had already been met, but plans to
increase output in 2017
Malaysia 20 ? State oil firm to implement cuts starting in January; 2nd straight year of
production decline
Equatorial Guinea 12 ? Applied to join OPEC
Bahrain 10 ? No status update
South Sudan 8 In the process of doubling crude production after 2 year halt
Brunei 4 ? No status update
Sudan 4 ? No status update
Source: BBVA Research, Bloomberg & news sources

U.S. OIL PRICE OUTLOOK │ FEBRUARY 2017 OPEC
SUPPLY
Upside risks from Libya and Nigeria remain subdued
Source: BBVA Research & Haver Analytics
OPEC: CHANGE IN CRUDE OIL PRODUCTION BY COUNTRY
YoY, million barrels per day
-1200
-1000
-800
-600
-400
-200
0
200
400
600
1Q14 2Q14 3Q14 4Q14 1Q15 2Q15 3Q15 4Q15 1Q16 2Q16 3Q16
Nigeria
Libya
7
U.S. OIL PRICE OUTLOOK │ FEBRUARY 2017 OPEC
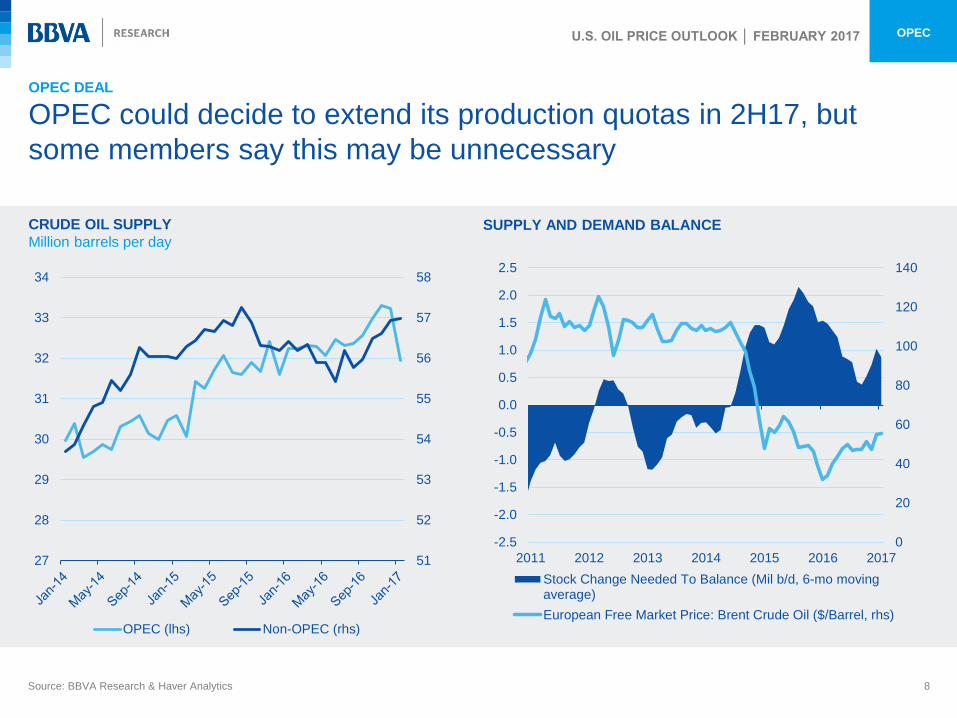
OPEC DEAL
OPEC could decide to extend its production quotas in 2H17, but
some members say this may be unnecessary
Source: BBVA Research & Haver Analytics
CRUDE OIL SUPPLY
Million barrels per day SUPPLY AND DEMAND BALANCE
51
52
53
54
55
56
57
58
27
28
29
30
31
32
33
34
OPEC (lhs) Non-OPEC (rhs)
8
0
20
40
60
80
100
120
140
-2.5
-2.0
-1.5
-1.0
-0.5
0.0
0.5
1.0
1.5
2.0
2.5
2011 2012 2013 2014 2015 2016 2017
Stock Change Needed To Balance (Mil b/d, 6-mo movingaverage)
European Free Market Price: Brent Crude Oil ($/Barrel, rhs)

U.S. OIL PRICE OUTLOOK │ FEBRUARY 2017 OPEC
9
SUPPLY
A more competitive environment will continue to hinder the ability of
OPEC to stabilize the market
Source: Rystad Energy UCube; production forecasts could differ from BBVA Research baseline based on variance in assumptions
NET ADDITIONS IN GLOBAL LIQUIDS SUPPLY BY SUPPLY SEGMENT GROUP
YoY, million barrels per day
-1.5
-1.0
-0.5
0.0
0.5
1.0
1.5
2.0
2.5
3.0
2013 2014 2015 2016 2017 2018 2019 2020
OPEC
Other Onshore
Shale/Tight oil
Oil sands
Offshore shelf
Offshoremidwater
Offshoredeepwater
Total Supply
Forecasts
No
n-O
PE
C

U.S. OIL PRICE OUTLOOK │ FEBRUARY 2017 USA
INVENTORIES
Signs of a more balanced market will emerge as inventories continue
to decline
10 Source: BBVA Research & Haver Analytics
U.S. STOCKS OF CRUDE OIL EXCLUDING SPR
EOP, million barrels
GLOBAL OIL INVENTORIES
EOP, million barrels
250
300
350
400
450
500
550
1500
1700
1900
2100
2300
2500
2700
2900
3100
3300
2011 2012 2013 2014 2015 2016 2017
Oil Inventories: OECD (EOP, Mil.Bbl)
Oil Inventories: Non-OECD (EOP, Mil.Bbl)

U.S. OIL PRICE OUTLOOK │ FEBRUARY 2017 USA
CAPEX
Shale producers to increase CAPEX in response to upturn in prices
Source: Rystad Energy UCube
• Slowdown in capital spending
resulted from a weak price
environment
• Many shale companies covering
CAPEX with cash flows, moving
away from strong reliance on
debt
• CAPEX expected to rise this
year, especially as larger U.S.
companies spend on drilling and
completing wells
CAPITAL AND OPERATING EXPENDITURES FOR U.S. SHALE OIL
Billion USD
0
50
100
150
200
250
2006 2007 2008 2009 2010 2011 2012 2013 2014 2015 2016
Opex
Exploration Capex
Capex
11

U.S. OIL PRICE OUTLOOK │ FEBRUARY 2017 USA
U.S. RECOVERY
Economics of fracking continue to remain favorable
12
ASSET BREAKEVEN OIL PRICE BY SHALE PLAY, PRODUCING
USD/bbl, Brent-linked
Source: Rystad Energy UCube & Haver Analytics
0
10
20
30
40
50
60
Average
Oil Price (2/8/17)

U.S. OIL PRICE OUTLOOK │ FEBRUARY 2017 USA
U.S. RECOVERY
Recent production gains explained by uptick in completed wells
13 Source: BBVA Research & Haver Analytics
U.S. RATIO OF DCU TO COMPLETED WELLS
Units
Source: Rystad Energy UCube
0
20
40
60
80
100
120
2011 2012 2013 2014 2015 2016
Bakken Eagle FordHaynesville/Bossier MarcellusNiobrara Permian Delaware TightPermian Midland Tight Utica
U.S. ACTIVE RIG COUNT AND CRUDE OIL PRODUCTION
0
100
200
300
400
500
600
700
800
8000
8200
8400
8600
8800
9000
9200
9400
Jan-1
6
Feb
-16
Ma
r-1
6
Apr-
16
Ma
y-1
6
Jun-1
6
Jul-1
6
Aug-1
6
Sep-1
6
Oct-
16
No
v-1
6
De
c-1
6
Jan-1
7
Feb
-17
US Weekly Crude Oil Field Production (Thous. Barrels/Day)
Baker Hughes Active Rig Count: US (Units, rhs)

U.S. OIL PRICE OUTLOOK │ FEBRUARY 2017 USA
POLICY
Trump’s America First Energy Plan: Make oil & gas great again
14 Source: S&P Global Platts, The Brattle Group, White House, Bloomberg
• Destination Based Cash Flow Tax (DBCFT) – would lower corporate tax rate to 20%
• U.S. oil industry incentivized to export more crude oil and products and import less;
refiners would shift toward domestic crude sourcing
• Advancing pipelines is expected to decrease costs of moving oil to refineries and lower
breakevens
• However capacity to generate further investments in oil and gas will be challenged by
the current levels of oil prices
• Withdrawal from CPP, COP21; elimination of Climate Action Plan
• Suspending social cost of carbon calculation
• Possibility of turning over federal lands to local control, which could facilitate drilling
Corporate Tax
Reform
Keystone and
Dakota Access
Pipelines
Deregulation

U.S. OIL PRICE OUTLOOK │ FEBRUARY 2017 DEMAND
15
DEMAND
Non-OECD countries expected to lead demand in long-term, despite
signs of slowing growth
Source: BBVA Research & Haver Analytics
OIL PRODUCT DEMAND
YoY % change, million barrels per day
-1000
-500
0
500
1000
1500
2000
2500
3000
1Q14 2Q14 3Q14 4Q14 1Q15 2Q15 3Q15 4Q15 1Q16 2Q16 3Q16 4Q16
Western Europe United States China India Total World

U.S. OIL PRICE OUTLOOK │ FEBRUARY 2017 DEMAND
16
CHINA
China's rebalancing and transition to a cleaner economy may result in
slower growth of demand for fossil fuels
Source: BBVA Research & Haver Analytics
CHINA: OIL PRODUCT DEMAND AND INDUSTRIAL
PRODUCTION
YoY % change
CHINA: CRUDE AND TOTAL PETROLEUM PRODUCTS
INVENTORIES
EOP, million barrels
160
180
200
220
240
260
280
0
100
200
300
400
500
600
700
20
08
20
09
20
10
20
11
20
12
20
13
20
14
20
15
20
16
Crude Oil Total Products (rhs)
0%
5%
10%
15%
20%
25%
19
98
19
99
20
00
20
01
20
02
20
03
20
04
20
05
20
06
20
07
20
08
20
09
20
10
20
11
20
12
20
13
20
14
20
15
20
16
Industrial Production Oil Product Demand

U.S. OIL PRICE OUTLOOK │ FEBRUARY 2017 DEMAND
ELECTRIC VEHICLES
Improvements in lithium-ion batteries could make electric vehicles
cost competitive by 2020
U.S. NEW PLUG-IN VEHICLE SALES
Thousands
0
5
10
15
20
25
2011 2012 2013 2014 2015 20160
50
100
150
200
250
300
350
400
450
500
$0
$200
$400
$600
$800
$1,000
$1,200
2008 2009 2010 2011 2012 2013 2014 2015
Battery Cost
Energy Density
PHEV* BATTERY ENERGY COST AND DENSITY
$USD/kwh & Wh/L
Source: BBVA Research & Electric Drive Transportation Association *PHEV = Plug-in hybrid electric vehicle
Source: BBVA Research & U.S. Department of Energy, International Energy Agency
17

U.S. OIL PRICE OUTLOOK │ FEBRUARY 2017 FORECASTS
18
OIL PRICE FORECASTS
Slight upward revisions to 2017 and 2018 figures
Source: BBVA Research & Haver Analytics
CRUDE OIL PRICE FORECASTS
Brent, $ per barrel, avg
CRUDE OIL PRICE FORECASTS
Brent, $ per barrel, avg
Baseline Upside Downside
2015 52.8 52.8 52.8
2016 45.2 45.2 45.2
2017 57.0 66.9 46.2
2018 58.7 75.8 36.6
2019 59.6 79.3 34.1 0
20
40
60
80
100
120
2014 2015 2016 2017 2018 2019
Actual Baseline
Upside Risk Downside Risk

U.S. OIL PRICE OUTLOOK │ FEBRUARY 2017 FORECASTS
19
EXCHANGE RATE
Prices are expected to move above our previous baseline, but
increases could be limited by a strong dollar
Source: BBVA Research & Haver Analytics
OIL PRICES AND U.S. DOLLAR
20
25
30
35
40
45
50
55
60
112
114
116
118
120
122
124
126
128
130
Jan-16 Feb-16 Mar-16 Apr-16 May-16 Jun-16 Jul-16 Aug-16 Sep-16 Oct-16 Nov-16 Dec-16 Jan-17 Feb-17
Trade-Weighted Exchange Rate, $ (Jan-97=100) Brent ($/bbl, rhs)

U.S. OIL PRICE OUTLOOK │ FEBRUARY 2017 FORECASTS
20
SUPPLY
More than half of liquids from new supply sources are expected to be
commercial below $60/bbl
Source: Rystad Energy UCube
GLOBAL LIQUIDS PRODUCTION BY LIFE CYCLE AND BREAKEVEN PRICE
Million barrels per day
50
60
70
80
90
100
110
2013 2014 2015 2016 2017 2018 2019 2020 2021 2022 2023 2024 2025
Undiscovered
Above 125
100-125
80-100
60-80
40-60
20-40
Below 20
Under development
Producing
No
n s
an
ctio
ne
d p
roje
cts
Forecasts

U.S. OIL PRICE OUTLOOK │ FEBRUARY 2017 FORECASTS
21
SUPPLY
$60/bbl would make several projects profitable again, but high-cost
producers would still be out of the market
Source: Rystad Energy UCube
COST OF SUPPLY CURVE
0
20
40
60
80
100
120
140
160
420 520 620 720 820 920 1,020 1,120 1,220
Bre
akev
en
Oil P
rice,
US
D/b
arr
el
Remaining resources as of 2016, Million bbl
Producing Onshore Middle East Extra heavy oil
Shelf North American Shale Ultra deepwater
Row onshore Russia onshore Deepwater
Oil sands Weighted average breakeven

OIL PRICE
OUTLOOK
US
FEBRUARY 2017


