U.S. PETROCHEMICAL INDUSTRY FUTURE - UPSTREAM – NATURAL GAS - LOGIC VERSUS FAITH AND HOPE Page 1 of 47 First, let me define what the words natural gas mean to different consumers because we will get into a state of total confusion later on if I don’t. From Wikipedia: Raw natural gas comes primarily from any one of three types of wells: crude oil wells, gas wells, and condensate wells. Natural gas that comes from crude oil wells is typically called associated gas. This gas can have existed as a gas cap above the crude oil in the underground formation, or could have been dissolved in the crude oil. Natural gas from gas wells and from condensate wells, in which there is little or no crude oil, is called non-associated gas. Gas wells typically produce only raw natural gas, while condensate wells produce raw natural gas along with other low molecular weight hydrocarbons. Those that are liquid at ambient conditions (i.e., pentane and heavier) are called natural gas condensate (sometimes also called natural gasoline or simply condensate). Natural gas is called sweet gas when relatively free of hydrogen sulfide; gas that does contain hydrogen sulfide is called sour gas. Natural gas, or any other gas mixture, containing significant quantities of hydrogen sulfide, carbon dioxide or similar acidic gases, is called acid gas. Raw natural gas can also come from methane deposits in the pores of coal seams, and especially in a more concentrated state of adsorption onto the surface of the coal itself. Such gas is referred to as coalbed gas or coalbed methane (coal seam gas in Australia). So you see, there all kinds of gas that may be called “natural gas”. Once this gas is released (withdrawn) from the ground, it travels to a natural gas processing plant via pipeline to remove impurities and most of the other hydrocarbons leaving mainly methane. See Figure 1,”Typical Natural Gas Processing Plant”. From EIA’s web site: Natural gas produced at the well-head (especially in association with crude oil) contains varying amounts of natural gas liquids ("NGLs"). This rich natural gas in its raw form is usually not acceptable for transportation in the nation's major natural gas pipeline systems or for commercial use as a fuel. Natural gas processing plants remove the NGLs from the natural gas stream, enabling the natural gas to meet transmission pipeline and commercial quality specifications. In addition, on an energy equivalent basis, NGLs generally have a greater economic value as a raw material for petrochemical and motor gasoline production than their value as components of the natural gas stream. After extraction by the processing plants, the mixed NGLs are typically transported to a centralized facility for fractionation into purity NGL products such as ethane, propane, normal butane, isobutane and natural gasoline. The purity NGL products can then be used in our NGL marketing activities to meet contractual requirements or sold on spot and forward markets. See Figure 2, “Constituents of Wet Gas”, to see the impurities and hydrocarbons that are removed from the wet gas (also known as rich gas) to become the dry gas that is delivered via pipeline to your neighborhood and to the boilers, gas turbines, and gas engines which are increasingly driving power generators, private and public. Also, notice the difference between what comprises NGL and LPG, two terms that arise in conjunction with the natural gas industry.
Transcript
U.S. PETROCHEMICAL INDUSTRY FUTURE - UPSTREAM – NATURAL GAS - LOGIC VERSUS FAITH AND HOPE
Page 1 of 47
First, let me define what the words natural gas mean to different consumers because we will get into a state of total confusion later on if I don’t. From Wikipedia:
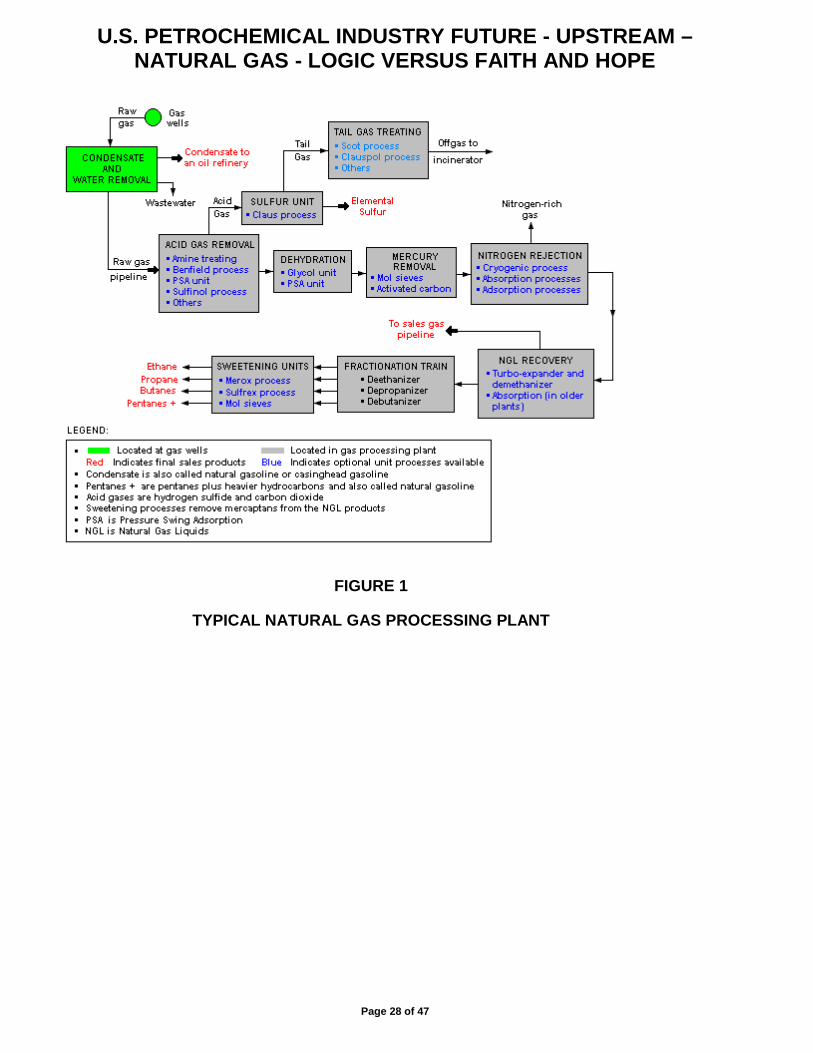
Raw natural gas comes primarily from any one of three types of wells: crude oil wells, gas wells, and condensate wells. Natural gas that comes from crude oil wells is typically called associated gas. This gas can have existed as a gas cap above the crude oil in the underground formation, or could have been dissolved in the crude oil. Natural gas from gas wells and from condensate wells, in which there is little or no crude oil, is called non-associated gas. Gas wells typically produce only raw natural gas, while condensate wells produce raw natural gas along with other low molecular weight hydrocarbons. Those that are liquid at ambient conditions (i.e., pentane and heavier) are called natural gas condensate (sometimes also called natural gasoline or simply condensate). Natural gas is called sweet gas when relatively free of hydrogen sulfide; gas that does contain hydrogen sulfide is called sour gas. Natural gas, or any other gas mixture, containing significant quantities of hydrogen sulfide, carbon dioxide or similar acidic gases, is called acid gas. Raw natural gas can also come from methane deposits in the pores of coal seams, and especially in a more concentrated state of adsorption onto the surface of the coal itself. Such gas is referred to as coalbed gas or coalbed methane (coal seam gas in Australia). So you see, there all kinds of gas that may be called “natural gas”. Once this gas is released (withdrawn) from the ground, it travels to a natural gas processing plant via pipeline to remove impurities and most of the other hydrocarbons leaving mainly methane. See Figure 1,”Typical Natural Gas Processing Plant”. From EIA’s web site:
Natural gas produced at the well-head (especially in association with crude oil) contains varying amounts of natural gas liquids ("NGLs"). This rich natural gas in its raw form is usually not acceptable for transportation in the nation's major natural gas pipeline systems or for commercial use as a fuel. Natural gas processing plants remove the NGLs from the natural gas stream, enabling the natural gas to meet transmission pipeline and commercial quality specifications. In addition, on an energy equivalent basis, NGLs generally have a greater economic value as a raw material for petrochemical and motor gasoline production than their value as components of the natural gas stream. After extraction by the processing plants, the mixed NGLs are typically transported to a centralized facility for fractionation into purity NGL products such as ethane, propane, normal butane, isobutane and natural gasoline. The purity NGL products can then be used in our NGL marketing activities to meet contractual requirements or sold on spot and forward markets.
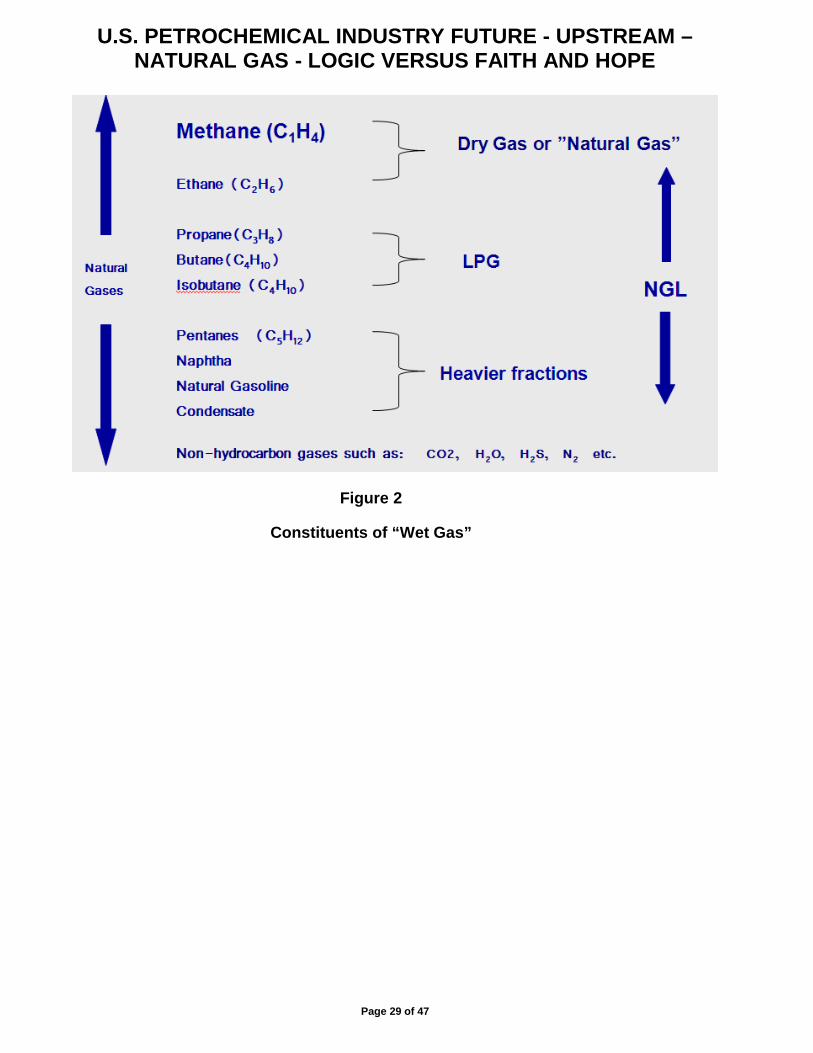
See Figure 2, “Constituents of Wet Gas”, to see the impurities and hydrocarbons that are removed from the wet gas (also known as rich gas) to become the dry gas that is delivered via pipeline to your neighborhood and to the boilers, gas turbines, and gas engines which are increasingly driving power generators, private and public. Also, notice the difference between what comprises NGL and LPG, two terms that arise in conjunction with the natural gas industry.
U.S. PETROCHEMICAL INDUSTRY FUTURE - UPSTREAM – NATURAL GAS - LOGIC VERSUS FAITH AND HOPE
Page 2 of 47
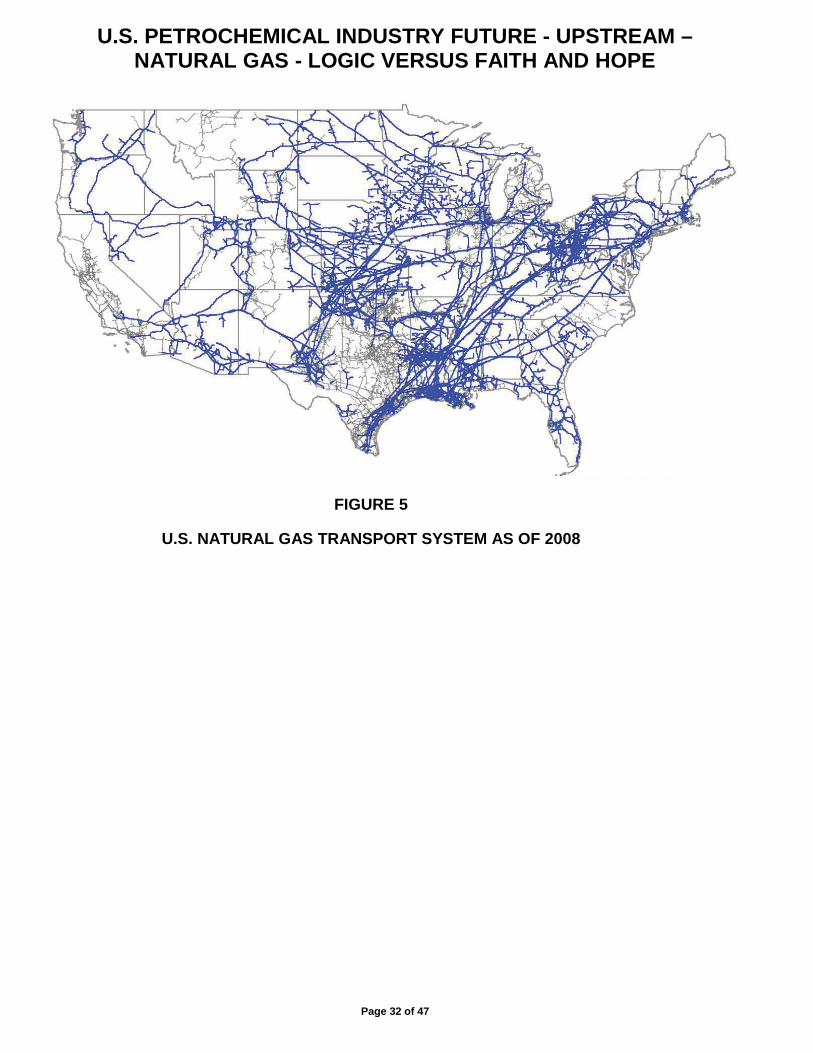
Now you can see that the “natural gas” that is extracted by gas exploration companies is not the same “natural gas” that arrives at your location. The most important aspect of this is that this “natural gas” is just a form of energy that is useful to modern society, and energy is expended to get it to the consumer. Look at Figure 3, “Natural Gas Processing Plants in U.S. in 2009”; and Figure 4, “U.S. Natural Gas Compressor Stations and Pipelines as of 2008”; and Figure 5, “U.S. Natural Gas Transport System as of 2008”, to get an idea of how extensive the U.S. natural gas system is. It is even more extensive now, eight years later.
Once that energy is consumed, it’s gone; and what do you intend to replace it with? Positive attitude? You better keep drilling faster and faster for one thing! And you better keep discovering more and more! Wind and solar aren’t going to keep all the lights on all the time, and nuclear is too expensive and dangerous.
Before I analyze what the future may bring, consider how we got here.
History of Natural Gas Post WWII
After World War II natural gas became increasingly popular, as products and applications for it increased along with the supply network, beginning with the industrial sector. From 1940 to 1960, the U.S. began a continuous rapid growth of its natural gas pipeline system with thousands of miles of pipelines. The first all welded pipeline was built in 1925 and was 200 miles extending from Louisiana into Texas after large seamless pipe, 24 inch nominal diameter, became available.
Natural gas distributors first begin using mercaptan in 1937 so that leaks could be detected. In 1947, the Big Inch and Little Inch pipelines that Plantation Pipeline had constructed in 1942 to transport oil from the gulf coast to the northeast coast, was sold to Texas Eastern Transmission Co. and converted to natural gas transport.
In 1942, the American standard for pressure code piping first appeared. In 1948, radiographic inspection of girth welds, double submerged arc-welded pipe, and the standard API 5LX were all introduced. Long distance pipeline construction was ready to take off. In 1951, the 1840 mile long, 30 inch diameter natural gas pipeline from the Gulf Coast to PA and NY was built by Transcontinental. The line operated at 800 psi and had 19 compressor stations.
By 1951, New York City was receiving large quantities of natural gas. In 1954, the Federal government established price controls for interstate gas sales, making it more profitable to sell in states where the gas was produced. Shortages eventually resulted across the Midwest and East Coast.
In 1970, U.S. natural gas production hit a peak that was not reached again until 2010 with the “Shale Gas Revolution”. In 1977, facing record cold, Pennsylvania Gov. Milton Shapp ordered schools closed for three days because of the gas shortage. On the same day, President Carter proposed the Emergency Natural Gas Act, deregulating the industry. It was clear then how important natural gas is now to the everyday functioning of U.S. society.
U.S. PETROCHEMICAL INDUSTRY FUTURE - UPSTREAM – NATURAL GAS - LOGIC VERSUS FAITH AND HOPE
Page 3 of 47
In 1975, the crisis in the U.S. natural gas supply had reached critical mass. From the NY Times:
Houston, ‘Energy Capital’ for World, Ignores Warnings of Crisis By JAMES P. STERBA MAY 29, 1975
HOUSTON, May 28—Houston is still on its cheap energy binge, unsobered by warnings like those issued by President Ford last night that natural gas supplies are dwindling and that another Arab oil embargo would throw the nation deeper into recession.
Two years after the first Arab oil embargo made “energy crisis” a household phrase, Houstonians, for the most part, continue to go along as if nothing had happened. Neither fuel price rises nor appeals for energy conservation have had a marked effect on the energy gifting life styles of the vast majority here.
In some ways, Houston is typical of other urban industrial centers that have sought to avoid the serious economic and social consequences of sharply curtailed energy use.
Houston's economy and prosperity are directly linked to its oil and petrochemical industries. Yet personal and corporate energy conservation measures here appear to be largely token gestures.
Two lessons should have been learned here, but weren’t:
1. The New York Times and all the other mainstream news always blames someone else for the liberal, non-producing states problems, the states with the largest populations and largest gross energy consumption. Don’t drill off the coast of Florida or the East Coast or the West Coast; however, when there is a shortage of oil or gas, why isn’t the Gulf Coast cutting back? See my “Republican Leaning States With Resources” and “U.S. Energy Consumption by State as of 2005”.
2. Houstonians and soon the rest of the country soon forgot about this “temporary” problem and went about consuming as much energy as possible until the next crisis. See my “Energy Conservation Will Become the Primary Concern for United States Industry”.
In the fall of 1978, Congress approved the Natural Gas Policy Act of 1978 (NGPA) which authorized the Federal Energy Regulatory Commission (FERC) to regulate both intrastate and interstate natural gas production and transmission. In addition, the act set price ceilings for wellhead first sales of gas; however, these were later repealed.
In 1985, FERC issued Order No. 436, which changed how interstate pipelines were regulated. This order established a voluntary framework under which interstate pipelines could act solely as transporters of natural gas, rather than filling the role of a natural gas merchant. Although the framework established by Order 436 was voluntary, all of the major pipeline systems eventually took part. Order No. 436 thus became generally known as the Open Access Order. Open access to pipelines also spurred the first appearances of natural gas marketers, and eventually Enron.
U.S. PETROCHEMICAL INDUSTRY FUTURE - UPSTREAM – NATURAL GAS - LOGIC VERSUS FAITH AND HOPE
Page 4 of 47
In 1989, Congress passed the Natural Gas Wellhead Decontrol Act (NGWDA) that completed the deregulation of wellhead prices. Under the NGWDA, the NGPA was amended and all remaining regulated prices on wellhead sales were repealed. As of January 1, 1993, all remaining NGPA price regulations were eliminated, allowing the market to completely determine the price of natural gas at the wellhead.
FERC Order No. 436 made the unbundling of pipeline services possible, the establishment of transportation only services by a pipeline continued to be only voluntary. In 1992, FERC Order No. 636 completed the final steps towards unbundling by making pipeline unbundling a requirement. The Order stated that pipelines must separate their transportation and sales services, so that all pipeline customers have a choice in selecting their gas sales, transportation, and storage services from any provider, in any quantity. From the American Gas Association:
FERC Order 636 (April 1992) fostered competition in the natural gas industry by ensuring that all natural gas suppliers compete for gas purchasers on equal footing. Its policy goals are to enhance competition in the natural gas industry and to ensure that adequate and reliable service is maintained. Prior to Order 636, pipelines bought natural gas from producers and sold it to customers, primarily local gas utilities, in competition with other sellers. "Bundled" rates included charges for services such as transportation, storage and peak shaving. Order 636 required pipelines to separate the offering and pricing of gas sales from the transportation of natural gas, with this unbundling taking place at a point near the gas production area. Pipelines are required to transport gas in a non-discriminatory fashion, regardless of who owns the gas. Pipelines can offer firm and interruptible sales services, and must offer a variety of transportation services, including an unbundled no-notice, firm transportation service; storage on an open access basis; and a capacity release program that enables customers to sell their firm capacity rights to other customers in the secondary market.
Natural gas liquids played a role in the expansion of the U.S. petrochemical industry in the 1970s and going forward due to the expansion of the natural gas production and pipeline system. From Oil & Gas Journal:
Asia, North America lead way in growth of NGL, LPG trade
01/12/1998
LPG markets in the 1990s reflect a rapidly shifting balance between East-of-Suez and West-of-Suez markets. This shift has increased concern about availability of future LPG supplies for Asia.
Annual global demand for LPG is approximately 179 million metric tons, up more than 60 million metric tons from 1985 consumption… During the 1990s, world LPG demand has risen on average 3.8%/year, more than twice as fast as demand growth for petroleum in the same period.
By 2003, the price of natural gas was increasing rapidly and U.S. methanol and ammonia production was being replaced by ammonia and methanol plants in Trinidad. Other places like
U.S. PETROCHEMICAL INDUSTRY FUTURE - UPSTREAM – NATURAL GAS - LOGIC VERSUS FAITH AND HOPE
Page 5 of 47
Chile, Egypt, Qatar, Indonesia, and China were starting to provide increased competition to the U.S. natural-gas based petrochemical industry whose number of methanol and ammonia plants was decreasing. From Louisiana Chemical Association:
LCA President Dan Borne spoke at the Baton Rouge Press Club luncheon on Monday, September 29, 2014. Below are notes from the Harris DeVille & Associates memo update.
In the late 1990s, natural gas became very expensive and hard to get. The lack of this basic raw material “threw all that earlier expansion into doubt.” Of note, the ammonia and methanol industries all but disappeared from the state. From 1999 to 2009, the number of plant workers decreased from 34,000 to 24,000, and vendors and other support member companies dropped from 1,000 to 400, according to the Louisiana Chemical Industry Alliance. Plants began to shut down and relocate overseas. The country had 50 liquefied natural gas import terminals in planning stages. “Nobody predicted the impact shale gas would have on the economy,” Borné said. “It was an economic miracle.” Four existing LNG import terminals have moved toward approval to switch to export, along with many other greenfield LNG export projects.
By 2003, we can read a commonplace concern in FromtheWilderness.com:
Natural Gas Crisis by Dale Allen Pfeiffer
June 23, 2003, 2000 PDT (FTW) --Forget about terrorists. Don't give another thought to SARS. The single greatest threat to the U.S. right now comes from a critical shortage of natural gas. The impending crisis will affect all consumers directly in the pocket book, and it may well mean that some people won't survive next winter. The problem is not with wells or pumps. The problem is that North America is running out and there is no replacement supply.
From Time magazine in 2003:
Why U.S. Is Running Out of Gas By Donald L. Barlett and James B. Steele Sunday, July 13, 2003
If all goes according to plan, the U.S. Senate in the next few weeks will follow the House and approve the latest in a long line of national energy policies. This one incorporates a favorite initiative of President George W.Bush's—the hydrogen-powered car. In his State of the Union address in January, the President proposed "$1.2 billion in research funding so that America can lead the world in developing clean, hydrogen-powered automobiles." As the President explained, his goal was "to promote energy independence ... in ways that generations before us could not have imagined."
Democrats joined euphoric Republicans in signing on the proposal. "The supply of hydrogen is inexhaustible," Senator Byron Dorgan, North Dakota Democrat, told his colleagues. "Hydrogen is in water. You can take the energy from the wind and use the electricity in the process of
U.S. PETROCHEMICAL INDUSTRY FUTURE - UPSTREAM – NATURAL GAS - LOGIC VERSUS FAITH AND HOPE
Page 6 of 47
electrolysis, separate the hydrogen from the oxygen and store the hydrogen and use it in vehicles. The fact is, hydrogen is ubiquitous. It is everywhere." It’s everywhere, it’s everywhere!!!!
NATURAL GAS: THE CONGRESSIONAL FLIP-FLOP. A quarter-century ago, Congress enacted the Powerplant and Industrial Fuel Use Act, which banned after 1990 the burning of natural gas by power plants to generate electricity. The reasoning: because that fuel was in short supply and was most widely used to heat homes—it goes to half of all residences—it should be preserved for that purpose. Pete Domenici, the Republican Senator from New Mexico, told his colleagues that year, "Almost since we found natural gas we have been busy finding ways to abuse it, waste it, literally throw it away on uses that we are now finding are absolutely the wrong thing to do, and basic among those that are wasteful are ... the use of natural gas to generate electricity." Yes, we don’t need those lights at night! At the same time that Louisiana factories are laying off workers because of gas prices, the U.S. is shipping gas to Mexico to generate electricity there. While the volume is still comparatively small, exports nonetheless have swelled 674% over the past seven years, to 263 billion cu. ft. last year. El Paso Energy, for one, pipes gas directly to the new Samalayuca II power plant, about 25 miles south of Ciudad Juarez. It serves 1 million people and some 300 factories south of the border. The potentially chronic natural-gas shortage and its impact on the economy and employment have even Alan Greenspan worried. Talking about the many industries dependent on natural gas, the Federal Reserve chairman told the Senate Energy Committee last week that "we do see the obvious loss of jobs ... because it has made us largely uncompetitive in a number of industries in which gas is a critical input." He also saw little hope that prices would fall. "We are not apt to return to earlier periods of relative abundance and low prices anytime soon," he said. In other words, don’t export natural gas, but get ready to import a lot.
LIQUEFIED NATURAL GAS: BACK TO THE FUTURE. To meet the surging demand for natural gas in the short term, Greenspan does see a solution: liquefied natural gas (lng). He has told Congress that "given notable cost reductions for both liquefaction and transportation of lng, significant global trade is developing. And high gas prices projected in the American distant futures market have made us a potential very large importer."
So it is that the U.S. is likely to be faced with recurring oil and natural-gas crises for some years to come. Their duration and severity remain to be seen. But volatile prices—as with gasoline during the Iraqi war, natural gas last winter and electricity in 2000—are all but guaranteed. The result is a hidden tax of tens of billions of dollars on American consumers. Just how many billions depends on a catalog of variables ranging from the harshness of the weather to unfolding events in the Middle East. More important, it depends on whether Congress and the White House, Democrats and Republicans, come up with a thoughtful energy policy that imposes tough conservation and efficiency measures, promotes research to develop one or two realistic alternative energy forms in commercial quantities and encourages production from a mix of existing energy sources. But none of this will be worth the effort unless the U.S. sticks with a plan long enough for it to pay off.
U.S. PETROCHEMICAL INDUSTRY FUTURE - UPSTREAM – NATURAL GAS - LOGIC VERSUS FAITH AND HOPE
Page 7 of 47
Now all the geniuses who are not geologists think we are in a new petrochemical age with “100 years” of natural gas at affordable prices and increasing consumption levels through 2040. Plus instead of importing natural gas in 2003 we can export it in 2016! Why? Because the U.S. Energy Department say so.
Since 2009 shale gas and tight oil have increased in significance. NGL market is even more important since some of these tight oil plays have associated gas rich in NGLs and some of shale gas plays are predominantly “rich gas” with large quantities of NGLs eventually entering the petrochemical marketplace. Now the U.S. petrochemical industry was potentially looking at much larger and stable supplies of feedstocks than nearby foreign competitors.
In 2008, Oil tycoon T. Boone Pickens unveiled the "Pickens Plan" to reduce dependence on foreign oil by massively increasing gas drilling. In 2009, former Sen. Timothy Wirth and John Podesta of the Center for American Progress called gas "a bridge fuel to a 21st-century energy economy" and Robert F. Kennedy Jr. wrote in the Financial Times that US was "awash with natural gas," which "has made it possible to eliminate most of our dependence on deadly, destructive coal."
In 2009, natural gas production started to skyrocket in the Haynesville play and six months later in the Marcellus play. By January 2012, production in the Haynesville play peaked. The other large natural gas plays, Barnett, Woodford, and Fayetteville peaked about the same time. By early 2013, Marcellus, the new shale gas star, was the only major shale gas play that had not peaked. Utica would later be the next star to appear.
In 2010 the documentary ,“Gasland”, premiered and introduced America to flaming tap water. In 2011, EPA moved toward regulating toxic fracking discharges. In 2012, Cornell University veterinarian published a study on cats, dogs, horses, and cows having seizures and dying after exposure to fracking chemicals. Also in 2012, geologists linked fracking to earthquakes in Ohio and Oklahoma. Too late, Obama made promises in his 2012 State of the Union address, and the industry is too deep into this now.
One project after another was being announced for the Marcellus play, but many local residents began to question the benefit to them. New York State later banned hydraulic fracking. In 2012, Hollywood captured the mood with the movie “Promised Land”.
In its Annual Energy Outlook for 2011, the US Energy Information Administration (EIA) more than doubled its estimate of technically recoverable shale gas reserves in the U.S. to 827 trillion cubic feet from 353 trillion cubic feet. In the 2012 Outlook, the estimate was lowered back down to 482 trillion cubic feet in one of many gross overestimates followed by estimate upward and downward corrections the EIA continues to make.
By mid-2013, one announcement after another for the Gulf Coast area of Louisiana and Texas was being made for new facilities based on “long-lasting” low natural gas prices based on enormous reserves and the abundance of ethane and propane in the “wet gas” in many of the
U.S. PETROCHEMICAL INDUSTRY FUTURE - UPSTREAM – NATURAL GAS - LOGIC VERSUS FAITH AND HOPE
Page 8 of 47
shale gas plays. Some were calling for a “new petrochemical age” with the U.S. Shale gas industry to do wonders! Many who had been studying the potential supply situation in detail said this was short-lived.
In October 2014, J. David Hughes published “Drilling Deeper” in which he investigated the Department of Energy’s extremely optimistic expectation of long-term domestic oil and natural gas. By 2015, it was clear that the shale gas craze was too crazy and had created a temporary oversupply of natural gas and the associated natural gas liquids; however, the increased supply of natural gas and associated NGLs created low prices also. It was now time for the natural gas and ethane feedstock based parts of the petrochemical industry to go crazy with one announcement after another of a new ammonia or methanol facility or expansion and either an expansion of existing ethylene production capacity or a new ethane cracker facility.
Hey, since we now have all this ”excess” natural gas and NGLs, let’s start exporting overseas. Run faster, die faster! Live for today because tomorrow may never come. Well, when it does come, we will find out that 100 years of whatever became scarce sooner than expected. But before that realization, prices will go through the roof further destroying demand!
In 2009, talk about exporting natural gas began to appear as the quantities of natural gas produced began to collapse the price of natural gas from the July 2008 high.
In 2012, the Department of Energy released its long-awaited report on liquefied natural gas exports. The “Macroeconomic Impacts of LNG Exports from the United States” gave an enthusiastic thumbs-up to sending U.S. natural gas overseas. Others jumped on this new bandwagon. From Deloitte MarketPoint 2012 :
Made in America The economic impact of LNG exports from the United States
A report by the Deloitte Center for Energy Solutions and Deloitte MarketPoint LLC
Deloitte MarketPoint LLC (“DMP”) is pleased to provide an independent assessment of the potential economic impacts of LNG exports from the United States. Exporters might benefit from
U.S. PETROCHEMICAL INDUSTRY FUTURE - UPSTREAM – NATURAL GAS - LOGIC VERSUS FAITH AND HOPE
Page 9 of 47
selling to foreign buyers, but how would such exports adversely impact domestic consumers of natural gas? Increased competition for supplies and accelerated resource depletion will likely raise domestic prices, but by how much? Will the level of exports being considered raise prices enough to cause economic damage as some objectors contend? After all, natural gas is a depletable resource, and what is exported is made unavailable to domestic uses. Under the assumptions outlined in this paper, we shall see that the magnitude of domestic price increase that results from export of natural gas in the form of LNG is likely quite small.
Naturally, to say anything else would be sacrilegious.
By 2013, FERC was ready to handout the goodies. From American Security Project: Perspective:
The Geopolitical Implications of U.S. Natural Gas Exports March 2013 Nick Cunningham
In 2012, U.S. natural gas production surpassed 29 trillion cubic feet, an all-time record. The combination of horizontal drilling and hydraulic fracturing, or “fracking,” has allowed American drillers to release natural gas from shale reserves that had previously been uneconomic to exploit. While the environmental effects of fracking are still under heavy debate, the effects are undeniable: the production of natural gas is booming. The enormous production has resulted in a glut of supply and rock-bottom prices. Producers hope to relieve the glut of natural gas in the U.S. by exporting surplus production, taking advantage of higher prices around the world. However, under the Natural Gas Act, first passed in 1938 and amended several times since, the export of natural gas is illegal without approval from the Secretary of Energy.
The Federal Energy Regulatory Commission (FERC), the agency responsible for permitting export terminals, has a backlog of 16 LNG import and export applications, totaling 24 billion cubic feet (bcf) in capacity. FERC contracted an extended review of the economic implications for allowing LNG exports, which it stated precluded permit approvals. The report was published in December, paving the way for a decision in the coming months.
There are business interests on both sides of the debate. Proponents of expanding LNG exports, which includes the oil and gas industry, argue that the U.S. can create jobs and improve the trade balance by exporting energy. Opponents, including some manufacturing and petro-chemical companies, raise concerns about the impact on consumer prices, preferring a scenario in which natural gas stays within U.S. borders to fuel what they term a manufacturing renaissance. FERC’s study indicated that LNG exports would only moderately raise domestic prices, even in the most aggressive scenario. In addition, the study indicated exports could contribute $10 to $47 billion to GDP by 2020, delivering net benefits to the economy.
U.S. PETROCHEMICAL INDUSTRY FUTURE - UPSTREAM – NATURAL GAS - LOGIC VERSUS FAITH AND HOPE
Page 10 of 47
It’s always about creating jobs. How many jobs are created by the LNG export facilities? Sure, temporary jobs are created for the big EPC companies, but few permanent jobs are necessary to operate these facilities. What is it about? In 2011, the EIA made it clear what it’s all about, Alfie. Is it just for the moment we live? You got it.
You can sell natural gas at a much higher price in Asia and possibly other outside areas than in the United States. So Hedge Funds, Mutual Fund managers, and Private Equity Funds, and don’t leave out Carl Icahn, jump on the “LNG Train”. Now, here is your host, the Energy Information Administration! Everybody sing along! “People all over the world, get on the LNGGGGG train! You don't have to hurry on (an LNG) train ride. You don't have to worry let your (future) troubles slide. It’s good for you”. However, it’s not so good for the American consumer and eventually the U.S. Petrochemical Industry.
By 2015, not only was the natural gas price depressed below what the shale gas companies were hoping for but also the NGL price was depressed. All of sudden, companies want to only export large quantities of LNG but also large quantities of ethane and propane. From Wall Street Daily:
NGL Market is Worse Than Oil’s
Published Fri, Jan 2, 2015 Tim Maverick, Senior Correspondent
But with the slide in crude oil prices has come an even more vicious drop in the price of natural gas liquids, causing the NGL market to come under extreme pressure.
From September 1 to mid-December, the price of all NGLs dropped by at least 40%. Propane prices, for example, fell to below $0.54 per gallon and are currently at a 10-year low.
The one exception to the three-month plunge was ethane prices, which fell by only 23%. But ethane prices have dropped 41% over the past six months.
You see, during the shale boom last year natural gas producers concentrated on producing NGLs since they were selling at a premium to the depressed price of natural gas.
As a result, NGL production topped three million barrels per day (bpd) in 2014, and output climbed more than 60% over the past decade. Supplies of both ethane and propane climbed above one million bpd, according to the U.S. Department of Energy.
U.S. PETROCHEMICAL INDUSTRY FUTURE - UPSTREAM – NATURAL GAS - LOGIC VERSUS FAITH AND HOPE
Page 11 of 47
This has created a massive surplus, and thus the plunge in prices.
Enterprise Product Partners L.P., for example, will begin shipping 240,000 barrels of ethane per day in 2016 from a terminal it is currently building in Texas.
And its entire capacity is already almost all spoken for, thanks to those orders from foreign buyers. That’s led Enterprise to eye a 50% expansion of its ethane export capabilities.
About a hundred ships are being built also, including 50 very large ethane carriers to transport some of the excess U.S. ethane.
But until all these plans start to come to fruition, the price of ethane and other NGLs will remain low.
However, for the time being (because our track record proves we are not good at analyzing the future) the price of petrochemical feedstocks is creating a “manufacturing renaissance”, and has nothing to do with the demand for the basic chemicals. Don’t worry about demand, increased supply always increased demand, right? If domestic demand doesn’t rebound, than just ship it overseas.
Well, in 2017 and 2018, you will find out how all this works out. Remember, Baby Boomers won’t be driving demand anymore, and the combination Wall Street crash followed by the dollar collapse could be the highlight of 2017.
Shale Gas
In the previous report, “U.S. Petrochemical Industry Future - Upstream - Crude Oil - Logic Versus Faith And Hope”, I wrote: In February 2013, one of the many independent analysts trying to bring sensibility and accurate statistics to the shale oil-gas craze, J. David Hughes, published “Drill, Baby, Drill” (a play on the Republican moto of the day) through the Post Carbon Institute web site. The report was a critical analysis of shale gas and shale oil (tight oil) and the potential of a shale revolution. Thereafter, Hughes and Art Berman begin to question all the estimates of reserves and long term production rates of both U.S. tight oil and shale gas that both the EIA and IEA were announcing periodically. J. David Hughes is an earth scientist who has studied the energy resources of Canada for four decades, including 32 years with the Geological Survey of Canada as a scientist and research manager. His main focus has been on the accuracy of the U.S. reserve estimates coming from the IEA and their contractors and the production rates that the IEA is predicting far into the future…
Hughes has also reported on the overstated claims about shale gas in “2016 Shale Gas Reality Check”. You can also get a free copy of this report at the Post Carbon Institute web site. From the Hughes study:
Over the past decade, Hughes has researched, published and lectured widely on global energy and sustainability issues in North America and internationally. His work with Post Carbon Institute includes:
U.S. PETROCHEMICAL INDUSTRY FUTURE - UPSTREAM – NATURAL GAS - LOGIC VERSUS FAITH AND HOPE
Page 12 of 47
• a series of papers (2011) on the challenges of natural gas being a "bridge fuel" to renewables;
• Drill, Baby, Drill (2013), which considered prospects for unconventional resources in the U.S.;
• Drilling California (2013), which critically examined U.S. Energy Information Administration (EIA)estimates of technically recoverable tight oil in California’s Monterey Shale, which the EIA claimed constituted two-thirds of U.S. tight oil (EIA subsequently reduced its resource estimate by 96%);
• Drilling Deeper (2014), which challenged the EIA’s expectation of long-term domestic oil and natural gas abundance with an in-depth assessment of all drilling and production data from the major shale plays through mid-2014; and
• Shale Gas Reality Check, Bakken Reality Check, and Eagle Ford Reality Check (2015), updates to Drilling Deeper using data from the U.S. Department of Energy’s Annual Energy Outlook 2015.
Now, let’s look at shale gas as of December 2016. Below is a picture of the prize – tight oil (also known as shale oil or sometimes oil shale) and shale gas (also known gas shale) in the “lower” 48 states. The average American wants it because it continues the lifestyle the Baby Boomers have become accustomed to. The oil and gas industry definitely wants to give it to them, and the federal bureaucracy in the holy mecca of Washington, D.C. is trying to convince everyone they can have it without any noticeable pain.
Shale gas is what we are concerned about here and how long it’s supply can be delivered at prices that don’t further destroy already decreasing demand for just about everything that has driven the American economy since 1983.
The above figure with the list to the right shows the major shale plays that have significant gas production from horizontal fracking. The term GPM is used in NGL marketing circles to note the possible gallons of NGL in 1000 cubic feet of natural gas. This is a rough indication of the value of
U.S. PETROCHEMICAL INDUSTRY FUTURE - UPSTREAM – NATURAL GAS - LOGIC VERSUS FAITH AND HOPE
Page 13 of 47
the NGL portion of the gas discovery, and is used for determining natural gas processing design and economics and possible petrochemical plant additions to utilize the NGL for ethylene or propylene production. The point is that the shale gas is important not only to the residential, commercial, and electric power, and industrial consumers, but especially to the continued growth of the U.S. petrochemical industry.
In “2016 Shale Gas Reality Check”, J. David Hughes expressed concern about how EIA’s Annual Energy Outlook has changed from 2014 to 2015 to 2016 increasing projected cumulative production for shale gas for the period 2014 to 2040. This is being done without any obvious backup. Hughes’ major concerns are as follows:
Some general observations with respect to the assumptions and projections in AEO2016:
• EIA assumes natural gas prices will remain at or below $5/MMbtu through 2040, when they will be $4.85/MMbtu ($2015). This is 20% below its AEO2015 price forecast over the 2015-2040period. Gas prices at the time of writing were about $3.00/MMbtu and were over $12.00/MMbtu as recently as 2008.
• EIA assumes production from shale gas will grow much faster than projected in AEO2015, with 2014-2040 production increasing by 144 trillion cubic feet (Tcf), or 31%, over its 2015 projection.
• The seven major plays analyzed in Drilling Deeper, which constituted 89% of AEO2014 projected shale gas production through 2040, amount to just 74% of 2014-2040 production in the AEO2016 projection. Production is projected to grow aggressively in the Utica and other unnamed plays.
• Thirty-six percent of production through 2040 is projected to come from the Marcellus and 65% from just three plays—the Marcellus, Haynesville and Utica—highlighting yet again that high quality shale gas plays are not ubiquitous.
• Considering that AEO2015 and AEO2016 are just 12 months apart, there is a lot of change in projected production profiles for individual plays and total production—which raises questions about the robustness, or lack thereof, of the EIA’s forecasting methods.
Let’s see how long natural gas can supply decreasing crude oil markets, increasing use over coal in the power industry, increasing demand for petrochemical feedstocks, and ship LNG offshore all at the same time. In Appendix A is a spreadsheet I put together to make it easier for me to understand the EIA predictions versus the J. David Hughes estimates made in “Drilling Deeper” and summarized in “2016 Shale Gas Reality Check”. I’m calling it Appendix A and separating it from this report, same as the crude oil report, because I may update it with future Appendices B, C, etc.
The numbers above the double horizontal line come from Hughes’ “2016 Shale Gas Reality Check”. The numbers below the horizontal double line are my humble conclusions. I’ll explain them as we proceed.
U.S. PETROCHEMICAL INDUSTRY FUTURE - UPSTREAM – NATURAL GAS - LOGIC VERSUS FAITH AND HOPE
Page 14 of 47
The second column is the EIA’s 2013 estimate of unproven technically recoverable reserves in trillion cubic feet (that’s right trillion). The third column is the total shale gas production from each of these plays from 2000 to June 2016 in trillion cubic feet. The fourth column is the approximate operating wells in each play as of June 2016. The fifth, sixth, and seventh columns are the EIA’s 2014, 2015, and 2016 estimates of the total production expected from each play for the period 2014 to 2040.
The plays are broken down by Hughes into the major plays – Marcellus, Haynesville, Eagle Ford, Utica, Woodford, Fayetteville, Barnett, Antrium, Bakken, and “Others”. The “Others” category are plays that the EIA thinks contains unproved recoverable reserves. This category includes Utica and Antrium, except in the technically recoverable reserves total where Utica and Antrium are listed separately. Understand? Good, explain it to me because the 534.1 TCF for “Others” category versus the total of 949.2 TCF requires a lot of faith. Hughes calls the AEO2016 “Others” estimate “an extremely aggressive profile compared to the earlier projections”. I call it fantasy necessary to keep the IEA employed.
In Hughes’ 2014 “Drilling Deeper”, he estimated the “Most Likely” number of wells producing the “Most Likely” total production from 2012 to 2040 for all the major shale gas plays, unlike tight oil where he only estimated Bakken and Eagle Ford. In “2016 Shale Gas Reality Check”, he states:
In the report Drilling Deeper, published in October 2014, I reviewed the credibility of the EIA’s Annual Energy Outlook2014 (AEO2014) forecasts for the major U.S. tight oil and shale gas plays based on the fundamental geological characteristics of each play; I also developed alternate production forecasts for each of the major shale gas plays. The EIA’s AEO2014 reference case projection over-estimated gas recovery from2014 to 2040 by 53% compared to the “Most Likely” Drilling Deeper case. AEO2015 and AEO2016 were 50% and 83% higher, respectively, than Drilling Deeper for the same period. The EIA projections are likewise considerably more optimistic than those of the University of Texas Bureau of Economic Geology (UTBEG) for the four plays it has assessed.
The eight column of Appendix A lists the Hughes projections from “Drilling Deeper”, the 2014 report that you can also get from the Post Carbon Institute web site.
One of the main complaints Hughes had about the AEO2016 was the increase of the shale gas production from 2015 to 2016 of 31%. Where do these numbers come from? Let’s look at the 2014, 2015, and 2016 numbers.
Year Total Production from 2014 to 2040 Average Production Per Year for 27 Years
2014 423.2 trillion cubic feet 15.67 trillion cubic feet per year 2015 462.6 trillion cubic feet 17.13 trillion cubic feet per year 2016 602.9 trillion cubic feet 22.33 trillion cubic feet per year Hughes 2014 298.1 trillion cubic feet 11.04 trillion cubic feet per year
U.S. PETROCHEMICAL INDUSTRY FUTURE - UPSTREAM – NATURAL GAS - LOGIC VERSUS FAITH AND HOPE
Page 15 of 47
The numbers differ slightly in his report due to rounding up plus don’t be confused between average production over 27 years calculated above and the final production rate you see in year 2040 in the Hughes report. The important point is the tremendous increase from 2015 to 2016 and the difference between even the lower AEO2014 and Hughes’ “Drilling Deeper” estimates
Now let’s compare the AEO2014, 2015, and 2016 average production per year numbers with 2015 production. 2015 shale gas (not total) production was 15.2 trillion cubic feet. See Figure 6, “U.S. Shale Gas Production”. From the figure, it looks like shale gas production is going to the stratosphere. The EIA is predicting the launch. But 2016 was a bummer.
Look at Figure 7, “U. S. Total Natural Gas Production And Henry Hub Price Predicted By EIA AEO2016 Through 2040”, from the Hughes “2016 Shale Gas Reality Check”. Notice the following:
1. U.S. total natural gas production will continue its steep increase all the way to 2040, care of the increasing shale gas production. This is what you wanted to hear U.S. Petrochemical industry, isn’t it!? We’ll we are bringing it to you right here from the Walt Disney, soon to be the Elon Musk, school of technology. If you can dream it, than it will certainly happen. Just leave your donation at the front door, Brothers and Sisters!
2. The other categories of natural gas production, including conventional and offshore, seem to be flat, even declining. What’s going on here? Well, we can’t fake the past numbers that show irreversible declines so the best we can do is show levelling off. Can’t recycle this stuff!
3. In spite of this increasing demand for natural gas, the price will only rise to an affordable about $5 per MMbtu in 2015 dollars. A top used car salesman couldn’t make a better pitch!
4. If population is increasing than demand must increase, right? Whatever humans want, they will get. Also more humans means a better life and more, more to consume for us all! However, we don’t want to increase domestic demand too much because we need some good news for the LNG exporters so there must be excess production. Notice the excess starts in 2017, how convenient.
If you believe all this BS, you are a prime target for a Ponzi Scheme, except in this one you don’t just lose your money. Anyone who understands the geology and has been following the tight oil and shale gas situation knows the issues. From “2016 Shale Gas Reality Check” – Fundamentals Section” :
Key fundamentals used in projecting future production of tight oil plays in Drilling Deeper were: • Rate of well production decline: Shale gas plays have high well production decline rates,
typical in the range of 75-85% in the first three years. • Rate of field production decline: Shale gas plays have high field production declines,
typically in the range of 30-45% per year, which must be replaced with more drilling to maintain production levels. Average well quality: All shale gas plays invariably have “core” areas or “sweet spots” where individual well production is highest and hence the economics are best. Sweet spots are targeted and drilled off early in a play’s lifecycle, leaving lesser quality rock to be drilled as the play matures (requiring higher gas prices to be economic); thus the number of wells required to offset field decline inevitably increases with time.
U.S. PETROCHEMICAL INDUSTRY FUTURE - UPSTREAM – NATURAL GAS - LOGIC VERSUS FAITH AND HOPE
Page 16 of 47
Although technological innovations including longer horizontal laterals, more fracturing stages, more effective additives, and higher volume treatments have increased well productivity in the early stages of the development of all plays, they have provided diminishing returns over time and cannot compensate for poor quality reservoir rock. The generally low gas prices in the past several years has led gas producers to focus on sweet spots, disproportionately depleting high-productivity drilling locations compared to the overall number of potential drilling locations in each play.
• Number of potential wells: Plays are limited in area and therefore have a finite number of locations that can be drilled. Once the locations run out, production goes into terminal decline.
• Rate of drilling: The rate of production is directly correlated with the rate of drilling, which is determined by the level of capital investment.
Hughes’ estimate is for a much decreased average shale gas production over the next 27 years, but is that the worst case scenario? I don’t think so, but I would even venture a guess at what the shale gas production will be ten years from now. It depends heavily on how long the present economic system can hold out care of Federal Reserve money printing and skyrocketing total domestic debt. One thing is for sure, as far as I am concerned, the price of Henry Hub natural gas will be above $10 per MMbtu, probably much higher, within ten years. Now, I will present my reasons.
Short Term Natural Gas Consumption Could Increase More Than the EIA is Predicting
There are many consumers competing for the U.S. natural gas supply, and not all of them are Americans. Notice in the ninth column, “Month/Year Prod Peaked”, of Appendix A that production has peaked in all the early shale gas plays, including Marcellus. Not to worry, production levels will return as soon as… when? Well, as soon as the natural gas price rises, or as soon as Trump displays his magic wand, or as soon as Harold Hamm is let loose on the countryside. Wait what is Chesapeake Energy doing lately? Call the Federal Reserve, we need more money!
Figure 8, “U.S. Total Natural Gas Withdrawals 1949-2015”, shows the history of natural gas consumption in the U.S. very clearly. The period from post WWII to 1972, natural gas withdrawals increased. 1972 was about the time both conventional oil and gas production peaked. The period 1973 to 1985 was a period of one energy crisis after another. Talk about energy conservation began during this period. The period from 1985 to 1997 was a period of expansion in the petrochemical industry, and the talk of energy conservation was almost nonexistent. By 1998, U.S. natural gas production was levelling off. Basic chemicals plants, ammonia and methanol started having trouble staying in business and eventually shut down. Now, we are talking about a natural gas supply crisis again. After the recovery of 2009 caused by the second Federal Reserve engineered bubble, called the “Subprime Mortgage Crisis”, Wall Street and company were given even more money to throw at something. This time they threw it at very low profit to no profit tight oil and shale gas exploration. The hope was the prices of both crude oil and natural gas would rise to the occasion. They didn’t and then mid-2014 happen and the price of crude oil started to
U.S. PETROCHEMICAL INDUSTRY FUTURE - UPSTREAM – NATURAL GAS - LOGIC VERSUS FAITH AND HOPE
Page 17 of 47
plummet. However, what do we do with these tight oil and shale gas companies we loaned all this money to? Renegotiate and give them more money so the withdrawals continued to rise from 2006 until 2015. We will see soon what happens now.
Residential and Commercial
After reading the “History of Natural Gas Post WWII” section, it should be clear what sectors come first in the natural gas consumption line. One “energy crisis” after another as shown that as soon as New York city or any other big city north of Memphis is worried about getting their supply of natural gas, one liberal congressman or woman after another hits the floor of Congress shouting about Texans, Oklahomans, or Louisianans being greedy. Don’t worry; we’ll save you again as long as you pay the bill, at least until it’s a choice between our butts and your butts. Hehehehehe!
Figure 9, “U.S. Natural Gas Withdrawals By User”, shows that residential consumption has levelled off around 4.8 trillion cubic feet per year moving above and below that range each year depending on the weather pattern that year. Commercial consumption follows almost the same pattern as residential levelling off around 3.1 trillion cubic feet per year. That’s why we haven’t heard any major complaints lately about natural gas supplies or prices.
Electric Power
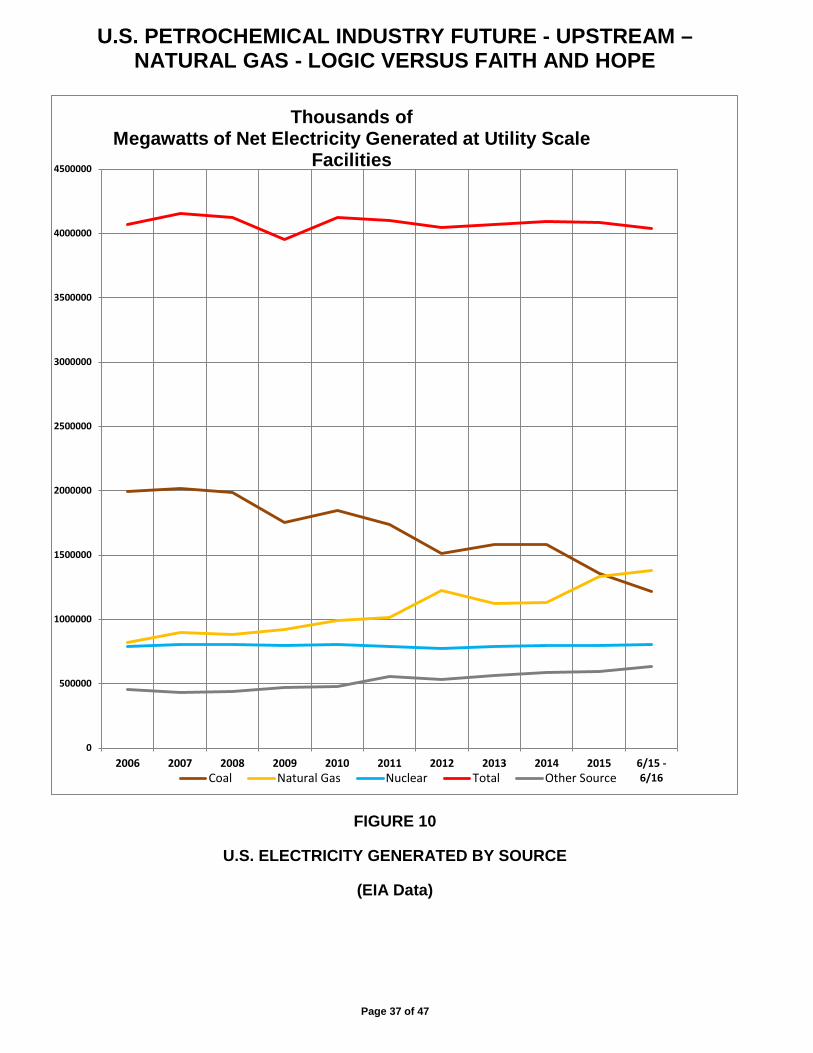
Electric power withdrawals of natural gas have been showing an upward trend since the early 1990s. Since 2003, electric power withdrawals have shown a significant increase due to U.S. electric power switching from coal to natural gas as shown in Figure 10, “U.S. Electricity Generated By Source”.
In EIA's Annual Energy Outlook 2016 Reference case, the natural gas generation share falls until about 2020, and then climbs steadily over the next two decades. Natural gas is projected to regain the largest share in the electricity mix by 2024 and maintain that position through 2040.
Look at Figures 9 and 10. Does it look like natural gas generation will fall? The trend of increasing natural gas generation is going to continue, and maybe even the rate of replacing coal power generation will increase. Natural gas generation cost less than coal, plus it is a better mix with wind and solar because it can easily startup to satisfy peak demand.
Industrial
Figure 8 shows the industrial sector’s consumption of natural gas was falling until 2009 and then an upward trend has been established since then. Many new petrochemical facilities are in the process of being installed and many others are planned, each requiring natural gas generated power and natural gas feedstock for a growing number of methanol and ammonia plants. Trump’s agenda is going to try to make that upward trend continue as fast as possible.
U.S. PETROCHEMICAL INDUSTRY FUTURE - UPSTREAM – NATURAL GAS - LOGIC VERSUS FAITH AND HOPE
Page 18 of 47
Natural Gas Pipeline Exports
Figure 11, “U.S. Net Imports of Natural Gas”, shows that the U.S. has been a net importer of natural gas, but the recent trend is less imports and more exports. About all the natural gas imports are from Canada, which supplies states bordering Canada. About 67% of the exports are to Mexico, and the remaining 33% to Canada, probably eastern provinces. The trend to increase exports to Mexico will continue with the U.S. eventually becoming a net exporter of pipeline natural gas. Of course, that will all change when the U.S. shale gas supply starts to dwindle, but Mexico will be no help to the U.S. And probably Canada’s available natural gas export supply will be on a rapid downtrend also once they get their west coast LNG facilities built. See Figure 13, “North American Import/Export Terminals – Approved”.
LNG
Prior to 2008, all the talk was about importing LNG, now it’s all about exporting LNG and building one export facility after another as fast as possible. Explain to me how exporting a valuable resource like natural gas has anything to do with energy independence.
Figure 12, “North American Import/Export Terminals – Existing”, shows how the U.S. geared up for a declining natural gas production profile in the early last decade by building LNG import facilities on both the heavily populated, high electricity priced northeast coast and the heavily natural-gas-dependent-petrochemical-plant populated Gulf Coast.
Now we have a hundred years before we need to start worrying! That’s plenty time for the Baby Boomers to go out in style! All of a sudden, it’s not import time; it’s export time. Saved again! Not so fast, Pilgrim!
Figure 13, “North American Import/Export Terminals - Approved”, and Figure 14, “North American Exports Terminals - Proposed”, show that the LNG industry is gearing up fast to exhaust first west of the Mississippi shale gas and then the Marcellus shale gas supply as fast as possible. Hear this all you genius X Generation investors, and a few over-the-hill Baby Boomers we can’t seem to get rid of, who want to commit financial suicide. Bechtel and CBI are more than willing to hold your hand as you walk down the aisle with Rosie O’Donnell. But you’ll be sorry!
Marcellus shale gas is the target. See New York, we told you before to get your own gas. It’s in Ohio, West Virginia, Pennsylvania, and your own state. You don’t want it? You don’t want to mess up the little clear land that’s left? The Texans will take it because Mexico, Japan, China, and the rest of Asia may want it, and they’ll pay a high price for it too! Now don’t come complaining about the shortage of natural gas anymore. From RBN Energy:
U.S. PETROCHEMICAL INDUSTRY FUTURE - UPSTREAM – NATURAL GAS - LOGIC VERSUS FAITH AND HOPE
Page 19 of 47
Miles And Miles Of Texas - What Happens When Texas Becomes A Net Natural Gas Demand Region Tuesday, 11/22/2016 Published by: Rusty Braziel
Some 3.2 Bcf/d of new LNG export capacity will be coming online along Texas’s Gulf Coast over the next two and a half years, and 8 Bcf/d of new natural gas pipeline capacity is under development to transport vast quantities of gas through Texas to the Mexican border. But while gas-export opportunities abound, Texas gas production is down, mostly due to a big fall-off in Eagle Ford output, so exporters will need to pull gas from as far away as the Marcellus/Utica to meet their fast-growing requirements. That will flip Texas from a net producing region to a net demand region once when you factor in exports that will flow through the state. This profound shift will put extraordinary pressure on Texas’s unusually complex network of interstate and intrastate pipeline systems, which will need to be reworked and expanded to deal with the new gas-flow patterns. It also will have a significant effect on regional gas pricing––putting a premium on Texas prices. No kidding!?
Let’s add up all the potential natural gas export capacity for grins in the following tables (from Figures 12, 13, and 14 as of December 2016:
LNG Facility Status Capacity Per Day Potential Export Per Year Billion Cubic Feet Trillion Cubic Feet
Cheniere/Sabine Pass LNG (1 &2) Existing 1.4 0.51 Cheniere/Sabine Pass LNG (3&4) In Constr. 1.4 0.51 Sempra/Cameron LNG In Constr. 2.1 0.76 Freeport LNG In Constr. 2.14 0.78 Dominion-Cove Point LNG In Constr. 0.82 0.30 Cheniere/Corpus Christi LNG In Constr. 2.14 0.76 Sabine Pass Liquefaction In Constr. 1.4 0.51 Southern LNG In Constr. 0.3 0.01 Southern Union-Lake Charles LNG Approved 2.2 0.80 Magnolia LNG Approved 1.08 0.39 Sempra/Cameron LNG Approved 1.41 0.51 EXXON Mobil/Golden Pass Proposed-Pending 2.1 0.77 Application Gulf LNG Liquefaction Proposed-Pending 1.5 0.55 Application Venture Global Calcasieu Pass Proposed-Pending 1.41 0.51 Application Texas LNG Brownsville Proposed-Pending 0.55 0.20 Application Rio Grande LNG – Next Decade Proposed-Pending 3.6 1.31 Application Annova LNG Brownsville Proposed-Pending 0.9 0.33 Application Port Arthur LNG Proposed-Pending 1.86 0.68 Application
U.S. PETROCHEMICAL INDUSTRY FUTURE - UPSTREAM – NATURAL GAS - LOGIC VERSUS FAITH AND HOPE
Page 20 of 47
LNG Facility Status Capacity Per Day Potential Export Per Year Billion Cubic Feet Trillion Cubic Feet
Louisiana LNG Proposed- In 0.3 0.11 Pre-Filing Eagle LNG Partners Proposed-In 0.075 0.03 Pre-Filing Freeport LNG Dev Proposed-In 0.72 0.26 Pre-Filing Cheniere/Corpus Christi LNG Proposed-In 1.4 0.51 Pre-Filing Venture Global LNG Proposed-In 2.8 1.02 Pre-Filing EXXON Mobil and Gang/Alaska Proposed-In 2.55 0.93 Pre-Filing G2 LNG Proposed-In 1.84 0.67 Pre-Filing Driftwood LNG Proposed-In 4.0 1.46 Pre-Filing Delfin LNG Proposed-In 1.8 0.66 Pre Filing Next Customer? Grand Total So Far 43.8 15.89 Minus EXXON Mobil and Gang 0.93 (Conventional Alaskan gas) Total Dependent on Shale Gas 14.95 90% On-Line Time 13.45 Total already existing or in construction or approved 5.84 Now Ladies and Gentleman for our next magic trick Bullwinkle (the EIA), assisted by Rocky, will pull available shale gas production for export out of his hat. Rocky, watch me pull 14.95 trillion cubic feet of available shale gas production for export out of the hat! Look at Figure 7, “U.S. Total Natural Gas Production And Henry Hub Price Predicted By EIA AEO2016 Through 2040”. Notice the predicted production level for 2040. That’s about 42 trillion cubic feet per year, isn’t it? Notice also that production available export is 18% of total production, which is about 7.6 trillion cubic feet. Oops!!! I gotta get a new hat! Bullwinkle! We’ll revise AEO2017 even higher.
Now Ladies and Gentleman, Bullwinkle will show you another trick later. In the meantime, go to the next tent where the FERC Brothers have a fire sale for LNG companies. The line is long and there have been many sales already and we are running out of names fast.
After you get your LNG company, the third tent has the Money Changers. We have the 401K- IRA Brothers, the Public Pension Brothers, the Insurance Brothers, the Hedge Fund Brothers, and maybe even Uncle Sammy will show up. They all have what you need for your new LNG company! Let’s hear it for Bullwinkle and Rocky!
U.S. PETROCHEMICAL INDUSTRY FUTURE - UPSTREAM – NATURAL GAS - LOGIC VERSUS FAITH AND HOPE
Page 21 of 47
The Overly Optimistic Petrochemical Industry
The U.S. petrochemical industry is betting heavily on shale gas, whether it is natural gas feedstock for ammonia and methanol plants or NGL components, ethane and propane, for ethylene or propylene production. The bet centers mainly on the Marcellus and now including the Utica plays. The other plays are on the way downhill fast, but that doesn’t stop the nearsighted hype about an expanding industry.
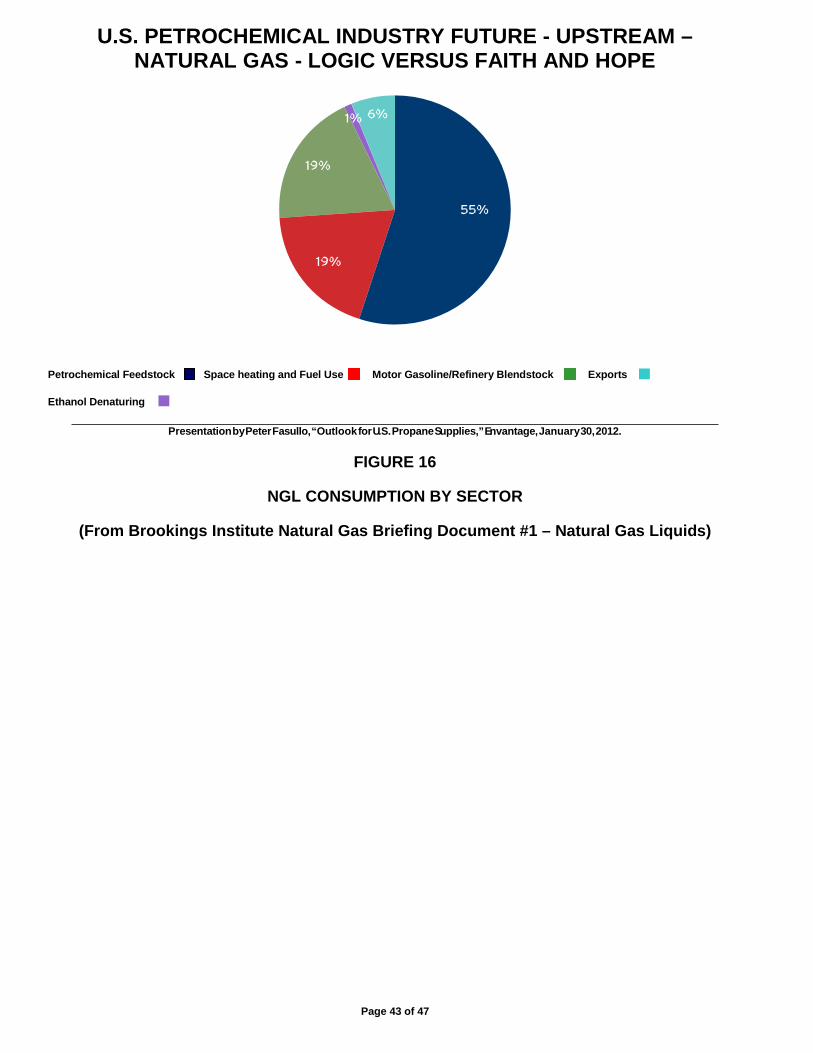
The recently revived NGL industry is the result of all the “rich gas” in many of the plays, especially Marcellus. Figure 16, “NGL Consumption By Sector” and Figure 17, “NGL Consumption by Sector And NGL Source”, show where and how the major components of NGL, ethane, propane, butane, isobutane, and natural gasoline are consumed.
It wasn’t long ago that NGLs were being imported to prop up a declining petrochemical outlook. Now there is even recent talk about exporting liquid ethane, if it hasn’t already started, until all the ethane crackers get cracking. This sweet milk could turn sour in a hurry.
I will address shale gas and the petrochemical industry in more detail in the next report about the future of the petrochemical industry- downstream; however, when the shale gas craze starts to wind down so will the NGL craze. Many may be left holding an empty bag.
The Coming Collapse of the U.S. Shale Gas Industry
The shale gas industry has been an ungoing Ponzi scheme since it started. The definition of a Ponzi scheme is as follows:
A form of fraud in which belief in the success of a nonexistent enterprise is fostered by the payment of quick returns to the first investors from money invested by later investors.
The object of an enterprise is to make a profit, not to drill wells. The drilling is supposed to be the road to profit, not greater and greater long term debt just to stay alive and keep the CEOs receiving their exorbitant gains through higher stock prices and ever increasing stock bonuses. Whether it is fraud or just plain wishful thinking by investors to the extreme, the outcome is always the same. It is the same outcome oil wildcatters have experienced since 1901 Spindeltop. Drill, drill, drill faster and exhaust faster until it isn’t worth drilling anymore. The first ones in get out and most of the others are taken to the cleaners.
The major oil and gas companies know the story about shale gas, but they have get on board if they want to stay in the game. They will probably inherit what is left of tight oil and shale gas industry. Rex Tillerson, the CEO of ExxonMobil, told the Council on Foreign Relations in New York City in June 2012, “We’re losing our shirts [on shale gas production]. We’re making no money. It’s all in the red.” Since then, he has made statements that he missed the boat on shale gas and underestimated what technology could accomplish. Does he really believe that?
U.S. PETROCHEMICAL INDUSTRY FUTURE - UPSTREAM – NATURAL GAS - LOGIC VERSUS FAITH AND HOPE
Page 22 of 47
So what has been accomplished? Most of the plays are already on the way down, and just about all the smaller players are heavily in debt. From SRSROCCO Report:
The countdown has started as the demise of the great U.S. shale gas industry has begun. This will have a disastrous impact on the U.S. economy as shale gas production declines in a big way. Unfortunately, very few Americans understand how sickly the domestic shale gas industry truly is, because they have been brainwashed to believe the United States is heading towards energy independence.
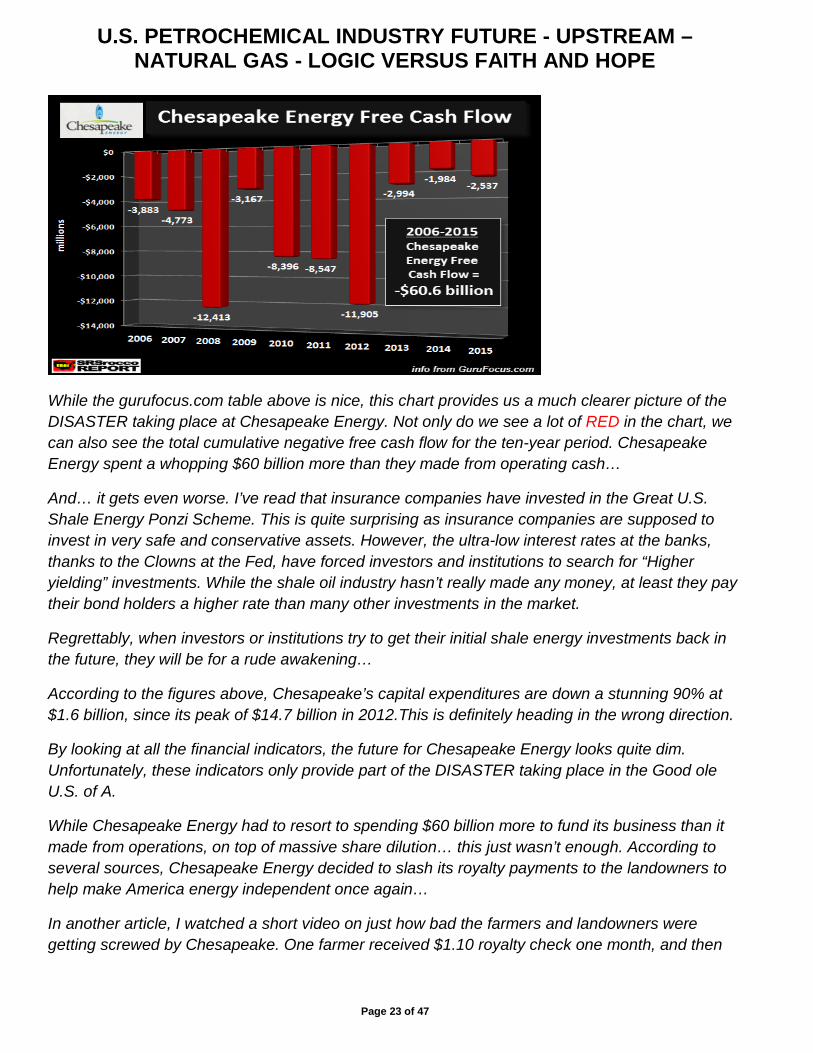
Chesapeake Energy, which is the second largest natural gas producer in the country, hasn’t made a lousy nickel for at least the past ten years:
This table comes from the website, gurufocus.com.
As we can see in the table above, Chesapeake Energy is completely in the RED as it pertains to free cash flow or real profits since 2006. This is quite an amazing accomplishment from the second largest natural gas producer in the country. You would think, being BIG would guarantee profits. I gather someone forgot to tell Chesapeake’s management the important financial tidbit called, “Economies of scale.”
I took the data for Chesapeake’s free cash flow and made the chart below:
U.S. PETROCHEMICAL INDUSTRY FUTURE - UPSTREAM – NATURAL GAS - LOGIC VERSUS FAITH AND HOPE
Page 23 of 47
While the gurufocus.com table above is nice, this chart provides us a much clearer picture of the DISASTER taking place at Chesapeake Energy. Not only do we see a lot of RED in the chart, we can also see the total cumulative negative free cash flow for the ten-year period. Chesapeake Energy spent a whopping $60 billion more than they made from operating cash…
And… it gets even worse. I’ve read that insurance companies have invested in the Great U.S. Shale Energy Ponzi Scheme. This is quite surprising as insurance companies are supposed to invest in very safe and conservative assets. However, the ultra-low interest rates at the banks, thanks to the Clowns at the Fed, have forced investors and institutions to search for “Higher yielding” investments. While the shale oil industry hasn’t really made any money, at least they pay their bond holders a higher rate than many other investments in the market.
Regrettably, when investors or institutions try to get their initial shale energy investments back in the future, they will be for a rude awakening…
According to the figures above, Chesapeake’s capital expenditures are down a stunning 90% at $1.6 billion, since its peak of $14.7 billion in 2012.This is definitely heading in the wrong direction.
By looking at all the financial indicators, the future for Chesapeake Energy looks quite dim. Unfortunately, these indicators only provide part of the DISASTER taking place in the Good ole U.S. of A.
While Chesapeake Energy had to resort to spending $60 billion more to fund its business than it made from operations, on top of massive share dilution… this just wasn’t enough. According to several sources, Chesapeake Energy decided to slash its royalty payments to the landowners to help make America energy independent once again…
In another article, I watched a short video on just how bad the farmers and landowners were getting screwed by Chesapeake. One farmer received $1.10 royalty check one month, and then
U.S. PETROCHEMICAL INDUSTRY FUTURE - UPSTREAM – NATURAL GAS - LOGIC VERSUS FAITH AND HOPE
Page 24 of 47
$0.10 the next. What was really shocking was that one landowner received a bill for $30,000 from Chesapeake, instead of a royalty payment…
But, as several Americans in the video explain, they haven’t been receiving their royalty payments even though Chesapeake continues to extract gas. While other companies are actually paying their landowners their fair share of royalties, the situation in the entire U.S. Shale Energy Industry isn’t much better than the financial catastrophe taking place at Chesapeake.
I found this wonderful table in an article, Oil Industry Spending Too Much; Deficit Spending Is Unsustainable, on the free cash flow for the Large Cap E & P oil and gas companies in the United States. If there is one chart you have to see, this is the one:
This chart gives us a true picture of the DISASTER taking place in the U.S. Shale Energy Industry. While I have focused this article on the second largest shale gas producer in the U.S., we can clearly see that the entire group lost money in 2012/2014, and the industry as a whole has been in the RED since 2009…
Furthermore, the table also shows a forecast for continued negative free cash flow for the entire industry in 2015 and 2016. Thus, the U.S. Shale Energy Industry will have been in the RED for eight consecutive years.
Today, the price of oil is trading half of what it was in 2014 at $49-$50.While some analysts are pointing to “increased efficiency” and “lower production costs”, this won’t save the industry as it is still producing an INFERIOR and UNECONOMIC quality of oil and gas…Moreover, the amount of damage done to local and state roads by the Shale Fracking Industry is huge…
U.S. PETROCHEMICAL INDUSTRY FUTURE - UPSTREAM – NATURAL GAS - LOGIC VERSUS FAITH AND HOPE
Page 25 of 47
Well there you have it. Fracking shale gas in the Pennsylvania Marcellus generated $204 million in impact fees, but the road damage topped $3.5 billion. What a deal. From the information I have read, it takes an estimated 1,600 truck trips for a single fracked well…
As we can see from all the information and data provided in this article, the Great U.S. Shale Energy Industry has been a complete failure. Moreover, we are witnessing the U.S. Shale Gas Industry, COUNTDOWN to DISASTER. When the industry finally implodes, who will pay to properly cap the tens of thousands of fracked wells?? Who will fix the roads? What happens when the natural gas-electric generation supply drops considerably?
Yes, that is correct. The United States will be in serious trouble. However, Americans today have no clue that the U.S. Shale Energy Industry has made no real money, ripped off landowners of their royalty payments, polluted groundwater and destroyed countless roads across the country, all in the effort to make us “Energy Independent.”
This is not new news. Many like J. David Hughes, Art Berman, Richard Heinberg, William Kunstler, Professor Al Bartlett, and many others have tried to warn about the coming energy crisis, and especially the ridiculous claims made about tight oil and shale gas ushering in a new petrochemical age. Some did it because they are in the oil and gas industry and wanted to separate the facts from the hype. Some are social activists, some are environmentalists, and some just think it is their duty to warn the public. The issue is not their motives, but the facts they talk about.
Richard Heinberg in his book, “Snake Oil – How Fracking’s False Promise of Plenty Imperils Our Future”, examines the false claims of the standard industry hype. In Chapter 5 of the book, he hits the nail on the head concerning what the fracking craze is really about and an example of who benefits.
SNAKE OIL: Chapter 5 - The Economics Of Fracking: Who Benefits?
In the 1980s, two Oklahoma twentysomethings, named Aubrey McClendon and Tom L. Ward, pooled $50,000 of investment capital and started a natural gas company. They decided to call it Chesapeake Energy, since McClendon (who emerged as the company’s moving force) was particularly fond of the Chesapeake Bay region of Maryland and Virginia. From the start, McClendon focused the business on unconventional gas plays and cutting-edge drilling technologies.
Fast-forward to the mid-2000s. As the fracking frenzy was starting to sizzle in Texas and Oklahoma, Chesapeake was there turning up the heat. With the Barnett, Fayetteville, and Haynesville plays yielding shale gas in ever-greater amounts, Chesapeake Energy quickly became America’s second-biggest natural gas producer, and a Fortune 500 company with over 13,000 employees. By 2008, Aubrey McClendon was the highest-paid of all CEOs of S&P 500 companies. In 2011, Forbes named him “America’s Most Reckless Billionaire” in a cover story detailing his lavish and highly leveraged lifestyle. He owned homes in several states, a mansion
U.S. PETROCHEMICAL INDUSTRY FUTURE - UPSTREAM – NATURAL GAS - LOGIC VERSUS FAITH AND HOPE
Page 26 of 47
on “Billionaire’s Row” in Bermuda, and 16 antique boats worth nine million dollars. He also had a habit of using his property as collateral in order to borrow money with which to buy still more.
Aubrey isn’t around anymore, but there still many like him out there draining what resources the continental U.S. has left.
The Ready to Collapse U.S. Economy
Let me repeat what I wrote in “U.S. Petrochemical Industry Future - Upstream - Crude Oil - Logic Versus Faith And Hope”:
First, look at Figures (18), “U.S. Three-Month Interest Rate”, and (19), “U.S. Gross Public Debt”. The U.S. debt is approaching 20 trillion dollars, if it isn’t already there, and rising fast. The latest American hero is Donald Trump, who I voted for because I’m a Libertarian and the other candidate is the type who got the U.S. to where it is now. However, he is going to “Make America Great Again”? It’s like bringing in a new quarterback when the team is losing 62-0.Take another look at Figure (19) and tell me how he will do that without a tremendous amount of economic pain which this brand of American public can’t tolerate plus a significant reduction in the bureaucracy that is entrenched in the Washington D.C. rat hole like a frightened rat.
Since the bursting of the 2000 “Dot.com Bubble”, the Federal Reserve has accommodated the Baby Boomers generation in their quest to maintain the lifestyle they have been accustomed to until their very end, all at the expense of future generations. The latest accommodation has left us at near zero interest rates for eight years. Now these “goof-balls” at the Federal Reserve tell the gullible that they can now raise rates because we apparently have reached their employment and inflation goals. The paltry second 25 basis points is their latest proof that they are in control of the financial situation. Remember 2008. That should take the place of remember December 7th, 1941.
Watch the economic decline in the first six months of 2017 as the ten-year rate rises to 3% and possibly higher. There won’t be any more interest rate hikes in 2017, and possibly this is the year when the latest straw breaks the camel’s back. We had Greece and now Venezuela, India, Italy, and Brazil for mainstream news to talk about. The EU is collapsing via their growing number of insolvent banks. China has hit the wall maxed with everything that the Chinese can’t afford to consume, and it isn’t going anywhere but down. Japan is into its final stage of delusion.
When the dollar collapse that many very smart people have been predicting starts, it will take the tight oil-shale gas craze with it. All the minor leaguers that are on the field now could be swept off and all that will remain will be the major leaguers. What will that do to supply and the resulting price of oil? and the price of natural gas?
Conclusions
The shale gas industry is in much worst condition then the tight oil industry as the SRSROCCO Report explains so well. If you don’t believe it, than it is a waste of time trying to convince you. It
U.S. PETROCHEMICAL INDUSTRY FUTURE - UPSTREAM – NATURAL GAS - LOGIC VERSUS FAITH AND HOPE
Page 27 of 47
won’t be long before this illusion that the Baby Boomer generation created starting in the late 1970s and which the Federal Reserve has tried to preserve will fade.
The immediate concern about natural gas should be a rapid increase in the price. Figure 20 shows how the natural gas price has fallen from a high in 2008 to the present lows due to the shale gas craze fueled by more Fed easy money and tremendous increases in total debt. I believe the Age of Growth that the Baby Boomers enjoyed throughout their lives so far will transition into the Age of Survival that the younger generations will have to struggle with. I think the transition has already begun.
I’m neither a social activist nor an environmentalist. I’m not interested in returning to a pre WWI lifestyle either. Mother Nature needs no help from humans; she will take care of excess pollution and excess humans just like she takes care of excess animals. I’m a Libertarian who believes in capitalism and minimum government interference, low taxes, minimum regulations, and all that stuff; but I’m not out to save the world. I’m looking for viable projects and individuals who have a chance to survive the transition from the Age of Growth to the Age of Survival that is in the very early stages. Also, I’ve spent 43 years in the U.S. petrochemical industry, and I wanted to see what the future of the major feedstocks – oil and gas – look like, and therefore what are the future prospects of the traditional petrochemical industry. I have an MBA and understand firm grasp of real microeconomics and the history of the industry. So you can’t lay BS on me about energy independence because I understand what it’s really all about. It is time to let Logic instead Faith and Hope rule again.
U.S. PETROCHEMICAL INDUSTRY FUTURE - UPSTREAM – NATURAL GAS - LOGIC VERSUS FAITH AND HOPE
Page 28 of 47
FIGURE 1
TYPICAL NATURAL GAS PROCESSING PLANT
U.S. PETROCHEMICAL INDUSTRY FUTURE - UPSTREAM – NATURAL GAS - LOGIC VERSUS FAITH AND HOPE
Page 29 of 47
Figure 2
Constituents of “Wet Gas”
U.S. PETROCHEMICAL INDUSTRY FUTURE - UPSTREAM – NATURAL GAS - LOGIC VERSUS FAITH AND HOPE
Page 30 of 47
FIGURE 3
NATURAL GAS PROCESSING PLANTS IN U.S. IN 2009
2009 Plants = 489
As of October 2012 Plants = 517
No Recent Data from EIA
U.S. PETROCHEMICAL INDUSTRY FUTURE - UPSTREAM – NATURAL GAS - LOGIC VERSUS FAITH AND HOPE
Page 31 of 47
FIGURE 4
US NATURAL GAS COMPRESSOR STATIONS AND PIPELINES AS OF 2008
No Recent Data from EIA
U.S. PETROCHEMICAL INDUSTRY FUTURE - UPSTREAM – NATURAL GAS - LOGIC VERSUS FAITH AND HOPE
Page 32 of 47
FIGURE 5
U.S. NATURAL GAS TRANSPORT SYSTEM AS OF 2008
U.S. PETROCHEMICAL INDUSTRY FUTURE - UPSTREAM – NATURAL GAS - LOGIC VERSUS FAITH AND HOPE
Page 33 of 47
FIGURE 6
U.S SHALE GAS PRODUCTION
(From EIA Web Site)
0
2000
4000
6000
8000
10000
12000
14000
16000
201520142013201220112010200920082007
U.S. Annual Shale Gas Production (Billion Cubic Feet)
U.S. Annual Shale Gas Production
U.S. PETROCHEMICAL INDUSTRY FUTURE - UPSTREAM – NATURAL GAS - LOGIC VERSUS FAITH AND HOPE
Page 34 of 47
FIGURE 7
U.S. TOTAL NATURAL GAS PRODUCTION AND HENRY HUB PRICE PREDICTED BY EIA AEO2016 THROUGH 2040
(From Hughes “2016 Shale Gas Reality Check”)
U.S. PETROCHEMICAL INDUSTRY FUTURE - UPSTREAM – NATURAL GAS - LOGIC VERSUS FAITH AND HOPE
Page 35 of 47
FIGURE 8
U.S. TOTAL NATURAL GAS WITHDRAWALS 1949-2015
0
5000000
10000000
15000000
20000000
25000000
30000000
2015
2013
2011
2009
2007
2005
2003
2001
1999
1997
1995
1993
1991
1989
1987
1985
1983
1981
1979
1977
1975
1973
1971
1969
1967
1965
1963
1961
1959
1957
1955
1953
1951
1949
U.S. Total Natural Gas Withdrawals - Million Cubic Feet
U.S. Total Natural Gas Withdrawals
U.S. PETROCHEMICAL INDUSTRY FUTURE - UPSTREAM – NATURAL GAS - LOGIC VERSUS FAITH AND HOPE