Page 1
© 2020. All rights reserved. IQVIA® is a registered trademark of IQVIA Inc. in the United States, the European Union, and various other countries.
Presented by:
Doug Long, VP, Industry Relations
Scott Biggs, Director, Supplier Services
August 2021
US Pharmaceutical Trends, Issues
and Outlook for NACDS TSE
Page 2
IQVIA Template (V2.1.0)
1
Each year at the NACDS Total Store Expo, IQVIA recognizes an industry leader who exemplifies the true meaning
of partnership through the extension of the Bernie Greenberg Pharmacy Partnership Award. Like the
namesake of this award, this recognition is to acknowledge an industry partner who displays and embraces such
traits as leadership, collaboration, and giving back to their organizations and others
This year, rather than awarding this to an
individual or a single industry partner,
IQVIA would like to honor ALL of the
pharmacy leaders, pharmacists, staff, and
pharmacies who have focused on caring
for their patients and customers during
the 2020 and 2021 COVID-19 crisis. You
and they ARE the heroes. As part of this
recognition, IQVIA provides a $10,000
contribution to the NACDS foundation
2013 Rite Aid Robert Thompson
2014 Walgreens Gerry Gleeson
2015 Walmart, Sam’s ClubDarren Townzen
John Luebker
2016 Kroger Phelicia Avery
2017 Walgreens Rick Gates
2018 Albertsons Dan Salemi
2019 WegmansJohn Carlo
Jack Coultry
2020 All pharmacists, staff and pharmacies
2021All pharmacy leaders, pharmacists, staff and
pharmacies
Year Company Winner(s)
IQVIA© 2021 Confidential & Proprietary
Page 3
2
COVID Cases, Deaths
and Vaccines
IQVIA – Confidential & Proprietary
Page 4
3
Daily COVID Cases in the U.S. continue to increase in recent weeks
IQVIA© 2021 Confidential & Proprietary
0
500
1,000
1,500
2,000
2,500
3,000
3,500
4,000
4,500
1/2
3/2
0
2/6
/20
2/2
0/2
0
3/5
/20
3/1
9/2
0
4/2
/20
4/1
6/2
0
4/3
0/2
0
5/1
4/2
0
5/2
8/2
0
6/1
1/2
0
6/2
5/2
0
7/9
/20
7/2
3/2
0
8/6
/20
8/2
0/2
0
9/3
/20
9/1
7/2
0
10
/1/2
0
10
/15
/20
10
/29
/20
11
/12
/20
11
/26
/20
12
/10
/20
12
/24
/20
1/7
/21
1/2
1/2
1
2/4
/21
2/1
8/2
1
3/4
/21
3/1
8/2
1
4/1
/21
4/1
5/2
1
4/2
9/2
1
5/1
3/2
1
5/2
7/2
1
6/1
0/2
1
6/2
4/2
1
7/8
/21
7/2
2/2
1
8/5
/21
U.S. COVID Daily Cases
New Cases 7-Day Moving Avg
Source: https://covid.cdc.gov/covid-data-tracker/#trends_dailytrendscases – data as of August 18, 2021
Page 5
4
Daily COVID Deaths in the U.S. have also been increasing in recent weeks
IQVIA© 2021 Confidential & Proprietary
0
500
1,000
1,500
2,000
2,500
3,000
3,500
4,000
4,500
1/2
2/2
020
2/5
/202
0
2/1
9/2
020
3/4
/202
0
3/1
8/2
020
4/1
/202
0
4/1
5/2
020
4/2
9/2
020
5/1
3/2
020
5/2
7/2
020
6/1
0/2
020
6/2
4/2
020
7/8
/202
0
7/2
2/2
020
8/5
/202
0
8/1
9/2
020
9/2
/202
0
9/1
6/2
020
9/3
0/2
020
10
/14
/202
0
10
/28
/202
0
11
/11
/202
0
11
/25
/202
0
12
/9/2
020
12
/23
/202
0
1/6
/202
1
1/2
0/2
021
2/3
/202
1
2/1
7/2
021
3/3
/202
1
3/1
7/2
021
3/3
1/2
021
4/1
4/2
021
4/2
8/2
021
5/1
2/2
021
5/2
6/2
021
6/9
/202
1
6/2
3/2
021
7/7
/202
1
7/2
1/2
021
8/4
/202
1
U.S. COVID Daily Deaths
Daily Deaths 7-Day Moving Avg
Source: https://covid.cdc.gov/covid-data-tracker/#trends_dailytrendscases – data as of August 18, 2021
Page 6
5
Daily Count of Total Doses Administered and Reported
IQVIA© 2021 Confidential & Proprietary
0
500,000
1,000,000
1,500,000
2,000,000
2,500,000
3,000,000
3,500,000
4,000,000
4,500,000
5,000,000
12
/14
/202
0
12
/21
/202
0
12
/28
/202
0
1/4
/202
1
1/1
1/2
021
1/1
8/2
021
1/2
5/2
021
2/1
/202
1
2/8
/202
1
2/1
5/2
021
2/2
2/2
021
3/1
/202
1
3/8
/202
1
3/1
5/2
021
3/2
2/2
021
3/2
9/2
021
4/5
/202
1
4/1
2/2
021
4/1
9/2
021
4/2
6/2
021
5/3
/202
1
5/1
0/2
021
5/1
7/2
021
5/2
4/2
021
5/3
1/2
021
6/7
/202
1
6/1
4/2
021
6/2
1/2
021
6/2
8/2
021
7/5
/202
1
7/1
2/2
021
7/1
9/2
021
7/2
6/2
021
8/2
/202
1
8/9
/202
1
Daily Count of Total Doses Administered and Reported to CDC by Date Administered, United States
Total Doses Administered Daily 7-Day Avg Total Doses Daily
Data Source: https://covid.cdc.gov/covid-data-tracker/#vaccination-trends – as of August 14, 2021
Page 7
6
COVID Vaccines in Retail show an uptick starting mid-July
IQVIA© 2021 Confidential & Proprietary
0
1
2
3
4
5
6
7
8
12
/18
/20
12
/25
/20
01
/01
/21
01
/08
/21
01
/15
/21
01
/22
/21
01
/29
/21
02
/05
/21
02
/12
/21
02
/19
/21
02
/26
/21
03
/05
/21
03
/12
/21
03
/19
/21
03
/26
/21
04
/02
/21
04
/09
/21
04
/16
/21
04
/23
/21
04
/30
/21
05
/07
/21
05
/14
/21
05
/21
/21
05
/28
/21
06
/04
/21
06
/11
/21
06
/18
/21
06
/25
/21
07
/02
/21
07
/09
/21
07
/16
/21
07
/23
/21
07
/30
/21
08
/06
/21
08
/13
/21
Mill
ion
s
Chain Independents Food Mass Retail Market
Data Source: IQVIA Xponent®
Page 8
7
As of August 15th, almost 51% of the entire population is vaccinated, with over 80% of the 65+ age group vaccinated
Source: https://covid.cdc.gov/covid-data-tracker/#vaccinations – Based on CDC data as of August 15th
19
8.1
16
8.4
59.7%
50.7%
0%
10%
20%
30%
40%
50%
60%
70%
20
40
60
80
100
120
140
160
180
200
At le
ast 1
Dose
Fully
Vaccin
ate
d
Perc
en
t of P
op
ula
tion
Pop
ula
tion
in M
illio
ns
VACCINES ADMINISTERED
18
5.9
15
9.2
72.0%
61.7%
0%
10%
20%
30%
40%
50%
60%
70%
80%
20
40
60
80
100
120
140
160
180
200
At le
ast 1
Dose
Fully
Vaccin
ate
d
Perc
en
t of P
op
ula
tion
Pop
ula
tion
in M
illio
ns
VACCINES ADMINISTERED
≥ 18
49.7 44.2
90.9%
80.8%
0%
10%
20%
30%
40%
50%
60%
70%
80%
90%
100%
20
40
60
80
100
120
140
160
180
200
At le
ast 1
Dose
Fully
Vaccin
ate
d
Perc
en
t of P
op
ula
tion
Pop
ula
tion
in M
illio
ns
VACCINES ADMINISTERED
≥ 651
97
.9
16
3.2
69.8%
59.3%
0%
10%
20%
30%
40%
50%
60%
70%
80%
20
40
60
80
100
120
140
160
180
200
At le
ast 1
Dose
Fully
Vaccin
ate
d
Perc
en
t of P
op
ula
tion
Pop
ula
tion
in M
illio
ns
VACCINES ADMINISTERED
≥ 12
IQVIA© 2021 Confidential & Proprietary
Page 9
8
According to a Kaiser Family Foundation Poll conducted May 18-25, 2021:
Vaccine Hesitancy – Who are the unvaccinated?
Here Are The Biggest Groups That Are Still Refusing The Covid-19 Vaccine, Poll Finds (forbes.com) retrieved on August 10, 2021
AGE
The highest share of
unvaccinated respondents were
30-49 years old (41%), followed
by 29% ages 18-29 and 20%
ages 50-64, while only 9% of
those unvaccinated were
65 and older
SOCIOECONOMIC
STATUS
More likely to have lower
education levels (46% attended
only high school or less) and
lower income levels (42% earn
less than $40,000 per year) than
their vaccinated counterparts,
who are nearly twice as likely to
have earned a college degree
or more
POLITICAL PARTY
AFFILIATION
Nearly half of unvaccinated
respondents were Republicans
(49% versus 29% Democrats),
as opposed to 31% of
vaccinated respondents who
identified as Republicans and
59% Democrats
RACIAL IDENTITY
Both unvaccinated and
vaccinated respondents were
disproportionately likely to be
white (56% unvaccinated versus
64% vaccinated), based in the
suburbs (56% unvaccinated
versus 52% vaccinated) and
have health insurance
(76% unvaccinated versus 88%
vaccinated).
IQVIA© 2021 Confidential & Proprietary
Page 10
9
Based on race/ethnicity data available for 57% of people who have received at least one vaccine dose
Figure 1: Race/Ethnicity of People Receiving a COVID-19 Vaccine in the U.S. as of August 2, 2021
KFF
Race/Ethnicity of People Receiving a COVID-19 Vaccine in the U.S. as of August 2, 2021
Note: Totals may not sum to 100 due to rounding, Persons of Hispanic origin may be of any race but are categorized as Hispanic; other groups are non-Hispanic, Other race includes multiple race individuals
Source: Centres for Disease Control and Prevention, Demographic Characteristics of People Receiving COVID-19 Vaccinations in the United States, data as of August 2, 2021, accessed August 3, 2021,
http://covid.cdc.gov/covid-data-tracker/#vaccination-demographic; Latest Data on COVID-19 Vaccinations by Race/Ethnicity | KFF Retrieved on August 10, 2021
59%
45%
61%
10%
15%
12%
16%26%
17%6% 4%
6%1% 1%1%8% 8% 2%
People who have Received at least One Dose People who Initiated Vaccination in Last 14 Days Total U.S. Population
White Black Hispanic Asian AIAN NHOPI Other
IQVIA© 2021 Confidential & Proprietary
Page 11
10
Percent of Total Population that Has Received at Least One COVID-19 Vaccine Dose by Race/Ethnicity, March 1 to August 2, 2021
Figure 4: Percent of Total Population that Has received at Least One COVID-19 vaccine Dose by Race/Ethnicity, March 1 to August 2, 2021
Source: Vaccination data based on KFF analysis of publicity available data on state websites; total population data used to calculate rates based on KFF analysis of 2019 American Community Survey data
7%
11%
15%
20%24%
27%29%
31% 33%34% 36%
38%
5%9%
13%
19%
25%
29%32%
35%38%
39% 41% 43%
13%
19%
25%32%
38%40%
43% 44%46% 47% 48%
49%
11%16%
23%
33%
45%
50%
54%57%
60%62%
65%66%
3/1/202136 States
3/15/202139 States
3/29/202140 States
4/12/202143 States
4/26/202143 States
5/10/202142 States
5/24/202140 States
6/7/202141 States
6/21/202140 States
7/6/202140 States
7/19/202140 States
8/2/202140 States
Black Hispanic White Asian
IQVIA© 2021 Confidential & Proprietary
Page 12
11
Non-COVID weekly vaccine utilization is flat compared to 2020 after a period of accelerated activity that compensated for lockdown dips
IQVIA© 2021 Confidential & Proprietary
Source: IQVIA Weekly Sales Perspectives (WSP), July 20 – July 21; Note: Data reflects sales to clinic channel as defined by IQVIA –
No methodology has been applied to determine VACCINE USE BY AGE
0
100
200
300
400
500
600
700
07
/20
08
/20
09
/20
10
/20
11
/20
12
/20
01
/21
02
/21
03
/21
04
/21
05
/21
06
/21
Thousands
Weeks
Weekly Volume Unit Clinic Sales for Selected Pediatric Vaccines*
-4%
-80%
-40%
0%
40%
80%
120%
30 32 34 36 38 40 42 44 46 48 50 52 2 4 6 8 10 12 14 16 18 20 22 24 26 28
Weeks
YoY Weekly Growth %Pediatric Vaccine Market Basket vs. Actual 2020
Weekly Growth Cumulative Growth
3%
-100%
-50%
0%
50%
100%
150%
200%
30 32 34 36 38 40 42 44 46 48 50 52 2 4 6 8 10 12 14 16 18 20 22 24 26 28
Weeks
YoY Weekly Growth %Adult Vaccine Market Basket vs. Actual 2020
Weekly Growth Cumulative Growth
0
50
100
150
200
250
300
07
/20
08
/20
09
/20
10
/20
11
/20
12
/20
01
/21
02
/21
03
/21
04
/21
05
/21
06
/21
Thousands
Weeks
Weekly Volume Unit Clinic Sales for Selected Adult Vaccines*
Page 13
12
Last season flu vaccinations at Retail were up 37% on a YoY basis, the new flu vaccination season is starting slower so far
IQVIA© 2021 Confidential & Proprietary
-
1,000,000
2,000,000
3,000,000
4,000,000
5,000,000
6,000,000
7/2
/21
7/1
6/2
1
7/3
0/2
1
8/1
3/2
1
8/2
7/2
1
9/1
0/2
1
9/2
4/2
1
10
/8/2
1
10
/22
/21
11
/5/2
1
11
/19
/21
12
/3/2
1
12
/17
/21
12
/31
/21
1/1
4/2
2
1/2
8/2
2
2/1
1/2
2
2/2
5/2
2
3/1
1/2
2
3/2
5/2
2
Total Retail Flu Vaccinations - YoY Trend Comparisons
2019-20 Season 2020-21 Season 2021-22 Season
37.2
51.0
2019-20 Season 2020-21 Season
Flu Vaccines @ Retail – Prior 2 Seasons
Data Source: IQVIA Xponent®
Page 14
13
The Flu season in Australia can be an early indicator of our season in the US and current trends are showing a weak season
IQVIA© 2021 Confidential & Proprietary
71.5% of
Australians 18-65
have received a flu
vaccine, compared
to 71.8% at the
same time last
year
90.4% of
Australians 65+
have received a flu
vaccine, compared
to 90% at the
same time last
year
Data Source: https://info.flutracking.net/reports-2/australia-reports/Data Source: https://www.9news.com.au/national/influenza-vaccine-
warning-as-number-of-aussies-seeking-flu-shot-falls-by-almost-half-from-
2020/11e65b73-1283-4ef2-adaa-81bd67eb9ed5
Page 15
14
The FAN® report for all symptoms indicates more cases beginning in May in comparison to the the last two years
IQVIA© 2021 Confidential & Proprietary
0
5
10
15
20
25
30
35
40
45
8/1
5/2
0
8/2
9/2
0
9/1
2/2
0
9/2
6/2
0
10
/10
/20
10
/24
/20
11
/7/2
0
11
/21
/20
12
/5/2
0
12
/19
/20
1/2
/21
1/1
6/2
1
1/3
0/2
1
2/1
3/2
1
2/2
7/2
1
3/1
3/2
1
3/2
7/2
1
4/1
0/2
1
4/2
4/2
1
5/8
/21
5/2
2/2
1
6/5
/21
6/1
9/2
1
7/3
/21
7/1
7/2
1
7/3
1/2
1
Mill
ion
s
All Symptoms
2020-2021 2019-2020 2018-2019 3-Year Average
Data Source: IQVIA FAN® Report
Page 16
15
Across the different symptoms on the FAN® report, Cough, Earache, Nasal and Sore Throat are running ahead of seasonal norms
IQVIA© 2021 Confidential & Proprietary
05
10152025303540
8/1
5/2
0
10
/15
/20
12
/15
/20
2/1
5/2
1
4/1
5/2
1
6/1
5/2
1
Mill
ion
s
Cough
2020-2021
2019-2020
2018-2019
3-YearAverage
0
5
10
15
20
25
30
8/1
5/2
0
9/1
5/2
0
10
/15
/20
11
/15
/20
12
/15
/20
1/1
5/2
1
2/1
5/2
1
3/1
5/2
1
4/1
5/2
1
5/1
5/2
1
6/1
5/2
1
7/1
5/2
1
Mill
ion
s
Fever
0
2
4
6
8
10
8/1
5/2
0
9/1
5/2
0
10
/15
/20
11
/15
/20
12
/15
/20
1/1
5/2
1
2/1
5/2
1
3/1
5/2
1
4/1
5/2
1
5/1
5/2
1
6/1
5/2
1
7/1
5/2
1
Mill
ion
s
ILI
0
0.5
1
1.5
2
2.5
8/1
5/2
0
9/1
5/2
0
10
/15
/20
11
/15
/20
12
/15
/20
1/1
5/2
1
2/1
5/2
1
3/1
5/2
1
4/1
5/2
1
5/1
5/2
1
6/1
5/2
1
7/1
5/2
1
Mill
ion
s
Earache
0
5
10
15
20
25
30
8/1
5/2
0
9/1
5/2
0
10
/15
/20
11
/15
/20
12
/15
/20
1/1
5/2
1
2/1
5/2
1
3/1
5/2
1
4/1
5/2
1
5/1
5/2
1
6/1
5/2
1
7/1
5/2
1
Mill
ion
s
Nasal
0
5
10
15
20
25
8/1
5/2
0
9/1
5/2
0
10
/15
/20
11
/15
/20
12
/15
/20
1/1
5/2
1
2/1
5/2
1
3/1
5/2
1
4/1
5/2
1
5/1
5/2
1
6/1
5/2
1
7/1
5/2
1
Mill
ion
s
Sore Throat
2020-2021 2019-2020 2018-2019 3-Year AverageData Source: IQVIA FAN® Report
Page 17
16
0
1
2
3
4
5
6
7
8
9
8/1
5/2
0
8/2
9/2
0
9/1
2/2
0
9/2
6/2
0
10
/10
/20
10
/24
/20
11
/7/2
0
11
/21
/20
12
/5/2
0
12
/19
/20
1/2
/21
1/1
6/2
1
1/3
0/2
1
2/1
3/2
1
2/2
7/2
1
3/1
3/2
1
3/2
7/2
1
4/1
0/2
1
4/2
4/2
1
5/8
/21
5/2
2/2
1
6/5
/21
6/1
9/2
1
7/3
/21
7/1
7/2
1
7/3
1/2
1
Mill
ion
s
Influenza Like Illness (ILI)
2020-2021 2019-2020 2018-2019 3-Year Average
A focus on ILI from the FAN® report shows that instances of flu continue to remain very low as we wrap up the season
IQVIA© 2021 Confidential & Proprietary
Data Source: IQVIA FAN® Report
Page 18
17
Market Trends:
UtilizationMedical claims/activity
Page 19
18
Telemedicine contribution to weekly medical claims growth continues to diminish, reaching 7.8% of total claims
IQVIA© 2021 Confidential & Proprietary
Data for latest week date controlled against prior periods; estimates have been applied to reflect anticipated late-adjudicated claims based on historical rates
Source: IQVIA: Medical Claims Data Analysis, 2021; Week 30 2019 = 8/2/2019; Week 30 2020 = 7/31/2020; Week 29 2020 = 7/24/2020; Week 29 2021 = 7/23/2021
Estimated amounts for latest weeks applied based on likely claims still to be received due to data latency or claim processing delays; See Appendix for further details
0M
5M
10M
15M
20M
25M
30M
35M
40M
45M
50M
30 32 34 36 38 40 42 44 46 48 50 52 2 4 6 8 10 12 14 16 18 20 22 24 26 28
Week
Total Claims by Service Type: 52 weeks through W/E 07/23
INSTITUTIONAL OFFICE TELEMEDICINE
• From 5/7/2021 through 7/23/2021,
total claims volume is decreasing
nearly 2% per week
• Institutional claims have dropped the
most significantly, losing more than
3% per week over the same time
period, with telemedicine not far
behind at 3%
Potential Implications
Cla
ims V
olu
me
-2%
Page 20
19
Weekly institutional claims continue to stay below LY. Recent weekly growth in office doesn’t yet translate to cumulative growth
IQVIA© 2021 Confidential & Proprietary
-19%-20%
-18%
-18%
-18%
5%
-32%
-14%-14%
-13%-14%
-15%
-15%
-15%
-18%
-17%
-19%-19%
-19%-21%
-24%
0%
-23%
-22%
-19%-17%
-19%
-21%-19%
-32%
-11%-11%
6%3%6%1%2%
12%9%
7%7%5%8%
29%
-13%
9%9%8%
26%
-9%
9%13%
-40%
-20%
0%
20%
40%
30 32 34 36 38 40 42 44 46 48 50 52 2 4 6 8 10 12 14 16 18 20 22 24 26 28
Ye
ar
ove
r Y
ea
r %
Week
Year over Year Growth* – Office Claims Across Time Aligned Weeks
Weekly Growth % Cumulative Growth %
-24%
-6%
-11%
-10%
-11%
4%
-20%-10%
-10%-9%
-10%
-10%
-10%-21%
-4%-9%
-11%
-11%-7%
-12%-13%
-7%
-19%
-11%-10%
-8%
-10%
-9%
-10%-18%
-4%-5%
2%0%2%
7%
1%5%4%
-11%
8%
0%2%
10%
-6%-1%
-1%
-2%
-11%
-32%-30%
-29%-40%
-30%
-20%
-10%
0%
10%
20%
30 32 34 36 38 40 42 44 46 48 50 52 2 4 6 8 10 12 14 16 18 20 22 24 26 28
Ye
ar
ove
r Y
ea
r %
Week
Year over Year Growth* – Institutional Claims Across Time Aligned Weeks
Weekly Growth % Cumulative Growth %
Source: IQVIA: Medical Claims Data Analysis, 2021; Week 30 2019 = 8/2/2019; Week 30 2020 = 7/31/2020; Week 29 2020 = 7/24/2020; Week 29 2021 = 7/23/2021
Estimated amounts for latest weeks applied based on likely claims still to be received due to data latency or claim processing delays; See Appendix for further details
*Week 10-25 continue to be evaluated against a “Calibrated” 2020 both for weekly and cumulative growth calculations
Data for latest week date controlled against prior periods; estimates have been applied to reflect anticipated late-adjudicated claims based on historical rates
Page 21
20
23
%
14
%
13
%
6%
7%
10
%
7%
8%
7%
5%
5%
16
%
-17
%
-5%
-15
%
-19
%
-27
%
-47
%
-42
%
-42
%
0%
2%
4%
6%
8%
10%
12%
14%
16%
-500%
0%
500%
1,000%
1,500%
2,000%
2,500%
3,000%
3,500%
4,000%
30 32 34 36 38 40 42 44 46 48 50 52 2 4 6 8 10 12 14 16 18 20 22 24 26 28
TM
Cla
ims a
s %
of A
ll P
/I*
Cla
ims
Ye
ar
ove
r Y
ea
r %
Week
Weekly Growth % TM Claims as % of All P/I* Claims
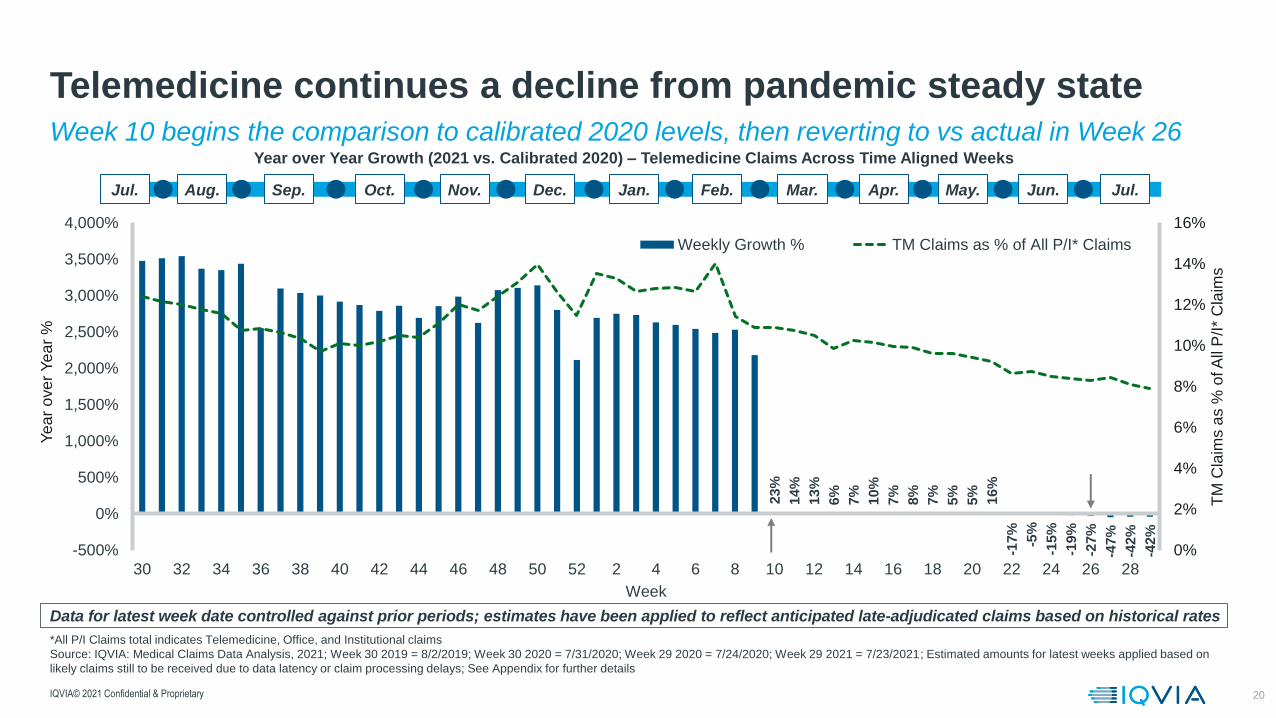
Week 10 begins the comparison to calibrated 2020 levels, then reverting to vs actual in Week 26
Telemedicine continues a decline from pandemic steady state
IQVIA© 2021 Confidential & Proprietary
Year over Year Growth (2021 vs. Calibrated 2020) – Telemedicine Claims Across Time Aligned Weeks
Data for latest week date controlled against prior periods; estimates have been applied to reflect anticipated late-adjudicated claims based on historical rates
*All P/I Claims total indicates Telemedicine, Office, and Institutional claims
Source: IQVIA: Medical Claims Data Analysis, 2021; Week 30 2019 = 8/2/2019; Week 30 2020 = 7/31/2020; Week 29 2020 = 7/24/2020; Week 29 2021 = 7/23/2021; Estimated amounts for latest weeks applied based on
likely claims still to be received due to data latency or claim processing delays; See Appendix for further details
Feb.Jul. Aug. Sep. Oct. Nov. Dec. Jan. Mar. Apr. May. Jun. Jul.
Page 22
21
Elective Procedures: Weekly YoY and cumulative growth
IQVIA© 2021 Confidential & Proprietary
Source: IQVIA: Medical Claims Data Analysis, 2021; Week 30 2019 = 8/2/2019; Week 30 2020 = 7/31/2020; Week 29 2020 = 7/24/2020; Week 29 2021 = 7/23/2021; Elective procedures based on IQVIA custom analysis;
Data includes claims from inpatient and outpatient sites of care; Latest two weeks are estimates using a recency data factor that is adjusted out as all claims are received; See Appendix for further details
Week 10-25 continue to be evaluated against a “Calibrated” 2020 both for weekly and cumulative growth calculations
-9%-10%
-9%
-8%
-7%
20%
-25%
-4%-5%
-3%-2%-2%-4%
-2%
-8%-7%
-9%-10%
-11%-12%
-14%
19%
0%
-20%
-13%-11%
-11%-12%
-9%
-20%
-6%-4%
6%
0%
4%
-3%-4%
8%8%7% 5%
2%5%
29%
-20%
2%1%
-2%
20%
-24%
-8%
-24%
-40%
-30%
-20%
-10%
0%
10%
20%
30%
40%
30 32 34 36 38 40 42 44 46 48 50 52 2 4 6 8 10 12 14 16 18 20 22 24 26 28
Ye
ar
ove
r Y
ea
r %
Week
Year over Year Growth – Elective Procedure Across Time Aligned Weeks
Weekly Growth % Cumulative Growth %
Feb.Jul. Aug. Sep. Oct. Nov. Dec. Jan. Mar. Apr. May. Jun. Jul.
Page 23
22
0M
20M
40M
60M
80M
100M
120M
140M
Jan Feb Mar Apr May Jun Jul Aug Sep Oct Nov Dec
In 2020 there were almost 1 billion diagnosis visits that did not happen
IQVIA© 2021 Confidential & Proprietary
A leading indicator of long-term impact
-967M
-18.8%
Total Gap of Diagnosis
Visits in 2020 (Unique patient-provider diagnosis events)
-2000 -1500 -1000 -500 0
GASTRO
UROLOGY
NEURO
ONCOLOGY
PCP
RHEUM
ENDO
Leading Specialties in 2020 by Dx Visits Gap/HCP
Dx Visit/HCP Ratio
% of Expected
Diagnosis Visits
in 2020
What is the “diagnosis visit gap”?
Difference between diagnosis visits1 expected during a
hypothetical non-COVID scenario and the number of
diagnosis visits we actually see
IQVIA: Medical Claims Data Analysis, 2021, IQVIA Analysis1A diagnosis visit is for one single diagnosis per patient, per HCP; a patient can have more than one diagnosis visit assigned to them, with either more than one diagnosis per doctor or more than one doctor per diagnosis
Expected diagnosis visits in
2020 if there was no COVID-19
Actual diagnosis visits in 2020
The
Diagnosis
Visit Gap
Page 24
23
0M
20M
40M
60M
80M
100M
120M
Jan Feb Mar Apr May Jun
Non-COVID vs. COVID Diagnosis Visits 2021
Lower-than-expected total diagnosis visit volumes in May have created more separation than previously forecast; vaccine deployment and other triggers will continue to influence these dynamics
Post-COVID dynamics continue to have an impact – nearly 300M diagnosis visits have not occurred in the first half of 2021
IQVIA© 2021 Confidential & Proprietary
-270.2MTotal Forecast
Diagnosis Visit
Gap in 1H 2021
% of Expected
Diagnosis Visits
in 1H 2021 -10.8%Forecast diagnosis visits in
2021 if there was no COVID-19
Forecast diagnosis visits in
2021 with COVID
(actual data through 5/28/21)
Page 25
24
US Primary Intelligence
BrandImpact HCP Network = ~3,600 unique HCPs including Oncology, Specialty and Primary Care; Specialty includes, but not limited to, Allergy, Cardiology, Dermatology, Gastroenterology, Endocrinology, Neurology,
Pulmonology, Psychiatry, Rheumatology & Urology
Total Biopharma Patient Visits by Type
Total patient visits in July for Biopharma and Primary Care were lower than last year due to a decline in remote visits
Primary Care Patient Visits by Type
0
20,000
40,000
60,000
80,000
100,000
120,000
140,000
160,000
180,000
Jul
Aug
Sep
Oct
No
v
De
c
Jan-2
1
Feb
Ma
r
Apr
Ma
y
Jun
Jul
In-Person Pt Visits Remote Pt Visits
80%
20%
88%
12%
0
10,000
20,000
30,000
40,000
50,000
60,000
Jul
Aug
Sep
Oct
No
v
De
c
Jan-2
1
Feb
Ma
r
Apr
Ma
y
Jun
Jul
In-Person Pt Visits Remote Pt Visits
88%
12%
81%
19%
IQVIA© 2021 Confidential & Proprietary
Page 26
25
0M
20M
40M
60M
80M
100M
120M
140M
Jan
Feb
Ma
r
Apr
Ma
y
Jun
Jul
Aug
Sep
Oct
Nov
Dec
Jan
Feb
Ma
r
Apr
Ma
y
Jun
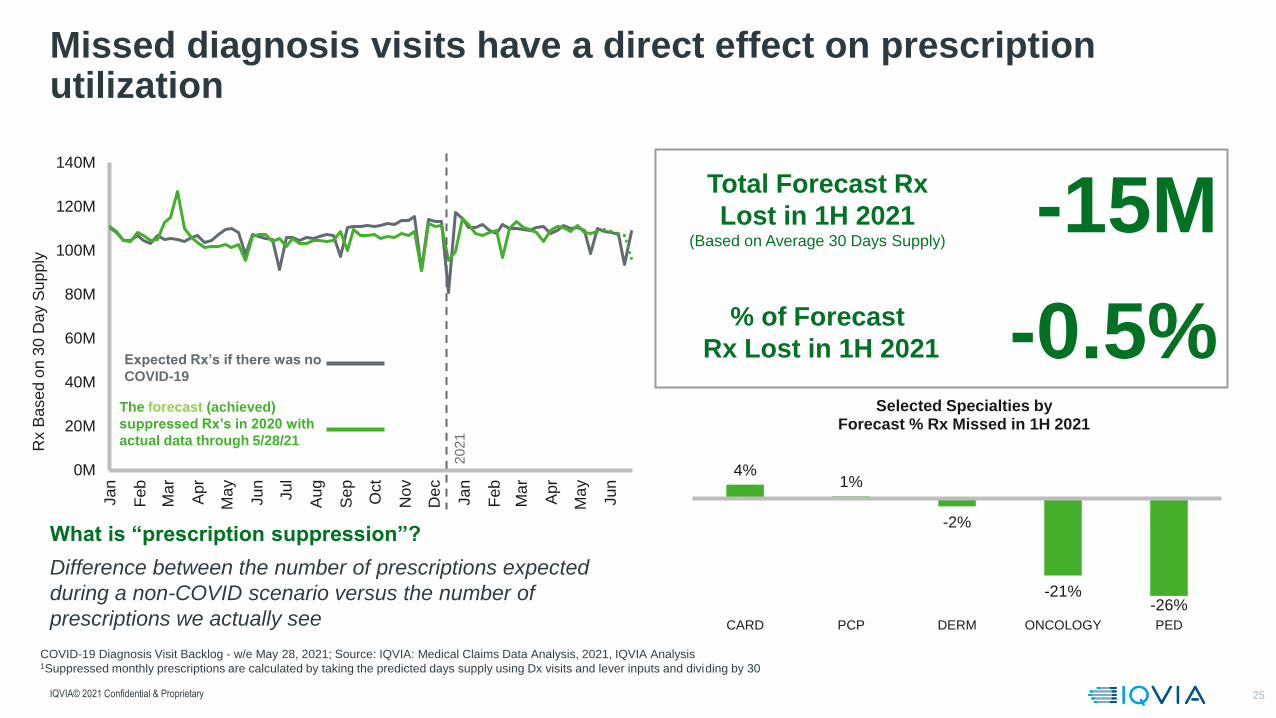
Missed diagnosis visits have a direct effect on prescription utilization
IQVIA© 2021 Confidential & Proprietary
-15M
-0.5%
Total Forecast Rx
Lost in 1H 2021 (Based on Average 30 Days Supply)
4%1%
-2%
-21%-26%
CARD PCP DERM ONCOLOGY PED
Selected Specialties by Forecast % Rx Missed in 1H 2021
% of Forecast
Rx Lost in 1H 2021
What is “prescription suppression”?
Difference between the number of prescriptions expected
during a non-COVID scenario versus the number of
prescriptions we actually see
COVID-19 Diagnosis Visit Backlog - w/e May 28, 2021; Source: IQVIA: Medical Claims Data Analysis, 2021, IQVIA Analysis1Suppressed monthly prescriptions are calculated by taking the predicted days supply using Dx visits and lever inputs and dividing by 30
Expected Rx’s if there was no
COVID-19
The forecast (achieved)
suppressed Rx’s in 2020 with
actual data through 5/28/21Rx B
ase
d o
n 3
0 D
ay S
up
ply
20
21
Page 27
26
Specialties with greater gaps in claims in 2020 are working to address the patient backlog – namely ophthalmologists and dermatologists
Hard hit specialists continue to fill the 2020 diagnosis gap
-7%
-9%
-12%
-12%
-13%
-16%
-17%
-17%
-19%
-20%
-20%
-20%
-20%
-21%
-29%
2020 % change from baseline
Source: IQVIA: National Prescription Audit; IQVIA: Medical Claims data. Note: Baseline defined as the average of the first full eight weeks of 2020. NBRx are Retail only. NBRx include all prescriptions a HCP writes, not only those specific to the therapy area.
-17%
59%
-15%
-19%
-14%
-7%
-12%
-20%
-18%
-26%
-22%
-16%
-12%
-22%
-54%PED
OPHTH
ALLER
PCP
PULM
GE
CARD
UROL
OB/GYN
NEURO
ENDO
RHEUM
ONC
PSYCH
DERM
Excluding flu vaccines
in 2020, ONC = -7%
Claims NBRx
IQVIA© 2021 Confidential & Proprietary
Fewer claims, fewer NBRx
More claims, more NBRxFewer claims, more NBRx
More claims, fewer NBRx
ALLER
PCP
OB/GYN
CARD DERM
ENDO
GE
NEURO
OPHTH
PED
PULM
PSYCH
RHEUM
UROL
ONC
ONC, no COVID vaccine NBRx
-40%
-20%
0%
20%
40%
60%
80%
100%
120%
-15% -10% -5% 0% 5% 10% 15% 20% 25%
% C
ha
nge
in
NB
Rx,
20
20
v.
20
21
% Change in claims, 2020 v. 2021
% Change in claims and NBRx, weeks 1–25, 2020 v. 2021
Page 28
27
Where Are We Now?
IQVIA – Confidential & Proprietary
Page 29
28
The Non-Retail channel is recovering from effects of COVID-19
Growth (%) of Sales
Total Market (Retail, Non-Retail and Mail) Retail and Mail
Source: IQVIA, National Sales Perspectives, Jun 2021
Note: Limited to Rx and OTC Insulins; Includes Retail, Non-Retail and Mail
Non-Retail
6.0%
10.6%
7.5%
1.8%
4.9%
6.1%
2017 2018 2019 2020 MATJun
2021
YTD Jun2021
1.9%
6.4%5.8%
4.3%
6.0%7.0%
2017 2018 2019 2020 MATJun
2021
YTDJun
2021
0.3%
4.6% 5.0% 5.4%6.5%
7.3%
2017 2018 2019 2020 MATJun
2021
YTDJun
2021
IQVIA© 2021 Confidential & Proprietary
Page 30
29
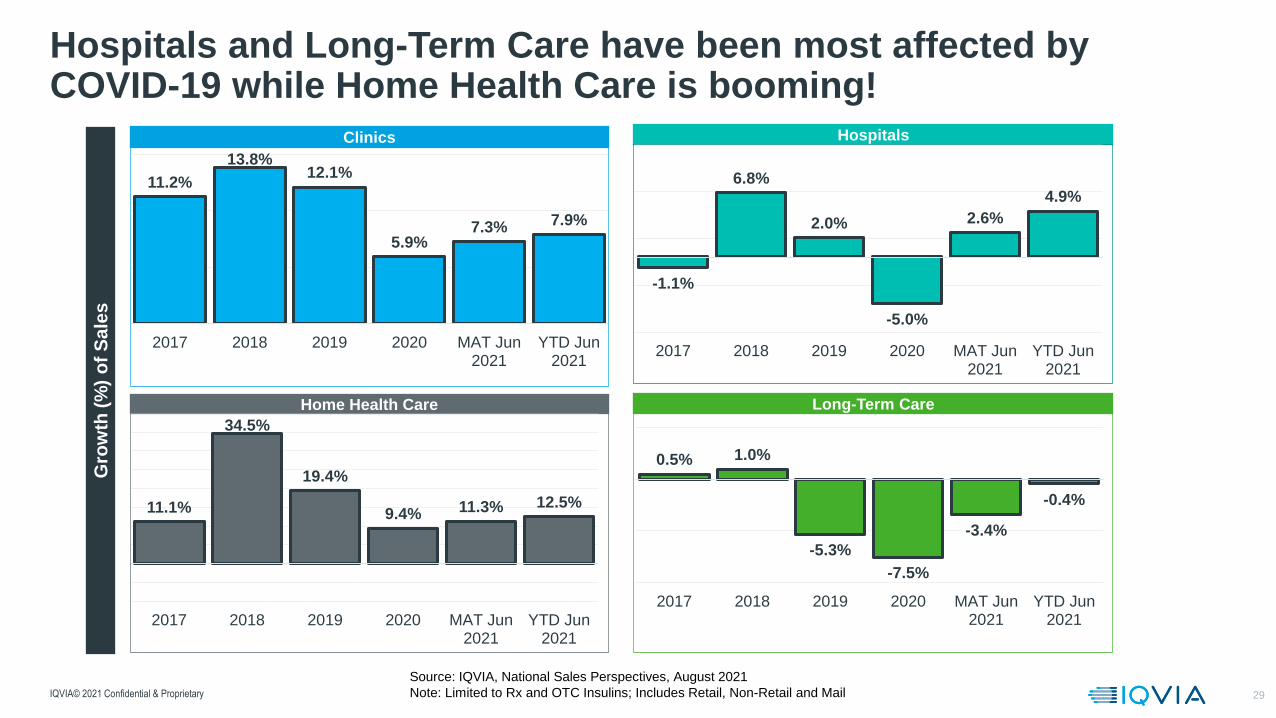
Hospitals and Long-Term Care have been most affected by COVID-19 while Home Health Care is booming!
Gro
wth
(%
) o
f S
ale
s
Clinics Hospitals
-1.1%
6.8%
2.0%
-5.0%
2.6%
4.9%
2017 2018 2019 2020 MAT Jun2021
YTD Jun2021
Source: IQVIA, National Sales Perspectives, August 2021
Note: Limited to Rx and OTC Insulins; Includes Retail, Non-Retail and Mail
11.2%
13.8%12.1%
5.9%7.3% 7.9%
2017 2018 2019 2020 MAT Jun2021
YTD Jun2021
Long-Term Care
0.5% 1.0%
-5.3%
-7.5%
-3.4%
-0.4%
2017 2018 2019 2020 MAT Jun2021
YTD Jun2021
Home Health Care
11.1%
34.5%
19.4%
9.4% 11.3% 12.5%
2017 2018 2019 2020 MAT Jun2021
YTD Jun2021
IQVIA© 2021 Confidential & Proprietary
Page 31
30
In MAT June 2021,specialty spend grew by 6.9% while traditional growth grew 5.2%
For the total market, specialty growth is outpacing traditional growth and now has ~49% share of total non-discounted spend
$196.0$218.9
$243.8$261.9
$271.7
$259.0
$264.8$269.2
$275.1 $283.6$455.0
$483.7$513.0 $537.0 $555.3
-30%
0%
30%
$
$100
$200
$300
$400
$500
Gro
wth
N
on
-Dis
co
un
ted
Sp
en
d (
BN
s)
SPECIALTY TRADITIONAL SPECIALTY GROWTH TRADITIONAL GROWTH TOTAL MARKET GROWTH
Source: IQVIA, National Sales Perspectives, June 2021
Share of Sales 2017 2018 2019 2020 MAT JUN 2021
SPECIALTY 43.1% 45.3% 47.5% 48.8% 48.9%
TRADITIONAL 56.9% 54.7% 52.5% 51.2% 51.1%
IQVIA© 2021 Confidential & Proprietary
Page 32
31
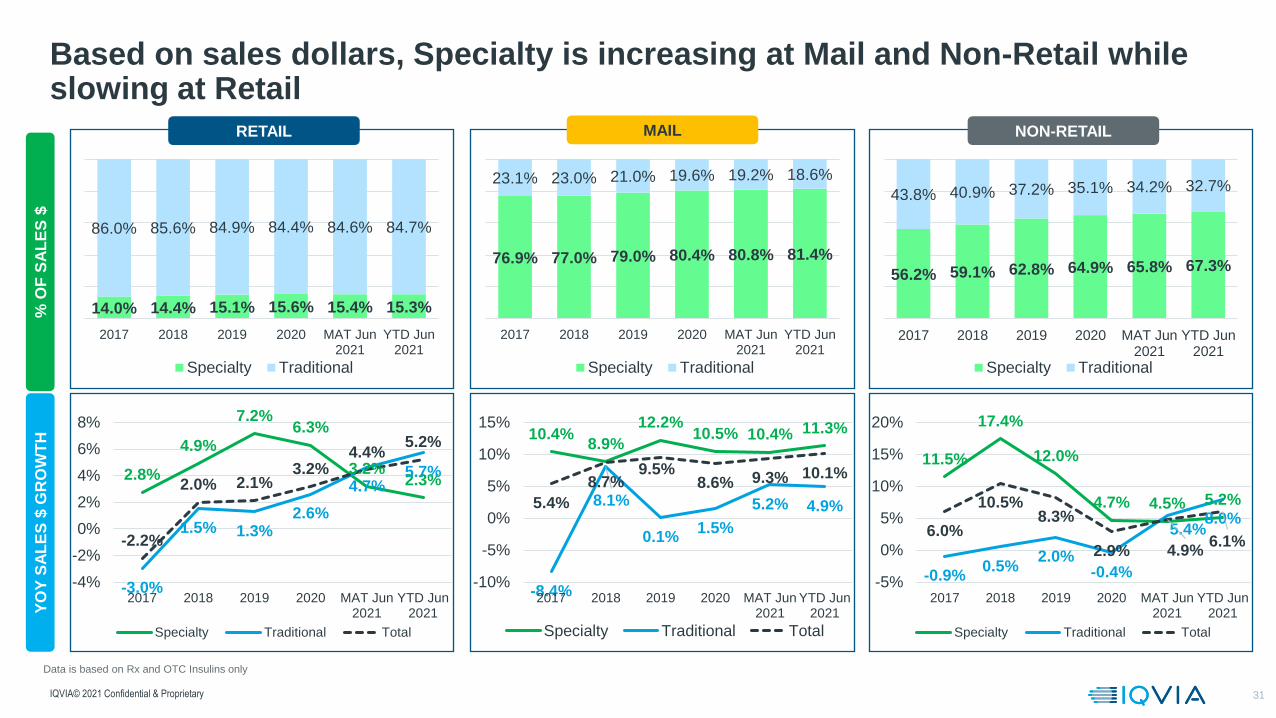
Based on sales dollars, Specialty is increasing at Mail and Non-Retail while slowing at Retail
56.2% 59.1% 62.8% 64.9% 65.8% 67.3%
43.8% 40.9% 37.2% 35.1% 34.2% 32.7%
2017 2018 2019 2020 MAT Jun2021
YTD Jun2021
Specialty Traditional
NON-RETAIL
% O
F S
AL
ES
$
14.0% 14.4% 15.1% 15.6% 15.4% 15.3%
86.0% 85.6% 84.9% 84.4% 84.6% 84.7%
2017 2018 2019 2020 MAT Jun2021
YTD Jun2021
Specialty Traditional
RETAIL
76.9% 77.0% 79.0% 80.4% 80.8% 81.4%
23.1% 23.0% 21.0% 19.6% 19.2% 18.6%
2017 2018 2019 2020 MAT Jun2021
YTD Jun2021
Specialty Traditional
MAIL
11.5%
17.4%
12.0%
4.7% 4.5% 5.2%
-0.9%0.5%
2.0%-0.4%
5.4%8.0%
6.0%
10.5%8.3%
2.9% 4.9%6.1%
-5%
0%
5%
10%
15%
20%
2017 2018 2019 2020 MAT Jun2021
YTD Jun2021
Specialty Traditional Total
2.8%
4.9%
7.2%6.3%
3.2%2.3%
-3.0%
1.5% 1.3%2.6%
4.7%5.7%
-2.2%
2.0% 2.1%3.2%
4.4%5.2%
-4%
-2%
0%
2%
4%
6%
8%
2017 2018 2019 2020 MAT Jun2021
YTD Jun2021
Specialty Traditional Total
10.4%8.9%
12.2%10.5% 10.4% 11.3%
-8.4%
8.1%
0.1%1.5%
5.2% 4.9%5.4%
8.7%9.5%
8.6% 9.3% 10.1%
-10%
-5%
0%
5%
10%
15%
2017 2018 2019 2020 MAT Jun2021
YTD Jun2021
Specialty Traditional Total
YO
Y S
AL
ES
$ G
RO
WT
H
Data is based on Rx and OTC Insulins only
IQVIA© 2021 Confidential & Proprietary
Page 33
32
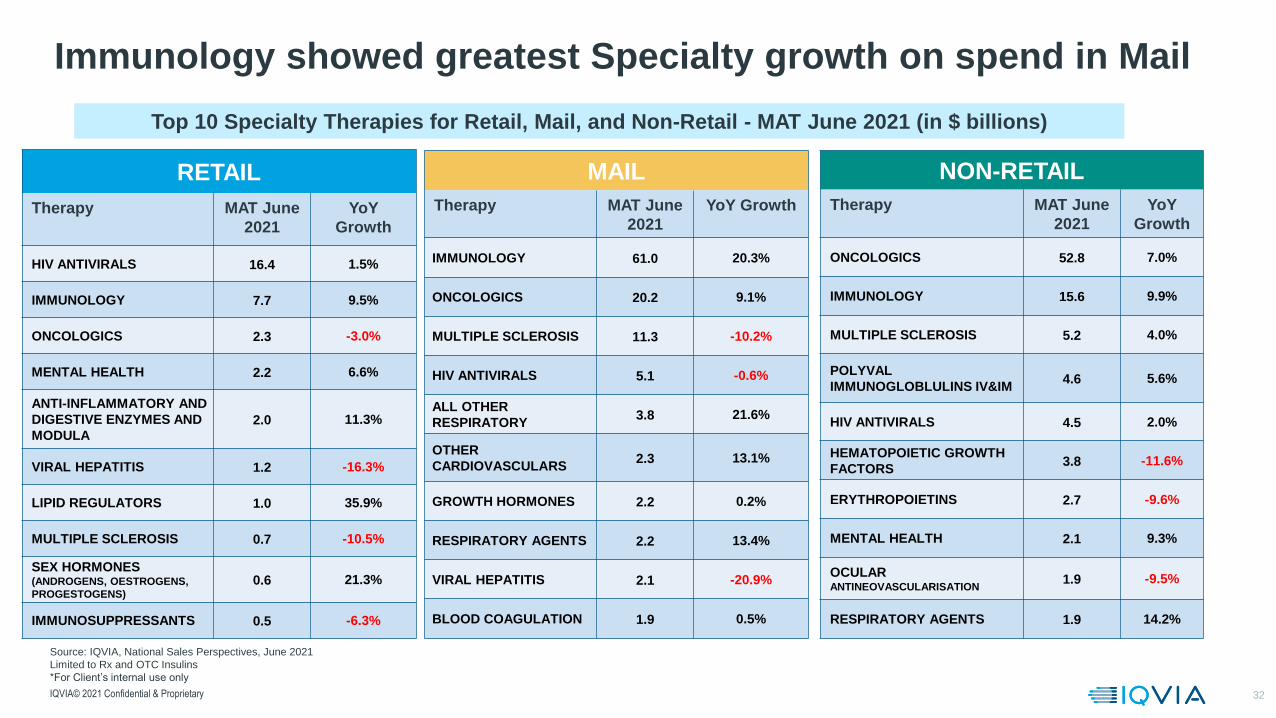
Immunology showed greatest Specialty growth on spend in Mail
RETAIL
Therapy MAT June
2021
YoY
Growth
HIV ANTIVIRALS 16.4 1.5%
IMMUNOLOGY 7.7 9.5%
ONCOLOGICS 2.3 -3.0%
MENTAL HEALTH 2.2 6.6%
ANTI-INFLAMMATORY AND
DIGESTIVE ENZYMES AND
MODULA2.0 11.3%
VIRAL HEPATITIS 1.2 -16.3%
LIPID REGULATORS 1.0 35.9%
MULTIPLE SCLEROSIS 0.7 -10.5%
SEX HORMONES (ANDROGENS, OESTROGENS,
PROGESTOGENS)
0.6 21.3%
IMMUNOSUPPRESSANTS 0.5 -6.3%
MAIL
Therapy MAT June
2021
YoY Growth
IMMUNOLOGY 61.0 20.3%
ONCOLOGICS 20.2 9.1%
MULTIPLE SCLEROSIS 11.3 -10.2%
HIV ANTIVIRALS 5.1 -0.6%
ALL OTHER
RESPIRATORY3.8 21.6%
OTHER
CARDIOVASCULARS2.3 13.1%
GROWTH HORMONES 2.2 0.2%
RESPIRATORY AGENTS 2.2 13.4%
VIRAL HEPATITIS 2.1 -20.9%
BLOOD COAGULATION 1.9 0.5%
NON-RETAIL
Therapy MAT June
2021
YoY
Growth
ONCOLOGICS 52.8 7.0%
IMMUNOLOGY 15.6 9.9%
MULTIPLE SCLEROSIS 5.2 4.0%
POLYVAL
IMMUNOGLOBLULINS IV&IM4.6 5.6%
HIV ANTIVIRALS 4.5 2.0%
HEMATOPOIETIC GROWTH
FACTORS3.8 -11.6%
ERYTHROPOIETINS 2.7 -9.6%
MENTAL HEALTH 2.1 9.3%
OCULAR ANTINEOVASCULARISATION
1.9 -9.5%
RESPIRATORY AGENTS 1.9 14.2%
Top 10 Specialty Therapies for Retail, Mail, and Non-Retail - MAT June 2021 (in $ billions)
Source: IQVIA, National Sales Perspectives, June 2021
Limited to Rx and OTC Insulins
*For Client’s internal use only
IQVIA© 2021 Confidential & Proprietary
Page 34
33
33
Slowing growth was occurring prior to COVID-19, and is not the sole contributor
All therapies demonstrate short-term growth except MS; Immunology and Anticoagulants show the greatest one- and five-year growth
Top-10 therapy area growth % ($)
-10%
-5%
0%
5%
10%
15%
20%
25%
-4% -2% 0% 2% 4% 6% 8% 10% 12% 14% 16% 18% 20% 22%
RESPIRATORY AGENTS
IMMUNOLOGY
ONCOLOGICS
MENTAL HEALTH
Historic growth (% 5-year CAGR, 2016-2021)
Sh
ort
-te
rm g
row
th (
% Y
oY
,20
20
-20
21
)
ANTIDIABETICS
ANTICOAGULANTS
HIV ANTIVIRALS
MULTIPLE SCLEROSIS
PAIN VACCINES (PURE, COMB, OTHER)
Specialty Traditional Jun 2021 MAT sales, Bn
IQVIA National Sales Perspectives, June 2021, Rx’s and OTC Insulins Only
IQVIA© 2021 Confidential & Proprietary
Page 35
IQVIA Template (V2.1.0)
34
Antidiabetics is the top therapy class and Eliquis is a top product in the Retail Market based on sales dollars
Therapies
Rank Therapy
MAT
June
2021
YoY Growth
1 ANTIDIABETICS 64.0 13.9%
2 RESPIRATORY AGENTS 21.6 -0.1%
3 ANTICOAGULANTS 18.1 16.2%
4 HIV ANTIVIRALS 16.4 1.5%
5 MENTAL HEALTH 13.3 6.4%
6 PAIN 10.2 8.1%
7 ADHD 8.1 0.1%
8 IMMUNOLOGY 7.7 9.6%
9 GI PRODUCTS 6.8 5.1%
10 NERVOUS SYSTEM DISORDERS 6.5 -6.1%
Products
Rank Product
MAT
June
2021
YoY Growth
1 ELIQUIS 10.9 25.5%
2 TRULICITY 8.5 37.2%
3 OZEMPIC 5.6 70.9%
4 JARDIANCE 5.6 40.7%
5 XARELTO 5.4 9.1%
6 BIKTARVY 5.2 27.6%
7 JANUVIA 5.0 3.8%
8 LANTUS SOLOSTAR 4.0 17.2%
9 VYVANSE 3.7 2.8%
10 LATUDA 3.3 11.4%
Top 10 Therapies and Products for Retail based on Sales - MAT June 2021 (MAT in Billions)
Source: IQVIA, National Sales Perspectives, June 2021
Limited to Rx and OTC Insulins
IQVIA© 2021 Confidential & Proprietary
Page 36
IQVIA Template (V2.1.0)
35
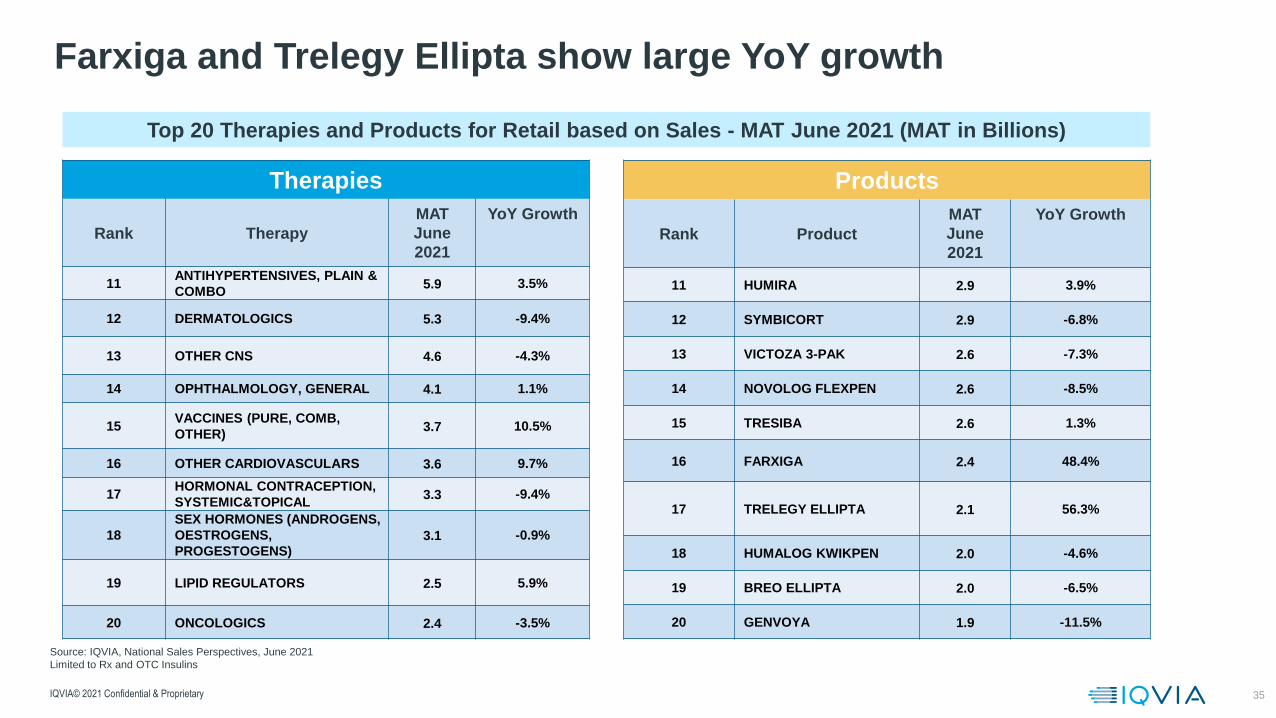
Farxiga and Trelegy Ellipta show large YoY growth
Therapies
Rank Therapy
MAT
June
2021
YoY Growth
11ANTIHYPERTENSIVES, PLAIN &
COMBO5.9 3.5%
12 DERMATOLOGICS 5.3 -9.4%
13 OTHER CNS 4.6 -4.3%
14 OPHTHALMOLOGY, GENERAL 4.1 1.1%
15VACCINES (PURE, COMB,
OTHER)3.7 10.5%
16 OTHER CARDIOVASCULARS 3.6 9.7%
17HORMONAL CONTRACEPTION,
SYSTEMIC&TOPICAL3.3 -9.4%
18
SEX HORMONES (ANDROGENS,
OESTROGENS,
PROGESTOGENS)3.1 -0.9%
19 LIPID REGULATORS 2.5 5.9%
20 ONCOLOGICS 2.4 -3.5%
Products
Rank Product
MAT
June
2021
YoY Growth
11 HUMIRA 2.9 3.9%
12 SYMBICORT 2.9 -6.8%
13 VICTOZA 3-PAK 2.6 -7.3%
14 NOVOLOG FLEXPEN 2.6 -8.5%
15 TRESIBA 2.6 1.3%
16 FARXIGA 2.4 48.4%
17 TRELEGY ELLIPTA 2.1 56.3%
18 HUMALOG KWIKPEN 2.0 -4.6%
19 BREO ELLIPTA 2.0 -6.5%
20 GENVOYA 1.9 -11.5%
Top 20 Therapies and Products for Retail based on Sales - MAT June 2021 (MAT in Billions)
Source: IQVIA, National Sales Perspectives, June 2021
Limited to Rx and OTC Insulins
IQVIA© 2021 Confidential & Proprietary
Page 37
Brand Inflation has slowed in recent years, currently it is running between 4 and 5% according to Nephron Research
Source: Nephron Research, IQVIA, Glass Box Analytics
0.0%
2.0%
4.0%
6.0%
8.0%
10.0%
12.0%
14.0%
Dec
-13
Feb
-14
Ap
r-1
4
Jun
-14
Au
g-1
4
Oct
-14
Dec
-14
Feb
-15
Ap
r-1
5
Jun
-15
Au
g-1
5
Oct
-15
Dec
-15
Feb
-16
Ap
r-1
6
Jun
-16
Au
g-1
6
Oct
-16
Dec
-16
Feb
-17
Ap
r-1
7
Jun
-17
Au
g-1
7
Oct
-17
Dec
-17
Feb
-18
Ap
r-1
8
Jun
-18
Au
g-1
8
Oct
-18
Dec
-18
Feb
-19
Ap
r-1
9
Jun
-19
Au
g-1
9
Oct
-19
Dec
-19
Feb
-20
Ap
r-2
0
Jun
-20
Au
g-2
0
Oct
-20
Dec
-20
Feb
-21
Sale
s-W
eigh
ted
In
flat
ion
Hillary Clinton tweets onegregious
drug pricingValeant is
subpoeaned over pricing
actionsAllergan issues its Social Contract and pledges to
take single digit gross increases
Trump tweets that drug makers are "getting away with murder"
Leaked presidential draft proves to be pharma friendly
Manufacturers limited themselves to a single
price increase
January price increases
HHS introduces rebate/discount
rule for 1/1/20
HHS withdraws
Rebate Rule
2H18 price increases rescinded
Pelosi unveils drug plan
+4% to +5% is the new
normal
Trump EO Released
Page 38
37
311.0
359.0
61.9
8.4 51.6
3.9-78.1
200.0
250.0
300.0
350.0
400.0
450.0
2015 New brands Protected brandsprice
Protected brandsvolume
LOE Generics 2020
Manufacturer net revenue Growth Declines
Net Manufacturer Revenues and Growth 2015–2020, All Channels, US$Bn
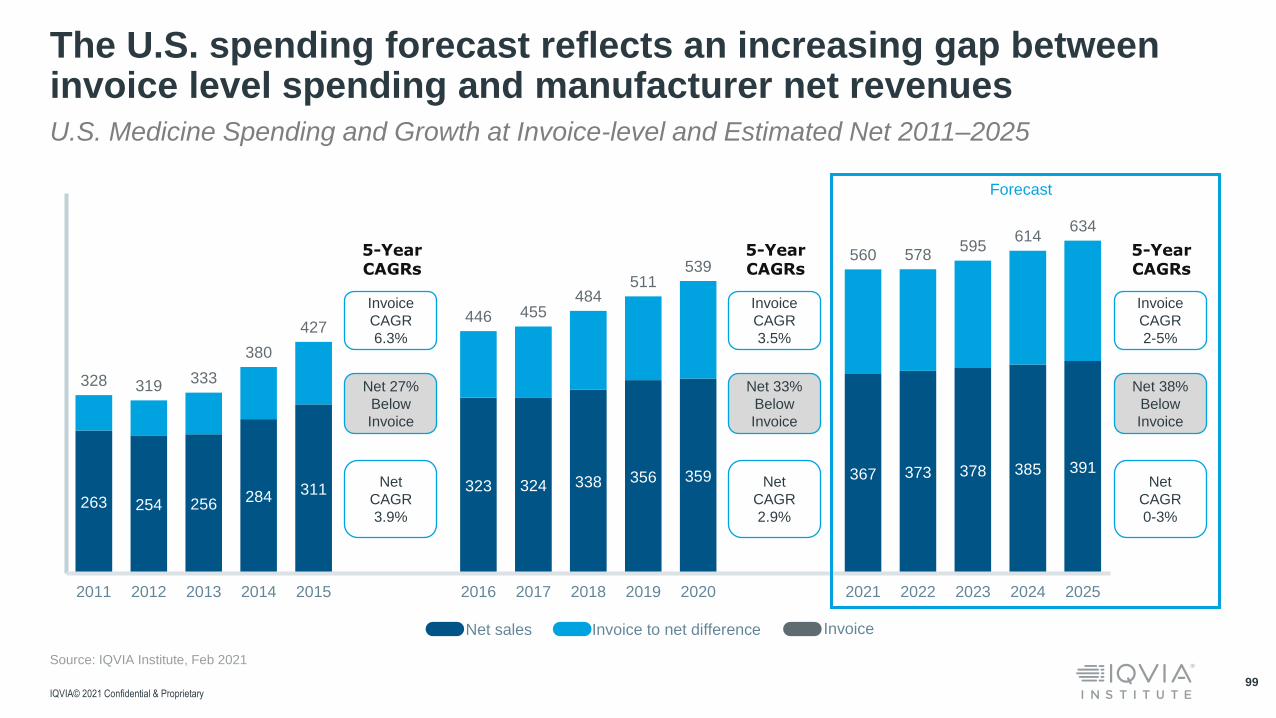
Manufacturer net revenues increased by $48 billion over the pastfive years primarily driven by new products and protected brand volume
Source: IQVIA Institute, May 2021
-13.7-18.6
-25
-20
-15
-10
-5
0
5
10
15
20
2016 2017 2018 2019 2020
13.2
13.9
-25
-20
-15
-10
-5
0
5
10
15
20
7.0
-9.5-25
-20
-15
-10
-5
0
5
10
15
20
2016 2017 2018 2019 2020
4.5
18.7
-25
-20
-15
-10
-5
0
5
10
15
20
2016 2017 2018 2019 2020
1.3-0.8
-25
-20
-15
-10
-5
0
5
10
15
20
2016 2017 2018 2019 2020
2016 2020
IQVIA© 2021 Confidential & Proprietary
Page 39
38
Wholesaler Acquisition Cost (WAC) Growth and Net Price Growth for Protected Brands
Protected brand list prices increased 4.4% in 2020, while netprices decreased -2.9% - the fourth year at or below the CPI
IQVIA© 2021 Confidential & Proprietary
Source: IQVIA Institute, National Sales Perspectives, Dec 2020; Bureau of Labor Statistics, CPI Data, Dec 2015–Dec 2020
7.9%
9.3%
7.0%6.6%
5.2%4.4%
1.6%
2.9%
2.1% 0.3%1.7%
-2.9%
0.7%2.1%
2.1% 1.9%2.3%
1.3%
-4%
-2%
0%
2%
4%
6%
8%
10%
2015 2016 2017 2018 2019 2020
Brands WAC price growth % Estimated net price growth % CPI
Page 40
39
Unadjusted Rx growth for MAT May is negative and YTD May is positive, but adjusted growth is higher, at 2.5% for MAT May and 3.6% year to date
Growth (%) of Dispensed Rx
Unadjusted Rx Adjusted Rx
-5.6%
-0.6% -0.4%
-2.4%
0.3%
2.7%
-10.0%
-8.0%
-6.0%
-4.0%
-2.0%
0.0%
2.0%
4.0%
2017* 2018 2019 2020 MATJun
2021
YTDJun
2021
-3.8%
2.7% 2.4% 1.9%2.7%
4.2%
-7.0%
-5.0%
-3.0%
-1.0%
1.0%
3.0%
5.0%
7.0%
2017* 2018 2019 2020 MATJun
2021
YTDJun
2021
Source: IQVIA, National Prescription Audit & RxInsight, May 2021; Retail, Mail, and LTC limited to Rx and OTC Insulins
*Note: Declines between 2016 and 2017 are due to VRAF enhancement from 2017 onwards
Gro
wth
(%
)
Gro
wth
(%
)
IQVIA© 2021 Confidential & Proprietary
Page 41
40
Unadjusted growth trends have been positive for the last several weeks, mainly being driven by COVID vaccinations at Retail
Data Source: IQVIA Xponent - Copyright 2021
-1.2
%
-3.7
%
8.4
%
-9.2
%
1.2
%
0.1
%
-0.9
%
-1.6
%
-1.7
%
-1.9
%
-2.7
%
-5.1
%
-3.0
%
-4.4
%
-4.5
%
-6.3
%
-4.9
%
-7.6
%
-1.5
%
-6.3
%
-4.1
%
-3.0
%
-2.8
%
-4.0
%
-5.4
%
-3.8
%
-12
.4%
-1.0
%
-2.7
0%
-5.3
%
-11
.6%
4.2
%
11
.4%
15
.0%
17
.9%
19
.1%
18
.4%
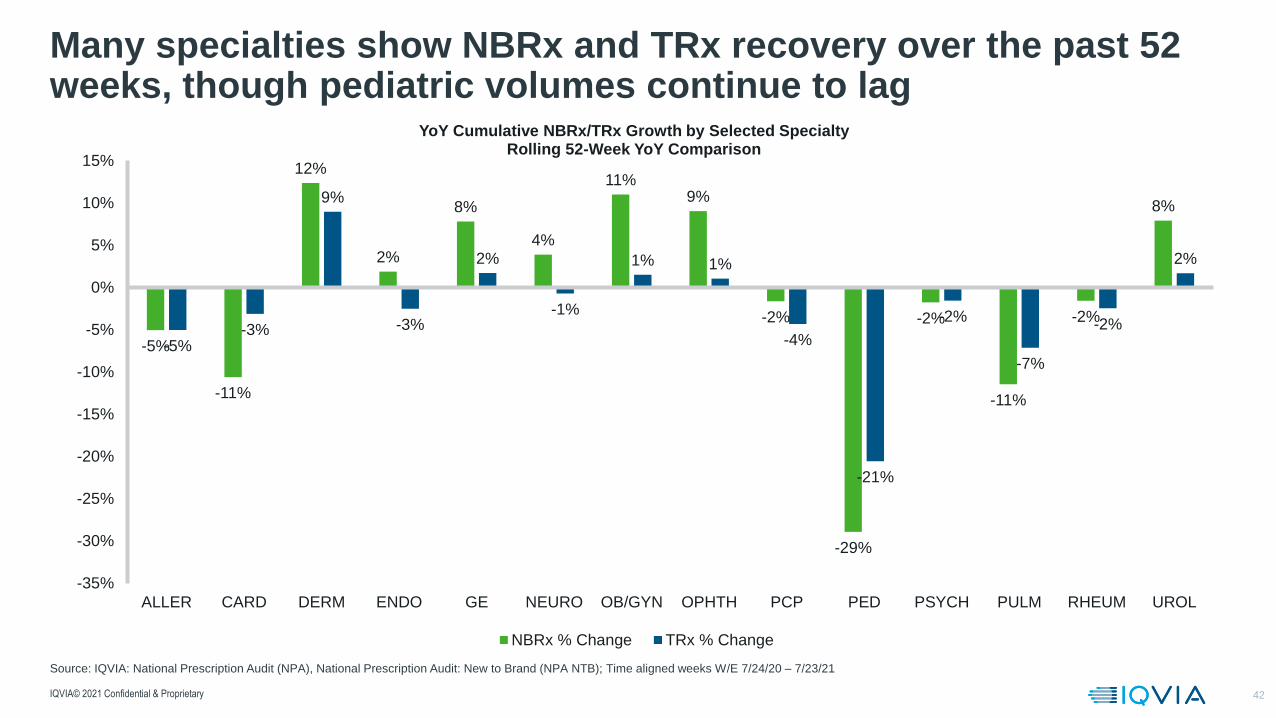
17
.1%
14
.5%
13
.9%
22
.1%
2.3
%
10
.6%
9.4
%
8.3
%
7.5
%
3.0
%
7.0
%
8.7
%
7.6
%
8.9
%
7.9
%
-50%
0%
50%
8/2
1/2
0
8/2
8/2
0
9/0
4/2
0
9/1
1/2
0
9/1
8/2
0
9/2
5/2
0
10
/02
/20
10
/09
/20
10
/16
/20
10
/23
/20
10
/30
/20
11
/06
/20
11
/13
/20
11
/20
/20
11
/27
/20
12
/04
/20
12
/11
/20
12
/18
/20
12
/25
/20
1/0
1/2
1
1/0
8/2
1
1/1
5/2
1
1/2
2/2
1
1/2
9/2
1
2/0
5/2
1
2/1
2/2
1
2/1
9/2
1
2/2
6/2
1
3/0
5/2
1
3/1
2/2
1
3/1
9/2
1
3/2
6/2
1
4/0
2/2
1
4/9
/21
4/1
6/2
1
4/2
3/2
1
4/3
0/2
1
5/7
/21
5/1
4/2
1
5/2
1/2
1
5/2
8/2
1
6/4
/21
6/1
1/2
1
6/1
8/2
1
6/2
5/2
1
7/2
/21
7/9
/21
7/1
6/2
1
7/2
3/2
1
7/3
0/2
1
8/6
/21
8/1
3/2
1
To
tal U
na
dj.
IQVIA – Confidential & Proprietary
-1.2
%
-3.7
%
8.4
%
-9.2
%
1.2
%
0.1
%
-0.9
%
-1.6
%
-1.7
%
-1.9
%
-2.7
%
-5.1
%
-3.0
%
-4.4
%
-4.5
%
-6.3
%
-4.9
%
-7.6
%
-1.6
%
-6.9
%
-5.1
%
-4.3
%
-4.6
%
-6.3
%
-7.9
%
-6.6
%
-15
.2%
-4.1
%
-7.2
%
-10
.4%
-16
.8%
-2.4
%
2.5
%
4.9
%
9.8
%
9.8
%
9.0
%
8.8
%
7.4
%
5.4
%
15
.1%
-2.7
%
4.8
%
3.5
%
4.2
%
4.0
%
-0.1
%
3.8
%
4.9
%
3.1
%
4.0
%
2.9
%
-50%
0%
50%
8/2
1/2
0
8/2
8/2
0
9/0
4/2
0
9/1
1/2
0
9/1
8/2
0
9/2
5/2
0
10
/02
/20
10
/09
/20
10
/16
/20
10
/23
/20
10
/30
/20
11
/06
/20
11
/13
/20
11
/20
/20
11
/27
/20
12
/04
/20
12
/11
/20
12
/18
/20
12
/25
/20
1/0
1/2
1
1/0
8/2
1
1/1
5/2
1
1/2
2/2
1
1/2
9/2
1
2/0
5/2
1
2/1
2/2
1
2/1
9/2
1
2/2
6/2
1
3/0
5/2
1
3/1
2/2
1
3/1
9/2
1
3/2
6/2
1
4/0
2/2
1
4/9
/21
4/1
6/2
1
4/2
3/2
1
4/3
0/2
1
5/7
/21
5/1
4/2
1
5/2
1/2
1
5/2
8/2
1
6/4
/21
6/1
1/2
1
6/1
8/2
1
6/2
5/2
1
7/2
/21
7/9
/21
7/1
6/2
1
7/2
3/2
1
7/3
0/2
1
8/6
/21
8/1
3/2
1
Unadju
ste
d Y
oY
Gro
wth
Un
ad
juste
d Y
oY
Gro
wth
less C
OV
ID V
accin
es
Page 42
41
Adjusted growth trends have run positive for the last several weeks driven by COVID vaccines and last spring’s weak comparison periods
Data Source: IQVIA Xponent - Copyright 2021
2.6
%
0.1
%
12
.9%
-5.3
%
6.0
%
4.2
%
2.6
%
1.9
%
1.8
%
1.9
%
0.9
%
-0.8
%
1.4
%
0.3
%
0.6
%
-1.9
%
-0.1
%
-2.3
%
6.0
%
-0.3
%
1.1
%
2.3
%
1.8
%
1.1
%
-0.3
%
1.0
%
-8.5
%
3.9
%
0.7
%
-2.8
%
-11
.2%
3.0
% 9.4
%
12
.3%
15
.8%
17
.3%
16
.2%
15
.6%
13
.5%
12
.1%
20
.7%
1.4
% 9.0
%
8.7
%
7.3
%
7.7
%
3.4
%
7.8
%
9.3
%
7.9
%
9.2
%
7.7
%
-20%
0%
20%
40%
08
/21
/20
08
/28
/20
09
/4/2
0
09
/11
/20
09
/18
/20
09
/25
/20
10
/02
/20
10
/09
/20
10
/16
/20
10
/23
/20
10
/30
/20
11
/6/2
0
11
/13
/20
11
/20
/20
11
/27
/20
12
/4/2
0
12
/11
/20
12
/18
/20
12
/25
/20
01
/01
/21
01
/08
/21
01
/15
/21
01
/22
/21
01
/29
/21
02
/05
/21
02
/12
/21
02
/19
/21
02
/26
/21
03
/5/2
1
03
/12
/21
03
/19
/21
3/2
6/2
1
4/2
/21
4/9
/21
4/1
6/2
1
4/2
3/2
1
4/3
0/2
1
5/7
/21
5/1
4/2
1
5/2
1/2
1
5/2
8/2
1
6/4
/21
6/1
1/2
1
6/1
8/2
1
6/2
5/2
1
7/2
/21
7/9
/21
7/1
6/2
1
7/2
3/2
1
7/3
0/2
1
8/6
/21
8/1
3/2
1
To
tal A
dj.
IQVIA – Confidential & Proprietary
2.3
%
2.8
%
7.5
%
-3.8
%
15
.7%
3.4
%
4.8
%
5.1
%
1.4
%
0.5
%
0.4
%
1.0
%
0.9
%
-0.2
%
-14
.7%
2.3
%
22
.3%
-2.9
%
-14
.4%
-12
.1%
27
.0%
11
.4%
-5.9
%
-3.7
%
1.5
%
0.6
%
-13
.3%
0.5
%
4.4
%
1.9
%
-4.9
%
-7.3
%
-15
.1% -1
.4%
6.5
%
8.0
%
10
.3%
11
.6%
9.1
%
7.3
%
10
.0%
1.5
% 8.4
%
5.5
%
4.7
%
3.6
%
-1.1
%
6.6
%
8.5
%
2.5
%
7.0
%
6.0
%
-20%
0%
20%
40%
8/2
1/2
0
8/2
8/2
0
9/4
/20
9/1
1/2
0
9/1
8/2
0
9/2
5/2
0
10
/02
/20
10
/09
/20
10
/16
/20
10
/23
/20
10
/30
/20
11
/6/2
0
11
/13
/20
11
/20
/20
11
/27
/20
12
/4/2
0
12
/11
/20
12
/18
/20
12
/25
/20
1/0
1/2
1
1/0
8/2
1
1/1
5/2
1
1/2
2/2
1
1/2
9/2
1
2/0
5/2
1
2/1
2/2
1
2/1
9/2
1
2/2
6/2
1
3/5
/21
3/1
2/2
1
3/1
9/2
1
3/2
6/2
1
4/2
/21
4/9
/21
4/1
6/2
1
4/2
3/2
1
4/3
0/2
1
5/7
/21
5/1
4/2
1
5/2
1/2
1
5/2
8/2
1
6/4
/21
6/1
1/2
1
6/1
8/2
1
6/2
5/2
1
7/2
/21
7/9
/21
7/1
6/2
1
7/2
3/2
1
7/3
0/2
1
8/6
/21
8/1
3/2
1
Adju
ste
d Y
oY
Gro
wth
Ad
juste
d Y
oY
Gro
wth
le
ss
CO
VID
Va
ccin
es
Page 43
42
Many specialties show NBRx and TRx recovery over the past 52 weeks, though pediatric volumes continue to lag
IQVIA© 2021 Confidential & Proprietary
Source: IQVIA: National Prescription Audit (NPA), National Prescription Audit: New to Brand (NPA NTB); Time aligned weeks W/E 7/24/20 – 7/23/21
-5%
-11%
12%
2%
8%
4%
11%9%
-2%
-29%
-2%
-11%
-2%
8%
-5%-3%
9%
-3%
2%
-1%
1% 1%
-4%
-21%
-2%
-7%
-2%
2%
-35%
-30%
-25%
-20%
-15%
-10%
-5%
0%
5%
10%
15%
ALLER CARD DERM ENDO GE NEURO OB/GYN OPHTH PCP PED PSYCH PULM RHEUM UROL
YoY Cumulative NBRx/TRx Growth by Selected SpecialtyRolling 52-Week YoY Comparison
NBRx % Change TRx % Change
Page 44
44
Acute and New Rx growth is slowing down over the last three months; driven by COVID vaccines (% change vs. 1 Year ago)
-40%
-20%
0%
20%
40%
60%
80%Jan
Feb
Ma
r
Apr
Ma
y
Jun
Jul
Aug
Sep
Oct
Nov
Dec
2019 2020 2021
Acute
-U
nadju
ste
d
-10%
0%
10%
20%
Jan
Feb
Ma
r
Apr
Ma
y
Jun
Jul
Aug
Sep
Oct
Nov
Dec
2019 2020 2021
Main
t. -
Unadju
ste
d
IQVIA© 2021 Confidential & Proprietary
New
-U
nadju
ste
dR
efill
-Unadju
ste
dAll Rx’s shown in Millions
-20%
-10%
0%
10%
20%
30%
40%
Jan
Feb
Ma
r
Apr
Ma
y
Jun
Jul
Aug
Sep
Oct
Nov
Dec
2019 2020 2021
-10%
-5%
0%
5%
10%
Jan
Feb
Ma
r
Apr
Ma
y
Jun
Jul
Aug
Sep
Oct
Nov
Dec
2019 2020 2021
To
tal R
eta
il &
Mail –
Acu
te&
Main
t., N
ew
/Refi
ll –
Un
ad
juste
d R
x’s
Page 45
45
45
Pain shows negative growth for one and five-year growth
Nervous system disorders 5-year growth is high, but short-term growth is minimal
IQVIA Xponent® June 2021, Retail, Mail and LTC
-8%
-6%
-4%
-2%
0%
2%
4%
6%
8%
10%
-20% -10% 0% 10% 20% 30% 40% 50% 60% 70% 80% 90% 100% 110%
ANTIHYPERTENSIVES
NERVOUS SYSTEM DISORDERS
MENTAL HEALTH
RESPIRATORY AGENTS
Historic growth (5 year CAGR, 2016-2021)
Short
-te
rm g
row
th (
20
20
-20
21)
LIPID REGULATORS
PAIN
ANTIDIABETICS
THYROID ANTI-THYROID AND IODINE PREPS
ANTI-ULCERANTS
OTHER CNS
Jun 2021 MAT Adj Scripts
IQVIA© 2021 Confidential & Proprietary
Page 46
46
Based on adjusted Rx’s basis in Retail, Antihypertensives are the leading therapy with Atorvastatin as the top product
Therapies
Rank Therapy
MAT
July
2021
YoY Growth
1 ANTIHYPERTENSIVES, PLAIN & COMBO 1,046.5 2.6%
2 MENTAL HEALTH 492.3 6.5%
3 LIPID REGULATORS 425.1 5.6%
4 PAIN 377.6 0.2%
5 ANTIDIABETICS 352.6 3.5%
6 ANTI-ULCERANTS 214.2 4.5%
7 NERVOUS SYSTEM DISORDERS 210.9 3.4%
8THYROID ANTI-THYROID AND IODINE
PREPS189.6 1.3%
9 RESPIRATORY AGENTS 182.8 -5.2%
10 VACCINES (PURE, COMB, OTHER) 180.5 232.0%
Products
Rank Product
MAT
July
2021
YoY
Growth
1 ATORVASTATIN CA 208.3 7.6%
2 LISINOPRIL 154.1 0.6%
3 AMLODIPINE BESY 150.9 5.6%
4 LEVOTHYROXINE SOD 141.2 -2.4%
5 LOSARTAN POT 105.0 5.5%
6 METFORMIN HCL 97.1 3.5%
7 METOPROLOL SUCCIN 84.9 7.2%
8 OMEPRAZOLE (RX) 83.8 16.0%
9 HYDROCHLOROTHIAZIDE 81.2 -0.3%
10 GABAPENTIN 78.5 3.8%
Top 10 Therapies and Products for Retail - MAT July 2021 (Adjusted Rx’s in Millions)
Source: IQVIA, National Sales Perspectives, June 2021
Limited to Rx and OTC Insulins
*For Client’s internal use only
Page 47
47
When looking at Retail on an unadjusted Rx basis there are no changes for the top therapy and top product
Therapies
Rank Therapy
MAT
July
2021
YoY
Growth
1 ANTIHYPERTENSIVES, PLAIN & COMBO 527.8 -2.9%
2 PAIN 350.8 -0.3%
3 MENTAL HEALTH 332.2 2.6%
4 ANTIDIABETICS 208.8 -0.5%
5 LIPID REGULATORS 202.7 0.2%
6 VACCINES (PURE, COMB, OTHER) 178.9 242.5%
7 ANTIBACTERIALS 175.8 -16.9%
8 NERVOUS SYSTEM DISORDERS 159.2 0.9%
9 OTHER CNS 155.6 1.1%
10 RESPIRATORY AGENTS 146.2 -8.6%
Products
Rank Product
MAT
July
2021
YoY
Growth
1 ATORVASTATIN CA 99.6 1.6%
2 LISINOPRIL 75.9 -4.9%
3 AMLODIPINE BESY 74.4 -0.3%
4 LEVOTHYROXINE SOD 69.7 -8.0%
5 PFIZER COVID19 VACC 62.6
6 GABAPENTIN 59.0 2.6%
7 HYCD/APAP 52.9 -1.1%
8 LOSARTAN POT 50.8 -0.1%
9 METFORMIN HCL 49.7 -1.8%
10 OMEPRAZOLE (RX) 47.6 9.9%
Top 10 Therapies and Products for Retail - MAT July 2021 (Unadjusted Rx’s in Millions)
Source: IQVIA, National Sales Perspectives, June 2021
Limited to Rx and OTC Insulins
*For Client’s internal use only
Page 48
48
Retail Class of Trade
and Method of Payment
Performance
Page 49
49
Adjusted volumes in all COTs in June 2021 show an uptick from May 2021 volumes
190
200
210
220
230
240
250
260Jan
Feb
Ma
r
Apr
Ma
y
Jun
Jul
Aug
Sep
Oct
Nov
Dec
Mill
ion
s
2019 2020 2021
50
70
90
Jan
Feb
Ma
r
Apr
Ma
y
Jun
Jul
Aug
Sep
Oct
Nov
Dec
Mill
ion
s
2019 2020 2021
IQVIA Copyright 2021 - Confidential - For Client Use Only
CHAIN
MASS
70
75
80
85
90
95
Jan
Feb
Ma
r
Apr
Ma
y
Jun
Jul
Aug
Sep
Oct
Nov
Dec
Mill
ion
s
2019 2020 2021
INDEP
55
60
65
70
75
80
85
Jan
Feb
Ma
r
Apr
Ma
y
Jun
Jul
Aug
Sep
Oct
Nov
Dec
Mill
ion
s
2019 2020 2021
FOOD
380
400
420
440
460
480
500
Jan
Feb
Ma
r
Apr
Ma
y
Jun
Jul
Aug
Sep
Oct
Nov
Dec
Mill
ion
s
2019 2020 2021
RETAIL
35
40
45
50
55
Jan
Feb
Ma
r
Apr
Ma
y
Jun
Jul
Aug
Sep
Oct
Nov
Dec
Mill
ion
s
2019 2020 2021
MAIL
AD
JU
ST
ED
Rx’s
Page 50
50
COVID Vaccines are the driver of growth, though it is slowing
-15%
-10%
-5%
0%
5%
10%
15%
20%
Jan
-20
Ma
r-20
Ma
y-2
0
Jul-
20
Sep-2
0
Nov-2
0
Jan
-21
Ma
r-21
Ma
y-2
1
-15%
-10%
-5%
0%
5%
10%
15%
20%
Jan
-20
Ma
r-20
Ma
y-2
0
Jul-
20
Sep-2
0
Nov-2
0
Jan
-21
Ma
r-21
Ma
y-2
1
IQVIA Copyright 2021 - Confidential - For Client Use Only
CHAIN
MASS
-15%
-10%
-5%
0%
5%
10%
15%
Jan
-20
Ma
r-20
Ma
y-2
0
Jul-
20
Sep-2
0
Nov-2
0
Jan
-21
Ma
r-21
Ma
y-2
1
INDEP
-5%
0%
5%
10%
15%
20%
25%
Jan
-20
Ma
r-20
Ma
y-2
0
Jul-
20
Sep-2
0
No
v-2
0
Jan
-21
Ma
r-21
Ma
y-2
1
FOOD
-15%
-10%
-5%
0%
5%
10%
15%
20%
Jan
-20
Ma
r-20
Ma
y-2
0
Jul-
20
Sep-2
0
Nov-2
0
Jan
-21
Ma
r-21
Ma
y-2
1
RETAIL
-15%
-10%
-5%
0%
5%
10%
15%
20%
Jan
-20
Ma
r-20
Ma
y-2
0
Jul-
20
Sep-2
0
Nov-2
0
Jan
-21
Ma
r-21
Ma
y-2
1
MAIL
AD
JU
ST
ED
RX
GR
OW
TH
Page 51
51
90 Day percentage of Rx’s based on Unadjusted Rx’s shows a slight increase from May to June, excluding Mail
10%
15%
20%
25%
30%
Jan
Feb
Ma
r
Apr
Ma
y
Jun
Jul
Aug
Sep
Oct
Nov
Dec
2019 2020 2021
10%
15%
20%
25%
30%
Jan
Feb
Ma
r
Apr
Ma
y
Jun
Jul
Aug
Sep
Oct
Nov
Dec
2019 2020 2021
IQVIA Copyright 2021 - Confidential - For Client Use Only
CHAIN
MASS
10%
15%
20%
25%
30%
Jan
Feb
Ma
r
Apr
Ma
y
Jun
Jul
Aug
Sep
Oct
Nov
Dec
2019 2020 2021
INDEP
10%
15%
20%
25%
30%
Jan
Feb
Ma
r
Apr
Ma
y
Jun
Jul
Aug
Sep
Oct
Nov
Dec
2019 2020 2021
FOOD
10%
15%
20%
25%
30%
Jan
Feb
Ma
r
Apr
Ma
y
Jun
Jul
Aug
Sep
Oct
Nov
Dec
2019 2020 2021
RETAIL
70%
75%
80%
85%
Jan
Feb
Ma
r
Apr
Ma
y
Jun
Jul
Aug
Sep
Oct
Nov
Dec
2019 2020 2021
MAIL
90 D
ay P
erc
en
tag
e b
ased
on
Un
ad
j. R
x’s
Page 52
52
COT market share declines minimally from March 2021
49%
50%
51%
52%Jan
Feb
Ma
r
Apr
Ma
y
Jun
Jul
Aug
Sep
Oct
Nov
Dec
2019 2020 2021
12%
13%
14%
15%
Jan
Feb
Ma
r
Apr
Ma
y
Jun
Jul
Aug
Sep
Oct
Nov
Dec
2019 2020 2021
IQVIA Copyright 2021 - Confidential - For Client Use Only
CHAIN
MASS
15%
20%
25%
Jan
Feb
Ma
r
Apr
Ma
y
Jun
Jul
Aug
Sep
Oct
Nov
Dec
2019 2020 2021
INDEP
14%
15%
16%
17%
Jan
Feb
Ma
r
Apr
Ma
y
Jun
Jul
Aug
Sep
Oct
Nov
Dec
2019 2020 2021
FOOD
Mark
et
Sh
are
based
on
Ad
jus
ted
Rx’s
Page 53
53
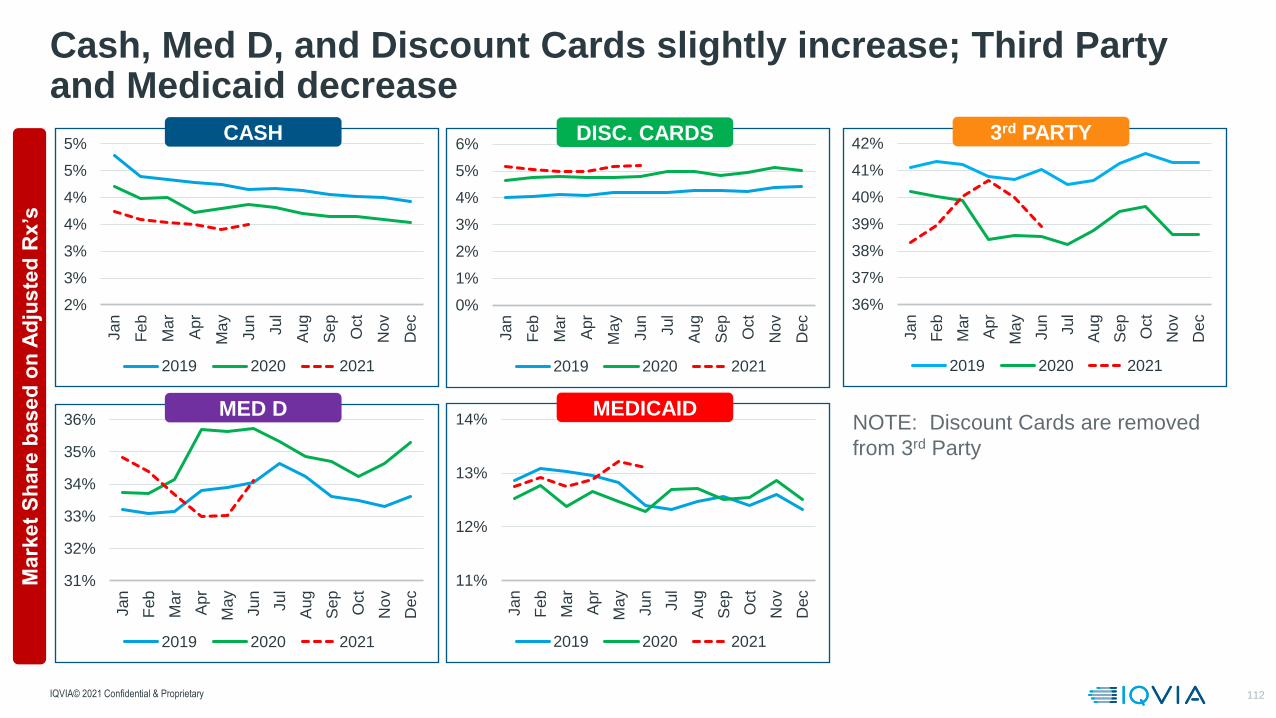
Cash, Med D, and Discount Cards slightly increase; Third Party and Medicaid decrease
2%
3%
3%
4%
4%
5%
5%
Jan
Feb
Ma
r
Apr
Ma
y
Jun
Jul
Aug
Sep
Oct
Nov
Dec
2019 2020 2021
31%
32%
33%
34%
35%
36%
Jan
Feb
Ma
r
Apr
Ma
y
Jun
Jul
Aug
Sep
Oct
Nov
Dec
2019 2020 2021
IQVIA© 2021 Confidential & Proprietary
CASH
MED D
0%
1%
2%
3%
4%
5%
6%
Jan
Feb
Ma
r
Apr
Ma
y
Jun
Jul
Aug
Sep
Oct
Nov
Dec
2019 2020 2021
DISC. CARDS
36%
37%
38%
39%
40%
41%
42%
Jan
Feb
Ma
r
Apr
Ma
y
Jun
Jul
Aug
Sep
Oct
Nov
Dec
2019 2020 2021
3rd PARTY
11%
12%
13%
14%
Jan
Feb
Ma
r
Apr
Ma
y
Jun
Jul
Aug
Sep
Oct
Nov
Dec
2019 2020 2021
MEDICAID
Mark
et
Sh
are
based
on
Ad
jus
ted
Rx’s
NOTE: Discount Cards are removed
from 3rd Party
Page 54
54
90-Day % of unadjusted Rx’s show percentages above prior year in all but Cash and Third Party
0%
5%
10%
15%
20%
Jan
Feb
Ma
r
Apr
Ma
y
Jun
Jul
Aug
Sep
Oct
Nov
Dec
2019 2020 2021
0%
10%
20%
30%
40%
50%
Jan
Feb
Ma
r
Apr
Ma
y
Jun
Jul
Aug
Sep
Oct
Nov
Dec
2019 2020 2021
IQVIA Copyright 2021 - Confidential - For Client Use Only
CASH
MED D
0%
5%
10%
15%
20%
25%
Jan
Feb
Ma
r
Apr
Ma
y
Jun
Jul
Aug
Sep
Oct
Nov
Dec
2019 2020 2021
DISC. CARDS
0%
5%
10%
15%
20%
25%
Jan
Feb
Ma
r
Apr
Ma
y
Jun
Jul
Aug
Sep
Oct
Nov
Dec
2019 2020 2021
3rd PARTY
0%
2%
4%
6%
8%
10%
Jan
Feb
Ma
r
Apr
Ma
y
Jun
Jul
Aug
Sep
Oct
Nov
Dec
2019 2020 2021
MANAGED MEDICAID
90
-Day %
based
on
Un
ad
juste
d R
x’s
0%
2%
4%
6%
8%
10%
12%
Jan
Feb
Ma
r
Apr
Ma
y
Jun
Jul
Aug
Sep
Oct
Nov
Dec
2019 2020 2021
STATE MEDICAID
Page 55
55
Patients & Adherence
Page 56
56
An important dynamic
Retail to Mail Shifts
IQVIA© 2021 Confidential & Proprietary
To better understand the deeper
dynamics of patients leaving retail and
going to mail (and then back to retail)
during COVID, we studied groups of
Diabetes (18M), RASA (38M), and
Statin (39M) patients
We looked at patients from the 3 therapies
who had:
• Retail only prescriptions between March
2019 and Feb 2020
• Then had mail prescriptions between
March 2020 - June 2021
• Then had retail prescriptions after the
last mail prescription between March
2020 - June 2021
• Retail ➔ Mail ➔ Retail
- We found that ~2.6% to 3.1%
of retail patients went to mail
- Of those patients going to mail,
~31% (RASA and Statins) to
48% (Diabetes) returned to retail
Summary – a small portion of retail only patients from the three therapies shifted to mail,
and we are seeing less than half of those patients returning to retail
Page 57
57
While there have been some patients lost to Mail during this pandemic their share of the total market is down
0%
2%
4%
6%
8%
10%
12%
Jan Feb Mar Apr May Jun Jul Aug Sep Oct Nov Dec
Mail
2019 2020 2021
85%
86%
87%
88%
89%
90%
91%
92%
Jan Feb Mar Apr May Jun Jul Aug Sep Oct Nov Dec
Retail
2019 2020 2021
Page 58
58
Without COVID vaccines, 2021 Retail patient counts are lower than 2020 and 2019 through May; with COVID vaccines, the retail patient counts are higher than prior years
30
3233
3736
37
20
22
24
26
28
30
32
34
36
38
40
Jan Feb Mar Apr May Jun Jul Aug Sep Oct Nov Dec
Patients with 90-Day Rx’s
2019 2020 2021
103103
105
9899
108
96
99
85
90
95
100
105
110
115
Jan Feb Mar Apr May Jun Jul Aug Sep Oct Nov Dec
Total Retail Patients
2019
2020
2021 With COVID Vaccines
2021 Excluding COVID Vaccines
Patients expressed in Millions
2021 Retail patients with 90-day prescriptions remains higher than 2020 and 2019
IQVIA© 2021 Confidential & Proprietary
Source: IQVIA, Longitudinal Patient Data, MAT June 2021
Page 59
59
COVID Vaccines boosted patient counts across all the classes of trade while Independents were the only class to gain when COVID vaccines were removed
IQVIA© 2021 Confidential & Proprietary
8.6%
12.6%
8.9%
4.1%
-1.4% -1.8%
0.9%
-7.0%
-10%
-5%
0%
5%
10%
15%
Chain Food Indep Mass
YoY Patient Gain by Class of Trade
Including COVID Vaccine Excluding COVID Vaccine
Source: IQVIA, Longitudinal Patient Data, MAT June 2021
Page 60
60
COVID vaccines provided a boost to Food’s patient share while Mass shows declines with and without COVID vaccines
55.0%
17.2%
9.9%
17.9%
55.1%
17.8%
9.9%
17.2%
Chain Food Indep Mass
+0.1%
+0.6% -0.7%
55.0%
17.2%
9.9%
17.9%
55.5%
17.2%
10.2%
17.0%
FoodChain Indep Mass
+0.5%
0.0%
+0.3%
-0.9%
MAT Jun 2021MAT Jun 2020
Patients (Including COVID Vaccines) Patients (Excluding COVID Vaccines)
IQVIA© 2021 Confidential & Proprietary
Patients are counted in each class of trade they visited during the time period
Source: IQVIA, Longitudinal Patient Data, MAT June 2021
Page 61
61
Mass Class of Trade lost 39% of the patients from the prior year and gained 32.5% new patients in the current year
IQVIA© 2021 Confidential & Proprietary
Note: This data excludes COVID Vaccines
-39.4%
32.5%
60.6%
-60%
-20%
20%
60%
Lost Gained Continued
% Change – Year over Year
Source: IQVIA, Longitudinal Patient Data, MAT June 2021
Page 62
62
Adherence is not uniform regionally and varies by different factors, such as method of payment: Med D is most adherent
State Level
Market
Adherence
Rates by Method
of Payment –
Diabetes
Source: IQVIA, State Level Market Adherence Rates by Method of Payment, MAT June 2021
Significant range of
variability between
states
IQVIA© 2021 Confidential & Proprietary
Page 63
63
YOY Change continues to demonstrate a focus on the 3 STAR therapies
Source: IQVIA, State Level Market Adherence Rates by Method of Payment, MAT June 2021
Significant range of
variability between
states
IQVIA© 2021 Confidential & Proprietary
Page 64
64
Actual Adherence Rates include patients in the light and dark blue colors combined.
Across STAR Therapy categories, ~9% of patients have the greatest influence on retailers’ adherence rates
Approximately 4% of
patients are on the cusp
of being adherent.
Retailers may be able to
convert these patients
with minor interventions.
At the same time, an
almost equal proportion of
patients have a PDC
between 80 and 85% and
are at risk of becoming
non-adherent.
80M Pts 42M Pts 14M Pts 15M Pts 8M Pts
Source: IQVIA, Longitudinal Patient Data, MAT June 2021
69% 70% 69% 67% 66%
5% 5% 5% 5% 5%4% 4% 4% 5% 4%
22% 21% 22% 23% 25%
0%
20%
40%
60%
80%
100%
Total Retail Chain Food Mass Independent
>=85% 80-<85% 75-<80% <75%
IQVIA© 2021 Confidential & Proprietary
Page 65
65
Adherence rates in each market are more than 20 points higher for patients getting 90-day Rx’s
90-day Rx’s are an effective way to increase adherence rates
Source: IQVIA, Longitudinal Patient Data, MAT June 2021
48%
78%55%
80%
53%
79%
0
10
20
30
No 90-day Any 90-day No 90-day Any 90-day No 90-day Any 90-day
DIABETES RASA STATIN
Mill
ion
sPDC>=80% PDC<80%
IQVIA© 2021 Confidential & Proprietary
Page 66
66
Non-Adherent Antidepressant Patients are the least adherent to their Star Therapy Meds
Patients who are Adherent to Antidepressants are the most adherent to their Star therapies
Source: IQVIA, Longitudinal Patient Data, MAT June 2021
79% 83% 82%
52% 56% 53%
70%76% 74%
21% 17% 18%
48% 44% 47%
30%24% 26%
0%
20%
40%
60%
80%
100%
DIABETES RASA STATIN DIABETES RASA STATIN DIABETES RASA STATIN
Adherent to Antidepressants Non-Adherent to Antidepressants Not on Antidepressants
Adherent to Star Therapy Non-Adherent to Star Therapy
IQVIA© 2021 Confidential & Proprietary
Page 67
67
Patient behavior for Adherence in STAR therapy requires an understanding of demographic characteristic risk factors
Applying IQVIA’s knowledge of risk factors to standard adherence performance metrics reveals insights to
those patients at greatest risk
Executive Brand
Risk Factor “High-Risk” Category Cutpoint
Income < $25,000 > 25% of population
Ethnicity Hispanic > 15% of population
Race Black > 18% of population
Education < High School Degree > 14.5% of population
Average Size of Household Larger Households > 2.67 persons
Home Value < $150,000 > 53% of population
IQVIA© 2021 Confidential & Proprietary
Page 68
68
Adherence typically declines with the compounding of multiple risk factors, adherence at Independents behaves a little differently
IQVIA© 2021 Confidential & Proprietary
60
65
70
75
80
85
CHAIN FOOD INDEPENDENT MASS
Ad
he
ren
ce
Rate
Diabetes Adherence by Number of Risk Factors – Med D Rx’s OnlyJuly 2020 – June 2021
0 Risk Factors 1 Risk Factor 2 Risk Factors 3 Risk Factors 4 Risk Factors 5 Risk Factors 6 Risk Factors
Source: IQVIA, Longitudinal Patient Data, MAT June 2021
Page 69
69
Med D Diabetes adherence increased year-over-year for all groups of risk factors, and on average, Chain stores show the most improvement
IQVIA© 2021 Confidential & Proprietary
74
.2% 76
.9%
78
.9%
72
.5% 75
.5%
77
.0%
74
.3%
75
.8%
77
.9%
73
.4%
75
.5%
76.2
%
75
.2%
77
.9%
79
.7%
72
.8% 75
.9%
77
.6%
74
.3%
76
.2%
78
.3%
75
.1%
76
.3%
76
.0%
68%
70%
72%
74%
76%
78%
80%
82%
High Medium Low High Medium Low High Medium Low High Medium Low
CHAIN MASS FOOD INDEPENDENT
Class of Trade and Risk Category Adherence Rates
202006 202106
Source: IQVIA, Longitudinal Patient Data, MAT June 2021
Page 70
70
Generics & Biosimilars
Page 71
71
Un
bra
nd
ed
Ge
ne
ric
sUnbranded generics show negative sales growth and unadjusted volumes
Source: IQVIA, National Sales Perspectives, August 2021
Note: Limited to Rx and OTC Insulins; Includes Retail, Non-Retail and Mail
Sales Adjusted Rx’s Unadjusted Rx’s
2.4 2.4 2.4
3.5
1.8
0
1
2
3
4
5
6
2018 2019 2020 MAT Jun2021
YTD Jun2021
Billio
ns
4.5 4.7 4.85.3
2.7
0
1
2
3
4
5
6
2018 2019 2020 MAT Jun2021
YTD Jun2021
Billio
ns55.9 56.4 56.3 56.6
27.9
0
10
20
30
40
50
60
2018 2019 2020 MAT Jun2021
YTD Jun2021
Billio
ns
-5.4%
0.9%
-0.3%
-2.16%
-4.82%
2018 2019 2020 MAT Jun2021
YTD Jun2021
YoY Growth
3.5% 4.2%2.1% 1.1% 1.3%
2018 2019 2020 MAT Jun2021
YTD Jun2021
-5.4%
0.9%
-0.3%
-2.6%
-1.6%
2018 2019 2020 MAT Jun2021
YTD Jun2021
IQVIA© 2021 Confidential & Proprietary
Page 72
72
Unbranded and branded generics account for 18.4% of spending in 2021
85.9% of prescriptions are dispensed as unbranded generics for 2021 (adjusted)
IQVIA© 2021 Confidential & Proprietary
74.8% 76.8% 78.7% 80.0% 81.0% 81.6%
10.4% 9.4% 9.3% 8.9% 8.7% 10.8%
10.3%10.1% 9.7% 8.8% 8.2% 8.2%
4.8% 4.4% 4.1% 3.6% 3.4%3.3%
14.9% 13.0% 11.6% 11.2% 10.8% 10.3%
84.8% 86.2% 86.6% 87.5% 87.8% 85.9%
2016 2017 2018 2019 2020 2021 2016 2017 2018 2019 2020 2021
Dollars (%) Adjusted Prescriptions (%)
Brands Branded Generics Unbranded Generics
Source: IQVIA, National Sales Perspectives, August 2021
Note: Limited to Rx and OTC Insulins; Includes Retail, Non-Retail and Mail
Page 73
Generic Deflation is running slightly negative and returning to historic levels according to Nephron Research
Source: Nephron Research, IQVIA, Glass Box Analytics
(20.0%)
(15.0%)
(10.0%)
(5.0%)
0.0%
5.0%
10.0%
15.0%
20.0%
25.0%
Oct-14 Feb-15 Jun-15 Oct-15 Feb-16 Jun-16 Oct-16 Feb-17 Jun-17 Oct-17 Feb-18 Jun-18 Oct-18 Feb-19 Jun-19 Oct-19 Feb-20 Jun-20 Oct-20 Feb-21
Gen
eric
Y/Y
Pri
cin
g C
han
ge CAH expects
inflation to decelerate in
2HFY15
ABC states generic inflation has slowed meaningfully
MCK issues FY17 outlook, resets inflation benefits bexpectations
to a range that includes zeroMCK and WMT announce
ClarusONE sourcing agreement
ClarusOne equalizes termsClarusOne bidding
cycle
WBAD plus ESRX, PMC and RAD begin to re-bid
Teva states contract with ClarusONE finalized
in 2Q17
Endo mentions consortia pressure as a reason for decreased pricing in 1Q
Generic manufacturer portfolio rationalization
expands throughout 2018
FDA approvals ramp considerably
FDA approvals ramp further
RAD renewal with MCK in December 2018 may have added ~125bps to
sell-side deflation
Returning to historic levels
Coronavirus concerns may have modestly elevated oral solid
deflation
Page 74
74
Biosimilars available as well as in development
Leading Drug Classes
-5%
0%
5%
10%
15%
20%
2015 2016 2017 2018 2019
Biologics Small molecule Total US medicines
Biologics
CAGR 2015-2019:
14.6%
Total US Medicines
CAGR 2015-2019:
6.1%
Small Molecule
CAGR 2015-2019:
1.6%
Total 2019 US Medicine
Spending $493 Billion
Biologic43%
Small Molecule
57%
The U.S. biologics market continues to grow faster than non-biologics on an invoice-basis, and now comprises 43% of spendingTotal U.S. Invoice Spending Growth by Type and Leading Therapy Areas by 2019 Spending, US$Bn
Source: IQVIA MIDAS®; IQVIA Institute, Jun 2020
Year-over-Year Spending Growth
2015 2016 2017 2018 2019
Biosimilars in development
13
15
16
18
20
24
29
62
64
71
- 10,000,000,000 20,000,000,000 30,000,000,000 40,000,000,000 50,000,000,000 60,000,000,000 70,000,000,000 80,000,000,000
Vaccines
Pain
Mental health
Multiple sclerosis
Anticoagulants
HIV antivirals
Respiratory agents
Immunology
Antidiabetics
Oncology*
IQVIA© 2021 Confidential & Proprietary
Page 75
75
2019 Biologics Market Segmented by Status of Biosimilar Competition, Biosimilar Development and Market Exclusivity
Molecules with biosimilars total $40 billion of invoice spending,while biosimilar development is targeting a further $67 billion
Source: IQVIA MIDAS®; IQVIA Pipeline Intelligence, IQVIA Institute, Jun 2020
Biologics market
$211 Billion
Molecules facing
biosimilar competition
$40 Billion
Non-recombinant/
vaccines
$36 Billion
64%
17%
19%
50%
50%
Molecules with
biosimilars in
development
$67 Billion
Molecules without
biosimilars in
development
$68 Billion
Molecules with
potential future
biosimilars
$135 Billion
91%
88%
12%
Originator protected
$61 Billion
Originator unprotected
$6 Billion
Originator unprotected
$8 Billion
Originator protected
$60 Billion
9%
IQVIA© 2021 Confidential & Proprietary
Page 76
76
pegaspargasepanitumumab
alglucosidase alfainterferon beta-1b
palivizumabcetuximabfilgrastim
darbepoetin alfateriparatidetocilizumabipilimumabgolimumab
pertuzumabcertolizumab pegol
natalizumabranibizumabeculizumabepoetin alfaomalizumabvedolizumabinsulin aspart
somatropintrastuzumab
bevacizumabdenosumab
pegfilgrastimrituximab
afliberceptliraglutideinfliximab
insulin lisproustekinumab
etanerceptinsulin glargine
adalimumab
0 2 4 6 8 10 12// 20
//
Molecules with launched biosimilars
Molecules with no launched biosimilars
Current Total Molecule Spending and Approved, Launched and Pipeline Biosimilar Products for the Molecule
There are biosimilars launched, approved, or in development for35 molecules
Source: IQVIA Institute, Sep 2020; IQVIA Biosimilar Database, Jun 2020
0 5 10 15 20
pegaspargase
panitumumab
alglucos idase alfa
interferon beta-1b
palivizumab
cetuximab
filgrast im
darbepoet in alfa
teriparat ide
tocilizumab
ipilimumab
golimumab
pertuzumab
certolizumab pegol
natalizumab
ranibizumab
eculizumab
epoetin alfa
omalizumab
vedolizumab
insulin aspart
somatropin
trastuzumab
bevacizumab
denosumab
pegfilgrastim
rituximab
aflibercept
liraglut ide
inf lix imab
insulin lispro
ustekinumab
etanercept
insulin glargine
adalimumab
Launched
Approved
Phase I to pre-registration
Pre-clinical to discovery
2019 Spending US$Bn Number of Biosimilars Drugs by Status
IQVIA© 2021 Confidential & Proprietary
Page 77
77
42%
25%
39%
6%
28%
20%
38%
0%
10%
20%
30%
40%
50%
60%
70%
0 1 2 3 4 5 6 7 8 9 10 11 12 13 14 15 16 17 18 19 20 21 22 23 24
Months since biosimilar introduction
bevacizumab 7/2019
epoetin alfa 9/2018
filgrastim 11/2013
infliximab 11/2016
pegfilgrastim 7/2018
rituximab 11/2019
trastuzumab 7/2019
0%
10%
20%
30%
40%
50%
60%
70%
80%
90%
100%
0 5 10 15 20 25 30 35 40 45 50
Weeks since biosimilar introduction
Non-340B Clinics
340B
Overall
All others
Biosimilar Share of Volume Since Biosimilar Launch
Recent biosimilars have achieved high volume shares, projected to reach more than 50% within the first two years, varying by channel
Source: IQVIA MIDAS®, Jun 2020
Biosimilar Share of Days in DDDsBiosimilar Share of Extended Units
Since Bevacizumab Biosimilar Launch
IQVIA© 2021 Confidential & Proprietary
Page 78
78
0
10
20
30
40
50
2019 2020 2021 2022 2023 2024
Sa
vin
gs f
rom
Bio
sim
ilars
, U
S$
Bn
Savings range high/low Savings base case
5-year Savings Scenarios
18 19
104
-
20,000,000,000
40,000,000,000
60,000,000,000
80,000,000,000
100,000,000,000
120,000,000,000
2010–2014 2015–2019 2020–2024
Source: IQVIA National Sales Perspectives, Jun 2020; IQVIA Institute, Sep 2020
Biologic Estimated Savings from Biosimilars at Invoice Prices
Savings over the next five years as a result of biosimilars areprojected to exceed $100 billion, though uncertainties remain
Biosimilar Savings by Cohort, US$Bn $104 Bn Base Case ($69–140 Bn Range)
IQVIA© 2021 Confidential & Proprietary
Page 79
79
Developed Markets Impact of Brand Losses of Exclusivity 2016–2025, US$Bn
The impact of exclusivity losses will increase to $166 billion overthe next 5 years mostly due to the availability of biosimilars
Source: IQVIA Market Prognosis, Sep 2020; IQVIA Institute, Feb 2021
Global Medicine and Spending Trends - Outlook to 2025. Report by the IQVIA Institute for Human Data Science.
-1.4 -3.7 -5.5 -5.2-8.5 -7.4
-11.7 -14.1-10.4
-22.1-23.4 -20.5
-21.9
-10.5
-14.6-21.7
-28.7 -22.3 -26.9-22.1-24.7 -24.3
-27.4
-15.7
-23.1
-29.1
-40.4
-36.3 -37.3
-50
-45
-40
-35
-30
-25
-20
-15
-10
-5
0
2016 2017 2018 2019 2020 2021 2022 2023 2024 2025
Biologic Small Total brand loss due to LOE
$114Bn $166Bn
Forecast
Page 80
80
Product Launches
IQVIA – Confidential & Proprietary
Page 81
81
FDA approvals have not decreased during the COVID-19 pandemic and brand teams are moving forward with commercialization
49 in 2020 and 44 in 2019
Launches during COVID
Mar-Dec 2020 had 52
launches compared to 61
launches Mar-Dec 2019
Examples of delayed
products include Zeposia
(MS) and Ongentys &
Kynmobi (Parkinson’s)
Sales trajectories
appear to be impacted
by ~60% and EUTRx by
~35%
FDA Approvals
The FDA has not slowed
down NME approvals since
the start of the pandemic
Number of Launches
In FY 2020, there have been
63 launches compared to 69
in FY 2019 (NMEs +
promoted branded generics)
Launches Delayed
Of the 49 products approved,
only 3 announced a delay due
to COVID but are subsequently
launched
Launch Trajectories
feeling the impact of
COVID
Ten months into COVID
launches during COVID do
appear to be impacted
IQVIA© 2021 Confidential & Proprietary
Page 82
82
Product Company Indication LaunchYr 1 Sales
to 11/2020
Yr 1 NBRx
to 1/1/21
Veklury Gilead COVID-19 Oct-20 $519.5M NA
Tepezza* HorizonThyroid Eye
DiseaseFeb-20 $438.8M N/A
Ubrelvy Allergan Migraine Jan-20 $420.2M 178.9k
Nurtec Biohaven Migraine Mar-20 $236.1M 132.1k
Ruxience Pfizer NHL,CLL, MPA Feb-20 $173.1M N/A
TrodelvyImmuno-
medicsBreast Cancer Apr-20 $105.8M N/A
Zirabev Pfizer
MCRC, NSCLC,
rGBM, mRCC,
CC
Jan-20 $68.4M N/A
Amzeeq Foamix Acne Jan-20 $37.8M 68.2k
Trazimera Pfizer
Breast Cancer,
gastric or GEJ
adenocarcinoma
Mar-20 $32.9M N/A
Koselugo AZ NF1 Apr-20 $30.8M N/A
Oncology37%
CNS 25%
Infectious Disease 10%
Diabetes 5%
Cardiology3%
Dermatology3%
Genito-urinary system and sex hormones 3%
Digestive 3%
Musculo-skeletal
system 3%All Other 8%
Gilead’s Veklury for COVID-19 leads 2020’s launches in sales followed by Horizon’s Tepezza (thyroid eye disease) and Allergan’s Ubrelvy (acute migraine)
2020 – 63 Launches 2020 – Top 10 Performers
MCRC – metastatic colorectal cancer; NSCLC Non-squamous non-small cell lung cancer
rGBM – recurrent glioblastoma; mRCC – metastatic renal cell carcinoma; CC- cervical cancer
NHL - non-Hodgkin’s lymphoma; CLL -chronic lymphocytic leukemia; MPA - microscopic polyangiitis;
NF1 - neurofibromatosis type 1; GEJ - gastroesophageal junction
N/A: NBRx unavailable or likely understated owing to non-retail and non-mail channel distribution
*Likely understated owing to product reporting blocksIQVIA© 2021 Confidential & Proprietary
Page 83
83
Only products with unambiguous and clear value propositions were successful
Products launching during the pandemic lag pre-COVID launches by ~50% to ~75%, with long-term implications
• The few successful launches in 2021 had very specific
value propositions:
- Gilead’s Veklury (remdesivir) treats COVID-19
- Ubrelvy (Allergan) and Nurtec (Biohaven) are oral
migraine drugs optimally set up for digital channels
- Horizon’s Tepezza treats an ultra-rare eye disorder
with no marketable treatments
- Pfizer’s Ruxience is a rituximab biosimilar
$0
$2
$4
$6
$8
$10
$12
$14
$16
Month 1 Month 2 Month 3 Month 4 Month 5 Month 6
Mill
ion
s
2020 Launches pre-COVID vs COVID Time Aligned Average Monthly Sales
2015 (n=67) 2016 (n=43) 2017 (n=53)
2018 (n=61) 2019 (n=46) 2020 (n=54)
2020 Pre-COVID (n=11) 2020 COVID (n=43)
Year 6M Sales % Diff
COVID (n=43) $13.6M
2015 (n=67) $38.3M -64.5%
2016 (n=43) $54.3M -74.9%
2017 (n=53) $40.3M -66.2%
2018 (n=61) $24.4M -44.3%
2019 (n=46) $49.3M -72.4%
2020 Pre-COVID (n=11) $35.5M -61.7%
IQVIA – Confidential & ProprietaryIQVIA© 2021 Confidential & Proprietary
Page 84
84
Product launch summary
38Launches thru
Jun 2021
23Of the 27 FDA approved New
Molecular Entities (NMEs) in 2021
show evidence of launch based on
supply in channel or active websites
In 2020, the FDA approved New
Molecular Entities (NMEs). Of those
44 out of 49 show evidence of launch.
Top Therapy Areas of 2021 Launches
Oncology
$13.0
$7.7 $7.6
Menquadfi(Mar 21)
Nyvepria(Jan 21)
Orgovyx(Jan 21)
Top 2021 Launches by Sales (millions)
37%
Pharmaceutical companies continue to bring new products to market despite the uncertainty
introduced by the COVID-19 pandemic; there were 71 launches through December 2020 in line with
69 launches for the same period in 2019. To date, 2021 has seen a similar rate of product launches
compared to 2019 and 2020
Prostate
Cancer
Meningococcal
vaccineFebrile
Neutropenia
Infectious
13%
CNS
16%
IQVIA© 2021 Confidential & Proprietary
Page 85
85
Clinical Trial Starts by Month and Phase Jan 2019–Mar 2021
Monthly clinical trial starts declined significantly in early 2020 butrecovered from June to higher levels than in 2019
IQVIA© 2021 Confidential & Proprietary
Page 86
86
Opioids
IQVIA – Confidential & Proprietary
Page 87
87
Over 90,000 drug overdose deaths occurred in the US in the 12 months ending September 2020
IQVIA© 2021 Confidential & Proprietary
90
,23
7
70
,72
3
47
,52
3
0
10,000
20,000
30,000
40,000
50,000
60,000
70,000
80,000
90,000
100,000
Sep-2
0
Apr-
20
Nov-1
9
Jun
-19
Jan
-19
Aug-1
8
Ma
r-18
Oct-
17
Ma
y-1
7
Dec-1
6
Jul-
16
Feb
-16
Sep-1
5
Apr-
15
12 Month-ending Provisional Number of Drug Overdose Deaths
https://www.cdc.gov/media/releases/2020/p1218-overdose-deaths-covid-19.html
Page 88
88
Prescription Opioid Use in Morphine Milligram Equivalents (MME) per Capita, 1992–2020
Continued declines have brought normalized per capita prescription opioid use near the 2001 level
IQVIA© 2021 Confidential & Proprietary
Source: IQVIA Xponent, Apr 2021; IQVIA National Prescription Audit; IQVIA Institute, Jul 2021
0
100
200
300
400
500
600
700
800
900
199
2
199
3
199
4
199
5
199
6
199
7
199
8
199
9
200
0
200
1
200
2
200
3
200
4
200
5
200
6
200
7
200
8
200
9
201
0
201
1
201
2
201
3
201
4
201
5
201
6
201
7
201
8
201
9
202
0
Dis
pe
nse
d M
ME
pe
r ca
pita
367
334
2019 MME per capita level 2020 MME per capita level
Page 89
89
Prescription Opioid Use Segmented by Morphine Milligram Equivalents (MME) per Day, 2011–2020
The greatest reduction in prescription opioid use has been in thehighest risk segment, which contain more than 90 MMEs per day
IQVIA© 2021 Confidential & Proprietary
Source: IQVIA Xponent, Apr 2021; IQVIA Institute, Jul 2021
0
50
100
150
200
250
2011 2012 2013 2014 2015 2016 2017 2018 2019 2020
MM
Es d
ispe
nse
d B
n
% Change 2011–2020
90+ MME per Day
50<90 MME per Day
20<50 MME per Day
<20 MME per Day
Total -55%
-15%
-38%
-36%
-74%
Page 90
90
Number of Prescription Opioids Dispensed by Pay Type, Millions, 2011–2020
The number of Medicare opioid prescriptions is unchanged since 2011, while other pay types have declined
IQVIA© 2021 Confidential & Proprietary
Source: IQVIA Xponent, Apr 2021; IQVIA Institute, Jul 2021
Change in Opioid Prescriptions
2011–2020
Commercial
Medicare
Medicaid
Cash
Total -44%
-68%
-50%
0%
-55%
0
50
100
150
200
250
300
2011 2012 2013 2014 2015 2016 2017 2018 2019 2020
24
32
53
149
8
16
53
67
Page 91
91
Prescription Levels of Opioid, Medication-Assisted Treatment, and All Other Medications as aPercentage of Baseline (first 8 weeks of 2020), March 2020-July 2021
During the COVID-19 pandemic, as many as 44% fewer newpatients received prescription opioids while MAT was less impacted
IQVIA© 2021 Confidential & Proprietary
Source: IQVIA New to Brand Weekly, Jul 2021
50%
60%
70%
80%
90%
100%
110%
120%
Base
line
4/3
5/8
6/1
2
7/1
7
8/2
1
9/2
5
10/3
0
12/4
1/8
2/1
2
3/1
9
4/2
3
5/2
8
7/2
Total prescriptions (TRx) Continuing brand prescriptions (CBRx) New to brand prescriptions (NBRx)
Base
line
4/3
5/8
6/1
2
7/1
7
8/2
1
9/2
5
10/3
0
12/4
1/8
2/1
2
3/1
9
4/2
3
5/2
8
7/2
Base
line
4/3
5/8
6/1
2
7/1
7
8/2
1
9/2
5
10/3
0
12/4
1/8
2/1
2
3/1
9
4/2
3
5/2
8
7/2
Prescription Opioids Medication-Assisted Treatment All Other Prescriptions
Page 92
92
Patients Taking Any Benzodiazepine-Opioid, Benzodiazepine, or Opioid Therapy by Age, Millions
Patients taking benzodiazepines, opioids, or a combination of both, have declined from 86 million to 60 million between 2016 and 2020
IQVIA© 2021 Confidential & Proprietary
Source: IQVIA U.S. Prescription Claims (LRx), Jul 2021; IQVIA Institute, Nov 2020
64.759.3
51.746.3
41.2 42.2
21.3
21.2
20.3
19.6
18.6 19.5
86.0
80.4
72.0
65.9
59.8 61.7
2016 2017 2018 2019 2020 2021*
Under 65 Over 65
+2.4%
-3.1%
-12.7% -11.0%
+4.5%-5.2%
-4.2%
-0.7%
-10.5%-8.4%
Page 93
93
“AMA report shows evolving, deadlier overdose epidemic”*9
,61
0
5,7
77
6,8
41 1
3,0
51
12
,74
7
19
,50
0
7,6
10
10
,45
8 15
,55
1
14
,53
4
28
,65
9
10
,43
5
14
,06
9
15
,59
3
14
,55
9
31
,52
5
12
,84
3
14
,80
2
15
,10
2
12
,62
0
36
,50
9
16
,27
9
15
,97
4
14
,07
9
11
,90
4
0
5,000
10,000
15,000
20,000
25,000
30,000
35,000
40,000
Fentanyls Stimulants Cocaine Heroin PrescriptionOpioids
# of Deaths by Substance
2015 2016 2017 2018 2019
-7%
8%
134%
182%
280%
-100% 0% 100% 200% 300%
Prescription Opioids
Heroin
Cocaine
Stimulants
Fentanyls
2015-2019 Growth
2015-2019 Growth
Data Source: CDC Provisional Drug Overdose Death Counts, https://www.cdc.gov/nchs/nvss/vsrr/drug-overdose-data.htm
* https://www.ama-assn.org/press-center/press-releases/ama-report-shows-evolving-deadlier-overdose-epidemic
IQVIA© 2021 Confidential & Proprietary
Page 94
94
Outlook for 2021
IQVIA – Confidential & Proprietary
Page 95
95
There have been a series of legacy considerations recognized across stakeholders
Pharmacies
• Reimbursement
• Controlled Substances
• Access to Specialty Drugs
• Purchasing Alliances
• Track and Trace
• Amazon, Digital pharmacies and cash customers
Generic Manufacturers
• Purchasing Alliances
• Portfolio Optimization (“Shrink to Grow”) / Market Saturation
• Brand /niche drugs (complex generics)
• Generic Price Deflation
• Which approvals to launch?
Wholesalers
• Contract Negotiations
• Controlled Substances
• Generic Price Deflation / Slow Brand Inflation
• Track and Trace
• Purchasing Alliances
Payers
• Managing Specialty Drug Costs
• Rising Oncology costs
• Formularies blocks and exclusive launches
Brand/Specialty Manufacturers
• Price increase backlash
• Becoming more specialized / Oral Specialty
• Declining Hep C and Pain Dollars
• Orphan Drugs
• Copay accumulators
Consumers
• Rising costs: high out-of-pocket costs / coinsurance /
accumulators
• Quality of Insurance Coverage
• Specialty Tiers
IQVIA© 2021 Confidential & Proprietary
Page 96
96
Drugstore News recently put the following question out to their readers, “What is pharmacy’s biggest challenge?”
https://drugstorenews.com/poll-results-reimbursement-top-mind, 8/4/2021
35%
27%
17%
12%
9%
Other
DIR Fees
Reimbursement Pressure
Payers Pushing for Online/Mail-Order Pharmacies
Amazon
IQVIA© 2021 Confidential & Proprietary
Among the 12% who didn’t think
any of the answers supplied by
DSN constituted the biggest
challenge in the industry,
staffing concerns emerged as
a leading area of concern —
with many noting that fewer
people staffing the pharmacy
counter means pharmacists are
spread too thin.
Page 97
IQVIA Template (V2.1.0)
97
What factors will influence the rebound of the 86 million acute Rx’s lost between 2019 and 2020?
Positive Impacts –
Increases in Rx’s*
• Testing options – better identification of
cases = improvement in quarantine practices =
reduction in overall COVID cases = increases
in non-COVID Rx’s
• More elective surgeries – increase in non-
COVID Rx’s (pain, anti-infectives)
• More routine office visits – increase in non-
COVID Rx’s (> Avg Rx per visit than
telehealth)
• Mask mandates lifted – increases in
cough/cold flu Rx’s
• Improved access to vaccine – decrease in
cases = return to normal life = overall increase
in non-COVID Rx’s
• LTC – shifting back to pre-COVID levels –
increase in LTC (chronic and acute) Rx’s
Negative Impacts –
Decreases in Rx’s
• Telemedicine – plateauing but likely here to
stay = fewer Rx’s per visit than traditional in
person visit
• Flu vaccines – will they match the historic
numbers from last season? If so, could result
in decreases in non-COVID/Cough/Cold Rx’s
Unknown Impacts – not certain
how this will impact Rx’s
• Hand washing & hand sanitizer – ingrained
in daily lives = decrease in cough/cold/flu =
decrease in Rx’s but potentially leading to
fewer COVID cases = increase in overall non-
COVID Rx’s
• Return to school/work/travel/conventions/
dining/entertainment – could result in
increases in cough/cold/flu cases and
associated Rx’s but could also increase
COVID cases which could decrease non-
COVID Rx’s
*Assumption is that lower COVID cases = higher non-COVID/Cough/Cold Rx’s (increased MD visits, more exposure to other illnesses).
IQVIA – Confidential & Proprietary
Page 98
98
Healthcare must address COVID
disruption - pharma has a role
• Telehealth
• Reinforced supply chains
• Self-administered therapy options
• Remote/digital HCP engagement
• COVID testing and vaccines
However, with the pandemic, new trends may define 2021—and beyond
Prices scrutinized; increasing pressure
to demonstrate value
Widespread and successful vaccination
now seems more likely; immunity
longevity remains a question mark
Successful vaccination will not
necessarily mean a return to
business as usual
All geographies and stakeholders
impacted by the pandemic
NCE launches must adapt to an uncertain
environment; biosimilars grow into
maturity
Some markets showcase resilience
and growth
2020s
IQVIA© 2021 Confidential & Proprietary
Page 99
99
263 254 256284 311 323 324 338 356 359 367 373 378 385 391
328 319333
380
427446 455
484511
539560 578
595614
634
0
100
200
300
400
500
600
700
2011 2012 2013 2014 2015 2016 2017 2018 2019 2020 2021 2022 2023 2024 2025
Net sales Invoice to net difference
U.S. Medicine Spending and Growth at Invoice-level and Estimated Net 2011–2025
The U.S. spending forecast reflects an increasing gap between invoice level spending and manufacturer net revenues
Source: IQVIA Institute, Feb 2021
Forecast
Net
CAGR
3.9%
Net 27%
Below
Invoice
Invoice
CAGR
6.3%
5-Year CAGRs
IQVIA© 2021 Confidential & Proprietary
Net
CAGR
2.9%
Net 33%
Below
Invoice
Invoice
CAGR
3.5%
5-Year CAGRs
Net
CAGR
0-3%
Net 38%
Below
Invoice
Invoice
CAGR
2-5%
5-Year CAGRs
Invoice
Page 100
100
Patients visit pharmacies 10x more frequently than they see other healthcare providers1
Pharmacists’
roles are
expanding
Chronic Disease Management Health & Wellness Care
Conduct Therapeutic
Interchange
Minor Ailment Care
Immunizations
Preventive Health Screenings
Specialty Medicare Care
& Counselling
Pharmacogenomics
Counselling
Transitions of Care
Medication Optimization
1 Hemberg N, Huggins D, et al. Innovative Community Pharmacy Practice Models in North Carolina. North Carolina Medical Journal. June 2017. http://www.ncmedicaljournal.com/content/78/3/198.full
IQVIA© 2021 Confidential & Proprietary
Page 101
101
Other key findings
The most frequently used healthcare
services; Vaccinations and
Routine Screenings
51% of pharmacy customers have used health and wellness services over the last year according to J.D. Powers
43%
48%51%
2019 2020 2021
Pharmacy Customers using
health and wellness services
Source: J.D. Powers 2021 US Pharmacy Study
Customers who use at least 1 health and
wellness-oriented service spend an
average of $5 more than those who do
not use these services
Overall satisfaction and brand advocacy
scores also increased 24 points when
customers utilized wellness services
Mobile app integration in pharmacies is
becoming increasingly vital:
-26 percent of brick-and-mortar
customers
-27 percent of small order
customers accessed their
pharmacy’s mobile app
Satisfaction with brick-and-mortar mobile apps
landed at 848, and overall satisfaction with
mail-order mobile apps was 868
Researchers noted that both of these scores
are higher than the average mobile app or text
message satisfaction score of
826 seen in the J.D. Power 2021
Commercial Member Health Plan Study
IQVIA© 2021 Confidential & Proprietary
Page 102
102
The IQVIA Institute produces a number of reports on a regular basis that you might find useful, check them out
IQVIA© 2021 Confidential & Proprietary
This report examines the
trends in pharmaceutical
research and development
through the end of 2020. It
provides an analysis of
initiated clinical trials,
including the impact of the
pandemic and COVID-19-
specific research. Research
on clinical development
productivity is also
presented, as well as
profiles of the R&D pipeline,
R&D funding trends, and
characteristics of new drug
approvals and launches.
Despite the COVID-19
pandemic having a
substantial impact on patient
care during 2020, the
scientific advances in clinical
trial activity, the pipeline of
new treatments, and the
increased use of available
therapeutics, continued
largely unaffected and
reflect the commitment to
advancing care for patients
by oncologists, other care
providers, governments and
payers, and life sciences
companies.
The U.S. health system
demonstrated resilience and
flexibility during 2020,
recovering toward its pre-
pandemic levels of activity
and progressing into 2021,
even as the backlog of
missed or delayed activity
remains substantial.
Medicine supply was largely
maintained and spending on
medicines increased by less
than 1% on a net price
basis.
The future level of global
spending on medicines has
implications for healthcare
systems and policymakers
across developed and
emerging economies, and
these issues are even more
important in light of the
ongoing global COVID-19
pandemic.
The opioid epidemic has
captivated the country for a
decade, although it lost
attention this year in the face
of the COVID-19 pandemic,
which affected the life and
healthcare of patients with
chronic pain and addiction
and so many others.
Innovation in digital health
tools, including mobile
health apps and wearable
sensors, bring new
approaches to the
management of health
conditions. Digital
therapeutics to treat human
disease are being approved
by regulatory agencies
around the world and routes
to reimbursement are being
established as developers
generate and submit high-
quality data on effectiveness
to payers and employers.
All these reports and others can be found at: https://www.iqvia.com/insights/the-iqvia-institute/reports
Page 103
103
Disclaimer:
• The analyses, their interpretation, and related information contained herein are made and provided subject to the
assumptions, methodologies, caveats, and variables described in this report and are based on third party sources
and data reasonably believed to be reliable. No warranty is made as to the completeness or accuracy of such
third party sources or data.
• As with any attempt to estimate future events, the forecasts, projections, conclusions, and other information
included herein are subject to certain risks and uncertainties, and are not to be considered guarantees of any
particular outcome.
• All reproduction rights, quotations, broadcasting, publications reserved. No part of this presentation may be
reproduced or transmitted in any form or by any means, electronic or mechanical, including photocopy, recording,
or any information storage and retrieval system, without express written consent of IQVIA.
• ©2020 IQVIA Incorporated and its affiliates. All rights reserved. Trademarks are registered in the United States
and in various other countries.
Thank you
IQVIA© 2021 Confidential & Proprietary
Page 104
104
Doug Long is Vice President of Industry Relations at IQVIA (formerly QuintilesIMS), the world’s
largest pharmaceutical information company. IQVIA offers services to the pharmaceutical industry
in over 100 countries around the globe. Doug has been with IQVIA since 1989.
His fundamental task is to help secure data for all existing and new databases supported by
IQVIA, manage supplier, manufacturer & association relationships, and develop information for
data partners. As direct consequence of his involvement in these areas, Doug has considerable
experience with, and a unique perspective on, the changing U.S. and global healthcare
marketplace and pharmaceutical distribution.
Doug is a frequent industry speaker and the recipient of many awards from trade groups. Before
joining IQVIA Doug held positions at Nielsen Market Research for 16 years in various sales and
marketing capacities. A native of Illinois, Doug received a BA from DePauw University and holds
an MBA in management from Fairleigh Dickinson University.
[email protected]
IQVIA© 2021 Confidential & Proprietary
Page 105
105IQVIA© 2021 Confidential & Proprietary
Scott Biggs, Director, Supplier Services
Scott Biggs is Director of Supplier Services at IQVIA (previously known as
QuintilesIMS), the world’s largest pharmaceutical information company, serving over
101 countries. He has been with IQVIA since 2011.
Prior to IQVIA Scott worked for other pharmaceutical information companies for
several years and worked at Rite Aid Corporation in multiple roles for over 10 years.
Scott received a BS degree from Penn State University in Accounting and has been
working with pharmacy data for almost 25 years.
In his role at IQVIA Scott has worked with retailers, software vendors and other data
suppliers where he has helped them to understand their performance in the market
place through business reviews and market analysis.
Page 106
106
Brand Adjusted and Unadjusted Rx growth has exploded due to COVID vaccines
Source: IQVIA, Xponent®, April 2021
Note: Limited to Rx and OTC Insulins; Includes Retail and Mail
Un
ad
jus
ted
Rx
’sA
dju
ste
d R
x’s
Brand Branded Generic Generic
-12.6%
0.0%
-3.5% -2.1%
25.1%
54.3%
2017 2018 2019 2020 MAT Jun2021
YTD Jun2021
-14.0%
-7.5%
-13.1%
-8.5%-5.1% -4.5%
2017 2018 2019 2020 MAT Jun2021
YTD Jun2021
-4.2%-0.3%
0.6%
-2.1% -2.6% -1.6%
2017 2018 2019 2020 MAT Jun2021
YTD Jun2021
-12.9%
1.3%
-1.3% -0.3%
20.4%
41.7%
2017 2018 2019 2020 MAT Jun2021
YTD Jun2021
-11.7%
-4.0%
-9.9%
-2.7%
0.5% 0.1%
2017 2018 2019 2020 MAT Jun2021
YTD Jun2021
-2.2%
3.2% 3.3% 2.3% 1.1% 1.3%
2017 2018 2019 2020 MAT Jun2021
YTD Jun2021
IQVIA© 2021 Confidential & Proprietary
Page 107
107
Bra
nd
COVID Vaccines drive Brand Rx volumes
Source: IQVIA, National Sales Perspectives, August 2021, Xponent®
Note: Limited to Rx and OTC Insulins; Includes Retail, Non-Retail and Mail
Sales Adjusted Rx’s Unadjusted Rx’s
425.9 411.1 402.5
497.9
271.2
0
100
200
300
400
500
600
2018 2019 2020 MAT Jun2021
YTD Jun2021
Millio
ns
454.1 449.2 451.2
625.2
334.4
0
100
200
300
400
500
600
700
2018 2019 2020 MAT Jun2021
YTD Jun2021
Millio
ns
380.3409.8 433.5 452.6
230.4
0
100
200
300
400
500
2018 2019 2020 MAT Jun2021
YTD Jun2021
Billio
ns
9.0%7.8%
5.8%
7.6%8.8%
2018 2019 2020 MAT Jun2021
YTD Jun2021
YoY Growth
1.9%
-1.1%
0.4%
20.4%
41.7%
2018 2019 2020 MAT Jun2021
YTD Jun2021
0.1%
-3.5% -2.1%
25.1%
54.3%
2018 2019 2020 MAT Jun2021
YTD Jun2021
IQVIA© 2021 Confidential & Proprietary
Page 108
108
In MAT June 2021, specialty spend increased 8.6% while traditional products grew 5.1%
For retail and mail channels (combined), specialty growth is outpacing traditional growth and now has ~41% share of total non-discounted spend
$117.3 $126.5 $140.3 $153.6$160.6
$205.6$211.1
$214.3$220.3 $226.8$322.9
$337.6$354.7
$373.9 $387.4
-30%
0%
30%
$
$60
$120
$180
$240
$300
$360
Gro
wth
N
on
-Dis
co
un
ted
Sp
en
d (
BN
s)
SPECIALTY TRADITIONAL SPECIALTY GROWTH TRADITIONAL GROWTH TOTAL MARKET GROWTH
Source: IQVIA, National Sales Perspectives Restricted to Retail and Mail Channels, Jun 2021
Share of Sales 2017 2018 2019 2020MAT JUN
2021
SPECIALTY 36.3% 37.5% 39.6% 41.1% 41.4%
TRADITIONAL 63.7% 62.5% 60.4% 58.9% 58.6%
Page 109
109
In MAT June 2021, specialty spend increased 3.2% while traditional grew 5.0%
For the retail channel, traditional growth is outpacing specialty growth and now has ~84% share of total non-discounted spend
$30.9 $32.4 $34.7 $36.9 $37.4
$180.3 $183.7 $186.8 $192.4 $198.1$211.2 $216.1 $221.6 $229.3 $235.5
-15%
0%
15%
$
$50
$100
$150
$200
$250
Gro
wth
N
on
-Dis
co
un
ted
Sp
en
d
(BN
s)
SPECIALTY TRADITIONAL SPECIALTY GROWTH TRADITIONAL GROWTH TOTAL MARKET GROWTH
Source: IQVIA, National Sales Perspectives Restricted to Retail Only, June 2021
Share of Sales 2017 2018 2019 2020MAT
JUN 2021
SPECIALTY 14.6% 15.0% 15.7% 16.1% 15.9%
TRADITIONAL 85.4% 85.0% 84.3% 83.9% 84.1%
Page 110
110
Absolute Value Growth for Top Specialty Therapy Areas
In 2021, Immunology, Oncologics, All other respiratory Specialty absolute value growth while Multiple Sclerosis, Viral Hepatitis and Hematopoietic Growth factors vaccine contributed most to value decline
IQVIA© 2021 Confidential & Proprietary
$12.4
$5.1
$0.3
-$1.2
$0.3
$0.9
$0.3
-$1.1
$0.5
-$0.5
$0.4
$0.2
-$5 $0 $5 $10 $15
IMMUNOLOGY
ONCOLOGICS
HIV ANTIVIRALS
MULTIPLE SCLEROSIS
POLYVAL IMMUNOGLOBLULINS IV&IM
ALL OTHER RESPIRATORY
MENTAL HEALTH
VIRAL HEPATITIS
RESPIRATORY AGENTS
HEMATOPOIETIC GROWTH FACTORS
BLOOD COAGULATION
All Other
Absolute Value Growth (US$ BNs)
∆Change from MAT JUN 2020 to MAT JUN 2021
$49.4
$33.5
$8.7
$0.1
$2.8
$3.3
$2.0
-$12.5
$2.7
-$1.2
$2.0
$10.7
-$20 -$10 $0 $10 $20 $30 $40 $50
Absolute Value Growth (US$ BNs)
∆Change from 2016 to MAT JUN 2021
Page 111
111
Absolute Value Growth for Top Traditional Therapy Areas
Antidiabetics, Anticoagulants and Other Cardiovasculars lead traditional products absolute value growth
IQVIA© 2021 Confidential & Proprietary
$8.7
-$0.1
$3.1
$0.7
$0.7
$0.5
$0.4
-$0.5
$0.0
$0.2
$0.9
-$0.6
$0.2
-$4 $0 $4 $8 $12
ANTIDIABETICS
RESPIRATORY AGENTS
ANTICOAGULANTS
PAIN
MENTAL HEALTH
VACCINES (PURE, COMB, OTHER)
GI PRODUCTS
NERVOUS SYSTEM DISORDERS
ADHD
ANTIHYPERTENSIVES, PLAIN & COMBO
OTHER CARDIOVASCULARS
DERMATOLOGICS
All Other
Absolute Value Growth (US$ BNs)
∆Change from MAT JUN 2020 to MAT JUN 2021
$31.9
$3.8
$14.4
-$4.0
-$1.7
$3.1
$1.3
-$2.7
-$2.4
-$1.5
$1.4
-$5.0
-$23.7
-$30 -$20 -$10 $0 $10 $20 $30 $40
Absolute Value Growth (US$ BNs)
∆Change from 2016 to MAT JUN 2021
Page 112
112
Cash, Med D, and Discount Cards slightly increase; Third Party and Medicaid decrease
2%
3%
3%
4%
4%
5%
5%
Jan
Feb
Ma
r
Apr
Ma
y
Jun
Jul
Aug
Sep
Oct
Nov
Dec
2019 2020 2021
31%
32%
33%
34%
35%
36%
Jan
Feb
Ma
r
Apr
Ma
y
Jun
Jul
Aug
Sep
Oct
Nov
Dec
2019 2020 2021
IQVIA© 2021 Confidential & Proprietary
CASH
MED D
0%
1%
2%
3%
4%
5%
6%
Jan
Feb
Ma
r
Apr
Ma
y
Jun
Jul
Aug
Sep
Oct
Nov
Dec
2019 2020 2021
DISC. CARDS
36%
37%
38%
39%
40%
41%
42%
Jan
Feb
Ma
r
Apr
Ma
y
Jun
Jul
Aug
Sep
Oct
Nov
Dec
2019 2020 2021
3rd PARTY
11%
12%
13%
14%
Jan
Feb
Ma
r
Apr
Ma
y
Jun
Jul
Aug
Sep
Oct
Nov
Dec
2019 2020 2021
MEDICAID
Mark
et
Sh
are
based
on
Ad
jus
ted
Rx’s
NOTE: Discount Cards are removed
from 3rd Party