U.S. Refinery Benzene Emissions Increase in 2008: Data Quality Concerns Undermine Confidence in Reported Data Photo Credit: U.S. EPA, http://www.epa.gov/oust/graphics/miscpix2.htm. The Environmental Integrity Project Washington, D.C. February 4, 2010
Transcript
U.S. Refinery Benzene Emissions Increase in 2008: Data Quality Concerns Undermine Confidence in Reported Data
Photo Credit: U.S. EPA, http://www.epa.gov/oust/graphics/miscpix2.htm.
The Environmental Integrity Project
Washington, D.C.
February 4, 2010
1
U.S. Refinery Benzene Emissions Increase in 2008:
Data Quality Concerns Undermine Confidence in Reported Data
A Report by the Environmental Integrity Project
Trends in Benzene Emissions from U.S. Refineries
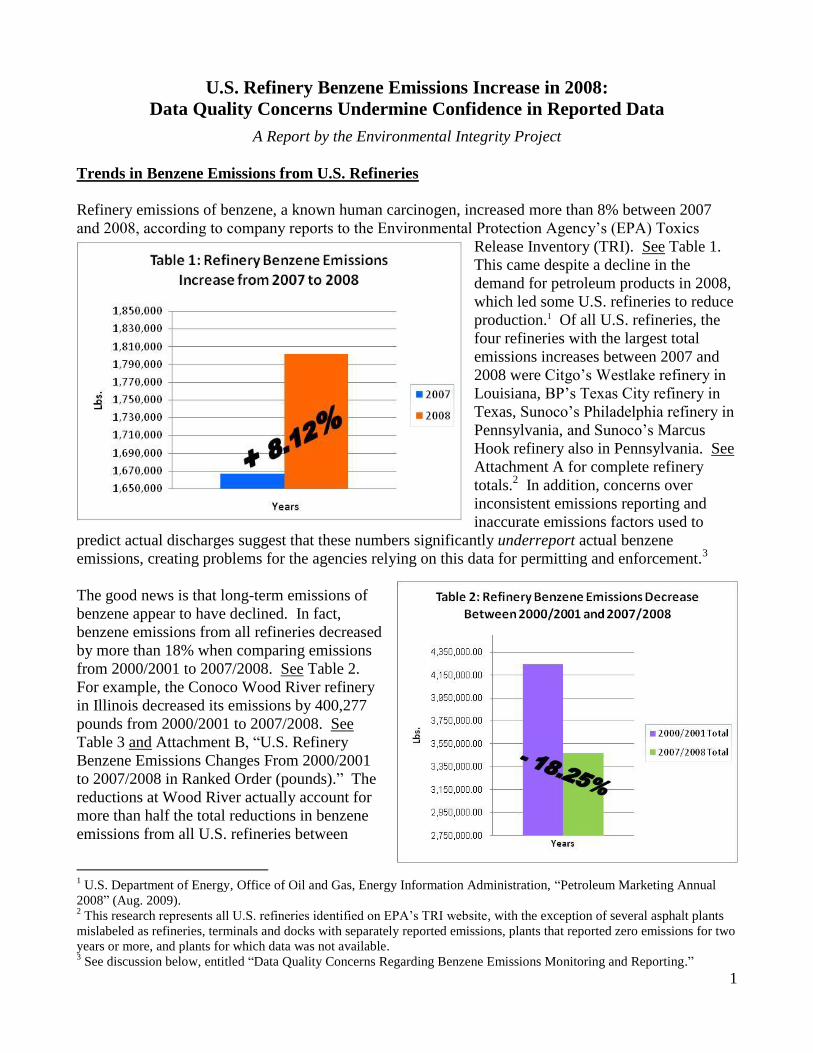
Refinery emissions of benzene, a known human carcinogen, increased more than 8% between 2007
and 2008, according to company reports to the Environmental Protection Agency’s (EPA) Toxics
Release Inventory (TRI). See Table 1.
This came despite a decline in the
demand for petroleum products in 2008,
which led some U.S. refineries to reduce
production.1 Of all U.S. refineries, the
four refineries with the largest total
emissions increases between 2007 and
2008 were Citgo’s Westlake refinery in
Louisiana, BP’s Texas City refinery in
Texas, Sunoco’s Philadelphia refinery in
Pennsylvania, and Sunoco’s Marcus
Hook refinery also in Pennsylvania. See
Attachment A for complete refinery
totals.2 In addition, concerns over
inconsistent emissions reporting and
inaccurate emissions factors used to
predict actual discharges suggest that these numbers significantly underreport actual benzene
emissions, creating problems for the agencies relying on this data for permitting and enforcement.3
The good news is that long-term emissions of
benzene appear to have declined. In fact,
benzene emissions from all refineries decreased
by more than 18% when comparing emissions
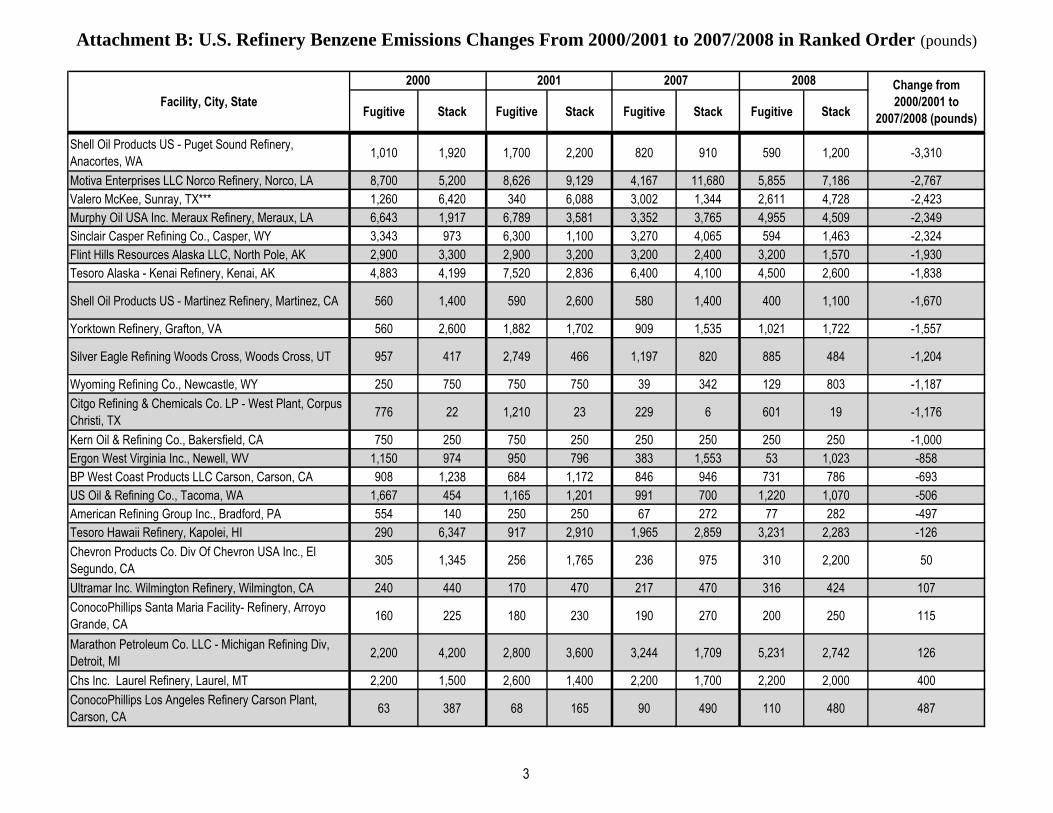
from 2000/2001 to 2007/2008. See Table 2.
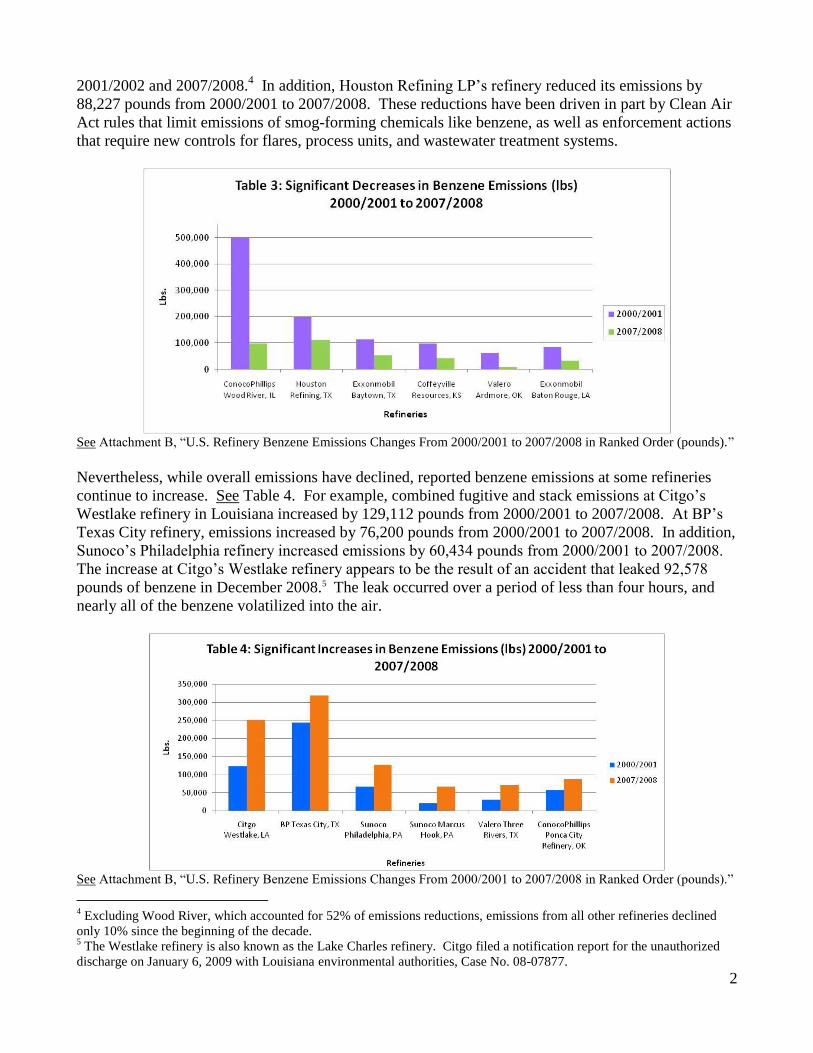
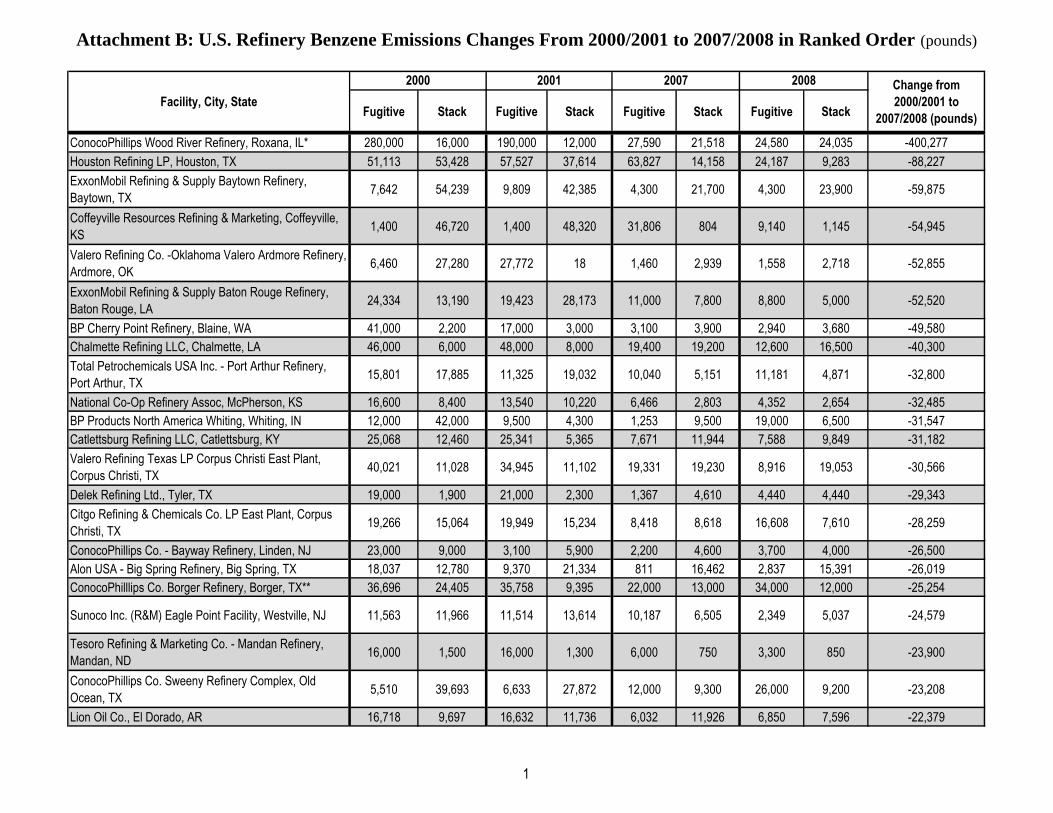
For example, the Conoco Wood River refinery
in Illinois decreased its emissions by 400,277
pounds from 2000/2001 to 2007/2008. See
Table 3 and Attachment B, “U.S. Refinery
Benzene Emissions Changes From 2000/2001
to 2007/2008 in Ranked Order (pounds).” The
reductions at Wood River actually account for
more than half the total reductions in benzene
emissions from all U.S. refineries between
1 U.S. Department of Energy, Office of Oil and Gas, Energy Information Administration, “Petroleum Marketing Annual
2008” (Aug. 2009). 2 This research represents all U.S. refineries identified on EPA’s TRI website, with the exception of several asphalt plants
mislabeled as refineries, terminals and docks with separately reported emissions, plants that reported zero emissions for two
years or more, and plants for which data was not available. 3 See discussion below, entitled “Data Quality Concerns Regarding Benzene Emissions Monitoring and Reporting.”
2
2001/2002 and 2007/2008.4 In addition, Houston Refining LP’s refinery reduced its emissions by
88,227 pounds from 2000/2001 to 2007/2008. These reductions have been driven in part by Clean Air
Act rules that limit emissions of smog-forming chemicals like benzene, as well as enforcement actions
that require new controls for flares, process units, and wastewater treatment systems.
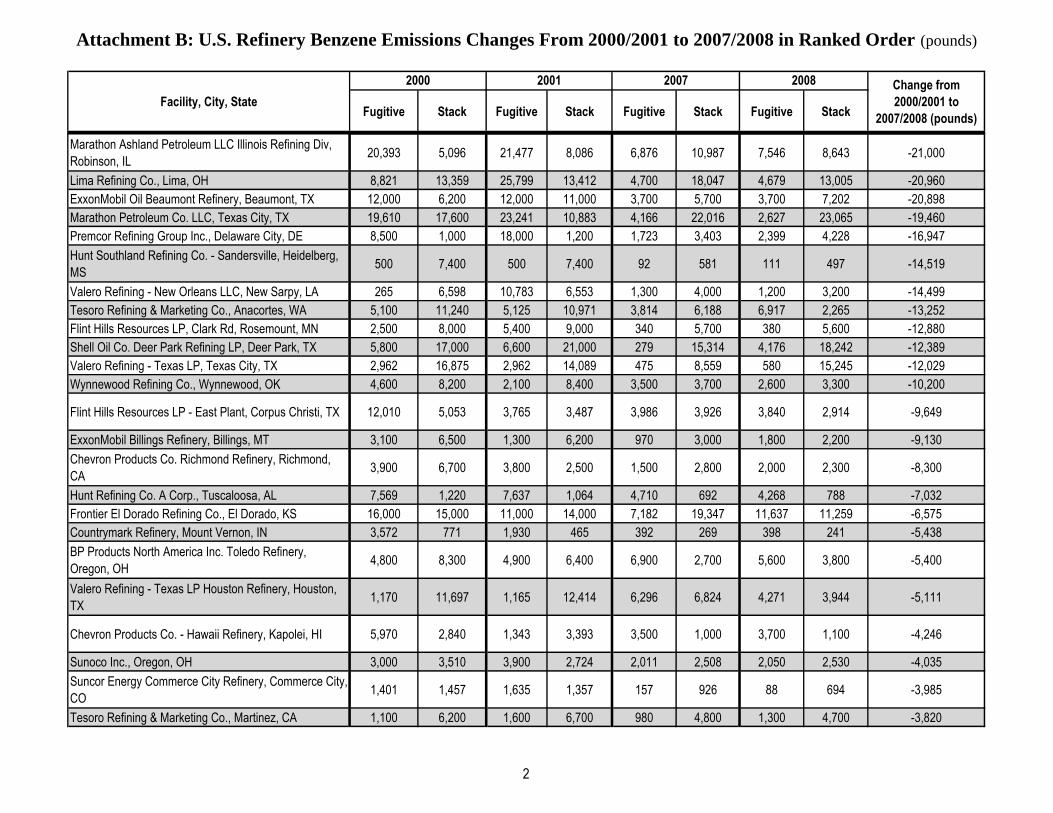
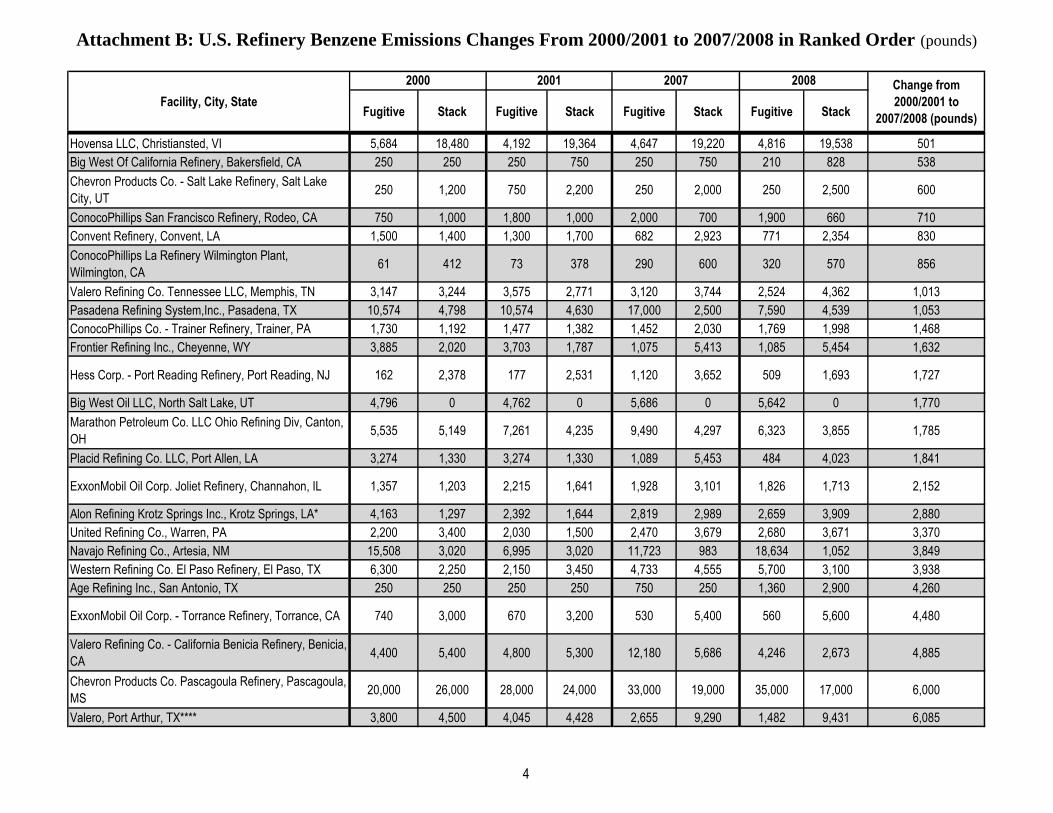
See Attachment B, “U.S. Refinery Benzene Emissions Changes From 2000/2001 to 2007/2008 in Ranked Order (pounds).”
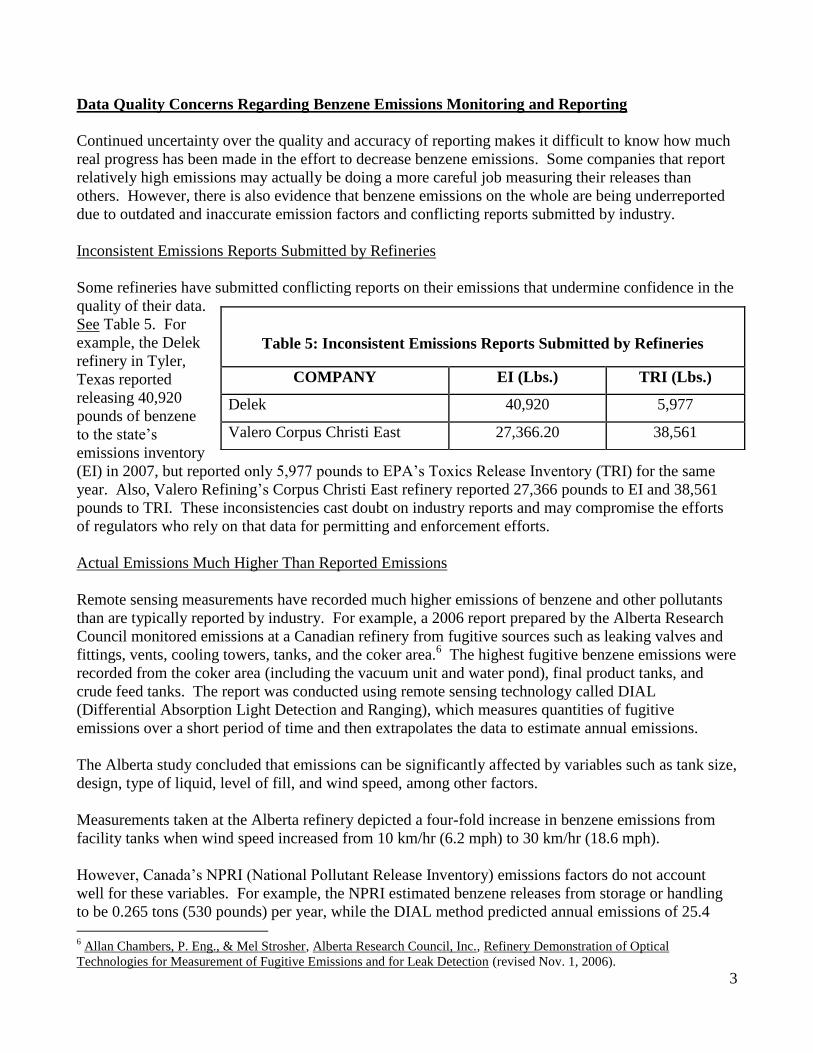
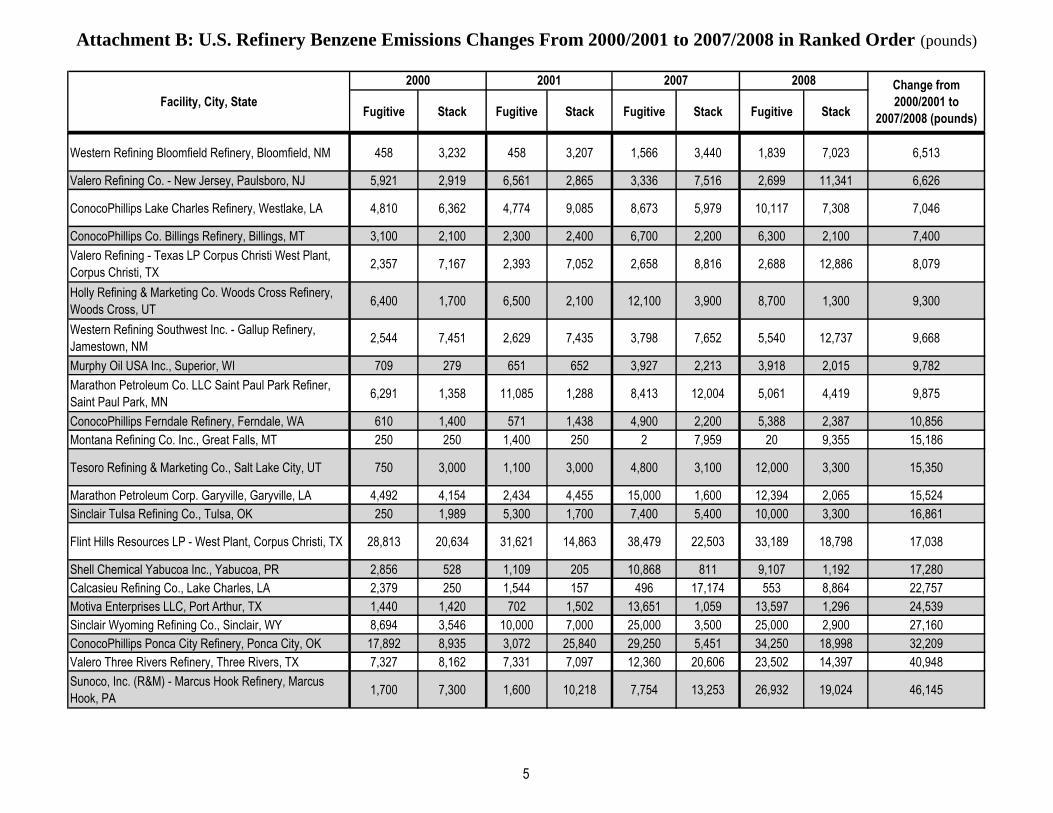
Nevertheless, while overall emissions have declined, reported benzene emissions at some refineries
continue to increase. See Table 4. For example, combined fugitive and stack emissions at Citgo’s
Westlake refinery in Louisiana increased by 129,112 pounds from 2000/2001 to 2007/2008. At BP’s
Texas City refinery, emissions increased by 76,200 pounds from 2000/2001 to 2007/2008. In addition,
Sunoco’s Philadelphia refinery increased emissions by 60,434 pounds from 2000/2001 to 2007/2008.
The increase at Citgo’s Westlake refinery appears to be the result of an accident that leaked 92,578
pounds of benzene in December 2008.5 The leak occurred over a period of less than four hours, and
nearly all of the benzene volatilized into the air.
See Attachment B, “U.S. Refinery Benzene Emissions Changes From 2000/2001 to 2007/2008 in Ranked Order (pounds).”
4 Excluding Wood River, which accounted for 52% of emissions reductions, emissions from all other refineries declined
only 10% since the beginning of the decade. 5 The Westlake refinery is also known as the Lake Charles refinery. Citgo filed a notification report for the unauthorized
discharge on January 6, 2009 with Louisiana environmental authorities, Case No. 08-07877.
3
Data Quality Concerns Regarding Benzene Emissions Monitoring and Reporting
Continued uncertainty over the quality and accuracy of reporting makes it difficult to know how much
real progress has been made in the effort to decrease benzene emissions. Some companies that report
relatively high emissions may actually be doing a more careful job measuring their releases than
others. However, there is also evidence that benzene emissions on the whole are being underreported
due to outdated and inaccurate emission factors and conflicting reports submitted by industry.
Inconsistent Emissions Reports Submitted by Refineries
Some refineries have submitted conflicting reports on their emissions that undermine confidence in the
quality of their data.
See Table 5. For
example, the Delek
refinery in Tyler,
Texas reported
releasing 40,920
pounds of benzene
to the state’s
emissions inventory
(EI) in 2007, but reported only 5,977 pounds to EPA’s Toxics Release Inventory (TRI) for the same
year. Also, Valero Refining’s Corpus Christi East refinery reported 27,366 pounds to EI and 38,561
pounds to TRI. These inconsistencies cast doubt on industry reports and may compromise the efforts
of regulators who rely on that data for permitting and enforcement efforts.
Actual Emissions Much Higher Than Reported Emissions
Remote sensing measurements have recorded much higher emissions of benzene and other pollutants
than are typically reported by industry. For example, a 2006 report prepared by the Alberta Research
Council monitored emissions at a Canadian refinery from fugitive sources such as leaking valves and
fittings, vents, cooling towers, tanks, and the coker area.6 The highest fugitive benzene emissions were
recorded from the coker area (including the vacuum unit and water pond), final product tanks, and
crude feed tanks. The report was conducted using remote sensing technology called DIAL
(Differential Absorption Light Detection and Ranging), which measures quantities of fugitive
emissions over a short period of time and then extrapolates the data to estimate annual emissions.
The Alberta study concluded that emissions can be significantly affected by variables such as tank size,
design, type of liquid, level of fill, and wind speed, among other factors.
Measurements taken at the Alberta refinery depicted a four-fold increase in benzene emissions from
facility tanks when wind speed increased from 10 km/hr (6.2 mph) to 30 km/hr (18.6 mph).
However, Canada’s NPRI (National Pollutant Release Inventory) emissions factors do not account
well for these variables. For example, the NPRI estimated benzene releases from storage or handling
to be 0.265 tons (530 pounds) per year, while the DIAL method predicted annual emissions of 25.4 6 Allan Chambers, P. Eng., & Mel Strosher, Alberta Research Council, Inc., Refinery Demonstration of Optical
Technologies for Measurement of Fugitive Emissions and for Leak Detection (revised Nov. 1, 2006).
Table 5: Inconsistent Emissions Reports Submitted by Refineries
COMPANY EI (Lbs.) TRI (Lbs.)
Delek 40,920 5,977
Valero Corpus Christi East 27,366.20 38,561
4
tons (50,800 pounds) – nearly 100 times that of the NPRI estimates. These results are particularly
significant to Americans because Canada’s NPRI emission factors are based on factors developed
more than 25 years ago by the U.S. EPA that are still used to estimate emissions at U.S. refineries.
Because of DIAL’s greater accuracy, the City of Houston has petitioned EPA use DIAL and other
remote sensing technologies to obtain more accurate data on refinery emissions, and to use the
information to revise or replace the outmoded emission factors upon which EPA and the refinery
industry have relied for decades.
Refineries also frequently underestimate emissions from flares, using EPA approved methodologies
that assume that 98% of the volatile organic compounds (which include benzene) that are released to a
flare are destroyed in the combustion process. But a DIAL remote sensing study performed by the
UK’s National Physical Laboratory and conducted at BP’s Texas City refinery identified a flare with
combustion efficiencies closer to 50%.7 In other words, half the pollutants were being released
directly to the environment instead of being consumed by the flare. That same study found that one
flare released emissions of volatile organic compounds at a rate 25 times higher than the standard
methods used to estimate emissions from this source.
In 2006, a study by Houston-based Industrial Professionals for Clean Air (IPCA) further corroborated
the underestimation of fugitive emissions from flares. The IPCA study concluded that large amounts
of unrecognized emissions were being emitted from facility flare stacks due to a poor understanding of
the effect that variables such as wind speed have on flare combustion benzene reduction. As a result,
regulators and facilities were underestimating the release of benzene and other pollutants coming from
flare stacks.8
According to IPCA, refineries in Texas report flare emissions based on 1983 estimation methods
developed by EPA and the Texas Commission on Environmental Quality that assume flares operate
under ideal weather conditions with maximum wind speeds of 5 miles per hour. But in the real world,
the winds can blow much harder, and combustion inefficiency increases exponentially with crosswinds
at just 10 miles per hour. Chemical compounds must be burned within a flare flame for a certain
period of time in order to break down. The IPCA report points out that crosswinds can cause a flare to
separate from the tip, leading to major increases in emissions during emergency flaring events.
Furthermore, operation variables such as steam input used to balance the flare combustion can be
affected by crosswinds that separate the flare from the burner. Inadequate estimates that do not factor
in these types of variables lead to a significant underreporting of benzene emissions.
Alternative technologies do exist, however. The IPCA’s report recommends replacement of traditional
flares with fuel gas recovery systems that recapture and recycle gases from anticipated facility
emissions. Also, in lieu of the traditional elevated flare, enclosed ground flares, incinerators, and
thermal oxidizers are more combustion efficient and less susceptible to wind.
Other major sources of benzene are not just poorly measured – often they are not measured at all. For
example, refinery coker ponds represent a huge source of unregulated fugitive toxic pollutant
emissions, including benzene, toluene, ethyl benzene, and xylene (BTEX). Coker units used in oil
7 National Physical Laboratory (UK), Measurements of VOC Emissions from Petrochemical Industry Sites in the Houston
Area Using Differential Absorption Lidar (DIAL) for Summer 2007 (unpublished report for Texas CEQ) (Feb. 2008). 8 Robert E. Levy, Lucy Randel, Meg Healy, & Don Weaver, Industrial Professionals for Clean Air, Reducing Emissions
from Plant Flares (revised Apr. 24, 2006).
5
refining are cleaned out with water that is sometimes routed to wastewater settling ponds. Once
discharged into the pond, toxic pollutants can volatilize into the air. A 1991 EPA study identified the
coker pond area as the largest source of unregulated benzene emissions at Amoco’s refinery in
Yorktown, Virginia.9 Despite these shockingly high toxic emissions, EPA has yet to set standards of
performance to control emissions from the coker pond area.
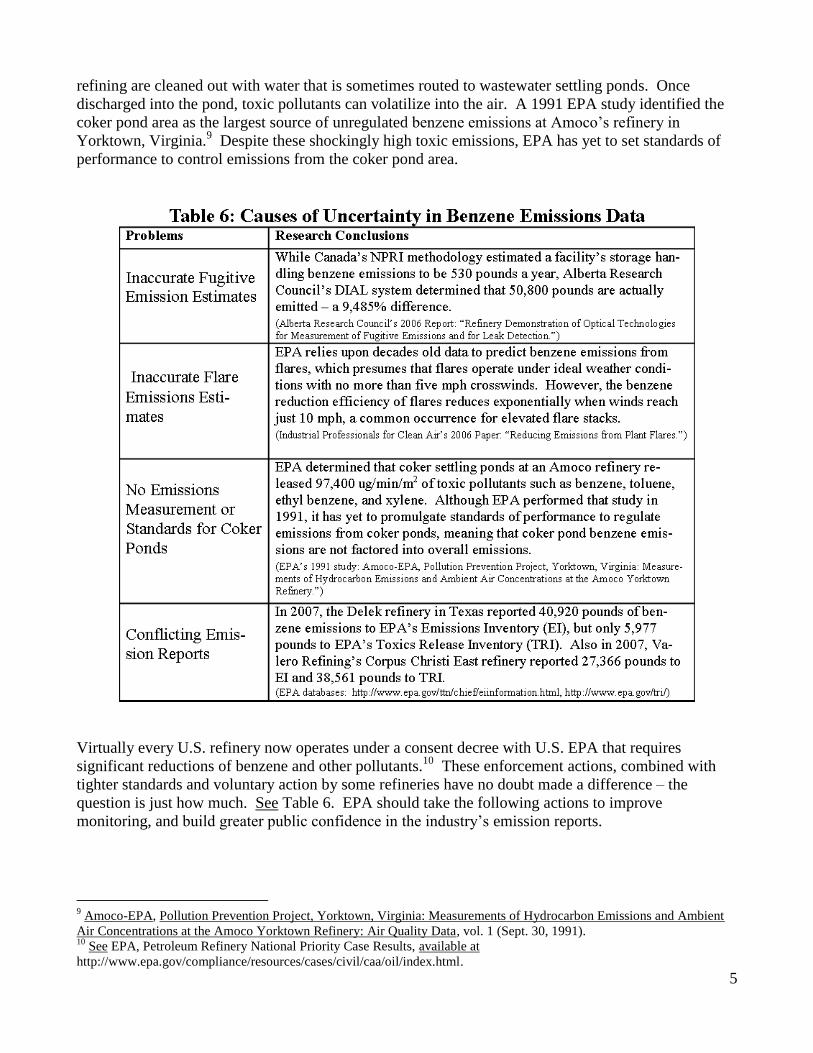
Virtually every U.S. refinery now operates under a consent decree with U.S. EPA that requires
significant reductions of benzene and other pollutants.10
These enforcement actions, combined with
tighter standards and voluntary action by some refineries have no doubt made a difference – the
question is just how much. See Table 6. EPA should take the following actions to improve
monitoring, and build greater public confidence in the industry’s emission reports.
9 Amoco-EPA, Pollution Prevention Project, Yorktown, Virginia: Measurements of Hydrocarbon Emissions and Ambient
Air Concentrations at the Amoco Yorktown Refinery: Air Quality Data, vol. 1 (Sept. 30, 1991). 10
See EPA, Petroleum Refinery National Priority Case Results, available at
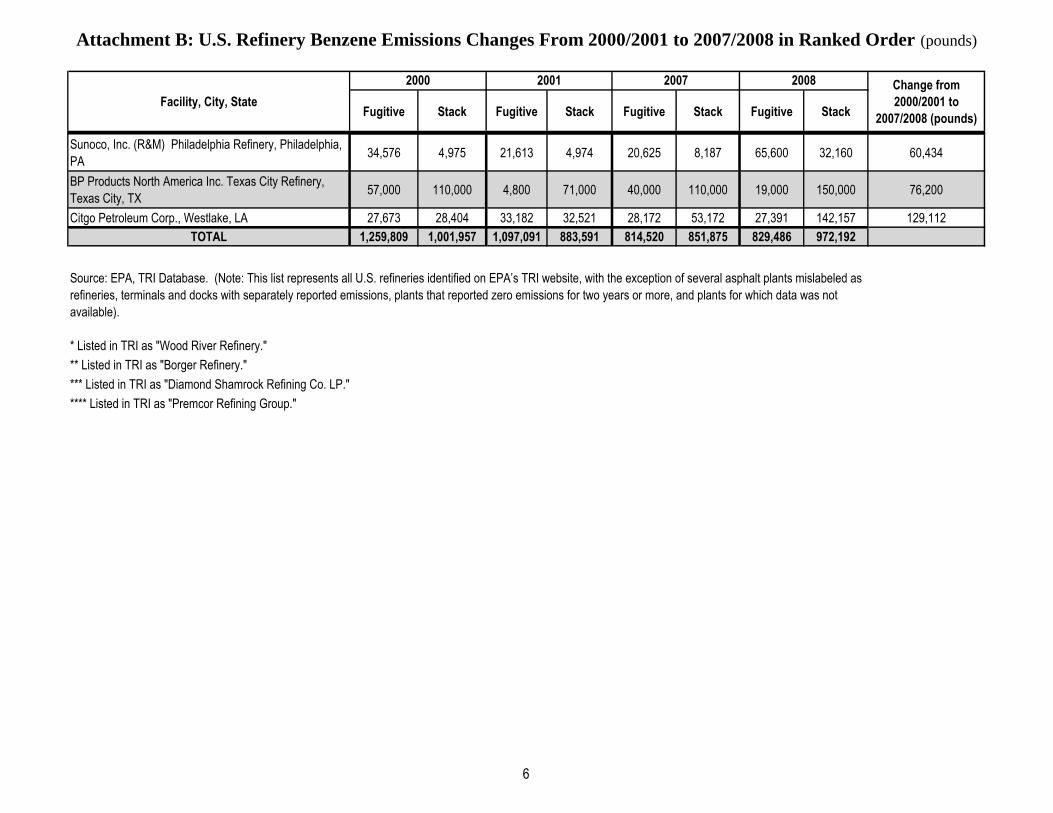
TOTAL 1,259,809 1,001,957 1,097,091 883,591 814,520 851,875 829,486 972,192
* Listed in TRI as "Wood River Refinery."
** Listed in TRI as "Borger Refinery."
*** Listed in TRI as "Diamond Shamrock Refining Co. LP."
**** Listed in TRI as "Premcor Refining Group."
Source: EPA, TRI Database. (Note: This list represents all U.S. refineries identified on EPA’s TRI website, with the exception of several asphalt plants mislabeled as
refineries, terminals and docks with separately reported emissions, plants that reported zero emissions for two years or more, and plants for which data was not
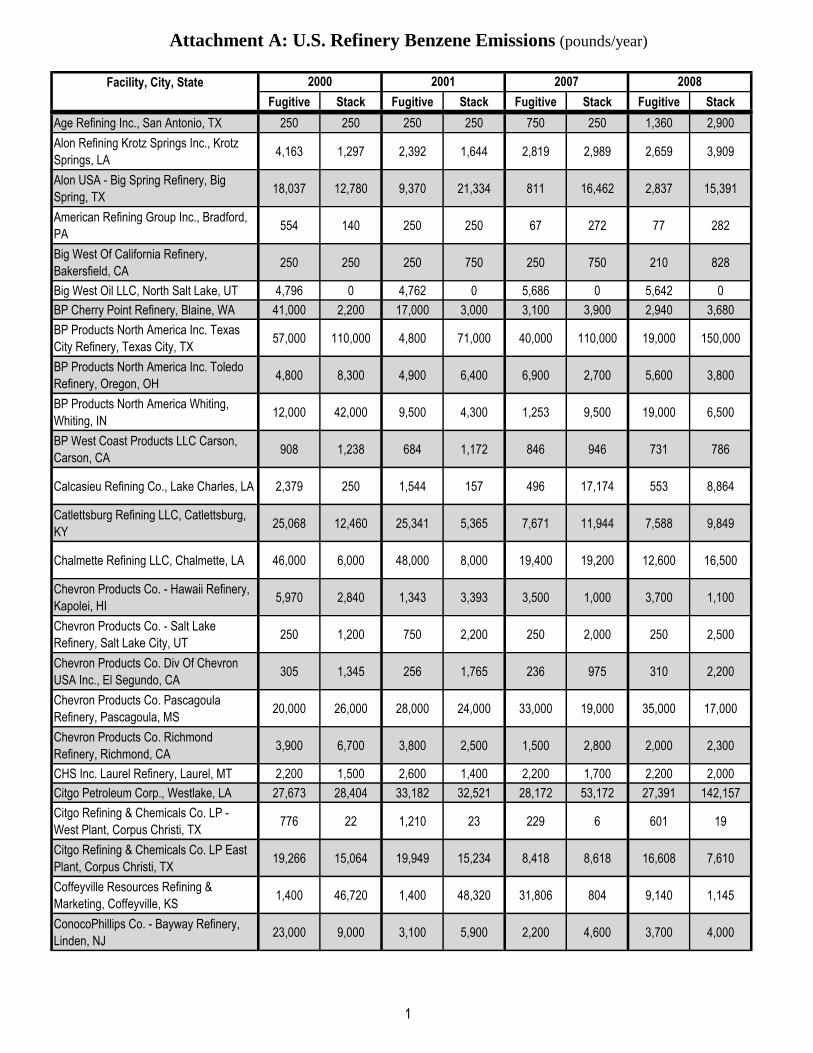
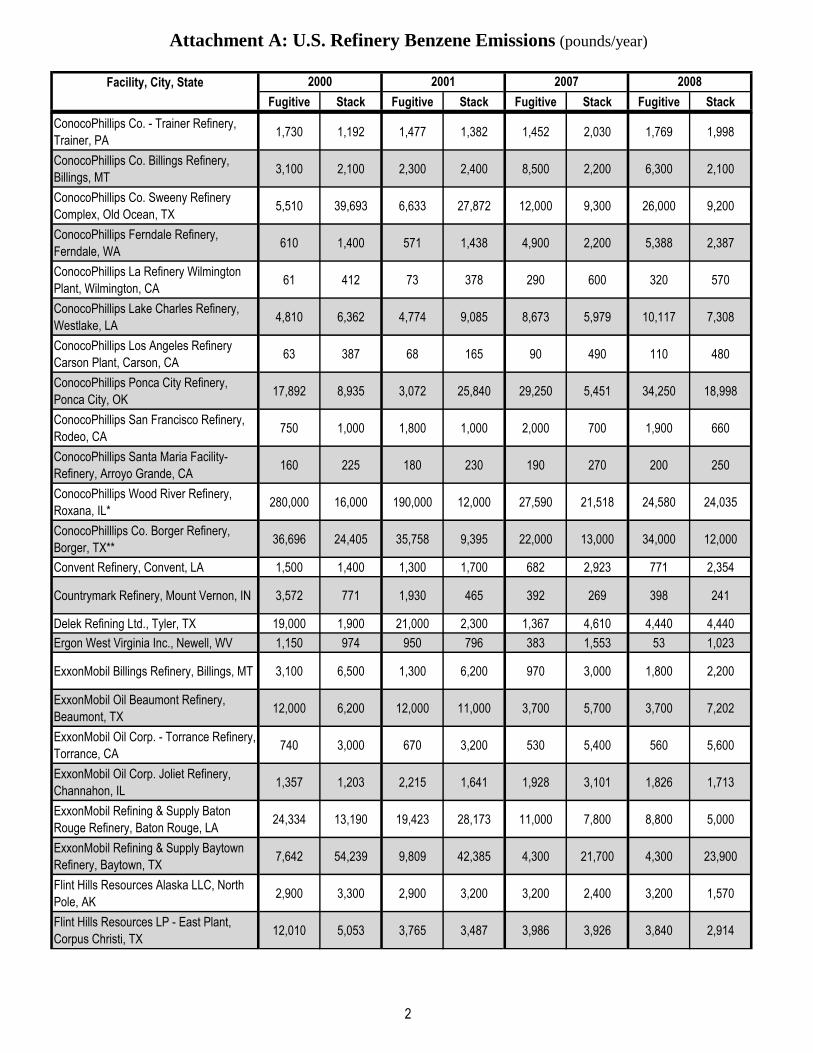
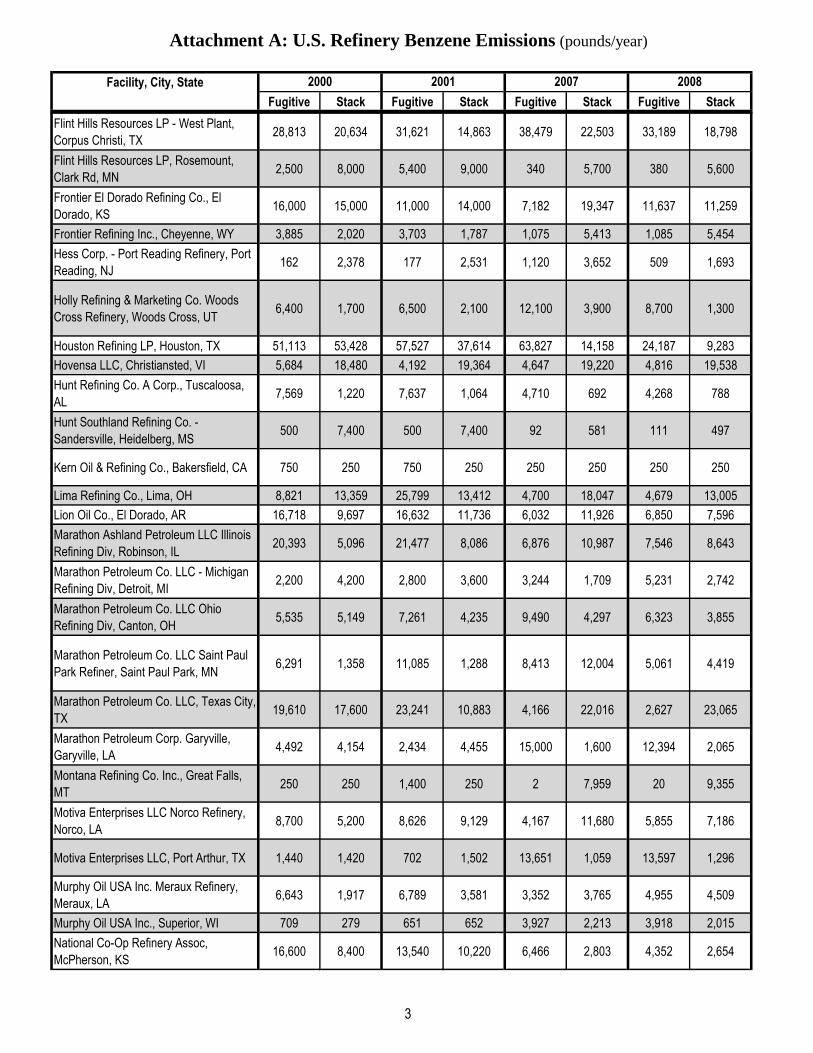
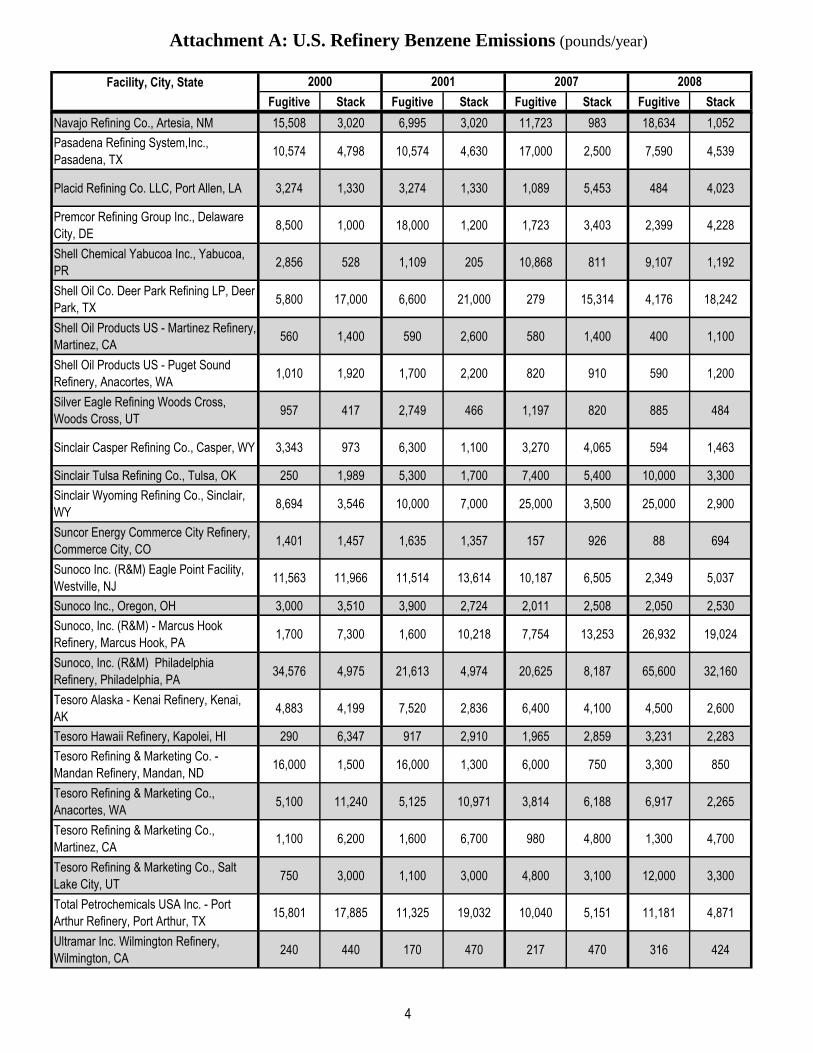
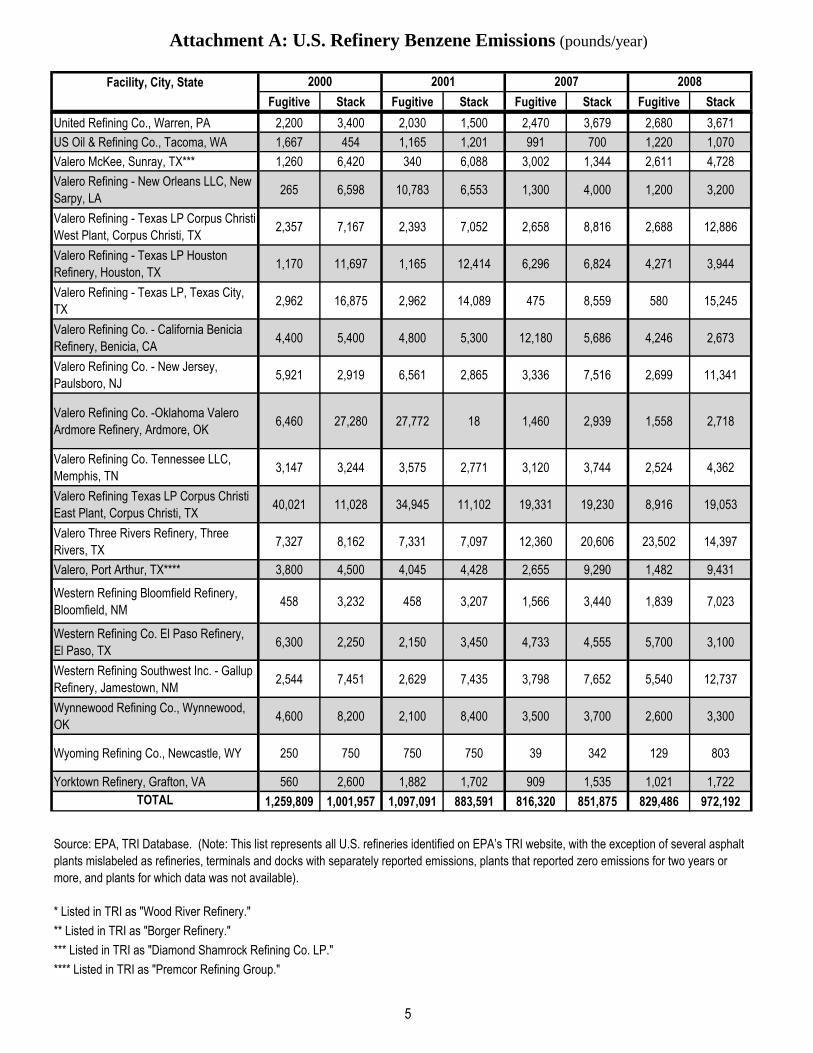


![Benzene Management in Refinery Gasoline Pool R 12 16.pdfBenzene Management in Refinery Gasoline Pool ... [6,7]. The UOP BenSat process is used for light fraction ... Toluene split](https://static.documents.pub/doc/80x56/5ab738e87f8b9a6e1c8e99e1/benzene-management-in-refinery-gasoline-r-12-16pdfbenzene-management-in-refinery.jpg)


