28
U.S. Residential Mortgage Market Update Housing fundamentals improved but headwinds remain Deloitte Center for Financial Services June 2013

U.S. Residential Mortgage Market Update Housing fundamentals improved but headwinds remain
Deloitte Center for Financial Services
June 2013

After years of excess inventory and depressed prices, the housing market showed signs of turning a corner last quarter.
Strong buyer demand amidst a limited supply of homes for sale resulted in properties selling faster and at the highest prices since 2009. These market conditions, including low interest rates, have driven growth in housing starts and demand for prime mortgages.
Despite general improvement in market conditions, we note some important developments for lenders and investors. Originations are expected to decline into 2014, as an increase in purchase loans is not expected to be enough to offset a steep decline in refinancings. Asset quality has improved, but delinquencies remain well above the historic norm.
While non-agency residential mortgage-backed securities (RMBS) are showing signs of new life in 2013, the government-sponsored enterprises (GSEs) continue to dominate the securitization market.
Looking ahead, lenders will likely continue to strive for operational efficiency and cost reduction in a challenging origination market while working to be compliant with the many regulatory changes, including the ability-to-repay rule and new servicing standards. The expected release of the qualified residential mortgage rule, which will govern securitizations and risk retention, will be another important development for the market.
We hope you find this U.S. Residential Mortgage Market Update helpful in keeping track of the evolving housing recovery, and we welcome your feedback.
Drew TyriePrincipalDeloitte Consulting LLP
Jim EckenrodeExecutive DirectorDeloitte Center for Financial ServicesDeloitte Services LP
Previous Next
Foreword

3 U.S. Residential Mortgage Market Update
Previous Next
Housing market fundamentalsThe market has shifted in favor of sellers, following years of weak buyer demand.
Inventory of homes for sale remained low, causing buyers to get more competitive over potential purchases. Homes are selling faster and at higher prices, a stark contrast to the abundant inventory and depressed prices of previous years.
While limited supply has sparked housing starts, higher material costs were a headwind to new construction.
•Low inventory slowed sales: New home sales increased in April but remained 0.9% below January’s peak.1
•Prices rose: In March, 86% of realtors reported constant or higher prices from the previous year, the highest share reported in recent years.2
•Housing starts rose: In 1Q 2013, annualized housing starts surpassed the one million mark for the first time since 2008,3 yet high material costs were a headwind.4
Credit conditionsCredit conditions improved on higher prime mortgage demand.
Households’ balance sheets continued to improve as demand for prime mortgages increased in recent quarters.
As discussed in this section, purchase loans are set to increase over the coming year but not enough to offset a steep expected drop in refinancings.
•Households improved their balance sheets: Households continued to improve their financial footing, using refinancings to lower mortgage balances. Additionally, homeowners’ equity rose 25% or $1.6 trillion from 2011 to 2012.5
•Demand for prime mortgages rose: Borrower demand for prime mortgages increased for the seventh consecutive quarter, while demand for nontraditional mortgages was flat.6
•Originations expected to fall: Refinancings, which accounted for over three-fourths of originations in 4Q 2012, are expected to fall 70% from 1Q 2013 to 1Q 2014, deeply depressing origination volumes in the quarters ahead.7
1 Census Bureau, April 20132 National Association of Realtors 3 Census Bureau 4 National Association of Realtors 5 Federal Reserve, Flow of Funds 6 Federal Reserve, Senior Loan
Officer Survey7 Mortgage Bankers Association
Executive summary

4 U.S. Residential Mortgage Market Update
Previous Next
Asset performanceAsset performance showed signs of slow improvement in early 2013, yet there is much progress to be made before performance reaches historic norms.
•Delinquencies declined: 6.8% of mortgages were delinquent in February 2013, an improvement from January but well above the 1995-2005 average of 4.3%.8
•Modifications decreased: 238,019 mortgages were modified in February 2013, a 3.7% decline from January.9
•Foreclosure starts declined: Foreclosure starts declined 10.7% from January to February to total 131,826. The fact that February has fewer days than January may be a contributing factor to the decline.10
Regulatory news: QRM on the horizon Lenders, servicers, and investors gained some regulatory clarity in January with the release of numerous rules from the Consumer Financial Protection Bureau, most importantly (1) the ability-to-repay rule/qualified mortgage (QM) definition, which governs originations, and (2) servicing standards.
The market may likely gain additional regulatory certainty in the coming months with the release of the qualified residential mortgage rule (QRM) – a rule that will govern securitizations and risk retention.
Changes to origination, documentation, and record keeping processes are expected as a result of these rules.
Read Deloitte’s full analysis of the ability-to-repay rule here.
8 LPS Applied Analytics9 HOPE Now10 LPS Applied Analytics
As used in this document, “Deloitte” means Deloitte & Touche LLP, Deloitte Tax LLP, Deloitte Financial Advisory Services LLP, and Deloitte Consulting LLP, which are separate subsidiaries of Deloitte LLP. Please see www.deloitte.com/us/about for a detailed description of the legal structure of Deloitte LLP and its subsidiaries Certain services may not be available to attest clients under the rules and regulations of public accounting

5 U.S. Residential Mortgage Market Update
Previous Next
Metric [period analyzed] Trend
This period
Last period
Date range high
Date range low
Date range average
Mac
roec
onom
ics
Unemployment rate (%)11 [January 2009 – March 2013] 7.60% 7.70%
10.0% (October 2009)
7.6% (March 2013)
8.9%
10-year treasury yield (%)12 [1Q09 – 1Q13] 2.0% 1.7%
3.7% (1Q10)
1.6% (3Q12)
2.7%
Consumer price index (12 month % change)13
[January 2009 – March 2013] 1.5% 2.0% 3.9%
(September 2011)-2.0%
(July 2009)1.6%
Mortgage industry employment (Annual, in thousands)14
[2000 – 2013] 288.9 272.9496.3 (2006)
265.1 (2011)
352.1
Hou
sing
mar
ket
Total housing sales (‘000)15
[1Q06 – 1Q13] 5,361 5,2797,914 (1Q06)
4,157 (3Q10)
5,258
Inventory of existing homes (Months of supply)16
[January 2011 – April 2013] 5.2 4.79.5
(July 2011)4.3
(January 2013)6.7
Inventory of new single-family homes (Months of supply)17
[January 2011 – April 2013] 4.1 4.18.1
(February 2011)3.9
(January 2013)5.4
Housing starts (‘000)18 [1Q06 – 1Q13] 968 904
2,120 (1Q06)
526 (1Q09)
942
S&P Case-Shiller Index (Composite 20)19
[April 2003 – February 2013] 149.80 147.97206.65
(April 2006)136.86
(January 2012)163.98
Cre
dit
cond
itio
ns
Mortgage originations (Quarterly, $ billions)20 [1Q06 – 4Q12] 511 471
712 (2Q06)
278 (4Q08)
453
30-year conventional mortgage rate (%)21 [April 1971 – April 2013] 3.35% 3.57%
18.45% (October 1981)
3.31% (November 2012)
8.63%
RMBS issuance (Annual, in $ billions)22
[1996 – 2012] 1,730 1,2412,481 (2003)
408 (1997)
1,311
Agency share of RMBS issuance (Annual, in %)23
[1996 – 2012] 99.80% 99.78%99.80% (2012)
55.99% (2006)
85.05%
Ass
et
perf
orm
ance
Bankruptcies (Thousands)24
[1Q09 – 4Q12] 272.3 273.9422.1 (2Q10)
272.3 (1Q13)
351.0
Delinquencies (%)25
[May 2010 – February 2013] 6.80% 7.03%9.74%
(May 2010)6.80%
(February 2013)7.94%
Foreclosure starts (Thousands)26
[May 2010 – February 2013] 131.9 147.6282.5
(August 2010)130.1
(November 2012)207.4
Housing market scoreboard
11 Bureau of Labor Statistics12 Federal Reserve13 Bureau of Labor Statistics 14 U.S. Census Bureau 15 National Association of Realtors 16 Ibid 17 U.S. Census Bureau 18 Ibid 19 Standard & Poor’s 20 Mortgage Bankers Association 21 Federal Reserve 22 Securities Industry and Financial
Markets Association 23 Ibid24 United States Courts 25 LPS Applied Analytics 26 Ibid

Housing inventories were cut in half over the past two years as rising demand consumed supply
Homes sold 39% faster at the highest prices since 2009
Housing starts rose 35% over the year, but material costs were a constraint
Housing market developments – 1Q 2013
Continued

7 U.S. Residential Mortgage Market Update
NextPrevious
Houses sold 39% faster than in 2011 as buyer demand exceeded limited supply
The median time for properties to sell has fallen 39%, from 101 days on the market in September 2011 to 62 days in March 2013. After years of excess inventory and price compression, buyers now face very tight inventory and must move fast on potential purchases.
Days on the market declined reflecting strong demand
Source: National Association of Realtors, REALTORS Confidence Index, March 21, 2013
Are investors and foreign buyers driving demand? Increased buyer demand has been broadly noted, leaving many wondering where the demand is coming from and if it is sustainable.
One may suspect an increase in demand from investors or foreign buyers is behind the market recovery, but a close look at the data tells a different story.
Primary buyers remain the dominant force in the market, though investors are present in areas that have a high concentration of distressed properties.
The increase in demand was not accompanied by a change in buyer demographics. For instance, in March 2013:27
• Investors accounted for 19% of sales—within the range since 2010.
• International buyers accounted for only 2.3% of sales—on par with the trend since late 2010.
•30% of sales were to first-time buyers—unchanged since late 2010.
Pent-up demand among primary buyers is likely driving the recent increase in demand. Looking forward, sustain-ability may depend on the economic recovery.
0
20
40
60
80
100
May-11 Sep-11 Jan-12 May-12 Sep-12 Jan-13
101
62
Med
ian
num
ber
of
day
s ho
uses
wer
e o
n th
e m
arke
t
27 National Association of Realtors, REALTORS Confidence Index, March 21, 2013

8 U.S. Residential Mortgage Market Update
NextPrevious
Low inventory restrained sales; the number of available homes remained low
Low inventory has restrained new and existing home sales in recent months. In April, sales of new single-family houses rose 2.3% from the previous month, but were down 0.9% from the high in January. Existing home sales rose 0.6% from the previous month. Supply remained very low. However, in April, 30% of homeowners said they felt it was a good time to sell, double the share from the previous year, indicating some supply relief soon.28
New single-family home sales Existing home sales
Note: Home sales are at seasonally adjusted annual rate (SAAR)Source: Census Bureau, April 2013
Note: Home sales are at SAARSource: National Association of Realtors, April 2013
0
1
2
3
4
5
6
7
8
9
10
1,000
0
2,000
3,000
4,000
5,000
6,000
Jan-
11
Mar
-11
May
-11
Jul-1
1
Sep-
11
No
v-11
Jan-
12
Mar
-12
May
-12
Jul-1
2
Sep-
12
No
v-12
Jan-
13
Mar
-13
Existing home sales
Mo
nthso
fsup
plyTho
usan
ds
of
unit
s
Months of supply
28 Fannie Mae, Monthly National Housing Survey, April 2013
0
1
2
3
4
5
6
7
8
9
0
50
100
150
200
250
300
350
400
450
500
Jan-
11
Mar
-11
May
-11
Jul-1
1
Sep-
11
No
v-11
Jan-
12
Mar
-12
May
-12
Jul-1
2
Sep-
12
No
v-12
Jan-
13
Mar
-13
New single-family home sales Months of supply
Mo
nthso
fsup
plyTho
usan
ds
of
unit
s

9 U.S. Residential Mortgage Market Update
NextPrevious
Home prices rose on tight supply and high demand
Home prices continued to rise through February 2013 according to both the Case-Shiller29 10-City Index and the Federal Housing Finance Agency (FHFA) Home Price Index. The Case-Shiller and FHFA indices are at their highest points since April 2009 and September 2010, respectively. The National Association of Realtors reported that 86% of realtors saw constant or higher prices in March 2013, a trend that has been gaining strength over the past year.
Home prices rose on tight supply and high demand Percent of realtors reporting constant or higher prices compared to the previous year
0.5
1
1.5
2
2.5
3
1991 1993 1995 1997 1999 2001 2003 2005 2007 2009 2011 2013
Ind
exed
val
ues
Case Shiller 10-City Index FHFA Home Price Index
54%58%
62% 64% 64%69% 71% 73% 73%
79%83% 83%
86%
0%
10%
20%
30%
40%
50%
60%
70%
80%
90%
100%
Mar
-12
Apr
-12
May
-12
Jun-
12
Jul-1
2
Aug
-12
Sep-
12
Oct
-12
Nov
-12
Dec
-12
Jan-
13
Feb-
13
Mar
-13
Source: Standard & Poor’s, February 2013 data released April 30, 2013; Federal Housing Finance Agency, House Price Index, February 2013 data released April 23, 2013 Source: National Association of Realtors, REALTORS Confidence Index, March 2013
29 S&P Case-Shiller Home Price Index (see “Source notes” for index characteristics)

10 U.S. Residential Mortgage Market Update
NextPrevious
The jump in housing starts was mainly driven by a surge in multifamily construction
In the first quarter, builders responded to tight housing supply by pushing housing starts above the one million mark for the first time since June 2008. Total housing starts were up 35% from one year ago. Multifamily starts rose 9.1% to an annual rate of 340,000 units, the highest level since 2Q 2008. Housing starts slowed in April, likely due to inclement weather, but permits rose indicating more construction later in the second quarter. As new supply hits the market, particularly in the multifamily sector, it may put downward pressure on housing prices.
Housing starts by quarter (seasonally adjusted)
Source: U.S. Census Bureau, New Residential Construction, Published: April 16, 2013
17
43
15
11
13
91
12
50
11
74
11
53
978
839
742
669
586
468
356 426 502
486 526
489
431 440
418
422
424 473 48
7
51
6
54
5
59
2
628
378
344312
320288 298
311
327322 341
276195
312 340
0
500
1,000
1,500
2,000
2,500
1Q06
2Q06
3Q06
4Q06
1Q07
2Q07
3Q07
4Q07
1Q08
2Q08
3Q08
4Q08
1Q09
2Q09
3Q09
4Q09
1Q10
2Q10
3Q10
4Q10
1Q11
2Q11
3Q11
4Q11
1Q12
2Q12
3Q12
4Q12
1Q13
Single-family units Two or more units
Seas
ona
lly a
dju
sted
ann
ualr
ate
(‘000
)
169 10986 82 92 113 149 103 165 151
205 227 220 229190
Multifamily units made up 35% of housing starts in 1Q 2013, up from an average 19% in 2006.

11 U.S. Residential Mortgage Market Update
NextPrevious
High lumber prices put pressure on housing starts
A spike in lumber prices is one factor restraining home building. In addition to rising housing starts, increasing international lumber demand and global lumber shortages following insect epidemics have driven prices steeply higher over the past year. Apart from lumber and material costs, homebuilders cited difficulty in obtaining construction credit and mortgage lending rules as other factors limiting housing supply.30
Lumber prices jump on rising demand and global supply issues
Source: National Association of Home Builders and U.S. Census Bureau Data through May 3, 2013
0
0.2
0.4
0.6
0.8
1
1.2
1.4
2004 2005 2006 2007 2008 2009 2010 2011 2012 2013
Framing lumber prices per 1,000 board feet Total housing starts
Gap =1 Rising
globallumberdemand
2 Lumbersupplyshortages
Ind
exed
val
ues
30 International Wood Markets Group, “North American Lumber Prices Forecast to Soar in 2013 and Reach Record Highs in 2014”

Continued
Credit conditions – 1Q 2013Prime mortgage demand increased; lenders eased borrowing standards
Originations expected to fall 48% from 1Q 2013 to 1Q 2014, driven by steep decline in refinancings
Non-agency residential mortgage-backed securities (RMBS) issuance expected to reach $20 billion in 2013, up from $6 billion in 2012

13 U.S. Residential Mortgage Market Update
NextPrevious
Loan officers reported increased demand for prime mortgages
Loan officers reported stronger demand for prime mortgages for the seventh consecutive quarter.31 Loan officers reported no change in the demand for nontraditional mortgages. The ability-to-repay rule/qualified mortgage (QM) definition released in January may likely limit the origination of nontraditional mortgages.32 The upcoming qualified residential mortgage (QRM) rule, which will govern securitizations and risk retention, may also impact lenders’ origination decisions.
Net percentage of lenders reporting stronger demand for residential mortgage loans
31 The survey defines “prime” mortgages as loans to borrowers with strong credit histories, high credit scores, and low debt-to-income ratios. “Nontraditional” mortgages include loans with limited income verification, mortgages secured by non-owner-occupied properties, interest-only mortgages, and loans with multiple payment options. Subprime mortgages are not shown because of incomplete survey data
32 Deloitte, “First look: Implications of the ability-to-repay rule and the qualified mortgage definition” Published: January 2013
Source: The Federal Reserve Board, Senior Loan Officer Opinion Survey on Bank Lending Practices, Published: April 2013
Wea
ker
dem
and
Stro
nger
dem
and
-80
-60
-40
-20
20
40
60
2007 2008 2009 2010 2011 2012 2013
Net
per
cent
age
rep
orti
ngst
rong
erd
eman
d
0
Prime mortgages Nontraditional mortgages

14 U.S. Residential Mortgage Market Update
NextPrevious
Lenders reported a slight easing in loan standards for prime mortgages
On net, loan officers indicated that borrowing standards for prime mortgages eased slightly in early 2013.33 Standards for nontraditional mortgages were unchanged. Despite the slight easing for prime mortgages, standards today remain tight as lenders prepare to adjust to new origination regulations, particularly the ability-to-repay rule and qualified mortgage (QM) definition.34 The rule shifts originations away from nontraditional mortgages and may result in tighter underwriting requirements for even some prime loans.
Net percentage of lenders reporting tighter standards for residential mortgage loans
Source: The Federal Reserve Board, Senior Loan Officer Opinion Survey on Bank Lending Practices, Published: April 2013
33 The survey defines “prime” mortgage as loans to borrowers with strong credit histories, high credit scores, and low debt-to-income ratios. “Nontraditional” mortgages include loans with limited income verification, mortgages secured by non-owner-occupied properties, interest-only mortgages, and loans with multiple payment options. Subprime mortgages are not shown because of incomplete survey data
34 Deloitte,“First look: Implications of the ability-to-repay rule and the qualified mortgage definition” Published: January 2013
-20
0
20
40
60
80
100
2007 2008 2009 2010 2011 2012 2013
Zero indicates nochange in loan
standards
Prime mortgages
Easing loanstandards
Tightening loanstandards
Net
per
cent
age
of
resp
ond
ents
rep
orti
ngti
ght
erlo
anst
and
ards
Nontraditional mortgages

15 U.S. Residential Mortgage Market Update
NextPrevious
Rates remain near historic lows
The Federal Reserve’s ongoing support of the mortgage market has held rates near historic lows. Despite a slight uptick in 1Q 2013, rates trended lower in April, and at 3.35% are now near the record low rate for a 30-year mortgage of 3.31% reached in November 2012.
30-year conventional mortgage rate
Source: Freddie Mac via the Federal Reserve Bank of St. LouisMonthly data through May 3, 2013
0%
2%
4%
6%
8%
10%
12%
14%
16%
18%
20%
1972 1976 1980 1984 1988 1992 1996 2000 2004 2008 2012
Perc
ent
18.45%
3.35%

16 U.S. Residential Mortgage Market Update
Originations are expected to decline from an expected 70% drop in refinancings; purchase loans may rise
Over the next year, originations are expected to be cut in half, falling from $511 billion in 4Q 2012 to $251 billion in 1Q 2014. The decline is driven by an expected 70% drop in refinance volumes. As refinancings accounted for three-fourths of total originations in recent quarters, lenders will likely be impacted by declining volumes. Increased housing demand will likely increase purchase loans but not enough to offset the steep decline in refinancings. Early signs of declining origination revenue were evident in 1Q 2013 earnings reports.
Mortgage originations (one-to-four family)
Source: Mortgage Bankers Association, Mortgage Finance Forecast, Published: April 18, 2013
NextPrevious
303
406
375
311
269 3
51
311
230
181 2
64
234
175
117 1
90 211
182
120 147
104
102 106 110
108
80 119 132
129
123 125 163
160
144 146
291
306
250
265 357
337
245
230
272
264
126
103 2
73
404
280
338
222 2
20
297 3
60
196
180 201 281 2
54 263 3
42 388
357 289
136
104 105
$0
$100
$200
$300
$400
$500
$600
$700
$800
1Q06
2Q06
3Q06
4Q06
1Q07
2Q07
3Q07
4Q07
1Q08
2Q08
3Q08
4Q08
1Q09
2Q09
3Q09
4Q09
1Q10
2Q10
3Q10
4Q10
1Q11
2Q11
3Q11
4Q11
1Q12
2Q12
3Q12
4Q12
1Q13
2Q13
3Q13
4Q13
1Q14
$ B
illio
ns
74%
42%
Forecast
Purchase Refinance
Refinanceshare

17 U.S. Residential Mortgage Market Update
Households are reducing mortgage debt and withdrawing less home equity
Twenty-nine percent of homeowners who refinanced brought cash to the table to lower their mortgage balance. Additionally, equity withdrawn as cash during refinancings remained low at $8.1 billion in 4Q 2012, despite a $1.6 trillion (25%) increase in home equity over the past year.35 Cash withdrawals peaked in 2Q 2006 at $84 billion. Taken together, these are signs that households are actively reducing debt, preserving the equity in their houses and improving their financial footing.
Refinancings resulted in lower loan balances; equity withdrawals remained low
Source: Freddie Mac Refinance Report, 4Q 2012 data 35 Federal Reserve, Flow of Funds,
data through 4Q 2012 released March 7, 2013
NextPrevious
0%
5%
10%
15%
20%
25%
30%
35%
40%
$0
$10
$20
$30
$40
$50
$60
$70
$80
$90
2000 2001 2002 2003 2004 2005 2006 2007 2008 2009 2010 2011 2012
Total home equity cashed outduring refinance (left axis)
Share of refinances resulting in lowerloan amount – four-quarter average (right axis)
Tota
l ho
me
equi
ty c
ashe
d o
ut d
urin
g r
efin
ance
($ in
bill
ions
)
Share of refinancing
s resulting in lo
wer
loan am
ount
$84
$8
29%
18 U.S. Residential Mortgage Market Update
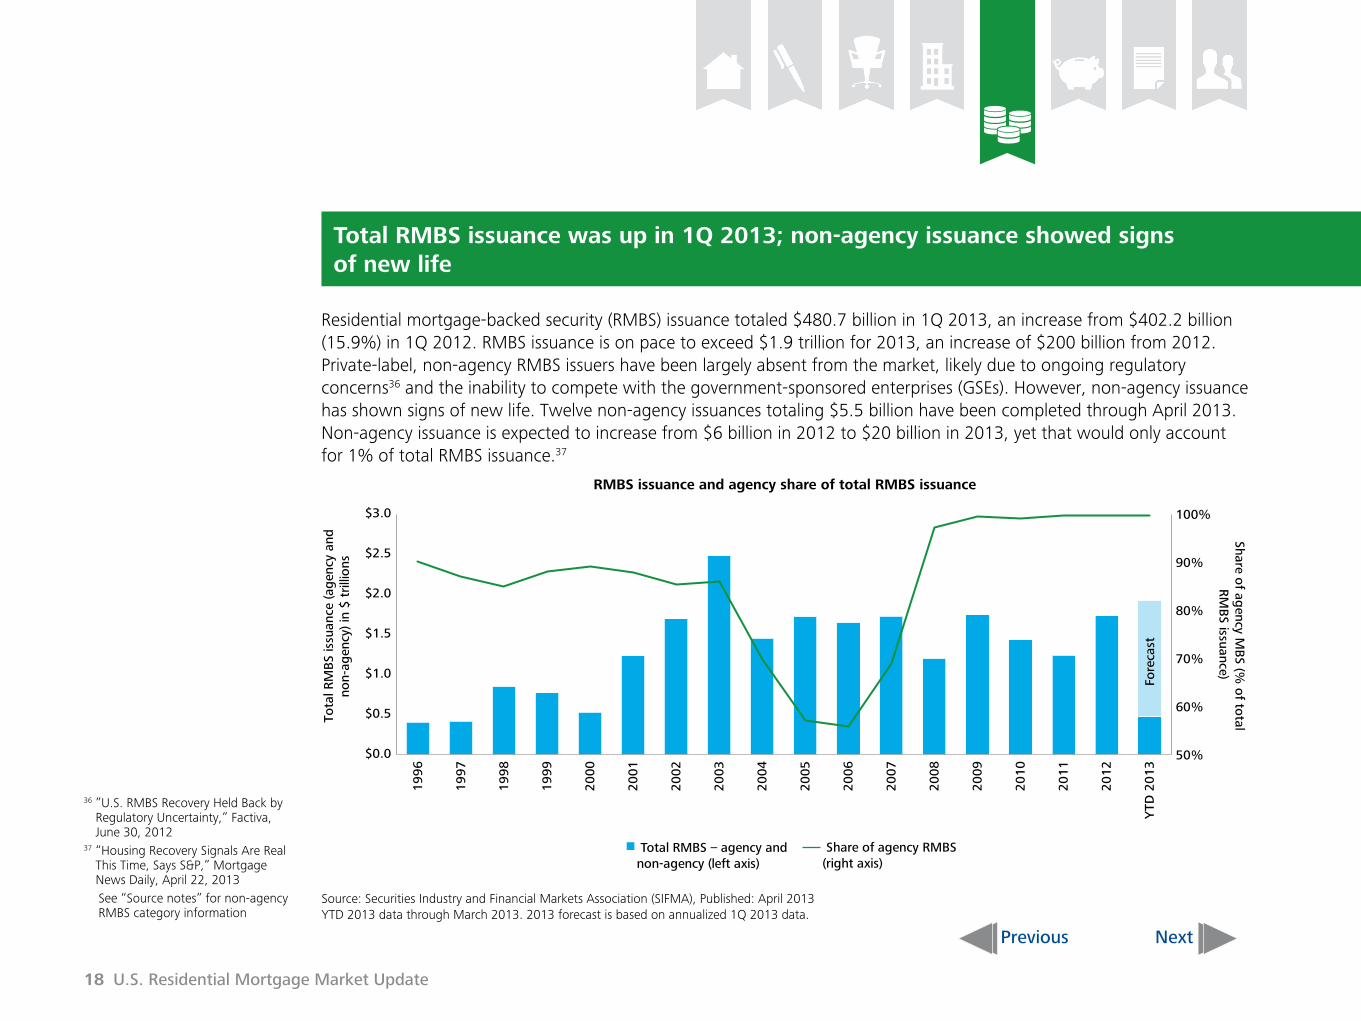
Total RMBS issuance was up in 1Q 2013; non-agency issuance showed signs of new life
Residential mortgage-backed security (RMBS) issuance totaled $480.7 billion in 1Q 2013, an increase from $402.2 billion (15.9%) in 1Q 2012. RMBS issuance is on pace to exceed $1.9 trillion for 2013, an increase of $200 billion from 2012. Private-label, non-agency RMBS issuers have been largely absent from the market, likely due to ongoing regulatory concerns36 and the inability to compete with the government-sponsored enterprises (GSEs). However, non-agency issuance has shown signs of new life. Twelve non-agency issuances totaling $5.5 billion have been completed through April 2013. Non-agency issuance is expected to increase from $6 billion in 2012 to $20 billion in 2013, yet that would only account for 1% of total RMBS issuance.37
RMBS issuance and agency share of total RMBS issuance
Source: Securities Industry and Financial Markets Association (SIFMA), Published: April 2013 YTD 2013 data through March 2013. 2013 forecast is based on annualized 1Q 2013 data.
36 ”U.S. RMBS Recovery Held Back by Regulatory Uncertainty,” Factiva, June 30, 2012
37 “Housing Recovery Signals Are Real This Time, Says S&P,” Mortgage News Daily, April 22, 2013
See “Source notes” for non-agency RMBS category information
NextPrevious
50%
60%
70%
80%
90%
100%
$0.0
$0.5
$1.0
$1.5
$2.0
$2.5
$3.0
1996
1997
1998
1999
2000
2001
2002
2003
2004
2005
2006
2007
2008
2009
2010
2011
2012
YTD
2013
Tota
l RM
BS
issu
ance
(ag
ency
and
non-
agen
cy) i
n $
trill
ions
Share of ag
ency MB
S (% o
f total
RM
BS issuance)
Total RMBS – agency andnon-agency (left axis)
Share of agency RMBS(right axis)
Fore
cast

19 U.S. Residential Mortgage Market Update
Prime loans comprised bulk of the mortgage servicers’ portfolio
For 4Q 2012, 29 million loans were in servicing portfolios, a decrease of 7.7% from a year ago. Seventy-two percent of the loans in portfolios were prime mortgages in 4Q12, unchanged from the previous two quarters. According to the Office of the Comptroller of the Currency (OCC), 89.4% of mortgages in the portfolio were performing at the end 4Q12, up from 88.6% in the previous quarter and 88.0% a year earlier.
Overall mortgage portfolio
Source: OCC Mortgage Metrics Report Fourth Quarter 2012, Published: March 2013
NextPrevious
68% 69% 69% 69% 70% 70% 70% 71% 71% 72% 72% 72%
11% 11% 11% 11% 11% 11% 11% 11% 11% 11% 11% 11%8% 8% 8% 8% 7% 8% 7% 7% 7% 7% 7% 7%14% 13% 13% 12% 12% 12% 12% 11% 11% 10% 10% 10%
0%
10%
20%
30%
40%
50%
60%
70%
80%
90%
100%
1Q10 2Q10 3Q10 4Q10 1Q11 2Q11 3Q11 4Q11 1Q12 2Q12 3Q12 4Q12
Co
mp
osi
tio
n (%
of
all m
ort
gag
es in
the
po
rtfo
lio)
Prime Alt-A Subprime Other

20 U.S. Residential Mortgage Market Update
Mortgage industry job growth increased slightly in 2012 and 1Q 2013
Mortgage industry headcount38 increased from an annual average of 265,100 in 2011 to an annual average of 272,900 in 2012, a 2.9% increase according to U.S. Bureau of Labor Statistics. Headcount increased further in 1Q13 to 288,900. Mortgage employment has increased each month since December 2012, and industry employment has expanded by more than 10% over the same period last year.39 The expected decline in originations may reduce labor demand in the coming year.
Number of mortgage brokers and bankers (thousands)
Source: U.S. Bureau of Labor Statistics; MortgageDaily.com
38 Mortgage employment consists of the annual average of employees classified as “real estate credit” and “mortgage and nonmortgage loan brokers”
39 MortgageDaily.com article, dated May 3, 2013
NextPrevious
285297
364447 468 490 496
414
308266 269 265 273 289
-30
-20
-10
0
10
20
30
-50
50
150
250
350
450
550
2000
2001
2002
2003
2004
2005
2006
2007
2008
2009
2010
2011
2012
20
13
YTD
Emp
loym
ent
hea
dco
unt,
in t
ho
usan
ds
Percent change
Mortgage industry employment headcount Mortgage industry employment (% change, right axis)

Continued
Asset performance – 1Q 2013February’s foreclosure rate improved to 3.38% but was still six times above the 1995-2005 average of 0.53%
16.0% of subprime loans were seriously delinquent compared to 4.4% of all mortgages
Modifications have declined four consecutive months, falling 3.7% from January to February

22 U.S. Residential Mortgage Market Update
Mortgage delinquencies, still significantly above historic norms, continued their downward trend in 2013
Delinquency rates continued to improve. The February 2013 delinquency rate of 6.80% was 23 basis points below January’s level, though still 57% greater than the 1995 to 2005 average of 4.32%. The seriously delinquent and foreclosure rates continued their declines through 2012 and into 2013. Yet, February’s foreclosure rate of 3.38% is still over six times the 1995 to 2005 average of 0.53%.
Residential mortgage delinquency and foreclosure rates
Source: LPS Applied Analytics, Published: April 2013
NextPrevious
0%
2%
4%
6%
8%
10%
12%
May-10 Aug-10 Nov-10 Feb-11 May-11 Aug-11 Nov-11 Feb-12 May-12 Aug-12 Nov-12 Feb-13
Perc
ent
Delinquencies ForeclosuresSeriously delinquent (90+ days) or in foreclosure
6.80%6.34%
3.38%

23 U.S. Residential Mortgage Market Update
Seriously delinquent mortgages are slowly tapering off but remain well above 2008 levels
The percentage of seriously delinquent40 prime mortgages was stable at 2.3% in December 2012, yet was nearly twice the rate from January 2008. Overall, 4.4% of mortgages were seriously delinquent at the end of the fourth quarter, a decrease of 50 basis points from a year earlier. However, the seriously delinquent rate remains 54% higher than in January 2008. Seriously delinquent subprime loans rose 50 basis points in the quarter, to 16.0%. This is well off the series high of 22.4% from 4Q09, but 57% higher than the rate in January 2008.
Seriously delinquent mortgages, by risk category
40 Seriously delinquent: Mortgages that are 60 or more days past due or held by bankrupt borrowers whose payments were 30 or more days past due
Source: OCC Mortgage Metrics Report Fourth Quarter 2012, Published: March 2013
NextPrevious
0%
5%
10%
15%
20%
25%
1Q10 2Q10 3Q10 4Q10 1Q11 2Q11 3Q11 4Q11 1Q12 2Q12 3Q12 4Q12
Overall Prime Alt-A Subprime Other
16.0%
9.3%
6.2%
4.4%
2.3%Perc
enta
ge
of
mo
rtg
ages
in e
ach
cate
go
ry

24 U.S. Residential Mortgage Market Update
Loan modification continued to decline since October 2012 peak
Mortgage modifications decreased 3.7% from January to February 2013, to a total of 238,019. Permanent and trial modifications through the Home Affordable Modification Program (HAMP) increased in February, though combined they comprised only 11.9% of total modifications in February.
Mortgage modifications, number of loans in thousands
Source: HOPE NOW Industry Report, Published: April 10, 2013See the “Source notes” section for additional details. “Other workout plans” includes repayment, retention, and liquidation plans not counted in “proprietary modifications.”
NextPrevious
195216 207
145 152 159 148 148 161 156 168 169 166188 175
200154 159 159 144
5656
50
53 57 5654 43
45 4144 46 66
5960
73
62 66 6266
2017
15
21 19 2017
1721
1918 16
1415
15
13
22 13 1213
2825 40
26 27 2318 22
2015
18 1717
1714
16
15 14 1515
0
50
100
150
200
250
300
350
Sep-11Jul-11 Nov-11 Jan-12 Mar-12 May-12 Jul-12 Sep-12 Nov-12 Jan-13
Other workout planscompleted (Non-HAMP)
Proprietary modificationscompleted
HAMP trialmodifications
HAMP permanentmodifications
Num
ber
of
loan
s in
tho
usan
ds

25 U.S. Residential Mortgage Market Update
HAMP modifications continue to perform better but represent only 12% of the market
Modifications through the Home Affordable Modification Program (HAMP) have a lower delinquency and foreclosure rate than non-HAMP modifications, most likely due to HAMP’s emphasis on lowering borrowers’ monthly payments and payment sustainability. HAMP modifications made during 4Q12 reduced payments by 35.4% on average, or $558. Non-HAMP modifications reduced payments by an average 23.4%, or $346.41 In 4Q 2012, 60.8% of HAMP-modified loans were current, compared to 49.7% for other modifications.42
HAMP modifications compared to other modifications
Source: OCC Mortgage Metrics Report Fourth Quarter 2012. Published: March 2013
41 OCC Mortgage Metrics Report Third Quarter 2012
42 Modifications used to compare with HAMP modifications only include modifications implemented from the 3Q09 through 3Q12
NextPrevious
6.4%
9.4%
4.9%
2.8%
0.9%
14.8%
8.3%
16.7%
7.8%
5.8%
1.7%
9.9%
0%
2%
4%
6%
8%
10%
12%
14%
16%
18%
30-59 days delinquent Seriously delinquent Foreclosures inprocess
Completed foreclosures Paid off No longer inthe portfolio
Perc
ent
HAMP modifications Non-HAMP

26 U.S. Residential Mortgage Market Update
Foreclosure starts continue to decline
After rising for four consecutive months, foreclosure starts declined 10.7% from January to total 131,826 in February 2013. Though the decline in February is a positive development, LPS cautions that the short month may have been a contributing factor.43
Residential mortgages entering foreclosure process
Source: LPS Applied Analytics, Published: April 2013 43 LPS Applied Analytics, April 2013
NextPrevious
50,000
0
100,000
150,000
200,000
250,000
300,000
May
-10
Jun-
10
Jul-1
0
Aug
-10
Sep
t-10
Oct
-10
No
v-10
Dec
-10
Jan-
11
Feb
-11
Mar
-11
Ap
r-11
May
-11
Jun-
11
Jul-1
1
Aug
-11
Sep
t-11
Oct
-11
No
v-11
Dec
-11
Jan-
12
Feb
-12
Mar
-12
Ap
r-12
May
-12
Jun-
12
Jul-1
2
Aug
-12
Sep
t-12
Oct
-12
No
v-12
Dec
-12
Jan-
13
Feb
-13
Fore
clo
sure
sta
rts
Foreclosure starts Trend line
270,681
201,173
131,826

27 U.S. Residential Mortgage Market Update
Page 9:
•The S&P/Case-Shiller Composite of 10 Home Price Index is a value-weighted average of the 10 original metro area indices. The S&P/Case-Shiller Composite of 20 Home Price Index is a value-weighted average of the 20 metro area indices. The indices have a base value of 100 in January 2000; thus, for example, a current index value of 150 translates to a 50% appreciation rate since January 2000 for a typical home located within the subject market.
•Copyright © 2012 by Standard & Poor’s Financial Services LLC, a subsidiary of The McGraw-Hill Companies. All rights reserved. Standard & Poor’s and S&P are registered trademarks of Standard & Poor’s Financial Services LLC (“S&P) and Dow Jones is a registered trademark of Dow Jones Trademark Holdings LLC (“Dow Jones”). The trademarks have been licensed to S&P Dow Jones Indices LLC. Case-Shiller and Case-Shiller Indexes are registered trademarks of Fiserv, Inc. and have also been licensed to S&P Dow Jones Indices LLC.
Page 18:
•Non-agency issuance does not include the category more commonly known as “subprime;” this category has been consolidated under “home equity” in ABS issuance and outstanding. The addendum has been included as a courtesy but home equity numbers are ultimately aggregated under ABS in both issuance and outstanding.
Page 24:
•HOPE NOW data is extrapolated based on the “MBA Delinquency Survey” for 2Q12. MBA estimates that its survey covers approximately 88% of the total industry. HOPE NOW data estimates for August 2012 may increase or decrease slightly when the MBA releases its delinquency data for 3Q12.
•Extrapolated. Other workout plans completed is comprised of repayment plans initiated (tracked from 3Q07), other retention plans completed and liquidation plans (tracked from December 2009).
NextPrevious
Source notes

This publication contains general information only and is based on the experiences and research of Deloitte practitioners. Deloitte is not, by means of this publication, rendering business, financial, investment, or other professional advice or services. This publication is not a substitute for such professional advice or services, nor should it be used as a basis for any decision or action that may affect your business. Before making any decision or taking any action that may affect your business, you should consult a qualified professional advisor. Deloitte, its affiliates, and related entities shall not be responsible for any loss sustained by any person who relies on this publication.
Copyright © 2013 Deloitte Development LLC. All rights reserved.Member of Deloitte Touche Tohmatsu Limited
ContactsIndustry LeadershipBob ContriVice ChairmanU.S. Financial Services LeaderU.S. Banking and Securities LeaderDeloitte LLP+1 212 436 [email protected]
Brian JohnstonPrincipal U.S. Consulting Banking and Securities LeaderDeloitte Consulting LLP+1 703 251 [email protected] Drew TyriePrincipalLending and Leasing Deloitte Consulting LLP+1 303 601 [email protected]
J.H. CaldwellPartnerDeloitte & Touche LLP+1 704 227 [email protected] Tiffany JohnstonPrincipal Deloitte Consulting LLP+1 213 996 [email protected]
Elizabeth JordanDirector Deloitte & Touche LLP+1 704 887 [email protected]
Paul WeissDirectorDeloitte Consulting LLP+1 904 665 [email protected]
Deloitte Center for Financial ServicesJim EckenrodeExecutive DirectorDeloitte Center for Financial ServicesDeloitte Services LP+1 617 585 [email protected]
Adam SchneiderChief AdvisorDeloitte Center for Financial ServicesPrincipalDeloitte Consulting LLP+1 212 436 [email protected]
Don OgilvieIndependent Senior AdvisorDeloitte Center for Financial ServicesDeloitte LLP+1 212 436 [email protected]
AuthorsVal SrinivasBanking and Securities Research LeaderDeloitte Center for Financial ServicesDeloitte Services LP+1 212 436 [email protected]
Ryan ZagoneLead Market Insights AnalystDeloitte Center for Financial ServicesDeloitte Services LP+1 212 436 [email protected]
Robert LibbeySenior Market Research AnalystDeloitte Center for Financial ServicesDeloitte Services LP+1212 313 [email protected]
Deloitte Center for Financial Services
The Deloitte Center for Financial Services offers actionable insights to assist senior-level executives in the industry to make impactful business decisions.


