58
LexisNexis® Risk Solutions 2019 True Cost of Fraud ℠ Study U.S. Retail Edition

LexisNexis® Risk Solutions2019 True Cost of Fraud℠ Study
U.S. Retail Edition

2
The research provides a snapshot of:
Current fraud trends in the US retail and e-Commerce market
Key pain points related to adding new payment mechanisms, transacting though online and mobile channels, & expanding internationally
The LexisNexis® Risk Solutions 2019 US Retail True Cost of Fraud℠ Study helps merchants grow their business safely and manage the cost of fraud, while strengthening customer trust and loyalty.
Fraud Definitions
• Fraud is defined as the following:
• Fraudulent and/or unauthorized transactions;
• Fraudulent requests for refund/return; bounced checks; and
• Lost or stolen merchandise, as well as redistribution costs associated with redelivering purchased items
• This research covers consumer-facing retail fraud methods
• It does not include insider fraud or employee fraud
• The LexisNexis Fraud Multiplier℠
• Estimates the total amount of loss a merchant incurs based on the actual dollar value of a fraudulent transaction

3Research was conducted in January - March 2019.
The study included a comprehensive survey of 700 U.S. risk and fraud decision makers . . .
Across a variety of retail and e-Commerce categories
Including the following retail and e-Commerce segments…
SmallRetailers
Mid/Large Retailers
Retailers w/ m-Commerce
Retailers w/ Digital Goods
# completions: 481 219 317 288
Mid/Large e-Commerce Merchants
Smalle-Commerce Merchants
e-Commerce Merchants w/ m-Commerce
e-Commerce Merchants w/ Digital Goods
# completions: 160 40 70 72
Segment Definitions:
Earn <$10 million in
annual revenuesSmall Earn $10 million+ in
annual revenuesMid/Large
Retailers with e-Commerce
May accept payments through multiple
channels, but earn at least 10% of their
revenue from the online channel
E-Commerce Merchants
Earn a large majority of revenues
through the online/mobile channels
With m-Commerce
Accept payments through either
a mobile browser or app, or “bill
to mobile phone”

Key Findings

A number of trends are increasing fraud risk for retailers and e-Commerce merchants.
The number of businesses allowing m-Commerce has expanded beyond the traditional mid/large bricks/mortar retailer which sells digital goods and services. Small retailers with digital goods and services along with mid/larger retailers and e-Commerce merchants that sell physical goods have entered this space.
Digital goods and services are being offered by more retailers and merchants.
More international transactions are taking place.
More automated botnet activity is occurring.
The insidious nature of synthetic identities continues to be prevalent.
5
Key Findings
21U.S. retail fraud has grown significantly during the past year, with more and different types of retailers being impacted. This translates into sharply increasing fraud volumes and costs.
Overall fraud attempts have doubled year-over year and tripled since 2017.
Fraudsters have begun targeting more types of retailers and e-Commerce merchants, including small businesses.
This has resulted in an increasing cost of fraud. Every $1 of fraud now costs retailers $3.13 compared to $2.94 a year ago.

6
Key Findings (cont.)
4This is translating into a perfect storm of increased fraud for merchants with cross-border, digital and mobile channel transactions.
Fraud attacks have increased among these types of retailers and e-Commerce merchants.
Fraud from the mobile channel has increase, with mobile apps usage being a key contributor.
Account-related fraud is a significant portion of identity-related fraud.
Payment card fraud has risen.
And, the cost of fraud for these types of businesses continues to trend upwards.
3These trends are making identity verification and the ability to balance fraud detection with minimal customer friction harder. This is particularly true for mobile channel transactions.
Across retail and e-Commerce businesses, verifying customer identity, the inability to determine transaction source, the inability to distinguish between human and malicious bots and minimizing customer friction are top ranked mobile channel challenges.
Study findings show a link between synthetic identities, automated botnet attacks and identity verification challenges.

7
Key Findings (cont.)
5But, as fraud continues to become more sophisticated, the use of more sophisticated solutions remains limited.
Fraud is not a one-size fits all. The risks posed by digital goods is higher than when selling physical goods; the ability to detect fraud in the remote channels, particularly mobile, is harder than doing so in-store. The ability to distinguish between a legitimate customer and a fraudster is very difficult when the criminal is using a synthetic identity with real personally identifiable information.
Different solutions need to be applied for different channels and types of transactions. These should assess fraud for both the identity and the transaction, using physical and digital identifying information.
However, retailers and merchants appear to still be using a limited set of solutions to cover all channel and transaction risks. Those newer to m-Commerce are particularly at-risk; they tend to have embraced this channel without investing in solutions to meet specific threats from m-Commerce.
Study findings show that those retailers and merchants which use a layered solution approach involving identity authentication and transaction verification, including digital identity / behavior biometric tools, experience a lower cost of fraud.

U.S. retail fraud has grown significantly in terms of attacks and cost. Fraud attempts have doubled.
Fraudsters are targeting a broader set of retailers and e-Commerce merchants.
The cost of fraud continues to rise.
1

91 133 156 206 238 306564
94165 177
236 257313
820
2013 2014 2015 2016 2017 2018 2019
Average Number of Fraudulent Attempts PREVENTED per Month
Average Number of Fradulent Attempts That SUCCEED per Month
9Q22: In a typical month, approximately how many fraudulent transactions are prevented by your company?Q24: In a typical month, approximately how many fraudulent transactions are successfully completed at your company?Q25: What is the average value of successful fraud transactions?
And the number of successful fraud transactions alone have grown by 84% since just last year. Not only has the number grown, but the dollar amount of these transactions has increased to nearly $250 on average.
Overall fraud attempts have doubled year-over-year, and tripled since 2017.
Average # of Total Fraud Attempts Per Month
$155
$114 $113$146
$181 $184
$248
2013 2014 2015 2016 2017 2018 2019
Average $ Amount Per Successful Fraud Transaction per Month
185298 333
442 495619
1,384
+123% +34%
+84% from 2018

10
The average volume of monthly fraud attacks is highest for mid/large retailers selling digital goods, but continues to remain high for mid/large e-Commerce merchants with digital goods as well.
However, fraud volume has grown significantly among other segments that have seen less fraud activity in previous years, particularly smaller retailers selling digital goods and mid/large retailers and e-Commerce merchants that sell only physical goods.
And fraudsters have begun targeting more types of retailers and e-Commerce merchants.
210722
465
1,135
406 651 514 474 247 356492
882961
1,778
739
1,129876 909
359545
2018 2019 2018 2019 2018 2019 2018 2019 2018 2019
Significantly different from 2018 within Segment
Average # of Total Fraud Attempts Per Month
Average Number of Fraudulent Attempts PREVENTED per Month
Average Number of Fradulent Attempts That SUCCEEDED per Month
Small Retailers w/ Digital Goods
Mid/Large Retailers w/ Digital Goods
Mid/Large e-Commerce Merchants w/ Digital
Goods
Mid/Large e-Commerce Merchants w/ Physical
Goods Only
Mid/Large Retailers w/ Physical Goods Only
702
1,6041,426
2,913
1,390 1,383
606901
1,145
1,780
+104%from 2018
+128%from 2018
+55%from 2018
+47%from 2018
Q22: In a typical month, approximately how many fraudulent transactions are prevented by your company?Q24: In a typical month, approximately how many fraudulent transactions are successfully completed by fraudsters?

11
$2.79 $3.08
$2.23 $2.40$2.77 $2.94 $3.13
2013 2014 2015 2016 2017 2018 2019
This has resulted in an increased cost of fraud.
Q10: In thinking about the total fraud losses suffered by your company, please indicate the distribution of various fraud cost over the past 12 months.Q16a: In thinking about your total fraud losses, please indicate the distribution of various direct fraud costs over the past 12 months.
0.51% 0.68%
1.32%1.47% 1.58%
1.80% 1.86%
2013 2014 2015 2016 2017 2018 2019
Fraud losses as a percentage of annual revenue continues its upward trend since 2015.
The cost for each dollar of fraud losses is up 6.5% from last year, crossing over the $3 mark
to come in at $3.13. This cost involves
increased expenses related to chargebacks, fees, merchandise redistribution, labor/investigation, legal prosecution and IT/software security.
As shown later, the increased cost of fraud is based on a combination of factors.
LexisNexis Fraud Multiplier℠ *
Fraud as % Cost of Revenue
+6.5%from 2018
+3.3%from 2018
*Estimates the total amount of loss a merchant occurs based on the actual dollar value of a fraudulent transaction, which includes not only the chargeback/face value of the transaction, but also costs associated with fees, merchandise redistribution, and labor/investigation.

A number of trends are increasing fraud risk for retailers and e-Commerce merchants. Mobile channel use is expanding.
More digital goods/services are being offered.
More international transactions are taking place.
More automated botnet activity is occurring.
The insidious nature of synthetic identities continues to be prevalent.
2

Q4: Please indicate the percentage of transactions completed (over the past 12 months) for each of the following payment channels currently accepted by your company. Q6: Is your company considering accepting payments by mobile device over the next 12 months?
*Not all who say “likely in next 12 months” may actually be able to do so in that timeline. Budgets and other unforeseen factors could delay adoption.
13
Use of the mobile channel has expanded significantly, with newer adoption from small retailers that sell digital goods and mid/large retailers and e-Commerce merchants that sell physical goods only.
68% 77%53% 54% 47%
25% 18%
30%40% 49%
Small Retailers w/ Digital Goods
Mid/Large Retailers w/
Digital Goods
Mid/Large e-Commerce Merchants
w/ Digital Goods
Mid/Large e-Commerce Merchants w/ Physical Goods Only
Mid/Large Retailers w/ Physical Goods Only
2018 24% 70% 33% 47% 15%
93%*95%*
85%*94%* 96%*
% Currently Allowing & Considering m-Commerce
Considering m-Commerce
Currently Allow m-Commerce
Significantly different from 2018 within Segment
+44 from 2018
+20 from 2018
+32 from 2018
This aligns with consumer demand and behavior for more remote purchasing options and is reflected by significant growth of mobile shopping during the 2018 holiday season.1
Adding these additional segments to earlier adopters of the mobile channel (mid/large retailers and e-Commerce merchants that sell digital goods) broadens the landscape for fraudsters.
Market Trends Synthetic IDsMore Digital Goods/Services More Cross-Border Transactions More Botnets
1 https://www.pymnts.com/mobile/2018/paypal-smartphones-holiday-shopping-cyber-monday/
More Mobile

More Mobile
54%
24%
43%
31%
Q4: Please indicate the percentage of transactions completed (over the past 12 months) for each of the following payment channels currently accepted by your company.
14
While mobile browsers continue to be a major source for m-Commerce transactions, the use of mobile apps has significantly increased to be a comparable option.
Significantly different from 2018 within Segment
This increase comes from segments that have seen new entrants to the mobile channel, suggesting that those who have recently added this option recognize the speed with which mobile app use is growing – and the way in which mobile apps provide a faster direct-to-the-customer experience.
Market Trends Synthetic IDsMore Digital Goods/Services More Cross-Border Transactions More Botnets
28%
39%
30%
39%
Mid/Large Retail w/ Physical Goods Only
2019 Mobile Browser
% Distribution of Mobile Channel Transactions Completed by Platform
2018 Mobile Browser
2019 Mobile Apps
2018 Mobile Apps
2018
2019
2018
2019
53%
24%
38%
33%
Small Retail w/ Digital Goods
2018
2019
Mid/Large Retail w/ Digital Goods

D1: Please indicate the type of products sold by your company (physical, digital)?D1b: What types of digital goods are sold by your company?
15
There has been growth in the number of retail and e-commerce businesses that offer digital goods/services.
23%32%
75% 63%
2% 5%
2018 2019
Fewer merchants report selling only physical goods, with a number having added digital goods to their offerings. The incidence of digital-only merchants has remained at similar levels, while the incidence of mixed digital and physical goods merchants has increased.
Type of Goods Sold
Digital Goods OnlyPhysical Goods OnlyDigital & Physical Goods
+9
-12
52%
36%
34%
26%
23%
23%
23%
22%
21%
20%
18%
14%
eGift cards
Downloadable software
Cloud-based applications
Digital subscriptions
Photos/graphics
Mobile apps
Online games/gaming
Media streaming
eBooks
Electronic tickets
eLearning/online courses
Digital services
2018
42%
46%
36%
36%
30%
37%
28%
27%
24%
19%
23%
---
Types of DIGITAL Goods Sold
Market Trends Synthetic IDsMore Mobile More Digital Goods/Services More Cross-Border Transactions More Botnets
Significantly different from 2018 within Segment
This could be driven, in part, by an increase in the number of retailers indicating the sale of e-gift cards.
But merchants with eGift cards need to remain vigilant and employstrong fraud detection tools. Fraudsters are using more sophisticated synthetic identities and stolen credit card accounts to obtain these to then resell. Since gift cards, in general, tend to involve lower dollar amounts, fraudsters are often able to remain under the radar.

D1: Please indicate the type of products sold by your company (physical, digital)?
16
While mid/large retailers and e-Commerce merchants are more likely to offer digital goods, the number of small retailers offering these has more than doubled year-over-year.
11%26%
44%58%
29% 28%
67%76%
86%70%
54%35%
59% 62%
6%
2%
3% 4% 2%7% 12% 10%
27% 22%
2018 2019 2018 2019 2018 2019 2018 2019
Small Retailers
Mid/Large Retailers
Small e-Commerce Merchants
Mid/Large e-Commerce Merchants
Significantly different from 2018 within Segment
Type of Goods Sold
Digital Goods OnlyPhysical Goods OnlyDigital & Physical Goods
+15
+14
+9
-14-19
Market Trends Synthetic IDsMore Mobile More Digital Goods/Services More Cross-Border Transactions More Botnets

More Cross-Border Transactions
17
While domestic transactions account for the bulk of annual revenues, the percent attributed to international transactions has increased among small digital goods retailers and mid/large physical goods-only merchants that allow m-Commerce.
As shown earlier, fraud attempts have increased for these segments which are newer to the mobile channel.
And, there has been an increase in the volume of international transactions.
21%79%
13%
87%
10%
90%
8%
92%
25%75%
26%74%
29%71%
11%
89%
Small Retailers w/ Digital Goods & m-
Commerce
Mid/Large Retailersw/ Digital Goods &
m-Commerce
Mid/Large Retailers w/ Physical Goods Only &
m-Commerce
Small Retailers w/ Physical Goods Only &
m-Commerce
Domestic vs. International Transaction Volumes
2019
2018
Q9: Please indicate the percent of annual revenue generated through domestic compared to international transactions in the last 12 months.
Significantly different from 2018 within Segment
+8from 2018
+18from 2018
Domestic International
Synthetic IDsMore Mobile More Digital Goods/Services More BotnetsMarket Trends

18
So, why is mobile, digital and international more risky?
Significantly different from 2018 within Segment
Market Trends Synthetic IDsMore BotnetsMore Digital Goods/Services More Cross-Border Transactions
Mobile
• Rise of mobile botnet attacks; malware infects devices without consumer knowledge; steals identity, hacks accounts, makes fraudulent purchases2
• Consumer risk behaviors – using open WiFi networks increases risk of smishing (SMS-based phishing) and man-in-the-middle interception of passcodes used for multi-factor authentication3; “keep me logged in” habits become an unlocked entry point to accounts
• Increasing pool for fraudster opportunity as more people conduct mobile transactions
2 ThreatMetrix® H2 2018 Cybercrime Report3 4 Mobile Fraud Trends to Look for in 2019; https://threatmetrix.com/digital-identity-blog/fraud-prevention/4-mobile-fraud-trends-look-out-for-2019
Digital
• Fast transaction; digital goods/services, such as downloads and subscriptions, tend to occur quickly; lack of a physical delivery address eliminates buffer period for fraud verification before shipment; with fear of abandonment, merchants struggle with balancing fraud prevention and minimizing customer friction.
• Favorite target for fraudster card testing; use of bots to test stolen credit card information with lower value goods/services (typical of digital goods/services) tend to arouse less suspicion.
• Easy targets; synthetic identities and stolen data make it difficult to distinguish between malicious attacks and legitimate customers in the anonymous channel.
Cross Border
• Uncertainties, blind spots and new payment methods; it becomes difficult to determine transaction origination; lack of verifiable data on consumers in other markets (particularly with GDPR)
More Mobile

More Botnets
19
Among those who have estimates, this activity appears to target mid/large retailers somewhat more than small, especially those offering m-Commerce and selling digital goods.
Automated botnet activity is reportedly increasing, though many merchants are unable to quantify the level at this point.
B1a: In a typical month, what percent of your transactions are determined to be malicious automated bot attacks?B1b: How does this compare to the same time last year? Would you say the percent of monthly automated malicious bot attacks has:
44%
56%
Not sure Estimate given
7.1%
Botnet Activity as % of Transactions Per Month
% indicating an increase in activity since last year
33%
Market Trends Synthetic IDsMore Digital Goods/Services More Cross-Border TransactionsMore Mobile
4 ThreatMetrix® H2 2018 Cybercrime Report5 Ibid
When it comes to Botnets, there is a distinction between those that are human/manually launched and those that are automated. According to ThreatMetrix®, a LexisNexis® RiskSolutions Company, the 2018 Thanksgiving holiday shopping week involved a high volume of automated bot attacks.4
These involve the specific types of risk mentioned on the previous slide: A number were mobile bots, with a significant
increase from early 2018; These mobile bots steal credentials and
identity data for account takeovers and fraudulent purchases;
Stolen credentials were likely used for card testing; and
Bots originated not just from the United States, but other regions including Asia.5

20
Synthetic identities are comprised of real and/or fake personal information. They are created by using information from either:
Synthetic identities are a serious threat. Their very nature makes it extremely difficult to detect before damage is incurred.
More BotnetsMarket Trends Synthetic IDsMore Digital Goods/Services More Cross-Border TransactionsMore Mobile
Synthetic Identity
Multiple real persons into a single fake identity, with a valid shipping address, Social Security Number (SSN), date of birth, name, etc. – none of which matches any one person. This type may be used for shorter-term fraud gains, such as bigger ticket items.
No known persons in which the personally identifiable information doesn’t belong to any consumer. It is entirely fabricated based on a new SSN, using the same range as the Social Security Administration for randomly-issued numbers. This may also be nurtured for longer-term gain and is useful when posing as an underbanked consumer with a less established purchasing footprint (i.e., younger Millennials).
One real person by using some of his / her information combined with fake data. In this case, the fraudster is likely to be nurturing this identity, using it to establish a good credit history before ultimately “going bad”.
Consumers have more ways to purchase, from different locations anywhere and anytime. Theymight share passwords and use different devices at different times. It is harder to make physical and digital connections that distinguish fraudulent from legitimate patterns.
Risks & ChallengesReal customers don’t help; behaviors make it difficult to spot anomalies with current ID solutions.
Focus on nurturing the identity to mimic a good customer; establishes good credit, pays on-time, etc. before “breaking bad”
Extremely Hard to Distinguish from Legitimate Customers
These are professional fraudsters; they often know the types of information required to gain approval and pass certain checkpoints. Use of real identity data helps them do this.
Difficult to detect with traditional identity verification / authentication solutions

These trends are making identity verification and the ability to balance fraud detection with minimal customer friction harder.
3
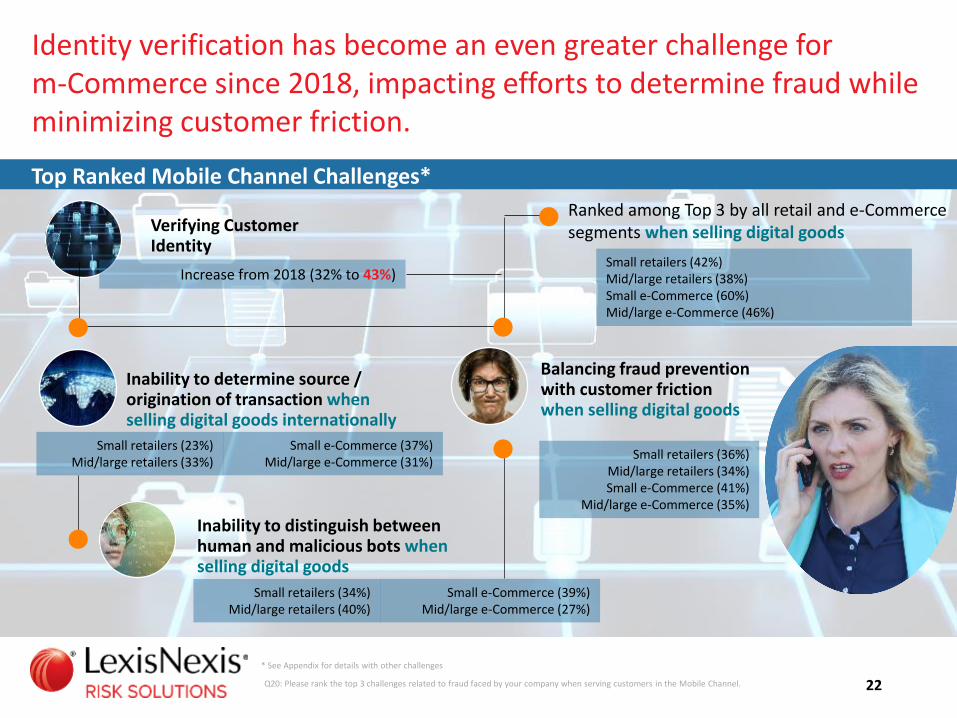
Small retailers (23%)Mid/large retailers (33%)
Q20: Please rank the top 3 challenges related to fraud faced by your company when serving customers in the Mobile Channel. 22
Top Ranked Mobile Channel Challenges*
Verifying Customer Identity
Increase from 2018 (32% to 43%)Small retailers (42%)Mid/large retailers (38%)Small e-Commerce (60%)Mid/large e-Commerce (46%)
Ranked among Top 3 by all retail and e-Commerce segments when selling digital goods
Inability to distinguish between human and malicious bots when selling digital goods
Balancing fraud prevention with customer friction when selling digital goods
Small retailers (36%)Mid/large retailers (34%)Small e-Commerce (41%)
Mid/large e-Commerce (35%)
* See Appendix for details with other challenges
Identity verification has become an even greater challenge for m-Commerce since 2018, impacting efforts to determine fraud while minimizing customer friction.
Inability to determine source / origination of transaction when selling digital goods internationally
Small e-Commerce (39%)Mid/large e-Commerce (27%)
Small retailers (34%)Mid/large retailers (40%)
Small e-Commerce (37%)Mid/large e-Commerce (31%)

Q19a/b_2: Please rank the top 3 challenges related to fraud faced by your company when selling digital goods. 23
There is clear linkage between the rise of synthetic identities, automated botnet attacks and identity verification challenges.
Identity Verification as Top Challenge When Selling Digital Goods
Small Retailers w/ m-Commerce
As mentioned earlier, automated botnet attacks are being noticed more often by mid/large retailers with digital and mobile transactions. Other segments are newer to the mobile channel and are significantly more likely to mention synthetic identities and minimizing customer friction as issues with identity verification. e-Commerce merchants, which have been slower to adopt m-Commerce, are particularly likely to blame it on using the mobile channel.
For these newer m-Commerce merchants, their limited use of fraud detection / mitigation solutions to support unique mobile channel risks is likely contributing to these issues.
49%
30%
46%
54%
41%
34%
46%
The rise of synthetic identities
Balancing speed of approval vs. customer friction/abandonment
The use of the mobile channel for transactions
Volume of malicious automated Botnet orders placed at once
Limited ability to confirm location of order
Limited/no real-time transaction tracking tools
Limited/no access to real-time third party data sources
61%
67%
36%
37%
39%
31%
28%
Top 3 Factors That Make ID Verification A Challenge with Digital Goods Sales among m-Commerce Merchants
Mid/Large Retailers w/ m-Commerce
42% 38%
60%
46% 79%
29%
79%
19%
11%
36%
47%
68%
64%
56%
29%
18%
32%
32%
Mid/Large e-Commerce Merchants w/m-Commerce
Small e-Commerce Merchants w/m-Commerce
The rise of synthetic identities
Balancing speed of approval vs. customer friction/abandonment
The use of the mobile channel for transactions
Volume of malicious automated Botnet orders placed at once
Limited ability to confirm location of order
Limited/no real-time transaction tracking tools
Limited/no access to real-time third party data sources
42%
24%28% 31% 33%
27% 26%33%
24%
8% 8%15%
38%
20%
27% 29% 25% 29% 29%35%
17%9%
22%15%
54%
20%24% 22%
34%41%
7%
36%25%
9% 9% 4%
67%
14%
32% 32%
17% 21%11%
29% 27%
17%
8%14%
Q19aa/bb: Please rank the top 3 challenges related to fraud faced by your company when selling digital goods.
24
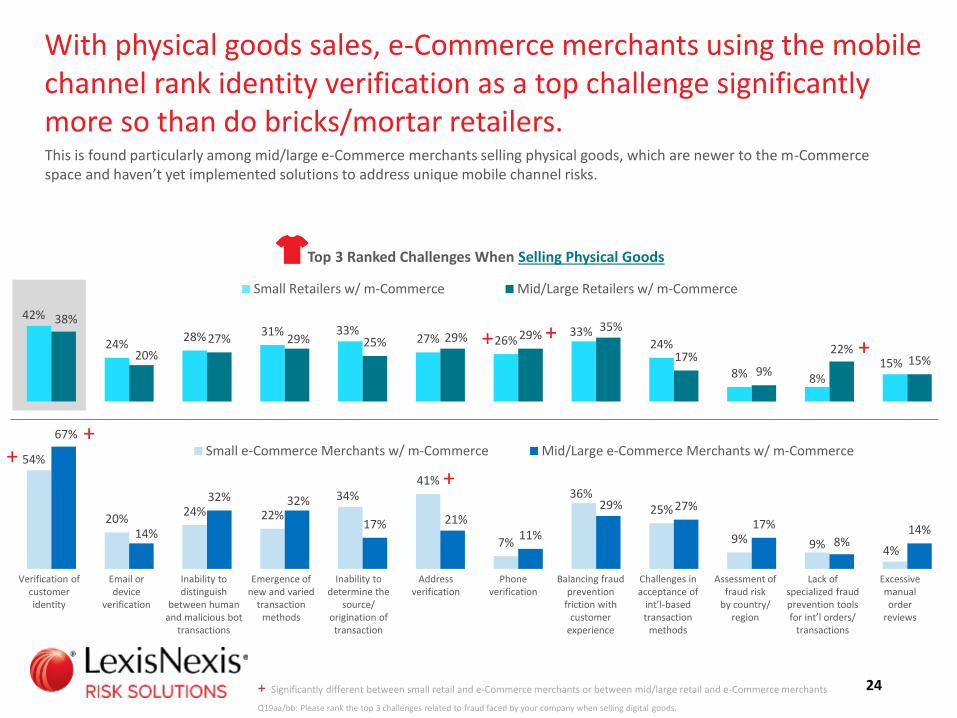
With physical goods sales, e-Commerce merchants using the mobile channel rank identity verification as a top challenge significantly more so than do bricks/mortar retailers.
Top 3 Ranked Challenges When Selling Physical Goods
Small Retailers w/ m-Commerce Mid/Large Retailers w/ m-Commerce
This is found particularly among mid/large e-Commerce merchants selling physical goods, which are newer to the m-Commerce space and haven’t yet implemented solutions to address unique mobile channel risks.
Verification of customer identity
Email or device
verification
Inability to distinguish
between human and malicious bot
transactions
Emergence of new and varied
transaction methods
Inability to determine the
source/origination of transaction
Addressverification
Phoneverification
Balancing fraud prevention
friction with customer
experience
Challenges in acceptance of
int’l-based transaction
methods
Assessment of fraud risk
by country/region
Lack of specialized fraud prevention tools for int’l orders/
transactions
Excessive manual order
reviews
Small e-Commerce Merchants w/ m-Commerce Mid/Large e-Commerce Merchants w/ m-Commerce
+ Significantly different between small retail and e-Commerce merchants or between mid/large retail and e-Commerce merchants
++
+
+ ++

Q12: Please indicate, to the best of your knowledge, the percentage distribution of the following fraud methods below, as they are attributed to your total annual fraud loss over the past 12 months. • Friendly fraud (an individual associated with/having access to an account conducts transaction without the primary account owner’s knowledge or permission)• 1st party fraud (owner to authorized user of the account commits the fraud)• 3rd party identity fraud (unauthorized transaction using other people’s existing/real information)• Synthetic identity fraud (creation of a new identity using a combination of real and fabricated information, sometimes entirely fictitious
25
Friendly/first-party fraud and 3rd party/synthetic identity fraud account for the significant portion of fraud losses among retailers and e-Commerce merchants.This is likely related to identity testing bot attacks, which according to ThreatMetrix® can represent a sizeable degree of e-Commerce merchants’ transaction volume.6
Given the difficulty of detecting synthetic identities, these could represent a larger percent than is reported.
27% 27%
13%
26%
7%
32%31%
12%16%
9%
39%36%
11%7% 7%
43%40%
10%4% 3%
Friendly/1st party
fraud
3rd party/syntheticidentity
fraud
Fraudulentrequest
for return
Lost/stolenmerchandise
3rd partyaccounttakeover
% Distribution of Fraud Losses by Types
Mid/Large Retailers Mid/Large Retailers w/ Digital Goods Mid/Large e-Commerce Mid/Large e-Commerce w/ Digital Goods
10% 11% 10% 10%
% Synthetic ID
6 ThreatMetrix® H2 2018 Cybercrime Report

All of this is translating into a perfect storm of increased fraud for merchants with cross-border, mobile or digital goods transactions. Fraud attacks have increased among
those using the mobile channel, selling digital goods and allowing international transactions.
Fraud from the mobile channel has increased; losses related to mobile apps use is sizeable.
Account-related fraud is a problem.
Payment card fraud has risen.
The cost of fraud trends upward.
4

27
415848 822
1,242
222606
231703
106524
547
1,0191,589
1,843
191
546 1,061765
370
664
Nom-Comm
Allowm-Comm
Nom-Comm
Allowm-Comm
Nom-Comm
Allowm-Comm
Nom-Comm
Allowm-Comm
Nom-Comm
Allowm-Comm
Average # of Total Fraud Attempts Per Month (2019)
Small Retailers w/ Digital Goods
Mid/Large Retailers w/ Digital Goods
Mid/Large e-Commerce w/ Digital Goods
Mid/Large e-Commerce w/ Physical Goods Only
Mid/Large Retailers w/ Physical Goods Only
962
1,867
2,411
3,085
1,292 1,468
476
1,188
413
1,152
Q22: In a typical month, approximately how many fraudulent transactions are prevented by your company?Q24: In a typical month, approximately how many fraudulent transactions are successfully completed at your company?
Combining digital goods sales increases fraud risk. Its not just the
successful fraud attempts that are up, but also those which have been averted. This suggests that, while fraudsters are looking for successes, they are also testing for the weak points: more botnet attacks and card testing of breached credentials; more SMS-based phishing (smishing); seeking out two-step authentication by attacking devices and being the “man in the middle” to intercept one-time passwords.
Fraud volume is significantly higher among those allowing m-Commerce transactions compared to merchants who don’t.
Average Number of Fraudulent Attempts PREVENTED per Month
Average Number of Fradulent Attempts That SUCCEED per Month
Perfect Storm Impacts Payment Card FraudATOMore Fraud Attacks Digital Goods International Cost of FraudMobile

28
In fact, the average monthly fraud volume for mid/large retailers that sell digital goods through the mobile channel has spiked significantly (133%).
514
1,242
144606 523 703
805
1,843
625
546 553765
2018 2019 2018 2019 2018 2019
Average # of Total Fraud Attempts Per Month: Those Allowing m-Commerce (2018 – 2019 Compared)
Average Number of Fraudulent Attempts PREVENTED per Month
Average Number of Fradulent Attempts That SUCCEED per Month
Mid/Large Retailers w/ Digital Goods
Mid/Large e-Commerce Merchants w/ Digital
Goods
Mid/Large Retailers w/ Physical Goods Only
1,319
3,085
1,076
1,468
769
1,152
Q22: In a typical month, approximately how many fraudulent transactions are prevented by your company?Q24: In a typical month, approximately how many fraudulent transactions are successfully completed at your company?
Increased m-Commerce fraud volumes could also be reflective of the increased volume of mobile transactions being conducted by consumers, particularly during the 2018 holidays.
+141%
+36%
+35%
+133%
+50%
+320%
As shown later, they also have one of the highest fraud costs, further underscoring the risky mix of mobile and digital transactions.
Perfect Storm Impacts Payment Card FraudATOMore Fraud Attacks Digital Goods International Cost of FraudMobile
Mid/large retailers that sell only physical goods may not have been as prepared for the mobile channel; as this segment has increased use of these transactions since 2018, the volume of successful fraud attacks has outpaced everyone else (up 320%). This would suggest reliance on current legacy solutions used with other channels to detect/mitigate fraud in the more unique mobile channel.

Q15. Please indicate the percent of fraud costs generated through each of the following transaction channels used by your company.
29
Not surprisingly, the distribution of fraud losses has risen for the mobile channel, contributing to nearly one-fifth of fraud costs for retailers and even more for mid/large e-Commerce merchants.
Perfect Storm Impacts Payment Card FraudATOMore Fraud Attacks Digital Goods International Cost of FraudMobile
18% 17%
44%36%
24%26%
9%11%
5% 10%
2018 2019
Mobile Online In Store/Kiosk Phone Other
Mid/Large Retailers w/ Digital Goods
10%22%
30% 17%
43%48%
11%17%
4% 8%
2018 2019
Mid/Large Retailers w/ Physical Goods Only
Significantly different from 2018 within Segment
20%33%
77%60%
3%3%
2%2%
2018 2019
Mid/Large e-Commerce
4%19%
41%
42%
37%21%
17% 11%
1% 7%
2018 2019
Small Retailers w/ Digital Goods
Average # of Total Fraud Attempts Per Month: Those Allowing m-Commerce (2018 – 2019 Compared)
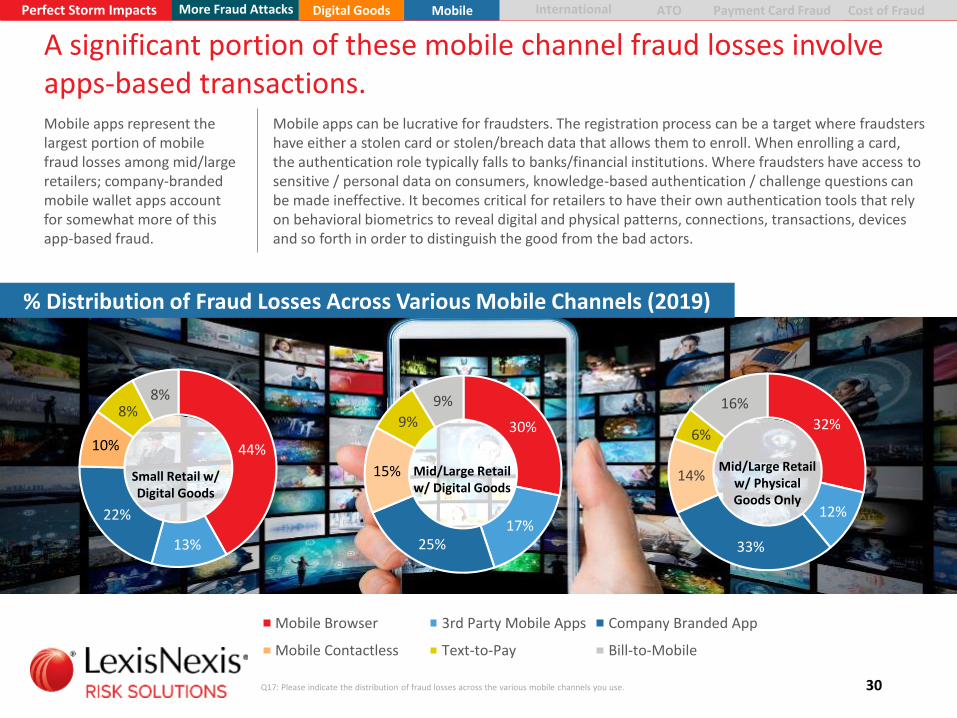
In cases of mobile bots being launched from smartphones, current fraud detection solutions that assess IP addresses may provide less effective. For mobile, IP addresses are not often device specific, but are rather “leased / provided” by the network that a person is using. An ISP assigns a public IP address that is the one seen when using the Internet; one’s router creates a private IP address for the in-home local area network. Therefore, IP addresses are often dynamic, meaning that they change frequently.
44%
13%
22%
10%
8%8%
30%
17%25%
15%
9%
9%
32%
12%
33%
14%
6%
16%
Q17: Please indicate the distribution of fraud losses across the various mobile channels you use. 30
A significant portion of these mobile channel fraud losses involve apps-based transactions.
Mobile apps can be lucrative for fraudsters. The registration process can be a target where fraudsters have either a stolen card or stolen/breach data that allows them to enroll. When enrolling a card, the authentication role typically falls to banks/financial institutions. Where fraudsters have access to sensitive / personal data on consumers, knowledge-based authentication / challenge questions can be made ineffective. It becomes critical for retailers to have their own authentication tools that rely on behavioral biometrics to reveal digital and physical patterns, connections, transactions, devices and so forth in order to distinguish the good from the bad actors.
Mid/Large Retail w/ Physical Goods Only
Small Retail w/ Digital Goods
Mid/Large Retail w/ Digital Goods
% Distribution of Fraud Losses Across Various Mobile Channels (2019)
Perfect Storm Impacts Payment Card FraudATOMore Fraud Attacks Digital Goods International Cost of FraudMobile
Mobile Browser 3rd Party Mobile Apps Company Branded App
Mobile Contactless Text-to-Pay Bill-to-Mobile
Mobile apps represent the largest portion of mobile fraud losses among mid/large retailers; company-branded mobile wallet apps account for somewhat more of this app-based fraud.
31
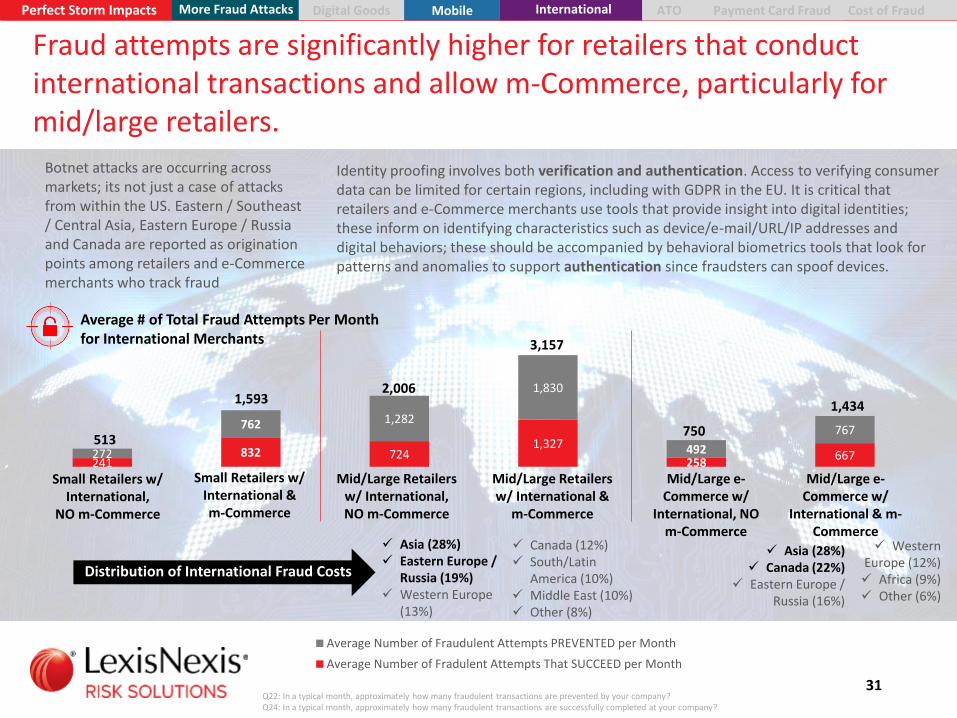
Fraud attempts are significantly higher for retailers that conduct international transactions and allow m-Commerce, particularly for mid/large retailers.
241832 724
1,327
258667272
762 1,282
1,830
492
767
Average # of Total Fraud Attempts Per Month for International Merchants
Average Number of Fraudulent Attempts PREVENTED per Month
Average Number of Fradulent Attempts That SUCCEED per Month
513
2,006
3,157
1,593
Q22: In a typical month, approximately how many fraudulent transactions are prevented by your company?Q24: In a typical month, approximately how many fraudulent transactions are successfully completed at your company?
Small Retailers w/ International,
NO m-Commerce
Small Retailers w/ International & m-Commerce
Mid/Large e-Commerce w/
International & m-Commerce
Mid/Large e-Commerce w/
International, NO m-Commerce
Perfect Storm Impacts Payment Card FraudATOMore Fraud Attacks Digital Goods International Cost of Fraud
Mid/Large Retailers w/ International &
m-Commerce
Mid/Large Retailers w/ International, NO m-Commerce
750
1,434
Botnet attacks are occurring across markets; its not just a case of attacks from within the US. Eastern / Southeast / Central Asia, Eastern Europe / Russia and Canada are reported as origination points among retailers and e-Commerce merchants who track fraud
Distribution of International Fraud Costs
Asia (28%) Canada (22%)
Eastern Europe / Russia (16%)
Asia (28%) Eastern Europe /
Russia (19%) Western Europe
(13%)
Mobile
Canada (12%) South/Latin
America (10%) Middle East (10%) Other (8%)
WesternEurope (12%) Africa (9%) Other (6%)
Identity proofing involves both verification and authentication. Access to verifying consumer data can be limited for certain regions, including with GDPR in the EU. It is critical that retailers and e-Commerce merchants use tools that provide insight into digital identities; these inform on identifying characteristics such as device/e-mail/URL/IP addresses and digital behaviors; these should be accompanied by behavioral biometrics tools that look for patterns and anomalies to support authentication since fraudsters can spoof devices.

More Fraud Attacks Digital Goods
Q12b: For identity-related fraud, what is the distribution of these by the following types of activities?.
32
Account login/take-overs and fraudulent creations represent the majority of identity-related fraud activity, particularly for e-Commerce merchants.
47% 45%
34%31%
26% 27%
34% 33%27% 28%
32%36%
Identity-Related Fraud: % Distribution by Activity
Smalle-Commerce Merchants
SmallRetailers
Mid/Large e-Commerce Merchants
Mid/Large Retailers
69%66%
Fraudulent purchase Account login/takeover Fraudulent account creation
Q12b: For identity-related fraud, what is the distribution of these by the following types of activities?• Account login (to hack, access or take over an account)• Account creation (fraudulently establish an account using other people’s identity/personal information
Significantly different from other segments
55%53%
One-third of identity-related fraud among e-Commerce merchants involves account takeovers, with a similar proportion involving fraudulent creation of new accounts. That said, there is still a sizeable level of this occurring in the remote channels used by bricks/mortar retailers (just over half of identity-related fraud activity).
Using breached data, fraudsters will continue to test passwords from one place to another in an attempt to find a match.
Perfect Storm Impacts Payment Card FraudATOInternational Cost of FraudMobile

Q12b: For identity-related fraud, what is the distribution of these by the following types of activities?.
33
Selling digital goods/services, allowing m-Commerce and conducting international transactions adds risk for takeovers and fraudulent creation of accounts.As mentioned earlier, new account creation is of particular interest to fraudsters seeking to nurture good credit and behavioralpatterns with synthetic identities, prior to “breaking out/breaking bad” on a significant fraudulent transaction.
Identity-Related Fraud: % Distribution by Activity
Account login/takeover Fraudulent account creation
Q12b: For identity-related fraud, what is the distribution of these by the following types of activities?• Account login (to hack, access or take over an account)• Account creation (fraudulently establish an account using other people’s identity/personal information
More Fraud AttacksPerfect Storm Impacts Payment Card FraudATO Cost of FraudDigital Goods Mobile International

Q18: Please indicate the percentage distribution of the payment methods used to commit fraud against your company.Q18e: Of your credit or debit related fraud losses, please indicate the distribution across the following types of card fraud.• Card Not Present fraud (fraudster knows the account number, expiration data and uses to transact remotely)• Card ID theft (criminals use details from a person’s card and use it to take over an account or open a new one)• Stolen or lost card use• Counterfeit card fraud (use of skimmed information; a fake magnetic strip holds the victim’s card details• Fake or doctored card fraud (magnetic strip is erased / replaced with data from other valid cards but won’t work when
swiped; fraudster convinces a merchant to enter details manually
34
Payment / credit card fraud has risen sharply during the past year for most retailers / merchants that sell digital goods, based largely on breached data (CNP fraud, card ID theft).It has spiked the most and is currently highest among mid/large e-Commerce merchants who offer digital goods, with 64% of losses by credit card compared to other payment methods; a significant portion of that relates to Card Not Present and Card Identity fraud.
With the introduction of EMV moving more fraud to remote channels, the use of counterfeit cards is low. For remote channel merchants, it is important to use velocity checks to assess whether there are repetitive patterns occurring with the same credit card information; tools that also assess behavioral risk and digital identities should be considered given the anonymous online channel and complexity of detecting synthetic identity fraud.
51%41%
49%
64%
18% 24% 13% 18%12% 15%
29%
13%19% 19%9% 4%
% Distribution of Fraud Losses by Payment Methods: Digital Goods 2018 - 2019
Credit cards Debits cards Alternative methods (PayPal, etc.) Other methods*
Small e-Commerce Merchants w/ Digital Goods
Mid/Large e-Commerce Merchants w/ Digital Goods
Mid/Large Retailers w/ Digital Goods
Significantly different from 2018 within Segment
*Other transaction method include cash, paper checks, gift cards, mobile device-based wallets, social media payments, and virtual currency
45% CNP/ID theft23% Stolen card
18% Counterfeit card15% Fake/doctored card
53% CNP/ID theft28% Stolen card
5% Counterfeit card3% Fake/doctored card
62% CNP/ID theft17% Stolen card
13% Counterfeit card8% Fake/doctored card
Small Retailers w/ Digital Goods
41% CNP/ID theft27% Stolen card
15% Counterfeit card14% Fake/doctored card
38% 18% 18% 26% 40% 23% 19% 18% 47% 16% 16% 21%41% 10% 26% 23%2018 with
Digital Goods
Perfect Storm ImpactsPerfect Storm Impacts Payment Card FraudATOInternational Cost of FraudMore Fraud Attacks MobileDigital Goods

Q18: Please indicate the percentage distribution of the payment methods used to commit fraud against your company.Q18e: Of your credit or debit related fraud losses, please indicate the distribution across the following types of card fraud.• Card Not Present fraud (fraudster knows the account number, expiration data and uses to transact remotely)• Card ID theft (criminals use details from a person’s card and use it to take over an account or open a new one)• Stolen or lost card use• Counterfeit card fraud (use of skimmed information; a fake magnetic strip holds the victim’s card details• Fake or doctored card fraud (magnetic strip is erased / replaced with data from other valid cards but won’t work when
swiped; fraudster convinces a merchant to enter details manually
35
Many digital goods retailers / e-Commerce merchants report a higher proportion of fraud losses to payment / credit cards than those selling physical goods only.
% Distribution of Fraud Losses by Payment Methods: Digital vs. Physical Goods (2019)
Credit cards Debits cards Alternative methods (PayPal, etc.) Other methods*
*Other transaction method include cash, paper checks, gift cards, mobile device-based wallets, social media payments, and virtual currency
44% 21% 9% 25% 52% 24% 8% 16% 43% 24% 29% 4%33% 13% 50% 4%2019 Physical
Goods Only
Directionally or significantly different from Physical Goods-Only Segment
Telecom Services, Software, Gaming, Music, Digital
Subscriptions, eLearningTelecom Services, Electronic SW,
Travel Booking, eGift Cards, Cloud-based Apps
Online Marketplaces; Gaming, Entertainment, Social Networking,
Digital Subscriptions, Software
Online Marketplaces; Telecom Services, Digital Subscriptions, Software, Social Networking,
eLearning, eBooks, Cloud-based Apps
Perfect Storm Impacts ATODigital Goods International Cost of FraudMore Fraud Attacks Mobile Payment Card Fraud
51%41%
49%
64%
18% 24% 13% 18%12% 15%
29%
13%19% 19%9% 4%
Small e-Commerce Merchants w/ Digital Goods
Mid/Large e-Commerce Merchants w/ Digital Goods
Mid/Large Retailers w/ Digital Goods
Small Retailers w/ Digital Goods
While payment fraud occurs for both physical and digital goods, fraudsters tend to prefer digital goods/services based on various reasons, including: the speed to obtain; the ability to leverage remote channel anonymity; the ability to launch mass automated bots where merchants are not using advanced authentication tools; and, the opportunity to quickly resell these types of goods on other sites.

36Q16a: In thinking about the total fraud losses suffered by your company, please indicate the distribution of various direct fraud costs over the past 12 months.
Perfect Storm Impacts Payment Card FraudATOMore Fraud Attacks Digital Goods International Cost of FraudMobile
Not surprisingly, fraud costshave risen and are highest for mid/large retailers and e-Commerce merchants that sell digital goods. But, the mobile channel sends costs higher.
$2.68
$2.04
$2.75 $2.50$2.52
$2.25
$3.27
$2.62$2.82
$2.35
$3.38$2.97
$2.54 $2.32
$3.50$3.11
Small Retailers w/ Digital
Goods
Mid/Large Retailers w/
Digital Goods
Mid/Large e-Commerce
Merchants w/ Digital Goods
Mid/Large e-Commerce
Merchants w/ Physical Goods
Only
Mid/Large Retailers w/
Physical Goods Only
Small Retailers w/ Physical Goods Only
Small e-Commerce
Merchants w/ Digital Goods
Small e-Commerce
Merchants w/ Physical Goods
Only
Mid/large retailers selling digital goods and using the mobile channel have experienced a significant jump in fraud costs over 2018 (every $1 of fraud costs them $3.40 compared to $2.91 previously).
However, mid/large e-Commerce merchants selling digital goods and using the mobile channel have the highest cost of fraud (every $1 of fraud
costs them $4.06).
With m-Commerce
$4.06 (2019)
With m-Commerce
$2.91 (2018) - $3.40 (2019)
See Appendix for further details
LexisNexis Fraud Multiplier℠
2018 2019

Retailers and e-Commerce merchants most at-risk for attack may not be optimizing solutions and approaches to fight newer and more complex types of fraud.
5

Q26: Does your company track the cost of fraudulent transactions by payment channels or methods? Track successful fraud by payment channels or methods?
38
Tracking all of the ways that fraud impacts the business is essential –both successful and prevented by channel and payment methods.
Mid/large e-Commerce merchants that sell digital goods have been most at-risk and hit hardest by retail fraud in recent years; this appears to have driven significantly more of them to add more rigorous tracking to their approaches.
However, other segments continue to be slower to implement this activity, particularly with regard to the different channels where fraud can penetrate their business. This weakens efforts to fully detect and mitigate fraud as criminals constantly probe for the weakest links.
22%
44%33% 29%
64%49% 59% 58%
33%
68%
38% 32% 34%
53%
21%
% Merchants Tracking SUCCESSFUL & PREVENTED Fraud
Transactions by Payment Method
% Merchants Tracking SUCCESSFUL & PREVENTED Fraud
Transactions by Channel
56%69%
53%43%
92%
41%59%
63%54%
71%
28%18% 17%
35%
4%
Track Prevented
Track Successful
Does Not Track
Mid/Large Retailers w/ Physical Goods Only
Small Retailersw/ Digital Goods
Mid/Large e-Commerce Merchants w/Digital Goods
Mid/Large Retailersw/ Digital Goods
Small e-Commerce Merchants w/ Digital Goods
2018 31% 45% 40% 60% 71% 14% 42% 50% 41% 26% 36% 56% 48% 65% 26%
2018 26% 67% 29% 71% 67% 11% 50% 52% 35% 23% 42% 55% 65% 50% 23%
Significantly different from 2018 within Segment

Q41b: What is the percentage distribution of mitigation costs across the following areas in the past 12 months?
39
Retail and e-Commerce merchants continue to allocate a sizeable portion of their risk mitigation budgets to manual efforts.
That is typically an every-increasing cost, since labor generally doesn’t get cheaper over time.
While e-Commerce merchants allocate somewhat more of their budgets to fraud solutions, over-one quarter is still represented by manual reviews.
40%43%
38%
55%49%
31%27%
22%27% 29%28% 29%
39%
14%
23%
Cost of fraud solutions Cost of manual reviews Cost of physical security
Mid/Large Retailers w/ Physical Goods Only
Small Retailersw/ Digital Goods
Mid/Large e-Commerce Merchants w/Digital Goods
Mid/Large Retailersw/ Digital Goods
Small e-Commerce Merchants w/ Digital Goods
Significantly different from 2018 within Segment
2018 45% 23% 26% 42% 29% 29% 44% 27% 28% 64% 17% 15% 52% 25% 23%
Distribution of Fraud Mitigation Costs by Percent of Spend

40
Fraud has become more complex; various risks can occur at the same time with no single solution. Fraud tools need to authenticate both digital and physical criteria as well as both identity and transaction risk.
Basic Verification verifying name, address, DOB or providing a CVV code associated with a card (Solution examples: check verification services; payment instrument authentication; name/address/DOB verification)
Authenticating the physical person
Active ID Authentication use of
personal data known to the customer for authentication; or where user provides two different authentication factors to verify themselves (Solution examples: authentication by challenge or quiz; authentication using OTP / 2 factor)
Digital identity / behavioral biometrics: analyzes human-device
interactions and behavioral patterns such as mouse clicks and keystrokes, to discern between a real user and an impostor by recognizing normal user and fraudster behavior (Solution examples: authentication by biometrics; e-mail/phone risk assessment; browser/malware tracking; device ID / fingerprinting)
Device assessment: uniquely
identify a remote computing device or user (Solution examples: device ID / fingerprint; geolocation)
Authenticating the digital person
Assessing the transaction risk
Velocity checks / transaction scoring: monitors historical shopping
patterns of an individual against their current purchases to detect if the number of orders by the cardholder match up or if there appears to be an irregularity (Solution examples: real-time transaction scoring; automated transaction scoring)
Solution Options
Fraud Issues
Account-related fraud: breached data
requires more levels of security, as well as authenticating the person from a bot or synthetic ID
Digital Goods & Services: fast transactions,
easy synthetic identity and botnet targets; need velocity checking to determine transaction risk along with data and analytics to authenticate the individual
Botnet attacks: mass human or
automated attacks often to test cards, passwords/credentials or infect devices
Mobile channel: source
origination and infected devices add risk; mobile bots and malicious malware makes authentication difficult; need to assess the device and the individual
Synthetic identities: need to
authenticate the whole individual behind the transaction in order to distinguish from fake identity based on partial real data

Q27: Which of the following fraud solutions does your company currently use?
41
Mid/large retailers selling digital goods have been an ongoing fraud target and have invested in more solutions than other segments. But, use of solutions to counter new threats is limited across segments.
Fraud Mitigation Solutions Usage*
30% 33%26%
19%27%
19%21%
31%38%
30%
42%
19% 22% 21% 19%
46%55%
46%41% 42% 39% 38%
33%38% 37%
46%38%
30%
41% 41%
Advanced Identity & Transaction
Verification Solutions
Basic Verification & Transaction Solutions
Advanced Identity Authentication Solutions
Check Verification
Authenticate Using Payment
Instrument
Name Address DOBVerification
Positive & Negative
Lists
Authenticate by Challenge
Questions
Authenticate by Quiz or KBA
AuthenticateUsing OTP/2
Factor
Authenticate Using
Biometrics
Email Risk &
Verification
Phone # Risk &
Verification
Browser/ Malware Tracking
Geolocation Device ID
Fingerprint
Real-TimeTransaction
Scoring
Automated Transaction
Scoring
Small Retailers w/ Digital Goods Mid/Large Retailers w/ Digital Goods
Mid/Large Retail w/ Physical Goods Only
48% 69% 37% 19% 17% 13% 14% 21% 34% 28% 24% 15% 11% 26% 15%
*Solutions list was modified in 2019, making it difficult to trends from previous wavesSignificantly different from other Segment
Passive/Digital Identity-basedActive/Interactive
The complexity of synthetic identity fraud and botnet attacks requires more sophisticated solutions to assess the whole person from a digital behavioral and physical identity perspective. The limited use of these explains the challenges highlighted earlier with identity verification, botnet attacks and account-related fraud.
Small retailers with digital goods and mid/large retailers with physical goods-only are particularly at risk; more of them have entered the m-Commerce space yet few have invested in solutions to detect the unique risks posed by this channel.

Q27: Which of the following fraud solutions does your company currently use?
42
Mid/large e-Commerce merchants using the mobile channel get hit hardest and are more likely to use a fraud mitigation solution than others, including mid/large retailers.
Fraud Mitigation Solutions Usage*
27% 24% 24%32%
17% 21%
6% 5%
33%25%
36%26% 23%
34% 33%23%
63%
39%
17%
49% 51%
33%26%
57%
36%
56% 58%
21% 22%
51%
Advanced Identity & Transaction
Verification Solutions
Basic Verification & Transaction Solutions
Advanced Identity Authentication Solutions
Check Verification
Authenticate Using Payment
Instrument
Name Address DOBVerification
Positive & Negative
Lists
Authenticate by Challenge
Questions
Authenticate by Quiz or KBA
AuthenticateUsing OTP/2
Factor
Authenticate Using
Biometrics
Email Risk &
Verification
Phone # Risk &
Verification
Browser/ Malware Tracking
Geolocation Device ID
Fingerprint
Real-TimeTransaction
Scoring
Automated Transaction
Scoring
Small e-Commerce w/ m-Commerce Mid/Large e-Commerce w/ m-Commerce
*Solutions list was modified in 2019, making it difficult to trends from previous wavesSignificantly different from other Segment
Passive/Digital Identity-basedActive/Interactive
However, the use of more sophisticated solutions to address the emerging multi-faceted nature of fraud is still limited among these larger e-Commerce merchants, particularly with regard to behavioral biometrics and other digital identity solutions that can fight synthetic identity fraud and botnet attacks. Given similar incidence rates between some of the physical (payment instrument, authenticate by challenge or KBA) and digital authentication solutions (e-mail risk, browser/malware tracking and geolocation), suggests that some of these larger merchants are layering these together for more effective fraud detection. That said, there is still a sizeable portion of merchants who are not doing so.
e-Commerce merchants have been slower to adopt the mobile channel than brick/mortar retailers; lower incidence of solutions thatcan support this channel, such as device ID/fingerprint and phone number risk, suggests that they are applying solutions from their online channel to the mobile one. However, these are two different types of technology and risk; current solutions may not help detect mobile channel fraud as effectively.

45%34% 29%
Average Percent of Monthly Manual Reviews & Successful Fraud Volume
Layers of Protection Basic Multi-Layered Multi-Layered with Digital Identity Data
Common Core Solutions Used Most Often
Check Verification, Authentication by Payment Instrument (CVV), Name/Address/DOB Verification, Positive/Negative Lists
Layering of Advanced Identity Solutions (including Digital Identity Data)
Device ID Fingerprinting, Geolocation, Browser/Malware Tracking, e-Mail/Phone Risk Verification, Authentication by Biometrics, Authentication by OTP/2 Factor, Authentication by Quizzes, Authentication by Challenge Questions
Layering of Fraud Transaction Risk Assessment Solutions
Automated Transaction Scoring, Real-Time Transaction Tracking,
43
It is important to layer both identity authentication and fraud transaction risk assessment solutions, as well as the physical anddigital identity factors.The study findings show that digital m-Commerce retailers and e-Commerce merchants who layer core + identity + fraud transaction solutions which include digital identity data send fewer monthly transactions for manual review and experience fewer successful fraud attacks on average.
% Monthly Transactions Sent for Manual Review
Average # Successful Fraud Attempts per Month1,054
692
253

The study findings also show that those using this type of layering approach have lower fraud costs ($2.60 for every $1 of fraud) than those which use only a limited set of core solutions (up to $3.17 per $1 of fraud). The cost is even higher for larger retailers that sell digital goods via the mobile channel and do not layer solutions to address these unique transaction/channel risks.
$3.17$2.79 $2.60
Digital m-CommerceRetailers/Merchants with Limited
Solutions
Digital m-CommerceRetailers/Merchants Layering
Advanced Identity and TransactionRisk Solutions
Digital m-CommerceRetailers/Merchants Layering
Advanced Identity & Transaction Risk(+Digital Identity Data)
LexisNexis Fraud Multiplier℠ by Number & Layering of Fraud Mitigation Solutions
Layers of Protection Basic Multi-Layered Multi-Layered with Digital Identity Data
Common Core Solutions Used Most Often
Check Verification, Authentication by Payment Instrument (CVV), Name/Address/DOB Verification, Positive/Negative Lists
Layering of Advanced Identity Solutions (including Digital Identity Data)
Device ID Fingerprinting, Geolocation, Browser/Malware Tracking, e-Mail/Phone Risk Verification, Authentication by Biometrics, Authentication by OTP/2 Factor, Authentication by Quizzes, Authentication by Challenge Questions
Layering of Fraud Transaction Risk Assessment Solutions
Automated Transaction Scoring, Real-Time Transaction Tracking,
44
This can translate into a lower cost of fraud when using a layered solution approach involving digital identity data.
$3.84 for Mid/Large selling digital goods via the mobile channel

Recommendations

When implementing unique solutions, it is essential to use a multi-layered approach, particularly when selling digital goods in the mobile channel.
Fraud should be assessed for both the identity of the “customer” as well as the risk of the transaction. • Identity verification / authentication is
important for letting legitimate customers in with the least amount of friction.
• Transaction verification is about assessing the nature of the activity in order to keep fraudsters out.
A layered approach can reduce costs associated with manual reviews and successful fraud attacks.
46
Recommendations
21Retailers and e-Commerce merchants need to implement unique risk mitigation solutions for different business models. There is no one-size-fits-all solution.
Solutions used to mitigate risk with physical goods transactions won’t fully mitigate risk with digital goods transactions since the nature of the goods changes the risk.
Different challenges and risks are posed by mobile channels versus online, given the difference in technology. Coupled with digital goods, this increases the complexity such that the need for device-specific, real-time / velocity checking and digital behavior solutions become even more important.

47
Recommendations (cont.)
3To effectively fight fraud generated by botnets and synthetic identities, it is important to combine physical and digital identity data and analysis to get the full view of the “customer”.
Botnets and synthetic identities are difficult to detect using traditional risk mitigation solutions because they can mimic real persons and transactions. Using traditional identifiable data alone may miss these.
Digital identity and behavioral biometrics data and analysis is essential for detecting anomalies based on device use, linkages, remote channel behaviors, locations and patterns. This will also support machine learning in order to prevent fraud before it occurs. Combining digital with physical identification data provides a comprehensive view for distinguishing between the real and synthetic or botnet “customer”.

A multi-layered solution approach is useful to protect retailers and e-Commerce merchants throughout a single buyer experience.
Using different solutions to support fraud detection at various points in the shopping journey will strengthen overall protection.
An example of this could involve:• Velocity checks / real-time scoring at the frontend to determine risk of the transaction; for account
access, the use of multiple screening tools, including two-factor authentication, is important since fraudsters are experts at knowing the types of information that can get them through screening;
• Digital identity and behavioral biometrics can be used to assess the customer “browsing” period (fraudsters tend to know exactly where to go and act more quickly than a typical shopper – this would help to assess anomalies);
• Upon checkout / authorization, additional authentication checks can assess the individual.
• The use of passive, analytics-driven solutions will provide a more seamless and frictionless experience for the customer, including reducing the time involved for fraud assessment.
48
Recommendations (cont.)
4

49
Recommendations (cont.)
5Retailers and e-Commerce merchants need to track both payment and channel fraud in terms of costs and successful attempts. This needs to be part of the broader approach alongside fraud mitigation solutions.
Since fraud occurs in different ways depending on the type of goods and channels, this creates multiple endpoints that fraudsters can attack.
They continue to test for the weakest links. Knowing where they’ve been successful is important in order to plug the gaps. But, also knowing where they’ve been thwarted is important too; they will continue to test these access points.

LexisNexis® Risk Solutions can help

LexisNexis® Risk Solutions provides powerful identity verification, identity authentication and transaction scoring tools to combat fraud.
LexisNexis® Risk Solutions:
Identity Verification• Validate name, address and phone information• Reconcile name variations, duplicates, multiple addresses, and myriad other inconsistencies and
linkages• Perform global identity checks with seamless integration and reporting capabilities
Transaction Risk Scoring• Identify risks associated with bill-to and ship-to identities with a single numeric risk score• Quickly detect fraud patterns and isolate high-risk transactions • Resolve false-positive and Address Verification Systems failures
Manual Research Support• Access billions of data records on consumers and businesses• Discover linkages between people, businesses and assets• Leverage specialized tools for due diligence, account management and compliance
Identity Authentication• Authenticate identities on the spot using knowledge-based quizzes• Dynamically adjust security level to suit risk scenario• Receive real-time pass/fail results
Vast Data Resources
Big Data Technology
Linking &Analytics
Industry-Specific Expertise & Delivery
Customer-Focused Solutions
For more information: visit https://www.lexisnexis.com/risk/retail or call 800.869.075151

This document is for educational purposes only and does not guarantee the functionality or featuresof LexisNexis products identified. LexisNexis does not warrant this document is complete or error-free.
LexisNexis and the Knowledge Burst logo are registered trademarks of RELX Inc., used under license. LexisNexis Fraud Multiplier is a service mark of RELX Inc. True Cost of Fraud is a service mark of LexisNexis Risk Solutions Inc.
Copyright © 2019 LexisNexis. NXR12535-00-0918-EN-US

Appendix

32% 29%23%
35%
26%
15% 16% 22%
11%
47%
22%
30%
22%
29%26% 22%
31%
18% 15%21% 17%
32%35%
20%
36%
24%17% 18% 19% 18%
43%
30% 29% 29% 28% 27% 27%23% 18% 18%
15% 15%
Q20: Please rank the top 3 challenges related to fraud faced by your company when serving customers in the Mobile Channel.
54
There is increased recognition that remote channel transactions make identity verification challenging, with significantly more retailers ranking this as a top issue compared to 2018.
Top 3 Ranked Online Fraud Challenges
n/a* n/a* n/a*
*Not asked in 2018
Significantly different from 2018
E-mail / device verification and the emergence of new / varied transaction methods are ranked higher as a mobile channel challenge compared on online.
Verification of customer identity
Email or device
verification
Inability to distinguish
between human and malicious bot
transactions
Emergence of new and varied
transaction methods
Inability to determine the
source/origination of transaction
Address verification
Phone verification
Balancing fraud prevention
friction with customer
experience
Challenges in acceptance of
int’l-based transaction
methods
Assessment of fraud risk
by country/region
Lack of specialized fraud prevention tools for int’l orders/
transactions
Excessive manual order
reviews
Top 3 Ranked Mobile Fraud Challenges
2018 2019
+ Significantly different from Online or Mobile
++
+

42%
27%34% 32%
21%26%
19%
36%
22%
8% 11%
23%
38%
15%
40%
30% 27%
18%25%
34%27%
16%10%
19%
60%
34%39% 41%
25% 20%
4%
41%
11%5%
3%8%
46%
33%27%
16% 16%
29%
8%
35%
23%15%
22%17%
Q19aa/bb: Please rank the top 3 challenges related to fraud faced by your company when selling digital goods.
55
Identity verification is a key issue for all retail and e-Commerce segments when selling digital goods in the mobile channel.
Top 3 Ranked Challenges When Selling Digital Goods
Small Retailers w/ m-Commerce Mid/Large Retailers w/ m-Commerce
This correlates to another commonly top ranked challenge with digital goods, balancing fraud prevention with customer friction. Particularly for retailers, this also impacts the ability to distinguish between legitimate and malicious bot transactions.
Verification of customer identity
Email or device
verification
Inability to distinguish
between human and malicious bot
transactions
Emergence of new and varied
transaction methods
Inability to determine the
source/origination of transaction
Addressverification
Phoneverification
Balancing fraud prevention
friction with customer
experience
Challenges in acceptance of
int’l-based transaction
methods
Assessment of fraud risk
by country/region
Lack of specialized fraud prevention tools for int’l orders/
transactions
Excessive manual order
reviews
Small e-Commerce Merchants w/ m-Commerce Mid/Large e-Commerce Merchants w/ m-Commerce
+ Significantly different between small retail and e-Commerce merchants or between mid/large retail and e-Commerce merchants
+
+
++
But there are also many other challenges that these merchants face. Since the survey question asked respondents to rank only their top 3, and the findings show limited consensus (high percentages) for any one challenge, this indicates that various respondents choose different top issues - suggesting that the combination of mobile and digital goods is a more complex minefield of fraud risks.
33% selling internationally
31% selling internationally
37% selling internationally

56
$2.91 $2.78$2.88$3.40
$2.93
$4.06
As fraud volumes increase, so too do fraud costs. Those using the mobile channel and selling digital goods have higher fraud costs than non-m-Commerce merchants, particularly mid/large e-Commerce.
Q16a: In thinking about the total fraud losses suffered by your company, please indicate the distribution of various direct fraud costs over the past 12 months.
Small Retailers w/ Digital Goods & m-
Commerce
Mid/Large Retailersw/ Digital Goods &
m-Commerce
Mid/Large e-Commerce
Merchants w/ Digital Goods & m-Commerce
Mid/Large Retailers w/ Physical Goods Only &
m-Commerce
LexisNexis Fraud Multiplier℠
2018 2019
Mid/large retailers selling digital goods and using the mobile channel have experienced a significant jump in fraud costs over 2018 (every $1 fraud costs them $3.40 compared to $2.91 previously).
However, mid/large e-Commerce merchants selling digital goods and using the mobile channel have the highest cost of fraud (every $1 of fraud costs them $4.06).
n/a* n/a*
*N too small to report
Perfect Storm Impacts Payment Card FraudATOMore Fraud Attacks Digital Goods International Cost of FraudMobile

57
$2.68
$2.04
$2.75$2.50 $2.52
$2.25
$3.27
$2.62$2.82
$2.35
$3.38$2.97
$2.54 $2.32
$3.50$3.11
Not surprisingly, the cost of fraud is highest for mid/large retailers and e-Commerce merchants that sell digital goods. Other segments have seen spikes since last year as well.
Q16a: In thinking about the total fraud losses suffered by your company, please indicate the distribution of various direct fraudcosts over the past 12 months.
Small Retailersw/ Digital
Goods
Mid/Large Retailers w/
Digital Goods
Mid/Large e-Commerce
Merchants w/ Digital Goods
Mid/Large e-Commerce
Merchants w/ Physical Goods
Only
Mid/Large Retailers w/
Physical Goods Only
Small Retailersw/ Physical Goods Only
Small e-Commerce
Merchants w/ Digital Goods
Small e-Commerce
Merchants w/ Physical Goods
Only
LexisNexis Fraud Multiplier℠
2018 2019
Not only have mid/large retailers and e-Commerce merchants that physical goods-only experienced a nearly 20% year-over-year increase in the cost of fraud, but smaller retailers have experienced sharper rises too.
Perfect Storm Impacts Payment Card FraudATOMore Fraud Attacks Digital Goods International Cost of FraudMobile

Study findings show that fraud cost as a percent of revenues is significantly lower for retailers and e-Commerce merchants using a layered approach, particularly one that incorporates digital identity data.
2.22%
1.31%1.01%
Retailers/Merchants with LimitedSolutions
Retailers/Merchants LayeringAdvanced Identity and Transaction
Risk Solutions
Retailers/Merchants LayeringAdvanced Identity & Transaction Risk
(+Digital Identity Data)
Fraud Costs as a Percent of Revenues by Number & Layering of Fraud Mitigation
Solutions
Layers of Protection Basic Multi-Layered Multi-Layered with Digital Identity Data
Common Core Solutions Used Most Often
Check Verification, Authentication by Payment Instrument (CVV), Name/Address/DOB Verification, Positive/Negative Lists
Layering of Advanced Identity Solutions (including Digital Identity Data)
Device ID Fingerprinting, Geolocation, Browser/Malware Tracking, e-Mail/Phone Risk Verification, Authentication by Biometrics, Authentication by OTP/2 Factor, Authentication by Quizzes, Authentication by Challenge Questions
Layering of Fraud Transaction Risk Assessment Solutions
Automated Transaction Scoring, Real-Time Transaction Tracking,
58
The lower cost of fraud, based on a layered solution approach, can improve the financial bottom line.


