Americas Market Information and Forecasts US Staffing Industry Forecast April 2020 Update April 7, 2020 Timothy Landhuis, Director of Research, North America (industrial, education), [email protected]Matt Norton, Sr. Research Analyst (engineering), [email protected]Shweta Palekar, Research Analyst (IT), [email protected]David Papapostolou, Sr. Research Analyst (life sciences), [email protected]Curtis Starkey, Research Analyst (office/clerical), [email protected]Brian Wallins, Research Manager (IT), [email protected]Amy Chang, Healthcare Analyst, [email protected]
Transcript
Americas
Market Information and Forecasts
US Staffing Industry ForecastApril 2020 UpdateApril 7, 2020
Timothy Landhuis, Director of Research, North America (industrial, education), [email protected]
• The COVID-19 outbreak has brought an abrupt end to a decade of sustained growth in the US staffing industry, as we anticipate double digit revenue declines across most segments and sectors this year.
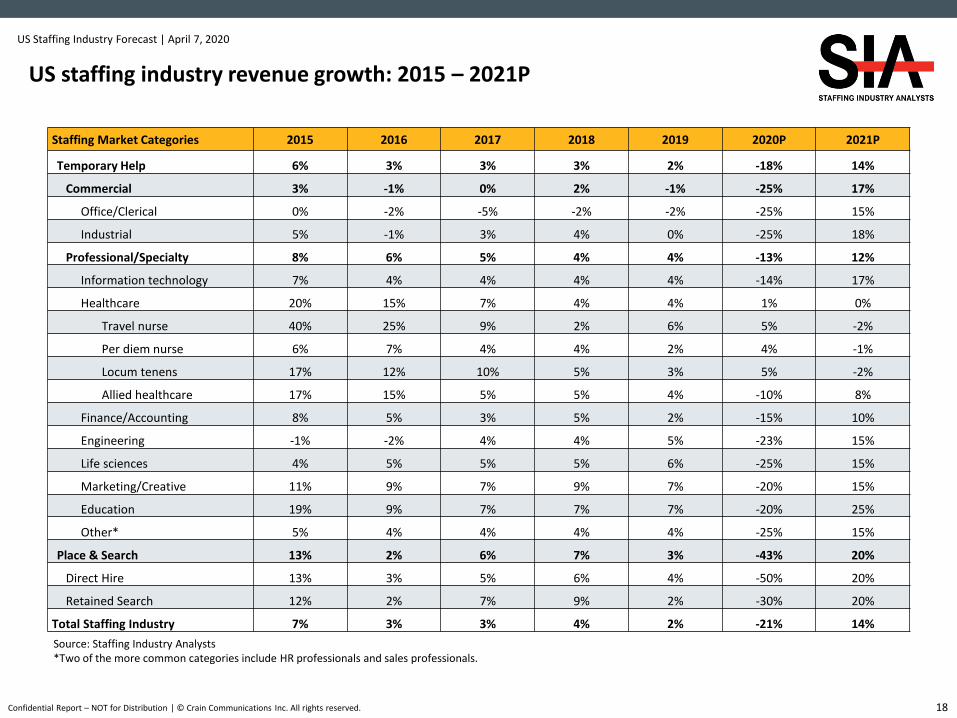
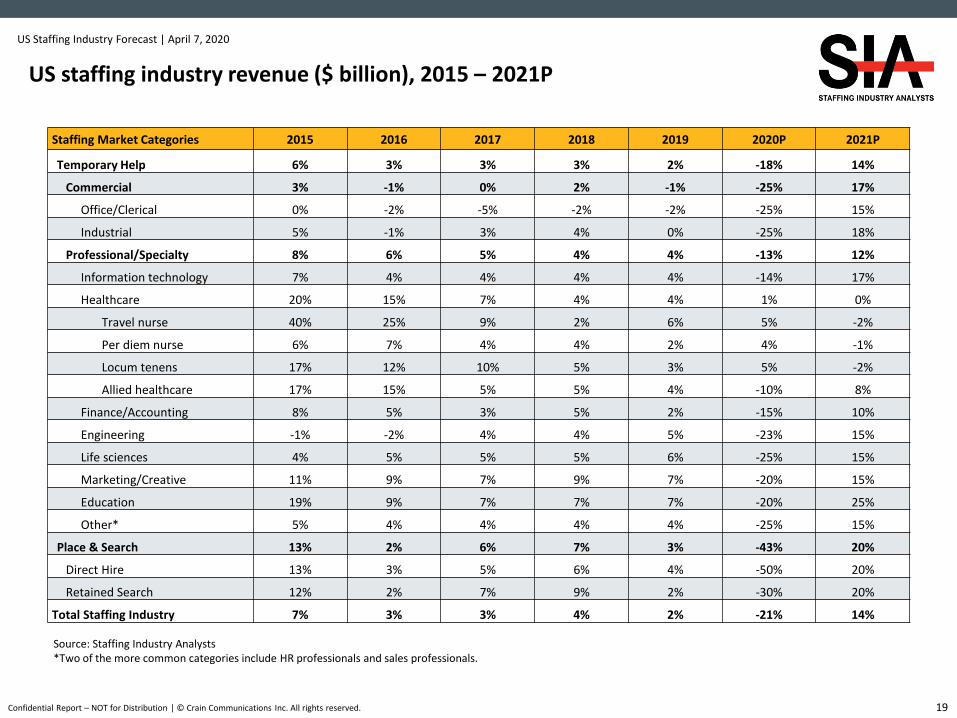
• Our base case scenario predicts a 21% revenue decline in the US staffing industry this year, reflecting a 17% drop in temporary staffing revenue and 43% decrease in place and search revenue. The only staffing skill segments projected to grow revenue in 2020 are related to healthcare: travel nurse (5%), per diem nurse (4%), and locum tenens (5%).
• Due to the unpredictability of the coronavirus outbreak and its sweeping impact on the US economy, we outline three roughly equally likely scenarios on page four—a shorter outbreak scenario, a base case scenario, and a longer outbreak scenario—to highlight the range of possible outcomes regarding the outbreak, US economy, and the US staffing industry. According to these likely scenarios, US staffing industry revenue is expected to decline either 10%, 21%, or 45%, respectively, this year.
• Based on our analysis of 2019 staffing firm revenue, we upgraded our 2019 growth estimate for travel nurse (6% from 4%), IT (4% from 3%), engineering (5% from 4%), and life sciences (6% from 5%) temporary staffing. Conversely, we downgraded our growth estimate for finance/accounting (2% from 4%), office/clerical (-2% from -1%), industrial (0% from 1%), per diem nurse (2% from 3%) temporary staffing, and direct hire (4% from 5%). In 2019, professional temporary staffing outpaced commercial staffing, 4% to -1%, respectively.
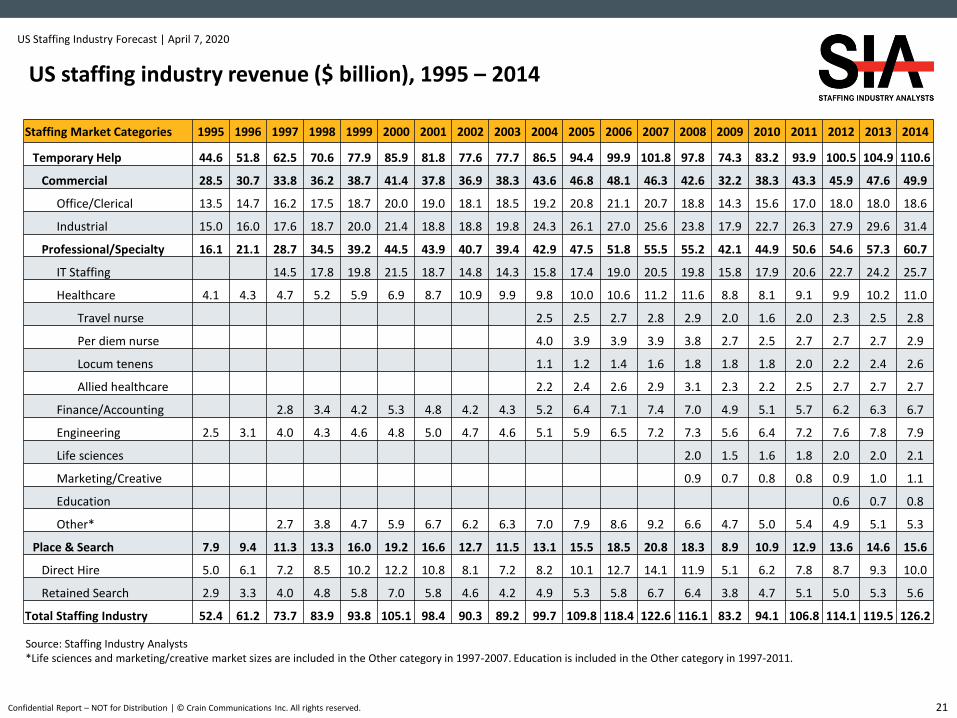
• Summary tables of our US staffing industry market size and growth projections from 1995 to 2021P can be found on pages 18 to 21.
Twice yearly, SIA publishes a comprehensive forecast of the US staffing industry, including market size and growth estimates for twelve occupational segments of temporary staffing, as well as for direct hire and retained search. These updates are published each April and September.
Due to the fast changing nature of the COVID-19 outbreak and accompanying economic impact, SIA intends to publish an interim update to the US Staffing Industry Forecast on July 7th.
US staffing industry revenue trends: 2019 results and 2020-21 outlook
3
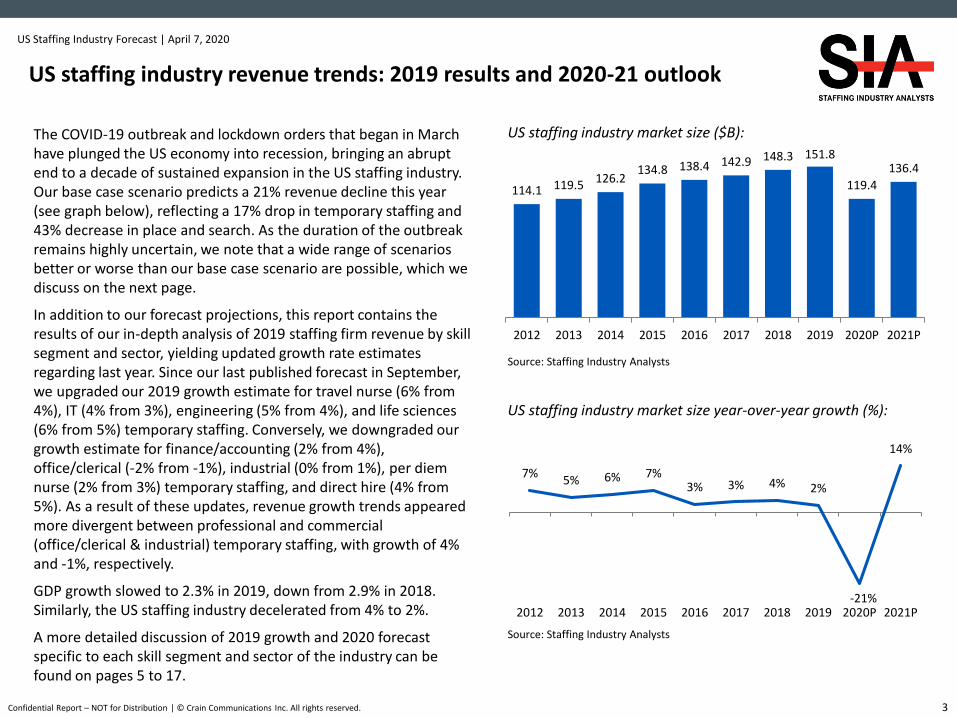
US staffing industry market size ($B):
Source: Staffing Industry Analysts
US staffing industry market size year-over-year growth (%):
Source: Staffing Industry Analysts
The COVID-19 outbreak and lockdown orders that began in March have plunged the US economy into recession, bringing an abrupt end to a decade of sustained expansion in the US staffing industry. Our base case scenario predicts a 21% revenue decline this year (see graph below), reflecting a 17% drop in temporary staffing and 43% decrease in place and search. As the duration of the outbreak remains highly uncertain, we note that a wide range of scenarios better or worse than our base case scenario are possible, which we discuss on the next page.
In addition to our forecast projections, this report contains the results of our in-depth analysis of 2019 staffing firm revenue by skill segment and sector, yielding updated growth rate estimates regarding last year. Since our last published forecast in September, we upgraded our 2019 growth estimate for travel nurse (6% from 4%), IT (4% from 3%), engineering (5% from 4%), and life sciences (6% from 5%) temporary staffing. Conversely, we downgraded our growth estimate for finance/accounting (2% from 4%), office/clerical (-2% from -1%), industrial (0% from 1%), per diem nurse (2% from 3%) temporary staffing, and direct hire (4% from 5%). As a result of these updates, revenue growth trends appeared more divergent between professional and commercial (office/clerical & industrial) temporary staffing, with growth of 4% and -1%, respectively.
GDP growth slowed to 2.3% in 2019, down from 2.9% in 2018. Similarly, the US staffing industry decelerated from 4% to 2%.
A more detailed discussion of 2019 growth and 2020 forecast specific to each skill segment and sector of the industry can be found on pages 5 to 17.
Potential scenarios for 2020 and their implications for the US staffing industry
4
Throughout this report, the 2020 and 20201 forecasts shown are based on our base case scenario analysis. However, due to the highly uncertain duration of the COVID-19 outbreak, it is crucial for business leaders to plan for the full range of likely outcomes. To help with such an analysis, we defined three roughly equally likely scenarios (shorter outbreak, base case, longer outbreak) and projected their implications for staffing industry revenue (see table.)
Scenario #1: Shorter outbreak. In this “V-shaped” recovery scenario, either the COVID-19 virus dissipates on its own or control of the outbreak is achieved via advances in testing, tracking, treatment, and/or prevention. Lockdown conditions are lifted in May and the economy returns to normalcy fairly rapidly.
Scenario #2: Base case. In this “U-shaped” scenario, lockdown is in effect for April, May, and June, at which time the virus weakens or becomes largely controlled through advances in testing, tracking, treatment, and/or prevention. The economy gradually recovers during the second half of the year, aided by massive government fiscal and monetary policy aid, and only modest to moderate negative economic impacts remain from the crisis (for example, higher unemployment, lower consumer spending, etc.) This scenario assumes the virus does not return significantly next winter or in additional waves of outbreaks, and that country governments around the world are able to control outbreaks.
Scenario #3: Longer outbreak. In this “W-shaped” scenario, lockdown continues for significant stretches of 2020, with ongoing threat of spread, and many countries struggling to contain the virus. As the “W” shape implies, the US comes out of lockdown and the economy improves temporarily, but then further outbreaks force a return of lockdowns and halts to business activity. Also, in this scenario, governments may exhaust their ability to use monetary and fiscal policy, exacerbating economic declines.
2020P 2021P
Shorter outbreak -10% 8%
Base case -21% 14%
Longer outbreak -45% 10%
US staffing industry revenue year-over-year change (%):Three plausible scenarios modelled by SIA
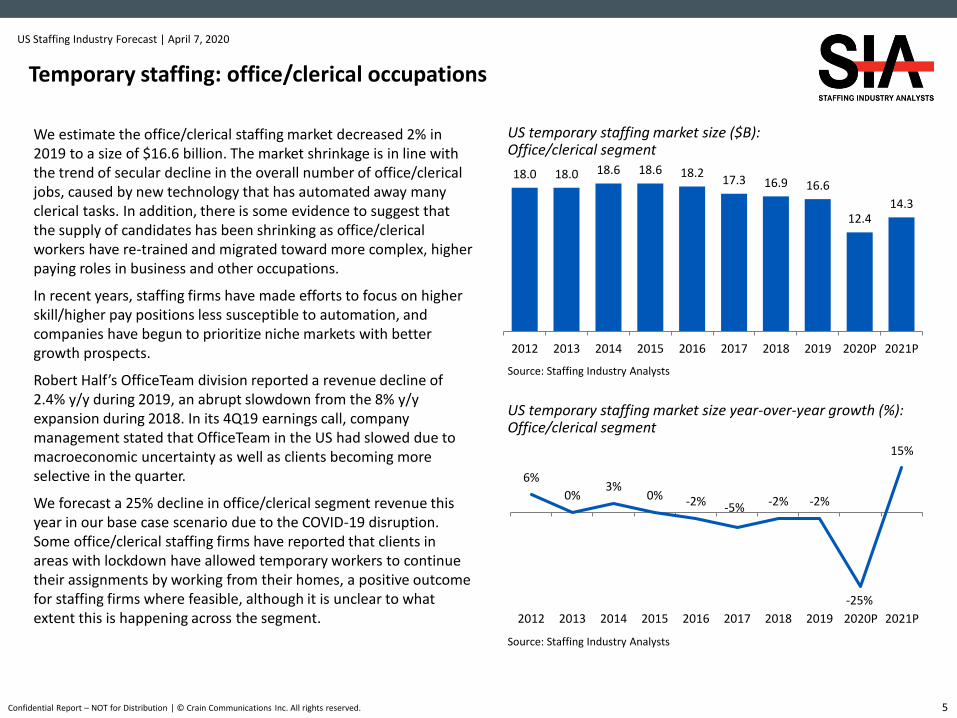
US temporary staffing market size ($B): Office/clerical segment
US temporary staffing market size year-over-year growth (%): Office/clerical segment
Source: Staffing Industry Analysts
Source: Staffing Industry Analysts
We estimate the office/clerical staffing market decreased 2% in 2019 to a size of $16.6 billion. The market shrinkage is in line with the trend of secular decline in the overall number of office/clerical jobs, caused by new technology that has automated away many clerical tasks. In addition, there is some evidence to suggest that the supply of candidates has been shrinking as office/clerical workers have re-trained and migrated toward more complex, higher paying roles in business and other occupations.
In recent years, staffing firms have made efforts to focus on higher skill/higher pay positions less susceptible to automation, and companies have begun to prioritize niche markets with better growth prospects.
Robert Half’s OfficeTeam division reported a revenue decline of 2.4% y/y during 2019, an abrupt slowdown from the 8% y/y expansion during 2018. In its 4Q19 earnings call, company management stated that OfficeTeam in the US had slowed due to macroeconomic uncertainty as well as clients becoming more selective in the quarter.
We forecast a 25% decline in office/clerical segment revenue this year in our base case scenario due to the COVID-19 disruption. Some office/clerical staffing firms have reported that clients in areas with lockdown have allowed temporary workers to continue their assignments by working from their homes, a positive outcome for staffing firms where feasible, although it is unclear to what extent this is happening across the segment.
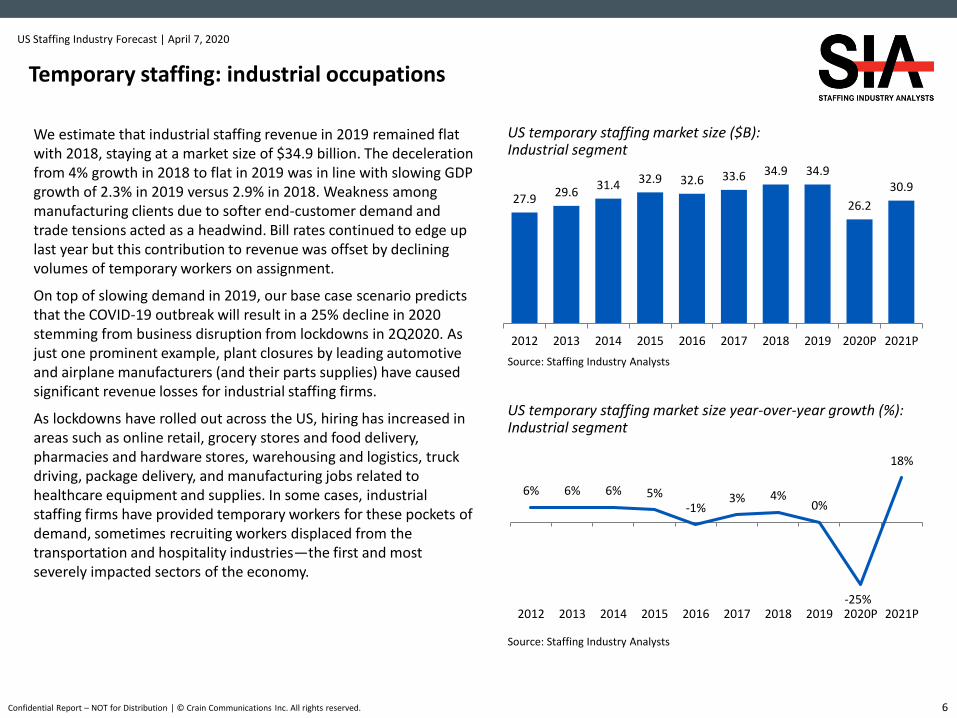
US temporary staffing market size ($B): Industrial segment
US temporary staffing market size year-over-year growth (%): Industrial segment
Source: Staffing Industry Analysts
Source: Staffing Industry Analysts
We estimate that industrial staffing revenue in 2019 remained flat with 2018, staying at a market size of $34.9 billion. The deceleration from 4% growth in 2018 to flat in 2019 was in line with slowing GDP growth of 2.3% in 2019 versus 2.9% in 2018. Weakness among manufacturing clients due to softer end-customer demand and trade tensions acted as a headwind. Bill rates continued to edge up last year but this contribution to revenue was offset by declining volumes of temporary workers on assignment.
On top of slowing demand in 2019, our base case scenario predicts that the COVID-19 outbreak will result in a 25% decline in 2020 stemming from business disruption from lockdowns in 2Q2020. As just one prominent example, plant closures by leading automotive and airplane manufacturers (and their parts supplies) have caused significant revenue losses for industrial staffing firms.
As lockdowns have rolled out across the US, hiring has increased in areas such as online retail, grocery stores and food delivery, pharmacies and hardware stores, warehousing and logistics, truck driving, package delivery, and manufacturing jobs related to healthcare equipment and supplies. In some cases, industrial staffing firms have provided temporary workers for these pockets of demand, sometimes recruiting workers displaced from the transportation and hospitality industries—the first and most severely impacted sectors of the economy.
US temporary staffing market size ($B): IT segment
US temporary staffing market size year-over-year growth (%): IT segment
Source: Staffing Industry Analysts
Source: Staffing Industry Analysts
Based on our analysis of trends, including extensive survey data from hundreds of US IT staffing firms, we estimate the US IT temporary staffing market reached a scale of $32.3 billion in 2019. This is an all-time high for the sector and represents 4% growth from 2018. It is also a tick above our prior forecast which anticipated 3% growth.
However, widespread economic disruption resulting from the COVID-19 pandemic leads us to slash our 2020 IT temporary staffing forecast dramatically. Our 2020 forecast goes from $33.0 billion (+3% y/y) to $27.8 billion (-14% y/y). This would signify the largest decline since 2009 (-20% y/y) and the third biggest drop since SIA has covered the sector dating back to 1994.
The range of possible outcomes is extremely wide at this time with little clarity around how long or how extensively the market will be impacted. The Conference Board is presently using a “Summertime V-shape” recovery base case scenario where the economy reboots in the July/August timeframe. Our forecast is roughly similar to this scenario. However, due to the fluidity of the situation it is difficult to offer much in the way of conviction at this time.
Currently, we believe a significant share of IT projects that buyers consider non-critical have been deferred as buyers reevaluate priorities. However, projects deemed to be essential are progressing relatively unencumbered.
US temporary staffing market size ($B): IT segment
US temporary staffing market size year-over-year growth (%): IT segment
Source: Staffing Industry Analysts
Source: Staffing Industry Analysts
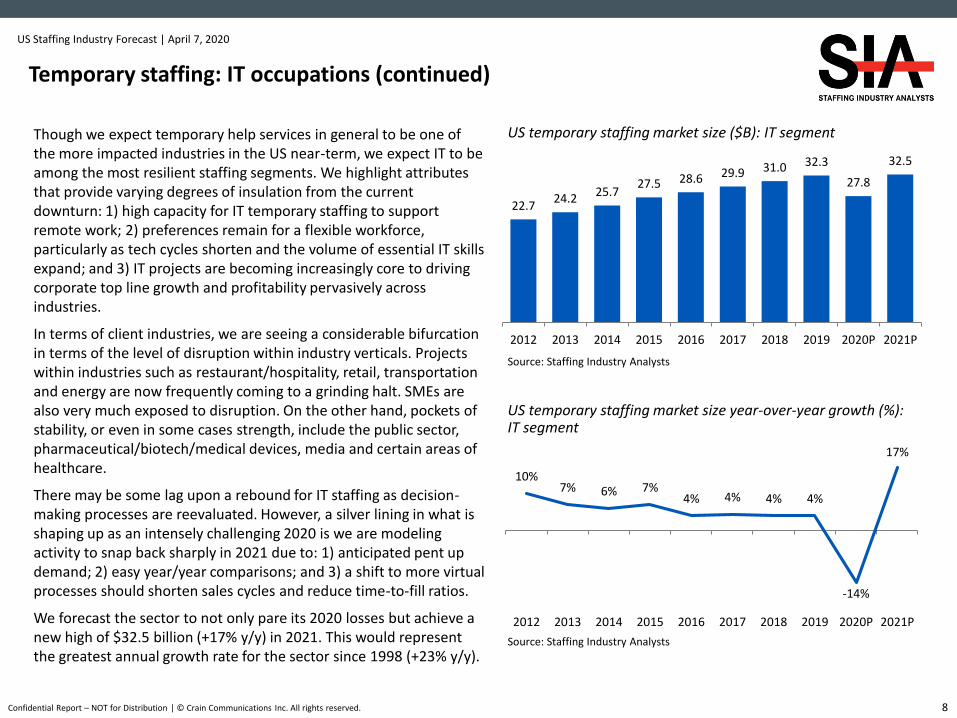
Though we expect temporary help services in general to be one of the more impacted industries in the US near-term, we expect IT to be among the most resilient staffing segments. We highlight attributes that provide varying degrees of insulation from the current downturn: 1) high capacity for IT temporary staffing to support remote work; 2) preferences remain for a flexible workforce, particularly as tech cycles shorten and the volume of essential IT skills expand; and 3) IT projects are becoming increasingly core to driving corporate top line growth and profitability pervasively across industries.
In terms of client industries, we are seeing a considerable bifurcation in terms of the level of disruption within industry verticals. Projects within industries such as restaurant/hospitality, retail, transportation and energy are now frequently coming to a grinding halt. SMEs are also very much exposed to disruption. On the other hand, pockets of stability, or even in some cases strength, include the public sector, pharmaceutical/biotech/medical devices, media and certain areas of healthcare.
There may be some lag upon a rebound for IT staffing as decision-making processes are reevaluated. However, a silver lining in what is shaping up as an intensely challenging 2020 is we are modeling activity to snap back sharply in 2021 due to: 1) anticipated pent up demand; 2) easy year/year comparisons; and 3) a shift to more virtual processes should shorten sales cycles and reduce time-to-fill ratios.
We forecast the sector to not only pare its 2020 losses but achieve a new high of $32.5 billion (+17% y/y) in 2021. This would represent the greatest annual growth rate for the sector since 1998 (+23% y/y).
US temporary staffing market size ($B): Healthcare segment
US temporary staffing market size year-over-year growth (%): Healthcare segment
Source: Staffing Industry Analysts
Source: Staffing Industry Analysts
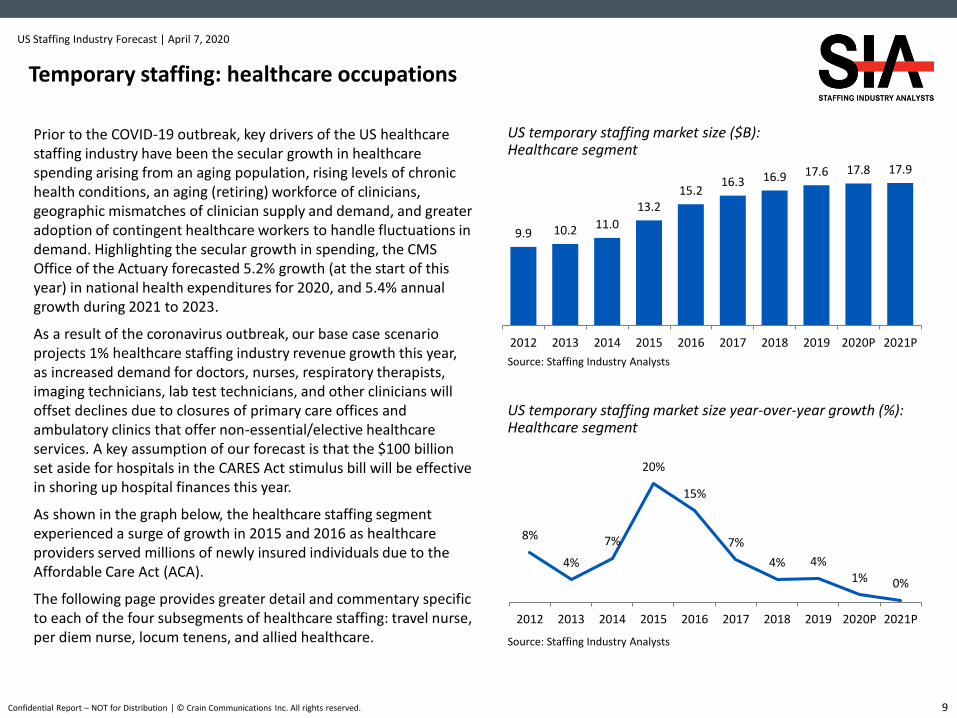
Prior to the COVID-19 outbreak, key drivers of the US healthcare staffing industry have been the secular growth in healthcare spending arising from an aging population, rising levels of chronic health conditions, an aging (retiring) workforce of clinicians, geographic mismatches of clinician supply and demand, and greater adoption of contingent healthcare workers to handle fluctuations in demand. Highlighting the secular growth in spending, the CMS Office of the Actuary forecasted 5.2% growth (at the start of this year) in national health expenditures for 2020, and 5.4% annual growth during 2021 to 2023.
As a result of the coronavirus outbreak, our base case scenario projects 1% healthcare staffing industry revenue growth this year, as increased demand for doctors, nurses, respiratory therapists, imaging technicians, lab test technicians, and other clinicians will offset declines due to closures of primary care offices and ambulatory clinics that offer non-essential/elective healthcare services. A key assumption of our forecast is that the $100 billion set aside for hospitals in the CARES Act stimulus bill will be effective in shoring up hospital finances this year.
As shown in the graph below, the healthcare staffing segment experienced a surge of growth in 2015 and 2016 as healthcare providers served millions of newly insured individuals due to the Affordable Care Act (ACA).
The following page provides greater detail and commentary specific to each of the four subsegments of healthcare staffing: travel nurse, per diem nurse, locum tenens, and allied healthcare.
US temporary staffing market size ($B) and y/y growth: Healthcare segments
Source: Staffing Industry Analysts
We estimate that the travel nurse segment grew 6% in 2019 to reach a market size of $5.7 billion. This is an upgraded growth rate from the 4% that we previously forecasted last September. We believe the supply of travel nurses has benefited from the continued expansion of the Enhanced Nursing Licensure Compact (eNLC), which now includes 34 states after the addition of New Jersey last July. We forecast 5% growth this year, in part due to demand at hospitals and clinics related to COVID-19 testing and treatment.
The per diem nurse segment expanded 2% last year by our estimates. This represents a slight downgrade from our previous forecast of 3% growth. We anticipate the segment may grow 4% this year, in part due to demand related to COVID-19.
We project 5% growth this year in staffing revenue related to physicians and advanced practitioners (locum tenens), in part due to demand related to treating COVID-19. We note that the longer that lockdown orders run and elective healthcare is postponed, the greater the risk to demand for physicians in specialties not related to COVID-19 treatment, such as surgeons.
We forecast a 10% decline this year in the allied healthcare segment, related to the lockdown postponement of physical therapy and occupational therapy, and also lower therapy volume caused by the implementation of the PDPM reimbursement model at skilled nursing facilities that began last October. On the positive side, the COVID-19 outbreak is expected to bring increased demand for respiratory therapists, imaging technicians, and lab testing technicians.
Industry segment ($B) 2016 2017 2018 2019 2020P 2021P
US temporary staffing market size ($B): Engineering segment
US temporary staffing market size year-over-year growth (%): Engineering segment
Source: Staffing Industry Analysts
Source: Staffing Industry Analysts
The engineering temporary staffing market grew by 5% in 2019, a slight upgrade to our 4% forecast made last September. Last year, the segment was characterized by strong demand and growth was tied to a strong macroeconomic climate and wage inflation.
However, our previous forecast of 3% growth this year must be downgraded owing to both the coronavirus outbreak and the sharp decline in the price of oil. The financial impact on the segment is difficult to quantify due to the progressive spread and the unpredictable duration of the pandemic.
In the short term, we are seeing significant volatility. The pandemic is forcing engineering companies of all kinds and sizes to instantly recalibrate their hiring and growth strategies. Concerns about the spread of coronavirus have forced most of North America's auto plants to close, at least temporarily. Similarly, engineering projects (and assignments) are being halted, delayed or cancelled. The precipitous oil price decline following the absence of an agreement amongst the OPEC+ countries on further production cuts only served to exacerbate the sense of uncertainty. Lower oil prices heighten the financial pressure on energy companies while the reaction on the demand side will be muted due to the epidemic.
The severity of the downturn will only become apparent in the coming weeks/months depending on the peak of the outbreak and when the scale of engineering project reductions, delays and cancellations is better known. Our 2021 forecast is largely governed by the severity of the 2020 recession which will determine the pace and scale of the corresponding recovery.
US temporary staffing market size ($B): Finance/accounting segment
US temporary staffing market size year-over-year growth (%): Finance/accounting segment
Source: Staffing Industry Analysts
Source: Staffing Industry Analysts
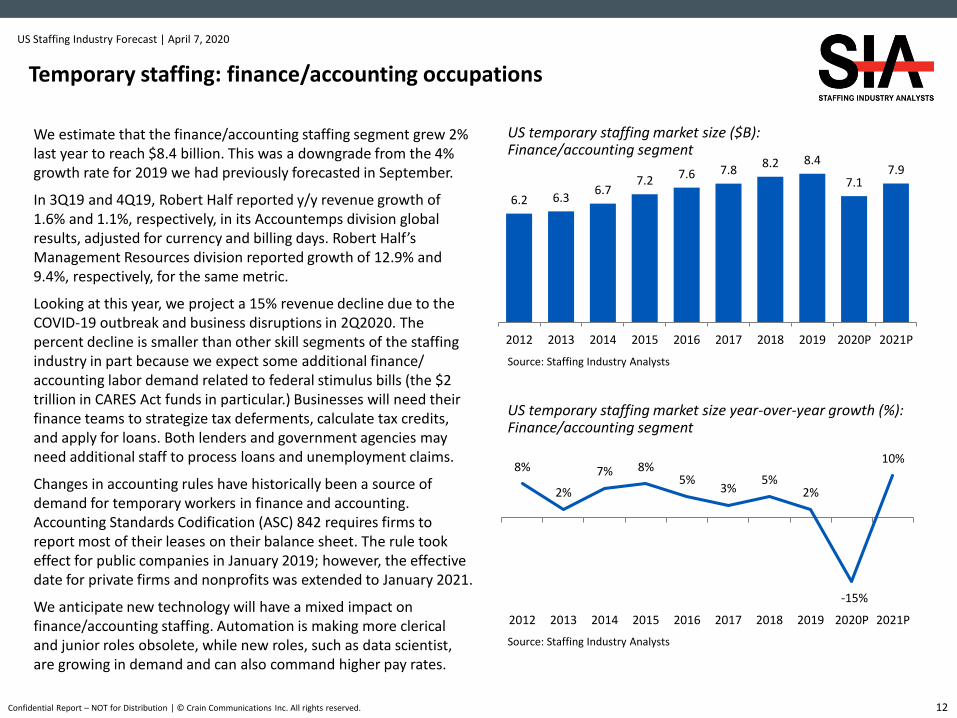
We estimate that the finance/accounting staffing segment grew 2% last year to reach $8.4 billion. This was a downgrade from the 4% growth rate for 2019 we had previously forecasted in September.
In 3Q19 and 4Q19, Robert Half reported y/y revenue growth of 1.6% and 1.1%, respectively, in its Accountemps division global results, adjusted for currency and billing days. Robert Half’s Management Resources division reported growth of 12.9% and 9.4%, respectively, for the same metric.
Looking at this year, we project a 15% revenue decline due to the COVID-19 outbreak and business disruptions in 2Q2020. The percent decline is smaller than other skill segments of the staffing industry in part because we expect some additional finance/ accounting labor demand related to federal stimulus bills (the $2 trillion in CARES Act funds in particular.) Businesses will need their finance teams to strategize tax deferments, calculate tax credits, and apply for loans. Both lenders and government agencies may need additional staff to process loans and unemployment claims.
Changes in accounting rules have historically been a source of demand for temporary workers in finance and accounting. Accounting Standards Codification (ASC) 842 requires firms to report most of their leases on their balance sheet. The rule took effect for public companies in January 2019; however, the effective date for private firms and nonprofits was extended to January 2021.
We anticipate new technology will have a mixed impact on finance/accounting staffing. Automation is making more clerical and junior roles obsolete, while new roles, such as data scientist, are growing in demand and can also command higher pay rates.
US temporary staffing market size ($B): Life sciences segment
US temporary staffing market size year-over-year growth (%): Life sciences segment
Source: Staffing Industry Analysts
Source: Staffing Industry Analysts
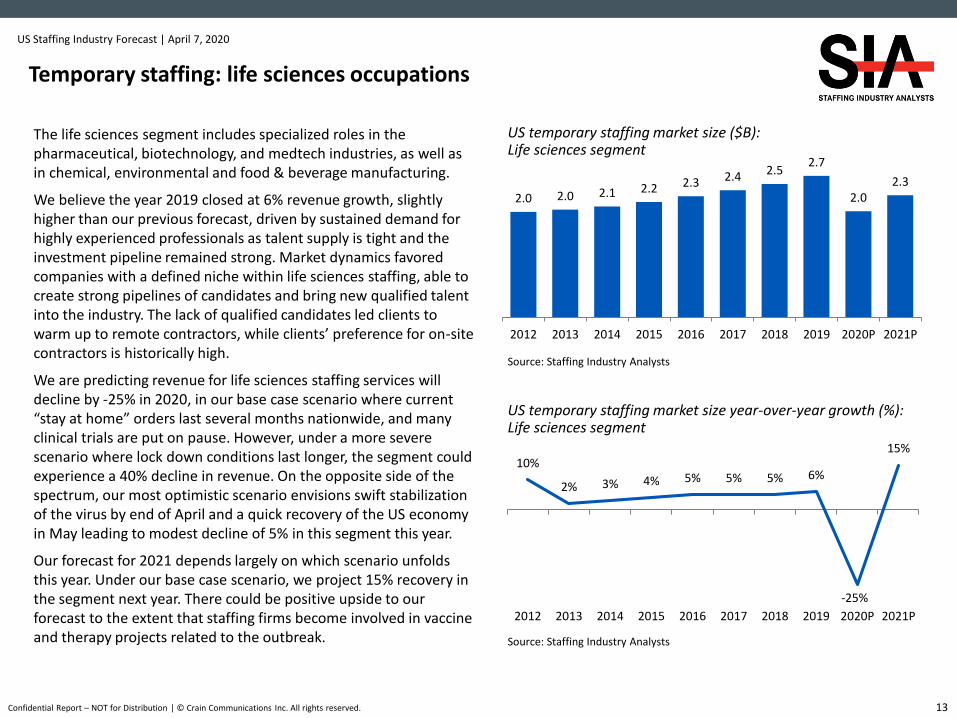
The life sciences segment includes specialized roles in the pharmaceutical, biotechnology, and medtech industries, as well as in chemical, environmental and food & beverage manufacturing.
We believe the year 2019 closed at 6% revenue growth, slightly higher than our previous forecast, driven by sustained demand for highly experienced professionals as talent supply is tight and the investment pipeline remained strong. Market dynamics favored companies with a defined niche within life sciences staffing, able to create strong pipelines of candidates and bring new qualified talent into the industry. The lack of qualified candidates led clients to warm up to remote contractors, while clients’ preference for on-site contractors is historically high.
We are predicting revenue for life sciences staffing services will decline by -25% in 2020, in our base case scenario where current “stay at home” orders last several months nationwide, and many clinical trials are put on pause. However, under a more severe scenario where lock down conditions last longer, the segment could experience a 40% decline in revenue. On the opposite side of the spectrum, our most optimistic scenario envisions swift stabilization of the virus by end of April and a quick recovery of the US economy in May leading to modest decline of 5% in this segment this year.
Our forecast for 2021 depends largely on which scenario unfolds this year. Under our base case scenario, we project 15% recovery in the segment next year. There could be positive upside to our forecast to the extent that staffing firms become involved in vaccine and therapy projects related to the outbreak.
US temporary staffing market size ($B): Marketing/creative segment
US temporary staffing market size year-over-year growth (%): Marketing/creative segment
Source: Staffing Industry Analysts
Source: Staffing Industry Analysts
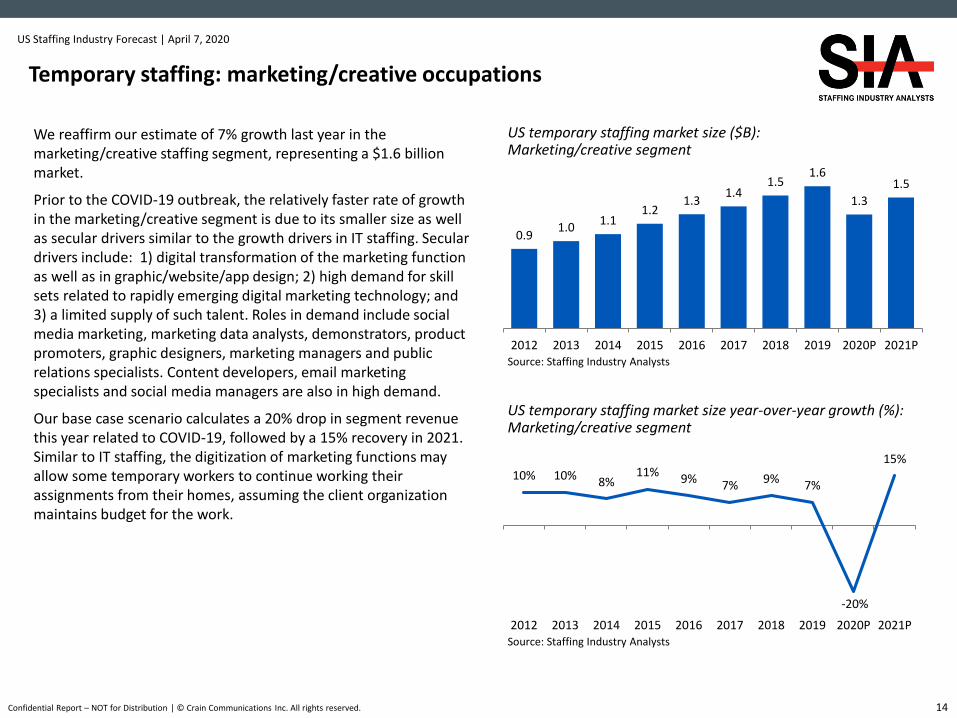
We reaffirm our estimate of 7% growth last year in the marketing/creative staffing segment, representing a $1.6 billion market.
Prior to the COVID-19 outbreak, the relatively faster rate of growth in the marketing/creative segment is due to its smaller size as well as secular drivers similar to the growth drivers in IT staffing. Secular drivers include: 1) digital transformation of the marketing function as well as in graphic/website/app design; 2) high demand for skill sets related to rapidly emerging digital marketing technology; and 3) a limited supply of such talent. Roles in demand include social media marketing, marketing data analysts, demonstrators, product promoters, graphic designers, marketing managers and public relations specialists. Content developers, email marketing specialists and social media managers are also in high demand.
Our base case scenario calculates a 20% drop in segment revenue this year related to COVID-19, followed by a 15% recovery in 2021. Similar to IT staffing, the digitization of marketing functions may allow some temporary workers to continue working their assignments from their homes, assuming the client organization maintains budget for the work.
US temporary staffing market size ($B): Education segment
US temporary staffing market size year-over-year growth (%): Education segment
Source: Staffing Industry Analysts
Source: Staffing Industry Analysts
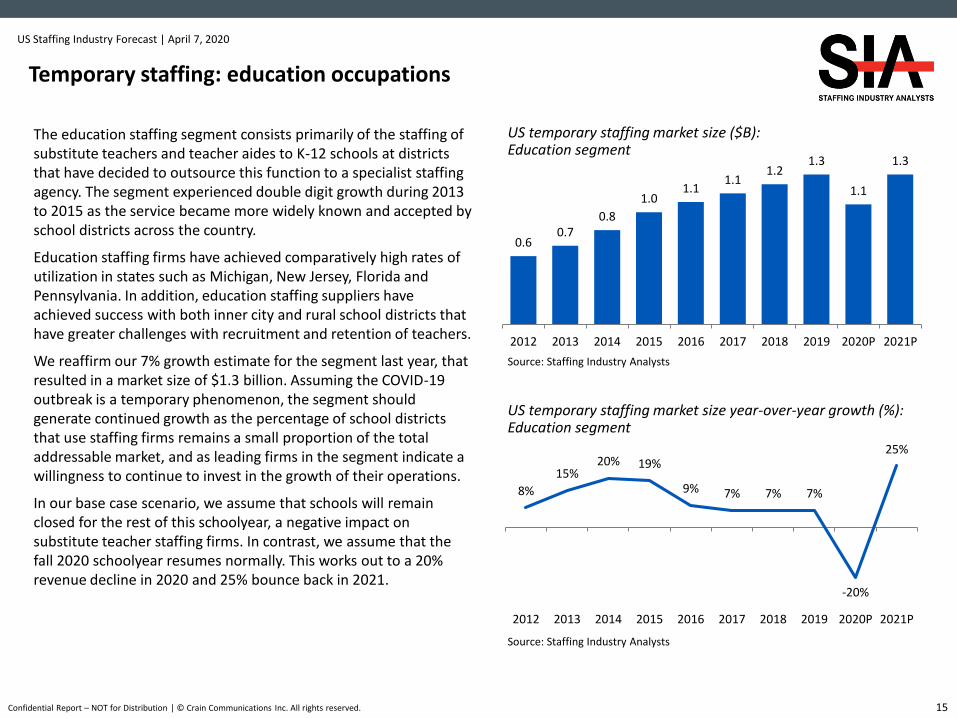
The education staffing segment consists primarily of the staffing of substitute teachers and teacher aides to K-12 schools at districts that have decided to outsource this function to a specialist staffing agency. The segment experienced double digit growth during 2013 to 2015 as the service became more widely known and accepted by school districts across the country.
Education staffing firms have achieved comparatively high rates of utilization in states such as Michigan, New Jersey, Florida and Pennsylvania. In addition, education staffing suppliers have achieved success with both inner city and rural school districts that have greater challenges with recruitment and retention of teachers.
We reaffirm our 7% growth estimate for the segment last year, that resulted in a market size of $1.3 billion. Assuming the COVID-19 outbreak is a temporary phenomenon, the segment should generate continued growth as the percentage of school districts that use staffing firms remains a small proportion of the total addressable market, and as leading firms in the segment indicate a willingness to continue to invest in the growth of their operations.
In our base case scenario, we assume that schools will remain closed for the rest of this schoolyear, a negative impact on substitute teacher staffing firms. In contrast, we assume that the fall 2020 schoolyear resumes normally. This works out to a 20% revenue decline in 2020 and 25% bounce back in 2021.
US temporary staffing market size ($B): Direct hire segment
Source: Staffing Industry Analysts
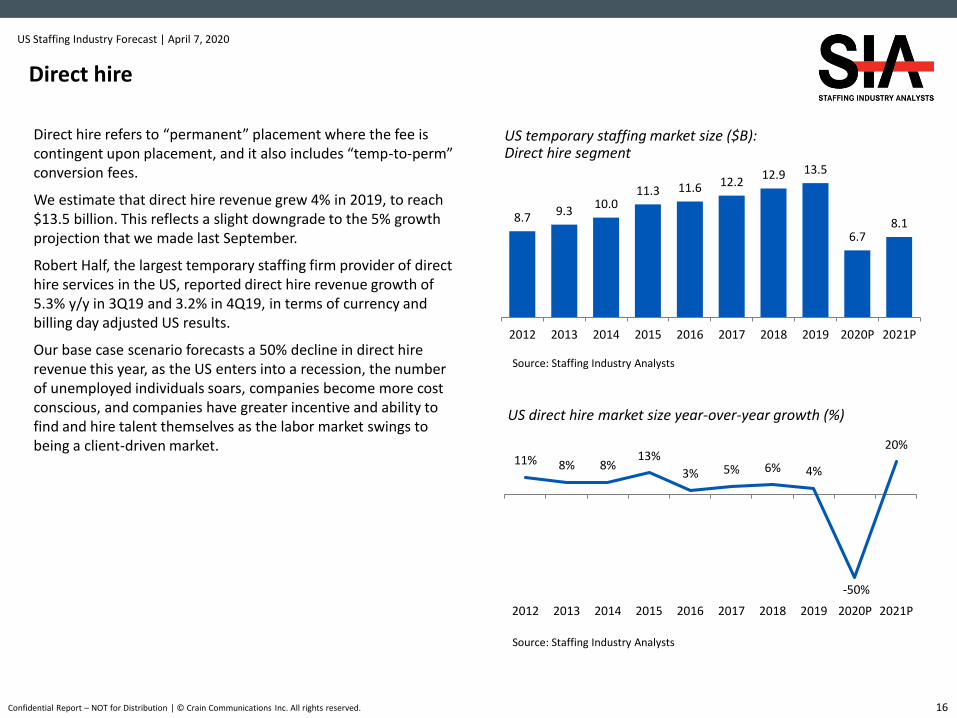
Direct hire refers to “permanent” placement where the fee is contingent upon placement, and it also includes “temp-to-perm” conversion fees.
We estimate that direct hire revenue grew 4% in 2019, to reach $13.5 billion. This reflects a slight downgrade to the 5% growth projection that we made last September.
Robert Half, the largest temporary staffing firm provider of direct hire services in the US, reported direct hire revenue growth of 5.3% y/y in 3Q19 and 3.2% in 4Q19, in terms of currency and billing day adjusted US results.
Our base case scenario forecasts a 50% decline in direct hire revenue this year, as the US enters into a recession, the number of unemployed individuals soars, companies become more cost conscious, and companies have greater incentive and ability to find and hire talent themselves as the labor market swings to being a client-driven market.
US direct hire market size year-over-year growth (%)
US temporary staffing market size ($B): Retained search segment
US retained search market size year-over-year growth (%)
Source: Staffing Industry Analysts
Source: Staffing Industry Analysts
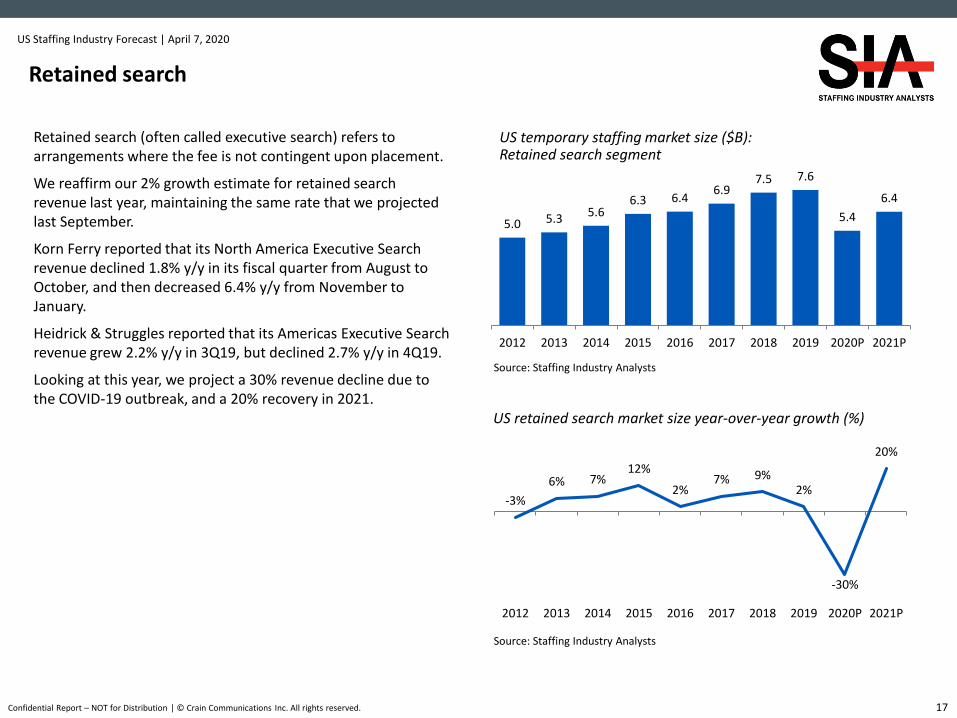
Retained search (often called executive search) refers to arrangements where the fee is not contingent upon placement.
We reaffirm our 2% growth estimate for retained search revenue last year, maintaining the same rate that we projected last September.
Korn Ferry reported that its North America Executive Search revenue declined 1.8% y/y in its fiscal quarter from August to October, and then decreased 6.4% y/y from November to January.
Heidrick & Struggles reported that its Americas Executive Search revenue grew 2.2% y/y in 3Q19, but declined 2.7% y/y in 4Q19.
Looking at this year, we project a 30% revenue decline due to the COVID-19 outbreak, and a 20% recovery in 2021.
Source: Staffing Industry Analysts*Life sciences and marketing/creative market sizes are included in the Other category in 1997-2007. Education is included in the Other category in 1997-2011.
US staffing industry revenue ($ billion), 1995 – 2014
21
Source: Staffing Industry Analysts*Life sciences and marketing/creative market sizes are included in the Other category in 1997-2007. Education is included in the Other category in 1997-2011.
Founded in 1989, SIA is the global advisor on staffing and workforce solutions. Our proprietary research covers all categories of employed and non-employed work including temporary staffing, independent contracting and other types of contingent labor.
SIA’s independent and objective analysis provides insights into the services and suppliers operating in the workforce solutions ecosystem including staffing firms, managed service providers, recruitment process outsourcers, payrolling/compliance firms and talent acquisition technology specialists such as vendor management systems, online staffing platforms, crowdsourcing and online work services. We also provide training and accreditation with our unique Certified Contingent Workforce Professional(CCWP) program.
Known for our award-winning content, data, support tools, publications, executive conferences and events, we help both suppliersand buyers of workforce solutions make better-informed decisions that improve business results and minimize risk. As a division of the international business media company, Crain Communications Inc., SIA is headquartered in Mountain View, California, with offices in London, England.
For more information: www.staffingindustry.com
Global coverage across the workforce solutions ecosystem, and latest SIA research and related news, follow us @SIAnalysts, @SIAResearch and connect via
About Staffing Industry Analysts (SIA)
PROPRIETARY DATA, DO NOT DISTRIBUTE OUTSIDE YOUR ORGANIZATION. Your company’s use of this report precludes distribution of its contents, in whole or in part, to other companies or individuals outside your organization in any form – electronic, written or verbal – without the express written permission of Staffing Industry Analysts. It is your organization’s responsibility to maintain and protect the confidentiality of this report.
Staffing Industry Analysts | 1975 W. El Camino Real, Ste. 304 | Mountain View, CA 94040 | 800.950.9496 | www.staffingindustry.com