1 US STATE POLICIES FOR RENEWABLE ENERGY: CONTEXT AND EFFECTIVENESS Magali Delmas * UCLA Institute of the Environment and Sustainability and Anderson School of Management La Kretz Hall, Suite 300, Los Angeles, CA 93106-5131 [email protected]/ 310-825-9310 Maria J. Montes-Sancho Department of Business Administration, Carlos III University, Madrid, Spain [email protected]Forthcoming Energy Policy ABSTRACT Over the past decade, state policies on renewable energy have been on the rise in the United States, providing states with various options for encouraging the generation of renewable electricity. Two promising policies, the Renewable Portfolio Standard (RPS) and the Mandatory Green Power Option (MGPO), have been implemented in many states but the evidence about their effectiveness is mixed. In this paper, we argue that recognizing the natural, social and policy context under which MGPO and RPS are adopted is necessary in order to measure their true effectiveness. This is because the context rather than the policy might lead to positive outcomes and there is the possibility for sample bias. When controlling for the context in which the policies are implemented, we find that RPS has a negative impact on investments in renewable capacity. However, we find that investor-owned utilities seem to respond more positively to RPS mandates than publicly owned utilities. By contrast, MGPO appears to have a significant effect on installed renewable capacity for all utilities regardless of the context in which it is implemented. Keywords: Energy policy, Policy effectiveness, Climate Change, Renewable Energy, Electric utilities * We thank Carley Markovitz for her exceptional research assistance with this project.
Transcript
1
US STATE POLICIES FOR RENEWABLE ENERGY:
CONTEXT AND EFFECTIVENESS
Magali Delmas* UCLA Institute of the Environment and Sustainability and Anderson School of Management
La Kretz Hall, Suite 300, Los Angeles, CA 93106-5131 [email protected]/ 310-825-9310
Maria J. Montes-Sancho Department of Business Administration, Carlos III University, Madrid, Spain
Over the past decade, state policies on renewable energy have been on the rise in the United States, providing states with various options for encouraging the generation of renewable electricity. Two promising policies, the Renewable Portfolio Standard (RPS) and the Mandatory Green Power Option (MGPO), have been implemented in many states but the evidence about their effectiveness is mixed. In this paper, we argue that recognizing the natural, social and policy context under which MGPO and RPS are adopted is necessary in order to measure their true effectiveness. This is because the context rather than the policy might lead to positive outcomes and there is the possibility for sample bias. When controlling for the context in which the policies are implemented, we find that RPS has a negative impact on investments in renewable capacity. However, we find that investor-owned utilities seem to respond more positively to RPS mandates than publicly owned utilities. By contrast, MGPO appears to have a significant effect on installed renewable capacity for all utilities regardless of the context in which it is implemented.
Keywords: Energy policy, Policy effectiveness, Climate Change, Renewable Energy, Electric
utilities
* We thank Carley Markovitz for her exceptional research assistance with this project.
2
1. Introduction
Addressing climate change has become an important priority for the U.S. administration. In the
United States, greenhouse gas emissions come primarily from the combustion of fossil fuels in
energy use. Energy-related carbon dioxide emissions, resulting from the combustion of
petroleum, coal, and natural gas, represented 82% of total U.S. anthropogenic greenhouse gas
emissions in 2006.† While the U.S. generates 3% of its electricity from renewable resources,‡
other developed countries such as Denmark, Germany, Spain, and New Zealand generate 25%,
20%, 16%, and 8% of their electricity from renewables, respectively.§ In addition, all of the
European Union member states have aggressive renewable energy percentages they plan to reach
by 2020, while the U.S. has no federally defined targets for renewable generation.**
While there are current debates about the implementation of a federal renewable policy, U.S.
states have taken a leading role in establishing renewable energy policies since the late 1990s.
These include Renewable Portfolio Standards, the requirement to sell green products, disclosure
policies, and subsidies. Analyzing the effectiveness of state renewable policies can be helpful to
inform the current policy debate at the federal level.
Recent research has started to look at the effectiveness of state policies on the generation of
renewable electricity but has found mixed results. While some studies have found positive results
† http://www.eia.doe.gov/bookshelf/brochures/greenhouse/Chapter1.htm ‡ This is without hydroelectricity. Biomass (71%) was the predominant non-hydro renewable fuel for electricity generation in 2003, followed by geothermal and wind. Solar thermal and photovoltaics together accounted for less than 1% of U.S. non-hydro renewable generation. http://www.eia.doe.gov/cneaf/solar.renewables/page/non_hydro/nonhydrorenewablespaper_final.pdf § EIA, 2009. International Energy Statistics. http://www.eia.doe.gov/emeu/international/electricitycapacity.html ** “Europe’s Energy Portal.” http://www.energy.eu/#renewable.
3
(Bird et al., 2009; Delmas et al., 2010; Menz and Vachon, 2009; Zarnikau, 2003; Yin and
Powers, 2010), others have found no significant results (Carley, 2009).
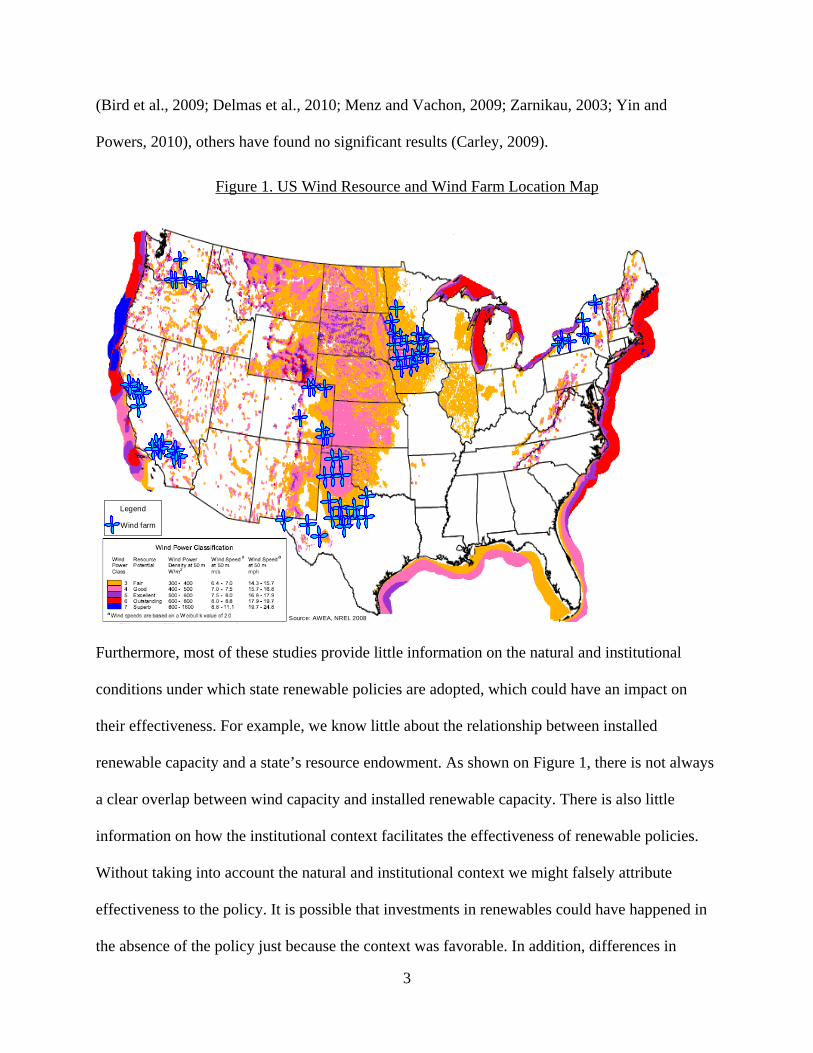
Figure 1. US Wind Resource and Wind Farm Location Map
Furthermore, most of these studies provide little information on the natural and institutional
conditions under which state renewable policies are adopted, which could have an impact on
their effectiveness. For example, we know little about the relationship between installed
renewable capacity and a state’s resource endowment. As shown on Figure 1, there is not always
a clear overlap between wind capacity and installed renewable capacity. There is also little
information on how the institutional context facilitates the effectiveness of renewable policies.
Without taking into account the natural and institutional context we might falsely attribute
effectiveness to the policy. It is possible that investments in renewables could have happened in
the absence of the policy just because the context was favorable. In addition, differences in
Source: AWEA, NREL 2008
Legend
Wind farm
Source: AWEA, NREL 2008
Legend
Wind farm
4
policy effectiveness might vary according to the type of electric utilities that are subjected to
these policies as electric utilities investing in renewable capacity have different governance
structures. Some of them are investor-owned while others are publicly owned. We argue that
these differences might explain disparities in responses to state policies.
In this paper, we analyze the impact of two major and related policies on the capacity of
renewable energy: Renewable Portfolio Standards (RPS) and Mandatory Green Power Options
(MGPO) that request electric utilities to source or sell specific percentages of renewable energy.
Our analysis differs significantly from previous research. First, we integrate in our model state
and electric utility characteristics to understand both the context of adoption and effectiveness of
state renewable policies. Second, we analyze capacity development rather than changes in the
percentage of total generation from renewables as this provides a better indication of changes in
the renewable infrastructure.
Overall, our results indicate that different renewable policies have different effects on the
development of renewable capacity. As hypothesized, Green product requirements is found to be
more effective than RPS. Our findings also indicate the importance of modeling the factors that
trigger policy adoption to analyze policy effectiveness. When modeling such factors, the effect
of RPS on renewable capacity becomes negative and significant while it was insignificant with
the previous methodologies used in the literature. In addition, we find that different types of
utility react differently to the policies. For example, RPS seems to be more effective at getting
investor-owned utilities to invest in renewable capacity as compared to publicly owned utilities.
This paper is organized as follows. In the first section we review state renewable policies and the
literature on their effectiveness. In section 2 we present our empirical analysis based on the
5
analysis of the strategies of 650 U.S. utilities from 1998 to 2007. In section 3 we describe our
results. A concluding discussion follows.
2. State renewable energy policies
Renewable state energy policies are usually grouped in two categories. The first category
provides financial incentives to encourage renewable energy. These include tax incentives,
grants, loans, rebates, and production incentives (Menz and Vachon, 2006). The second category
contains rules and regulations, which mandate a certain action from an obligated entity. Included
within this category are Renewable Portfolio Standards, Mandatory Green Power Options, and
fuel disclosure rules (Menz and Vachon, 2006). In 2007, all but three states (Alabama, Alaska,
and Mississippi) had implemented at least one of these policies, and four states (Colorado, Iowa,
Oregon, and Washington) had established all four policies (see Table A0 in Appendix). While
each of these renewable energy policies has its own implications and may deserve additional
analysis, this paper will focus primarily on two policies requiring electric utilities to source or
sell renewable energy: Renewable Portfolio Standards (RPS) and Mandatory Green Power
Options (MGPO).
The concept of a renewable portfolio standard dates back to 1983, the year when the first RPS
policy was enacted in Iowa (Wiser et al., 2007; Wiser and Barbose, 2008). RPS requires
electricity providers in those states to source an increasing amount of renewable energy in a
specified timeframe (Vachon and Menz, 2006). The majority of states give their electric utility
providers the option of generating electricity from renewable resources themselves, and/or
exchanging renewable energy credits (RECs) or renewable energy certificates, in order to meet
RPS mandates (Carley, 2009). The amount of renewable energy a utility is required to provide
6
from renewable resources can be measured in absolute units (KW or KWh) or as a percentage of
total retail sales (Wiser et al., 2007). In the state of Oregon, RPS requires that large utilities
supply 25% of electricity from renewable resources by 2025, whereas smaller utilities must
provide between 5 and 10% by 2025.††
The Mandatory Green Power Option (MGPO) requires electricity suppliers to provide an option
for their customers to purchase green power either directly from their electric company, or from
an alternative provider (Menz, 2005). The electric companies have the option of generating
renewable energy themselves, purchasing green power from an alternative producer, or buying
renewable energy credits from their state’s public utilities commission (Menz and Vachon,
2006). MGPO represents a more recent option than RPS and has been adopted by six states.
In addition to RPS and MGPO, tax incentives and fuel disclosure programs are popular
approaches used by state governments to increase renewable energy production. Sixteen states
employ corporate income tax credits for solar and wind investments, as well as for the utilization
of green electricity (Menz, 2005).‡‡ Currently established in 24 states, disclosure programs
impose requirements upon companies to impart information on the fuel sources used to produce
the electricity they provide directly to their customers (Delmas et al., 2010). For example, the
Minnesota disclosure program requires electric utilities to submit biannual reports that contain a
pie chart depicting the mix of fuel sources, a bar chart of air pollutant emissions, a chart of costs
associated with different generating sources, and a discussion of energy efficiency measures
†† Database of State Incentives for Renewables and Efficiency (DSIRE). http://www.dsireusa.org/incentives/incentive.cfm?Incentive_Code=OR22R&re=1&ee=1. ‡‡ In addition, 14 states implement a sales tax exemption on solar photovoltaic, wind energy, and other renewable energy equipment. Twenty-six states also either completely exempt renewable electricity sources from property taxes, or implement a price reduction for green electricity in residential, commercial, or industrial buildings (Menz, 2005).
7
(Delmas et al., 2010). Essentially, disclosure programs are implemented with the intention of
increasing consumer awareness of the inner workings of their electric companies, with the hope
that elevated knowledge will ignite more thoughtful decision-making on the part of the
consumer.
3. Literature review
Overall, the research conducted on the effectiveness of RPS has found mixed results. For
example, Carley (2009) found that RPS was not significant as an effective state renewable
energy policy. Delmas et al., (2007) also reported that RPS was not significant in impacting
renewable generation. On the other hand, Menz and Vachon (2006) concluded that RPS had a
significant and positive impact on wind capacity and Yin and Powers (2010) also concluded that
RPS was a positive effect on the development of renewable capacity. While these studies report
differing results, it is important to recognize that they used different dependent variables:
generation of renewable energy, and wind and renewable capacity. The effect of RPS on the
generation of renewable energy was not significant, whereas its effect on wind capacity and
renewable capacity was positive and significant.
Because MGPO is a more recent policy, there are fewer empirical studies on its effectiveness.
Menz and Vachon (2006) found that Mandatory Green Power initiatives have a positive and
significant impact on the development of wind capacity in electric utilities’ fuel-mix ratios. Yin
and Powers (2010) report the same results on electric generation capacity.
The results of the research on the effect of other renewable policies such as financial incentives
are mixed. Carley (2009) found that subsidies have a positive and significant correlation with the
generation of renewable energy, while tax incentives have a negative and significant correlation.
8
Menz and Vachon (2006) found that Public Benefits funds (PBF) were not significant to predict
wind capacity at state. Delmas et al., (2010) report that financial incentives, specifically tax
incentives, have no effect upon the fuel-mix ratios of electric utilities. Menz and Vachon (2006),
as well as Bird et al. (2005), found financial incentives to be insignificant in enhancing wind
power capacity. Disclosure policies are found to be more positive at encouraging renewable
energy. Delmas et al., (2010) found that mandatory disclosure programs have a positive and
significant effect upon a firm’s generated fuel mix: the existence of mandatory disclosure
programs increases the amount of renewable sources provided by electric utilities, and decreases
the amount of fossil fuel sources. This is consistent with the analyses of Green Power Demand,
undertaken by Zarnikau (2003) and Roe et al. (2001) who conclude that disclosure policies have
a positive and significant impact on consumers’ willingness to pay for green power.
The variance in the data thus far accumulated on the efficacy of renewable energy policies
produces an inconclusive overall picture. We argue that the current literature suffers from a
methodological weakness because most studies do not control for what is called a potential
‘sample selection,’ a type of bias caused by choosing non-random data for statistical analysis.
Indeed, the decision to adopt a renewable policy, such as RPS, and investments in renewable
capacity is likely to be influenced by the same factors. In other words, there might be a sample
bias in that the reason why a policy is adopted might be related to its success. Self-selection
makes it difficult to determine causation. For example, one might note significantly higher
capacity investments among those states that have adopted renewable policies, and credit the
policies for the difference. However, due to self-selection, there are a number of differences
between states that have adopted policies and states that have not. Arguably, those that adopted
policies might have been better endowed in renewable resources or might have had more highly
9
motivated policy makers than those that did not, and such differences in resources and dedication
may have affected investments in renewables in the two groups. If such was the case, then it is
not meaningful to simply compare the two sets of scores.
Research in related fields found that such sample selection problems were present in studying the
effectiveness of voluntary policy programs (Anton, Deltas, and Khanna, 2004; Delmas and
Montes-Sancho, 2011; Khanna and Damon, 1999; Rivera, 2002; Rivera and Deleon, 2004).
While several papers have analyzed the drivers of the adoption of state renewable policies (Lyon
and Yin, 2008; Vachon and Menz, 2006), these papers did not relate the factors that explain the
adoption of renewable policies to the effectiveness of the policies. For example, Vachon and
Menz (2006) found that social and political interests were positively linked to the adoption of
green electricity policies while the renewable potential (measured as the percent of sales that can
be provided from renewable resources) was not significant. Lyon and Yin (2007) focused on
RPS and found that states with poor air quality, strong democratic presence, organized renewable
developers, and strong wind potential were more likely to adopt an RPS.
In this paper, we propose to use a different estimation model than those used previously, in order
to determine simultaneously the adoption of RPS at the state level and the determinants of a
firm’s decision to invest in renewable capacity. In this, we build on research that was conducted
in the policy and management field (Green, Fleischmann, and Kwong, 1996; Delmas and Tokat,
2005; Delmas and Montes-Sancho, 2011; Khanna and Damon, 1999; King and Lenox, 2000;
Rivera, 2002; Rivera and Deleon, 2004; Vandenberghe and Robin, 2004;Welch et al., 2000).
In addition, most studies in the literature focused primarily on the generation of renewables
rather than investments in renewable capacity. With only one exception (Yin and Powers, 2010),
those that did focus on capacity focused exclusively on wind (Bird et al., 2005; Menz and
10
Vachon, 2006) rather than on total renewable capacity. While relatively small portfolio shifts are
easily obtainable by altering capacity utilization, purchasing or building new facilities may be
required to dramatically alter fuel-mix portfolios. The majority of the current literature, by
focusing on renewable generation, might analyze changes in capacity utilization rather than
shifts in capacity. In our paper, we focus on the effect of renewable energy policies on the
building of energy infrastructure, which will be critical for the development of green power in
the future. Evidence shows that several serious obstacles impede the building of new capacity,
including financial regulations and the acquisition of permits. Indeed, according to PG&E’s
Jennifer Zerwer, “It’s difficult to project [renewable capacity] given the unknowns of permitting,
financial, technological and transmission capacity issues.”§§ We believe that by analyzing
renewable capacity rather than renewable generation, our paper will be able to take into account
such obstacles to evaluate the effectiveness of policies on the renewable infrastructure.
In addition, the majority of the discussed papers analyzed the adoption of renewable energy at
the state level rather than analyzing firm level strategies. Our approach therefore also differs
from these papers as we examine how differentiated utilities, either public or privately-owned,
respond to renewable energy policies by increasing renewable capacity.
In conclusion, the literature has found mixed results regarding the effectiveness of renewable
policies and suffers from several limitations. First, the studies do not control for potential sample
selection and do not model the decision-making process of adopting the policy to understand its
effectiveness. Second, most studies use as a measure of effectiveness generation of electricity
from renewable energy rather than installed capacity. Finally the analyses are done mostly at the
§§ Sullivan, Colin. “Renewable Energy: Calif. utilities still hunting for power to meet RPS.” Contra Costa Times 30 June 2009. LexisNexis. Web.
11
state level rather than at the firm level, and to not identify how different types of utilities respond
to these policies, as policy effectiveness might vary accordingly.
4. Hypotheses
First, we should expect different levels of effectiveness between RPS and MGPO because of the
difference in design of these two policies. Second, because electric utilities have different
governance structures, we should also expect a different impact of renewables policies upon
publicly owned utilities than on privately owned ones. Third, in analyzing renewable capacity
rather than renewable generation, we should expect that the natural and institutional conditions
under which a policy is put into place will have an impact on the effectiveness of the policy.
RPS and MGPO
Renewable Portfolio Standards have been implemented in more than half of the states in the U.S.
and many regions of the world, and different terms have been used to define it. For example, in
the UK, it is called “Obligation” and in Denmark “Quota Obligation.” The main idea is that the
electricity portfolio of electric utilities must include a specific percentage of power generated
from renewables. Although RPS has been described in policy circles as a “market-friendly”
approach to achieving renewable energy targets because it does not mandate a specific allocation
of government money (Solsky et al., 2004; Wiser et al., 2007), RPS in fact resembles a command
and control policy where the regulator requires the producer to adopt a specific technology. In
other words, RPS focuses on the use of a specific technology rather than directly addressing
emissions and focuses on increasing supply rather than demand.
Because RPS lacks a market dimension, implementation and enforcement of the policy is a key
component of its potential success. Pressman and Wildarsky have emphasized the importance of
12
the policy implementation process as key to policy success (Pressman and Wildarsky, 1973).
Some elements identified by Pressman and Wildarsky that can lead to delaying implementation
include the number and variety of participants at each decision point, the preference of the
participants and how it evolves over time (Pressman and Wildavsky, 1973). In the case of RPS, it
is possible that the political gains of adopting the policy were enough for those enacting the
policy and that over time enforcement was not a priority for the administration (Michaels, 2008;
Rossi, 2010). As Michael mentions, RPS are politically easy to implement because: “It is easy to
specify legislatively and the cost of compliance might be more easily concealed in utility bills
than an outright tax on conventional power or subsidy to renewables.” (Michaels, 2008: 86). But
“having enacted seemingly stringent new standards, legislators may have little to gain politically
by vigorously enforcing them” (Michaels, 2008: 107).
In fact, RPS in most states allowed flexibility in the implementation and did not have strong
enforcement mechanisms. Many RPS policies include flexibility provisions that exist to assist
suppliers in achieving RPS targets. A “true-up period” is a three-month period in which suppliers
are allowed to acquire the necessary RECs, or make up any shortfall in renewables targets
(AWEA). Credit banking also exists, which allows generators and renewable energy suppliers to
“bank” credits indefinitely, allowing for an unspecified period of time for them to make up any
shortcomings in RPS goals. Lastly, a force majeure provision allows for a further extension of
the “true-up period” in cases of uncontrollable situations, such as natural disasters, so that
affected providers aren’t penalized unnecessarily for compliance failures (AWEA). Force
majeure provisions, also categorized as escape clauses, vary depending upon the state. The
majority of states with RPS have an outlined escape clause, although some states have no
13
specified clause, such as New York and Massachusetts.*** Although the policy specifies that
utilities that do not comply with RPS requirements may suffer penalties, there is no evidence of
strict enforcement of RPS programs, since there is no record of penalties paid in the U.S. (Solsky
et al., 2004).
In conclusion, because RPS resembles command and control regulation, it is likely to be
ineffective at increasing investments in renewable energy capacity when associated with lax
enforcement mechanisms. We therefore hypothesize the following:
H1: RPS is ineffective at increasing investments in renewable energy capacity.
MGPO requires utilities operating in the state to offer and publicize green power options to
consumers and provide a more direct link than RPS to a potential demand effect. MGPO allows
customers to support the purchase of electricity from renewable energy sources by their utilities.
The principle of MGPO is that consumers may increase demand for fuels perceived as
environmentally favorable and decrease demand for fuels perceived as environmentally
unfavorable. This mechanism requires several preconditions. First, that consumers are willing to
pay for renewable energy and that there is choice among electricity products. However, the
mechanism does not require choice among electricity providers.
An emerging literature suggests that consumer awareness changes in response to environmental
information [Desvousges, Smith, and Rink (1992), Blamey et al. (2000), Loureiro (2003),
Loureiro and Lotade (2005), and Leire and Thidell (2005)]. Existing research reports customers
purchase of green power (Bird and Swezey, 2003) and positive willingness to pay (WTP) for
green energy electricity premia (Byrnes et al., 1999; Ethier et al., 2000; Gossling et al., 2005;
*** Union of Concerned Scientists 2008. http://www.ucusa.org/.
14
Zarnikau, 2003; Bergmann et al., 2006). Borchers et al (2007) demonstrate a positive WTP for
green energy electricity. Further, the specific green energy source affects WTP. In fact,
individuals do exhibit preferences for solar versus a generic green or wind source. Biomass and
farm methane are found to be the least preferred sources. Some studies have shown the extent of
customer participation in green-pricing programs.
As of 2007, the total number of green customers was 835,651.††† Premium prices fluctuate
depending on the customer’s monthly electricity bill, but one tends to pay between 3 and 12
dollars per month for a green electricity premium (Zarnikau, 2003). While residential green
customers may not make up a significant demand for green electricity, some evidence suggests
that non-residential users play an increasing role in the demand for green electricity. The limited
research conducted suggests that up to 60% of businesses indicate a willingness to pay a
premium for green power (Wiser et al., 2001). In addition, green power programs that target non-
residential customers have seen over 20% of green power sales attributed to those customers
(Wiser et al., 2001). The U.S. Environmental Protection Agency publishes the National Top 50, a
list of the organizations leading the way in annual green power purchases. Corporations such as
Intel, PepsiCo, Whole Foods Market, and Kohl’s Department Stores are at the top of the EPA’s
list.‡‡‡ PepsiCo and Whole Foods Market, for example, can boast having 100% of their total
electricity from green power resources.§§§ As a part of their “Green Mission” section on their
website, Whole Foods stated: “We were the first major retailer to offset 100% of our energy use
with wind energy credits. And we are glad to see that some of the world’s largest retailers are
††† http://www.eia.doe.gov/cneaf/solar.renewables/page/greenprice/green_pricing.html ‡‡‡ “National Top 50.” Green Power Partnership, the U.S. Environmental Protection Agency. http://www.epa.gov/grnpower/toplists/top50.htm §§§ http://www.epa.gov/grnpower/toplists/top50.htm
15
following the example we’ve set in green building, the use of solar power, company-wide
recycling programs, internal green mission programs and support for organics. When more
companies take green steps, we all win.”****
We argue that such a potential increase in demand can trigger electric utilities’ interest in power
generation as they see a potential for attracting green consumers to purchase green power at a
premium (Delmas et al., 2007). An increase demand within the state will have an effect on the
production of renewable energy within the state, a portion of which will be undertaken by
electric utilities that are also selling the electricity. Because MGPO is market oriented, utilities
incentives should be more aligned with the policy than they are with RPS and facilitate its
implementation of the policy. We therefore hypothesize that MGPO will be effective at
increasing investments in renewable energy capacity.
H2: MGPO is effective at increasing investments in renewable energy capacity
In conclusion, we expect differing effectiveness between RPSs and MGPO. While we expect an
insignificant effect of RPS on investments in renewable energy capacity, we expect a positive
effect of MGPO.
Electric utilities governance
Investor-owned electric utilities are privately owned enterprises (Electric Power Industry
Overview, 2007).†††† Investor-owned utilities provide electricity for approximately 100 million
individuals, about 71% of the country’s total consumer base (Electric Power Industry Overview,
**** “Values and Actions: Green Mission.” Whole Foods Market. http://www.wholefoodsmarket.com/values/green-mission.php †††† They operate in all states except Nebraska, where electric utilities consist primarily of municipal systems and public power districts.
16
2007).‡‡‡‡ In comparison, publicly owned electric utilities are local nonprofit organizations.
Public utilities represent roughly 61% of the total number of electric utilities and supply
approximately 9% of generating capability, and account for about 15% of retail sales (Electric
Power Industry Overview, 2007).§§§§ Publicly owned utilities acquire their financing from the
sale of general obligation bonds and from revenue bonds secured by proceeds from the sale of
electricity (Electric Power Industry Overview, 2007).*****
As private companies, investor-owned utilities are motivated primarily by turning a profit, and
the constituencies with the greatest influence on their financial wellbeing are their customers.
According to Stuart Hemphill, Southern California Edison’s vice president of Alternative and
Renewable Power, the point of aggressively pursuing renewable energy contracts is that “every
contract we execute for renewable power is good for the industry, our customers, and the
environment.”††††† Scholars have shown that under deregulation the freedoms conferred on
utilities and the competitive threats that they face elicited differentiation strategies based on
green power products (Delmas et al., 2007). These strategies can lead to green power products
succeeding in the marketplace because of the emergence of customer classes that were
suppressed under regulation by its historical accounting practices and lack of incentives for
innovation. Free to offer green power options, utilities can use such initiatives to differentiate
themselves in ways that reflect their new realities under deregulation. We should therefore
expect electric utilities to be more responsive to renewable policies that allow them to offer
green power products.
‡‡‡‡ They represent 6% of the total number of electric utilities and approximately 38% of utility installed capacity, 42% percent of generation, 66% percent of sales, and 67% percent of revenue in the United States. §§§§ As of 2007, there were 2,009 publicly owned electric utilities in the United States. ***** “Electric Power Industry Overview 2007.” Energy Information Administration. http://www.eia.doe.gov/cneaf/electrciity/page/prim2/toc2.html. ††††† “Southern California Edison Launches 2009 Solicitation for Renewable Power.” Business Wire (2009).
17
However, just as investor-owned utilities want to prioritize their customers’ demands, they are
reliant upon their state’s PUC in order to do so. Because PUCs determine the rate a utility is
allowed to earn, and therefore the rate that the utility will eventually charge to its customers,
PUCs have a great effect upon investor-owned utilities and their subsequent financial success
(Bonardi et al., 2006). Publicly owned utilities are governed by their “consumer-owners,” who
may be locally elected or appointed officials.‡‡‡‡‡ Many utilities rely on the local governing
body, such as the city council, to regulate their actions.§§§§§ Within the Los Angeles Department
of Water and Power (LAWPD), for example, each member of the Board of Water and Power
Commissioners is appointed by the mayor for a five-year term. So publicly owned utilities might
be more responsive to local governing bodies than investor owned utilities that might be more
responsive to the policies issued by their PUCs at the state level.
Furthermore, investor-owned utilities are more likely to have the technical capabilities and
financial resources to add on increments of renewable power in comparison to public utilities.
This would include experience managing a diverse portfolio of energy types (Fremeth, 2009).
In conclusion, because investor-owned and publicly owned utilities respond to various
stakeholders and have different capabilities, we hypothesize a differing effect of renewable
policies on their investment in renewable capacity. We expect that investor owned electric
utilities will be more likely to respond positively to renewable policies based on their capabilities
‡‡‡‡‡American Public Power Association (APPA). http://www.appanet.org/utility/index.cfm?ItemNumber=9857&navItemNumber=21031 §§§§§ In 2005, the APPA reported that 60% of publicly owned utilities are governed by a city council, while the remaining 40% are governed by an independent utility board. http://www.appanet.org/utility/index.cfm?ItemNumber=9857&navItemNumber=21031 Managing Ethical Challenges by William Atkinson.
18
and the potential for environmental differentiation strategies associated with some of the
policies.
Hypothesis 3: Investor owned electric utilities will be more responsive to renewable policies
than publicly owned utilities.
The context of renewable policies
While policies might have different potential for effectiveness due to their design and according
to the type of utility implementing them, we argue that we need to control for the environment
(natural, social and political) in which renewable policies are adopted, since this can have an
impact on their successful implementation.
First, the natural context should be examined as a potential factor in the implementation and
effectiveness of renewable policies. The renewable energy industry depends on natural capital
defined as ‘the stock that yields the flow of natural resources’ (Daly, 1996:80) or indispensable
resources and benefits, essential for human survival and economic activity, provided by the
ecosystem. As argued by Russo, renewable natural capital such as wind or solar is difficult to
move around and geographic specific (Russo, 2003). While it has been shown that it might be
easier to implement policies in states with a higher endowment in natural resources (Vachon and
Menz, 2006; Lyon and Yin, 2008), it is unclear whether the natural resource endowment alone
can drive the effectiveness of renewable policies. For example, Carley (2009) found that a state
solar potential was significant and positive at explaining the total MWh of renewable energy
electricity while the wind and biomass endowment variables were negatively associated with
renewable electricity.
19
Indeed, scholars have argued that natural capital must be complemented by social and political
capital to drive the adoption of renewable policies as well as the development of new
technologies and investments in renewable (Lyon and Yin 2006; Russo, 2003; Sine and Lee,
2009; Vachon and Menz 2006). For example Russo showed that industry associations and the
number of existing renewable projects helped the development of new projects. Sine and Lee
found that environmental groups had a larger impact on entrepreneurial activity in the wind
energy sector than the availability of natural resources (Sine and Lee, 2009). Similarly, Vachon
and Menz (2006) and Lyon and Yin (2008) found that political and social interests were
positively and significantly related to the developments of renewable energy projects. Regarding
the political factors, Carley (2009) found that a green political index (measured by the League of
Conservation environmental scores for the House) was positively related to renewable
generation, but that regulatory restructuring was negatively related to renewable generation.
Because these natural, social and political factors have been shown to facilitate the development
of renewable policies and also of energy investments, it is important to take them into account in
order to isolate the effect of a renewable policy. It is indeed possible that there are a number of
differences between states that have adopted policies and states that have not in terms of natural,
social and political factors and that these factors, rather than the policy implemented might have
explain differences in investments in renewable energy. In conclusion, in line with previous
studies, we expect that natural, social and political capital will facilitate the adoption of
renewable policies and of investments in renewable energy. Thus in order to isolate the effect of
policies and control for self-selection bias, we need to use econometrics methodologies that
simultaneously predict the adoption of renewable policy and the determinants of a firm decision
to invest in renewable capacity.
20
5. Methodology
To test the effectiveness of RPS and MGPO policies, we used a two-stage modeling technique
that controls for self-selection (Heckman, 1978). This two-stage estimation determines
simultaneously the adoption of RPS at the state level and the determinants of a firm’s decision to
invest in renewable capacity.
In the first stage regression, we present a binomial logit to predict the adoption of the renewable
energy policy at the state level. This model provides an estimation of the likelihood that a given
state will adopt a renewable energy policy.
The adoption model in the binary logit model is specified as follows (first stage):
)'()1policy newable(Re obPr 1,, β−== titi ZF (Model 1a)
where Renewable policy is the binary dependent variable of this first stage. This variable
represents the decision of the state to adopt a renewable policy. It takes a value equal to 1 the
year of enrollment and the following years and 0 otherwise. 1, −tiZ is the set of exogenous
independent variables that explain the decision of the state to adopt a renewable policy, and F is
the cumulative logistic distribution ( )1/(1)1/()( xxx eeexF −+=+= ). The independent variables
are used with 1 lagged year to avoid reverse causality.
In the second stage regression, we use the predicted values of renewable policies to test whether
these explained renewable capacity at the firm level. Because the distribution of the capacity
variable is skewed and the data are censored at zero, conventional regression methods cannot be
used. Instead, we use a Tobit model, which assumes that the distribution of the error term is
21
normal and the estimation explicitly takes limit and non-limit observations into account (Greene,
2008).****** We include fixed-effect factors for years.††††††
The second stage regression is presented below:
εγδ ++= −− 'policy Renewablecapacity Renewable 1,1,ti, titi X (Model 1b)
where the variable Renewable capacity is the dependent variable that we use to measure the
effectiveness of renewable policies. Renewable policyi,t-1, is the predicted probability of adopting
a renewable policy obtained in the first stage using binary logit, and 1, −tiX is a set of control
variables that could also explain investments in renewable capacity. Renewable policy and the
set of control variables are 1 year lagged.
In order to test the effect of renewable policies on investments in renewable capacity, we
collected data from a number of sources to assess investment in renewable capacity, renewable
policies, state characteristics, and electric utility characteristics. The variables are described
below and in the Appendix in Table A1. The variables included in the first stage regression are
consistent with previous studies (Carley, 2009). In the second stage, we added a variable related
to the type of electric utility, namely investor owned and publicly owned. The sample consists of
****** We tested whether the residuals of our regressions are normally distributed. We performed the Skewness and Kurtosis, the Shapiro-Wilk, and the Shapiro-Francia tests for normality, which do not reject the hypothesis of normal distribution. Hence it is appropriate to use the Tobit model for our data. The Shapiro-Wilk test is based on Shapiro and Wilk (1965) and the Shapiro-Francia test is based on Shapiro and Francia (1972). The Skewness and Kurtosis tests for normality are based on a combined measure of skewness and kurtosis of the data (D’Agostino et al., 1990; Royston, 1991). †††††† Unconditional fixed-effects Tobit models may be estimated but the estimates are biased (STATA 7, 2001: 474). We also ran a random effects model. Unfortunately, the quadrature approximation underlying the estimation of the random-effects model is problematic in our data set and the parameter estimates of the random-effects model are not stable. Two aspects of random-effects models have the potential to make the quadrature approximation inaccurate: large group sizes and large correlations within groups (STATA 7, 2001: 476). These factors can also work in tandem, decreasing or increasing the reliability of the quadrature. Therefore, we do not report them in this paper.
22
650 electric utilities in 48 states for the period 1998-2007, with 1/3 of investor owned utilities
and 2/3 of publicly owned utilities. The firms in our sample represent 72% of the electricity
produced by utilities in US from 1997-2007. The states of Alaska and Hawaii are not included in
the analysis due to lack of available data on natural resources.
The main dependent variable is renewable capacity. The variable is defined as the sum of the
maximum rated output of all units owned per utility (thousand of MW). Information was
obtained from the Energy Information Administration Form 860.
1.2 Renewable policies
We collected data from the Database of State Incentives for Renewables & Efficiency (DSIRE)
to gather information on RPS, disclosure policies, tax incentives, and the MGPO.
Renewable Portfolio Standard. This variable captures the effect of operating in a state with an
established RPS (Delmas et al., 2007). We first create a variable that takes the value 1 if the state
had an RPS in place and 0 if otherwise. For multi-state utilities, this variable is weighted based
on the percentage of electricity produced within each state by the utility.
Mandatory Green Power Option. The MGPO is a policy adopted by certain states that requires
the state’s electric utilities to offer “green power” to its customers, either through their own
generation or through the purchase of renewable energy credits (RECs). The variable takes the
value of 1 if a state has implemented MGPO, and 0 if otherwise.
Disclosure policies. Some states require electric utilities to provide their customers with specific
information about the electricity that the utility supplies. This information, which must be shared
with customers periodically, usually includes the utility’s fuel-mix percentages and emissions
statistics. We create a variable on disclosure based on the enacted year, where the value of the
23
variable is 1 for the year the policy was enacted and for all years thereafter, and 0 if otherwise.
For multi-state utilities, this variable is weighted based on the percentage of production within
each state by the utility.
Financial incentives. This variable encompasses the index of corporate, sales, and property tax
implemented in each state, dating back to 1975 (sales and property tax incentives) and 1976 for
corporate tax incentives. The variable is calculated as the number of tax incentives implemented
in each state until that year, ranging from zero to three. For example, if a state has two tax
incentives in place, one in 1997 and another in 2005, the variable takes a value of 1 for the
period 1997-2004 and the value of 2 for the period 2005-2007. As can be seen in Table 1, all
states but two have RPS or MGPO also have tax incentives or have none of these. Because of
this co linearity issue it was not possible to include that variable in the first stage regression.
1.3 States’ natural resources
We incorporate variables regarding the availability of wind, solar, and biomass in the state where
the utility operates.
Wind potential. Wind energy potential has been systematically studied in the U.S. (Elliott and
Schwartz, 1993; Elliott, Wendall, and Gower, 1987). Here, wind potential is measured by the
sum of land (in km2) subject to all classes of wind, with environmental exclusions and moderate
land-use exclusions. Environmental exclusions are defined as large natural areas including parks,
monuments, wilderness areas, ecological preserves, and wildlife refuges where industrial,
commercial, and residential developments are restricted or very limited. Land-use exclusions
consider the 11 different land-use categorizations (see Table 2). The states of Alaska and Hawaii
are not included in the analysis due to lack data.
24
Solar potential. Solar potential is defined by the ratio of insolation, which is the monthly
average daily total radiation using input derived from satellite and/or surface observations of
cloud cover, aerosol optical depth, precipitable water vapor, albedo, atmospheric pressure, and
ozone resampled to a 40 km resolution. This information was obtained from the Solar Atlas
provided by the National Renewable Energy Laboratory.
Biomass potential. As provided by Milbrandt (2005), the biomass potential variable is defined
as the total biomass resources available (per thousand tons) in each state.
1.4 State characteristics
We also include variables such as deregulation, Democratic governor, Democratic
representative, League of Conservation Voters, Sierra Club, renewable association, income per
capita, state emissions, unemployment, and electricity retail price all of which we categorize as
state characteristics.
Deregulation. To pick up the effect of deregulation in the installed renewable capacity, we
created a time-changing variable that represents whether or not a retail deregulation policy had
been enacted in a given state. Following Delmas and Tokat (2005) and Delmas et al., (2007), we
created a time-changing variable that takes the value of 1 starting in the year in which retail
deregulation was enacted or a regulatory order was issued, and 0 otherwise. Some states, such as
California, have suspended retail choice after years of deregulation. In these cases, the variable
deregulation takes the value of 1 during the period where deregulation was active and 0 the
suspended year and the following years. At utility level, this variable was weighted based on the
percentage of electricity sold by the utility in each state. The information comes from the Energy
Information Administration.
25
Democratic governor. We utilize a dummy variable indicating a Democratic governorship, with
1 indicating the governor is a Democrat and 0 if otherwise. Information for the variable was
obtained from the National Conference of the State Legislature.
Democratic representative. We incorporate this variable to test for the effect of ideological
preference on the willingness to adopt state renewable energy policies. This variable is defined
as the weighted percentage of House and Senate seats occupied by Democrats. Information is
provided by National Conference of State Legislatures.
League of Conservation Voters. Several researchers have used the scores of the League of
Conservation Voters as a measure of the preferences of the elected representatives of a state
(Delmas et al., 2007; Hamilton, 1997; Kassinis and Vafeas, 2002, 2006; Lubell, Schneider,
Scholz, and Mete, 2002; Viscusi and Hamilton, 1999). Each year, the League of Conservation
Voters selects environmental issues to constitute an “environmental agenda,” with a panel
comprising the main U.S. environmental groups. The organization then creates an index by
counting the number of times each representative or senator in Congress votes favorably on the
environmental agenda (e.g., on the global warning gag rule, tropical forest conservation, or
global climate change). The index ranges from 0 to 100, with 100 representing a record of voting
for the environmental agenda in all cases. The variable is the average of the environmental scores
of the U.S. House of Representatives and U.S. senators of the states where each utility operated
(Kahn, 2002), weighted by the percentage of generation of each firm in each state for multi-state
utilities.
Sierra Club. In line with previous studies (e.g., Delmas and Montes-Sancho, 2011; Helland,
1998; Kassinis and Vafeas, 2002; Maxwell et al., 2000; Riddel, 2003), we measure the
environmental preferences of the population of the state in which a firm operates based on
26
membership figures for one of the major environmental non-governmental organizations, the
Sierra Club. The measure itself is the number of dues-paying Sierra Club members per 1,000
state residents in each year.
Renewable associations. To determine the presence of renewable associations in each state, we
utilized information provided by the American Solar Energy Society (ASES). Member chapters
of the ASES include both solar and general renewables chapters.
Percentage of renewable generation. This variable is the percentage of renewable generation,
excluding hydro generation, over the total net generation of total electric industry at state level.
Emissions. This variable is a factor of CO2, SO2, and NOx emissions at the state level.
Information was found from the Environmental Protection Agency, Clean Air Market.
Income per capita. Using information obtained from the Bureau of Economic Analysis, we
measure the median income per capita in each state. This measure of income is calculated as the
income of the residents in a given area divided by the resident population of the area. The
information comes from the Energy Information Administration, State Electric Profiles.
Unemployment. To further examine the economic situation on a state-by-state basis, we
incorporated a variable on unemployment, utilizing unemployment rates provided by the Bureau
of Labor Statistics.
Electricity retail price. This variable is defined by the average price for the total electricity
industry (cents per KWh) in each state. We used information obtained from the Energy
Information Administration, State Electric Profiles.
27
1.5 Electric utility characteristics
We examine several variables to assess utility characteristics. This includes percentage of green
residential customers, fuel mix of generated electricity, and total customers served by the utility
as well as differentiated variables for publicly versus privately owned utilities.
Investor-owned. To differentiate between investor-owned and publicly-owned electric utilities,
we employ a dummy variable. Information describing the difference between investor-owned
and publicly owned utilities was found from the Energy Information Administration.
Green residential customers. This variable is the percentage of the number of residential
customers who purchase electricity generated from renewable resources or pay for renewable
energy development over the total number of residential customers served by the utility. The
information comes from EIA, form 861.
Percentage of generation from fossil fuel. The type of technology a firm uses for generating
electricity might explain its environmental strategies (Delmas et al., 2007). To account for these
differences, we utilize the percentage of generation from fossil fuel using data from EIA, form
906.
Total customers. Using information from Energy Information Administration, this variable
reports the total number of customers (in millions) served by the utility.
6. Results
The first set of models is the logit models of the adoption of RPS and MGPO at the state level.
The analysis is conducted for the years 1997-2006 for RPS and only from 2001 to 2006 for
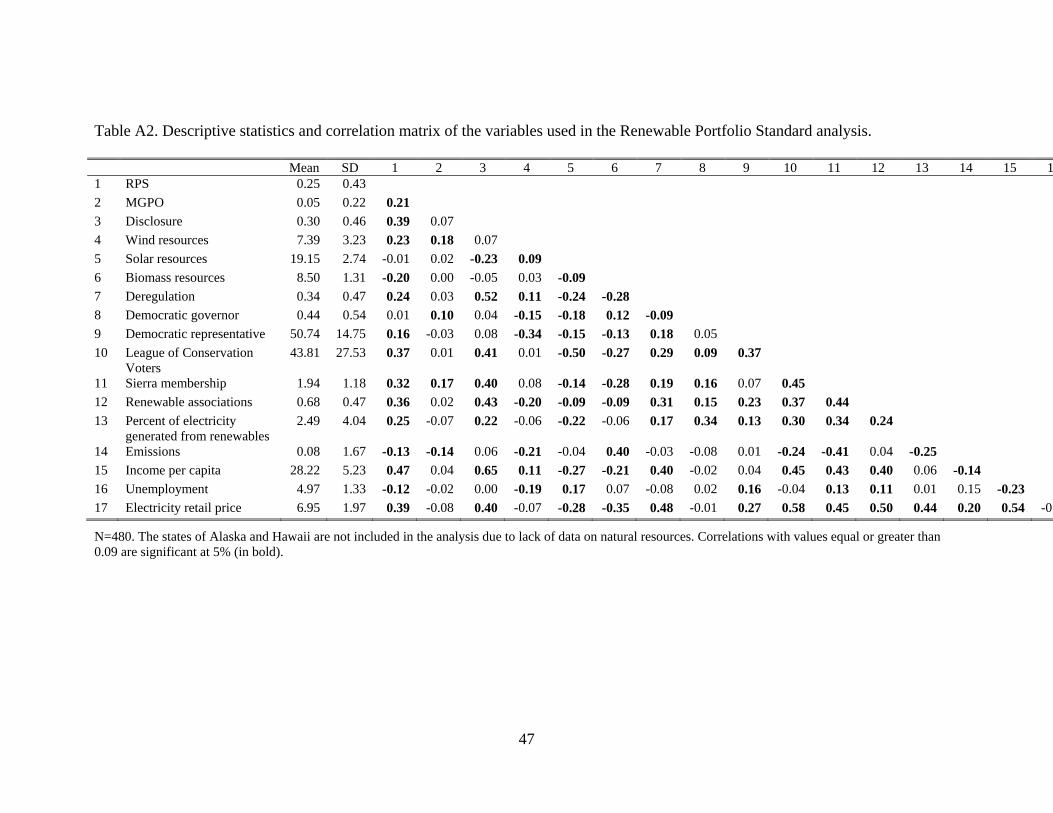
MGPO since there was no MGPO policy available before 2000. Descriptive statistics are
presented in Table A2 in the Appendix and the logit models are presented in Table 1 below. The
28
second set of models is the Tobit model of investments in renewables for the period 1998-2007.
Descriptive statistics are presented in Tables A3a and b in the Appendix and the Tobit models
are presented in Table 2.
Table 1. Logit Model of the adoption of Renewable Portfolio Standards and MGPO
Year dummies are included in all models, but they are not reported. ** p<0.01, * p<0.05, + p<0.1
31
RPS is more likely to be implemented in states with a higher percentage of electricity generated
from renewables and more emissions, higher income per capita, and lower rate of
unemployment, while the opposite is true for MGPO. Retail price is negatively and significantly
related to MGPO but insignificantly related to RPS.
In conclusion, while both policies were adopted in relatively similar political and social contexts,
we find that they were adopted in very different economic contexts. The natural endowment of
these states also differs, with a higher endowment in solar energy for states that adopted RPS.
The models predicting renewable capacity are presented in Table 2. In these models we use
enacted policy as the independent variable. In Models 1 and 2 we use the RPS variable
(independently from the first stage regression) and in Models 3 and 4 we use the predicted RPS
and predicted MGPO variables from the first stage regression. We find that the effect of the RPS
variable on installed renewable capacity is insignificant in Models 1 and 2. The effect of the
predicted RPS is negative and significant in Models 3 and 4 when we present the results of the
two-stage model. Overall, we do not find that RPS is effective at explaining investments in
renewable capacity. This confirms Hypothesis 1. We even find a negative and significant effect
for RPS when we control for the context of the adoption of RPS. This indicates a self-selection
bias which we corrected. The variable representing MGPO policies is significant and positive in
all models (p<0.05), indicating a significant effect of this policy on renewable capacity. This
confirms Hypothesis 2.
In Models 2 and 4, we include an interaction term between RPS and investor-owned utilities.
This term shows to be significant and positive (p<0.05). This indicates that RPS is more effective
at driving investor-owned utilities to invest in renewable capacity in comparison to publicly
32
owned utilities. This confirms Hypothesis 3. Regarding the effectiveness of other renewable
policies, we do not see a significant effect for the disclosure and financial incentives variables.
We argued for modeling the context in which policies are implemented to measure their true
effectiveness and found that the results for RPS differ when we do so. Models 3 and 4 show a
negative and significant coefficient for RPS when the sign was insignificant in models 1 and 2.
The coefficient for MGPO does not change according to the different specifications. This might
indicate that there is no sample bias associated with MGPO.
Turning to the state characteristics, the variables representing Democratic representative and
Sierra membership show to be significant and positive in all models and seem to be a better
predictor of investments in renewable capacity than the presence of renewable associations or of
high League Conservation Voters. State renewable potential (wind, solar, and biomass resources)
is not significant at predicting investments in renewable capacity. The variable deregulation is
negative in all models and significant in model 3 (p<0.10) and model 4 (p<0.05). This is
consistent with the findings of Kim (2009), who found that deregulation did not prove to be an
effective mechanism for increasing renewable capacity.
As for specific utility characteristics, the percentage of green residential customers shows to be
significant at predicting investments in renewables, as does electric utility size measured as the
total number of customers. Firms with higher percentage of fossil fuels are also less likely to
invest in renewable capacity.
We conducted several robustness tests. First, because we might expect that it takes time for the
policies to be effective, we also conducted additional models using different time lags for the
33
renewable policies as a robustness test (from 2 to 5 year lags).23 Overall these models present
similar results. Second, because RPSs might have different levels of stringency we wanted to test
whether our results were robust for these different types of RPSs. We therefore categorized RPSs
into two categories. The first one represents RPSs with the requirement to build new capacity in
state. The second category represents RPSs without such requirements. Tables A4 and A5 in the
Appendix provide the results of the two-stage regressions. Overall, the results show that both
types of RPS policies have a negative and insignificant effect on renewable capacity. However,
the effect is significant and positive for the interaction term between RPS with requirements and
investor-owned utilities. Third, we wanted to test whether there would be an additive effect of
renewable policies. We conducted an additional analysis with a variable that represents the
number of different renewable policies implemented by a state. This variable is insignificant in
all models, indicating that there is no additive value to the policies and the possibility that
policies might cancel each other.24
7. Discussion and conclusion
The purpose of this paper is to analyze the effects of two different state renewable energy
policies—Renewable Portfolio Standards and Mandatory Green Power Options—on installed
renewable energy capacity. Our results show varied effects of the policies. RPS has proven to
have a negative effect on investments in renewable capacity. Our results differ therefore from
previous studies that found RPS to be effective at increasing installed wind capacity (Bird et al.,
23 Results available upon request from the authors.
24 Results available upon request from the authors.
34
2005; Menz and Vachon, 2006; Yin and Powers, 2010) and show the importance of modeling the
context of policy adoption to avoid sample selection bias. Furthermore, the effect of RPS on
investments in renewables changes in our model when we include an interaction term between
RPS and investor-owned utilities. The result is a positive and significant effect, demonstrating
that investor-owned utilities respond more to the implementation of RPS than do publicly owned
utilities.
As expected, the effect of the more market-oriented policy Mandatory Green Power Option
proved to be positive and significant. Specifically, our results show that MGPO, which requires
utilities to provide green electricity to their customers, has proven effective in increasing
installed renewable capacity. We also found that the variable for green residential customers
provided positive and significant results. Essentially, the more customers willing to pay a
premium for green electricity, the greater the installed renewable capacity.
Our analysis differs from previous studies because this is the first paper to distinguish between
utility ownership types, and thus provides further insight into the differentiated effect of the
implementation of RPS on investor-owned versus publicly owned electric utilities. Additionally,
our green residential customers variable depicts the influential effect consumers can have upon
installed capacity.
When analyzing the effect of resource potential, we found that solar and wind potential have a
positive and significant impact on the adoption of renewable policies (at least RPS). However,
resource potential was not significant in explaining installments of renewable capacity. Our
results indicate that the relationship between natural resources, policies, and installed capacity
can be complex. While higher natural resources endowment can facilitate the adoption of
policies that are not effective, some effective policies might be adopted in states with low
35
resource potential. Our results conclude therefore that factors other than natural resources can
predict successful renewable policies. These factors include the social and political context in
which the policy is implemented, the type of renewable policy and the type of electric utility
implementing it. Our findings indicate that a high presence of Sierra Club membership, green
residential customers and democratic representatives facilitate effective policies. These represent
various communities that constitute an environment conducive to environmental conservation
behavior highlighted in the literature (Kahn, 2007).
In determining the efficacy of these state renewable energy policies on installed capacity, it is
critical to account for the lag time between the implementation of these policies and the
installment of renewable capacity. The difficult question is: how much time must actually be
accounted for in order to see a policy truly take effect? While we do observe a general trend of
increased installments in renewable capacity over a ten-year period (1997-2007), RPS remains a
non-significant variable despite using models with up to five-year time lags between its
implementation and installed capacity. It certainly is possible that a decade is not a sufficient
period of time to see RPS take effect, because to this point it has not proved to be an influential
factor on installed capacity.
It is also important to take into account our market findings, and the role of the market in
affecting installed capacity. We find the variables for MGPO and green residential customers to
be positive and significant, providing evidence that market mechanisms have the most
substantial effect upon installed capacity. Thus, policies that influence the customer’s ability to
purchase green power, and the subsequent number of customers choosing to do so, have been a
significant contributor to the rise in installed capacity over the last decade.
36
There are some recommendations that can be made regarding renewable policies based on our
results. While we see that market mechanisms have a significant effect upon installed capacity,
policies such as RPS, disclosure, and tax incentives have proven to be insignificant, which is
problematic. Over the past decade, states have attempted to assume the responsibility that the
federal government failed to take regarding national environmental policies (Keeler, 2007).
However, inherent aspects of these state policies—such as flexibility clauses and the ability of
utilities to employ out-of-state resources to meet renewable requirements for RPS—make it
difficult for these policies to truly make a difference (Keeler, 2007).
A potential solution to the problem could be incorporating the federal government in the
renewable policy enactment and implementation process. The Clean Energy Group submitted a
series of suggestions to the House of Representatives in 2007 regarding the interaction between
state renewable policies and a federal RPS program. They recommend a federal RPS that assists
states in reaching their RPS objectives, that sets a floor (but no ceiling) on renewable capacity
across all states, and that builds off existing state and regional certificate tracking systems to
allow for a synchronized use of RECs.25 While these suggestions seem credible, the Clean
Energy Group’s belief that “a well-designed RPS would ideally apply equally to all load-serving
utilities” does not align with our findings.26 One difficulty with currently implemented RPS
programs seems to be the differentiated response from investor-owned and publicly-owned
utilities, and thus there should be differing requirements depending on utility type. Indeed,
25 Sinclair, Mark. Letter to Congressmen John D. Dingell and Rick Boucher. 14 June 2007. MS. Clean Energy Group, Montpelier, Vermont. 26 Sinclair, Mark. Letter to Congressmen John D. Dingell and Rick Boucher. 14 June 2007. MS. Clean Energy Group, Montpelier, Vermont.
37
moving from the state to the federal level may pose a series of difficulties with aligning the
patchwork of mandatory state policies into a coherent federal program (Keeler, 2007).
There is still further research to be done on the efficacy of state renewable policies on installed
capacity. In order to determine the reasoning behind publicly and investor-owned utilities’ varied
responses to renewable policies, further research should be conducted on specific firm-level
factors. A firm’s management style and its business strategy should be analyzed, for these factors
may influence a utility’s decision to install renewable capacity or not. This information may in
fact be critical in devising future state, and even federal, policies so that they will have the
greatest effect upon electric utilities. Further research could also identify whether specific
policies are more effective at driving an increase in capacity for specific renewable energies
(wind, solar, or biomass).
38
References
Anton, W. R. Q., Deltas, G., and Khanna, M. 2004. Incentives for environmental self-regulation and implications for environmental performance. Journal of Environmental Economics and Management, 48(1), 632–654.
Bergmann, A., Hanley, N., Wright, R., 2006. Valuing the attributes of renewable energy investments. Energy Policy 34, 1004–1014.
Bird, L and Swezey, B. 2003. Green Power Marketing in the United States: A Status Report (6th Edition), National Renewable Energy Laboratory, Golden, CO (2003) NREL/TP-620-35119.
Bird, L. Bolinger, M. Gagliano, T. Wiser, R., Brown, M and Parsons, B. 2005. Policies and market factors driving wind power development in the United States. Energy Policy (33): 1397-1407.
Blamey, R., Bennett, J., Louviere, J., Morrison, M., and Rolfe, J. 2000. A test of policy labels in environmental choice modeling studies. Ecological Economics, 32(2), 2000, 269-286.
Bonardi, JP, Holburn, G, and Vanden Bergh, R. 2006. NonMarket Strategy in Regulated Industries: Theory and Evidence from U.S. Electric Utilities. Academy of Management Journal 49(6): 1209-1228.
Borchers, A.M.; Duke, J. M. a, Parsons, G. R. 2007. Does willingness to pay for green energy differ by source? Energy Policy. 35(6): 3327-3334
Byrnes, B., Jones, C., Goodman, S., 1999. Contingent valuation and real economic commitments: evidence from electricity utility green pricing programmes. Journal of Environmental Planning and Management 42: 149–166.
Carley, S. 2009. State renewable energy electricity policies: An empirical evaluation. Energy Policy 37: 3071-3081.
Daly, H.E. 1996. Beyond Growth: The Economics of Sustainable Development. Beacon Press: Boston, MA.
Delmas, M. and Tokat, Y. 2005. Deregulation, Efficiency and Governance Structures: The U.S. Electric Utility Sector,” Strategic Management Journal. 26: 441-460
Delmas, M., Russo, M. and Montes-Sancho, M. 2007 Deregulation and Environmental Differentiation in the Electric Utility Industry,” Strategic Management Journal. 28(2):189-209.
Delmas, M., Shimshack, J and Montes-Sancho, M. 2010 Information Disclosure Policies: Evidence from the Electricity Industry. Economic Inquiry, 48(2): 483-498.
Delmas, M. and Montes-Sancho, M. 2011. An Institutional Perspective on the Diffusion of International Management System Standards: the Case of the Environmental Management Standard ISO 14001. Business Ethics Quarterly. 21(1): 1052-1081.
Desvousges, W.H., Smith, V.K., and H.H. Rink. 1992. Communicating Radon Risks Effectively: The Maryland Experience.” Journal of Public Policy and Marketing, 11(2), 1992, 68-78.
39
Ethier, R.G., Poe, G.L., Schulze, W.D., Clark, J., 2000. A comparison of hypothetical phone and mail contingent valuation responses for greenpricing electricity programs. Land Economics 76, 54–67.
“Electric Power Industry Overview 2007.” Energy Information Administration. http://www.eia.doe.gov/cneaf/electricity/page/prim2/toc2.html
Elliot, D.L.; Wendell, L.L. and Gower, G.L. 1987. An Assessment of the Available Windy Land Area and Wind Energy Potential in Contiguous United States. Pacific Northwest Laboratory operated for the US Department of Energy Battelle Memorial Institute.
Elliott, D.L. and M.N. Schwartz. 1993. Wind Energy Potential in the United States. PNL-SA 23109. Richland, WA: Pacific Northwest Laboratory. NTIS no. DE94001667.
Fremeth, A. 2009. The Dynamic Relationship between Firm Capabilities, Regulatory Policy, and Corporate Environmentalism. Unpublished dissertation. University of Minnesota
Gossling, S., Kunkel, T., Schumacher, K., Heck, N., Birkemeyer, J., Froese, J., Naber, N., Schliermann, E., 2005. A target group-specific approach to ‘‘green’’ power retailing: students as consumers of renewable energy. Renewable & Sustainable Energy Reviews 9, 69–83.
Green, GP., Fleischmann, A., and Kwong, T.M. 1996. The Effectiveness of Local Economic Development Policies in the 1980s. Social Science Quarterly, 77(3): 609-625
Hamilton, JT. 1997. Taxes, torts, and the toxics release inventory: Congressional voting on instruments to control pollution. Economic Inquiry 35(4): 745-762.
Heckman, J. 1978. Dummy endogenous variables in a simultaneous equation system. Econometrica, 46(6), 931–959.
Helland, E. 1998. Environmental protection in the federalist system: the political economy of NPDES inspections. Economic Inquiry. 31(2): 1465-7295
Kahn, ME. 2002. Demographic change and the demand for environmental regulation. Journal of Policy Analysis and Management 21(1): 45-62.
Kassinis G, Vafeas N. 2002. Corporate boards and outside stakeholders as determinants of environmental litigation. Strategic Management Journal 23(5): 399-415.
Kassinis G, Vafeas N. 2006. Stakeholder Pressures and Environmental Performance. Academy of Management Journal 49(1): 145-159.
Keeler, A. G. 2007. State greenhouse gas reduction policies: a move in the right direction? Policy Science 40: 353-365.
Kahn, M. E. 2007. Do greens drive Hummers or hybrids? Environmental ideology as a determinant of consumer choice, Journal of Environmental Economics and Management. 54: 129-154.
Khanna, M and L. Damon, L. 1999. EPA’s voluntary 33/50 program: impact on toxic releases and economic performance of firms, Journal of Environmental Economics and Management. 37: 1–25.
40
King AA, Lenox MJ. 2000. Industry self-regulation without sanctions: The chemical industry's Responsible Care Program. Academy of Management Journal 43(4): 698-716
Kim, E-H. 2009. Does Competition Promote Environmental Investments? Retail Electricity Deregulation and Renewable Generation. Working paper.
Loureiro, M.L., and Lotade, J. (2005). Do fair trade and eco-labels in coffee wake up the consumer conscience? Ecological Economics, 53(1), 129-138.
Loureiro, M.L. (2003). Rethinking new wines: Implications of local and environmentally friendly labels. Food Policy, 28(5-6), 547-560.
Leire, C., and Thidell, A. (2005). Product-related environmental information to guide consumer purchases – A review and analysis of research on perceptions, understanding and use among Nordic consumers. Journal of Cleaner Production, 13(10, 11), 1061-1070.
Lubell M, Schneider M, Scholz JT, Mete M. 2002. Watershed Partnerships and the Emergence of Collective Action Institutions. American Journal of Political Science 46(1): 148-163.
Lyon, T.P., Yin, H., 2008. Why Do States Adopt Renewable Portfolio Standards?: An Empirical Investigation. Mimeo, University of Michigan.
Rep. Union of Concerned Scientists 2008. Renewable Energy Portfolio Standard Summary <http://www.ucsusa.org/assets/documents/clean_energy/massachusetts.pdf>.
Maxwell JW, Lyon TP, Hackett SC. 2000. Self-regulation and social welfare: The political economy of corporate environmentalism. Journal of Law and Economics
43(2): 583-617.
Menz, FC. 2005. Green electricity policies in the United States: case study. Energy Policy 33: 2398-410.
Menz, F and Vachon, S. 2006. The effectiveness of different policy regimes for promoting wind power: Experiences from the states. Energy Policy 34: 1786-1796.
Michaels, R. J. 2008. National Renewable Portfolio Standard: Smart policy or misguided gesture? Energy Law Journal 29(79): 79-119
Milbrandt, A. 2005. Geographic Perspective on the Current Biomass Resource Availability in the United States. NREL Report No. TP-560-39181.
Pressman, J. L. and Wildavsky, A. 1973. Implementation. Los Angeles: University of California Press, Ltd.
Rep. Union of Concerned Scientists 2008. Renewable Portfolio Standard Summary.<http://www.ucsusa.org/assets/documents/clean_energy/new-york.pdf>.
Riddel, M. 2003. Candidate eco-labeling and senate campaign contributions. Journal of Environmental Economics and Management 45(2): 177-194
Rivera, J. 2002. Assessing a voluntary environmental initiative in the developing world: The Costa Rican Certification for Sustainable Tourism. Policy Sciences 35(4): 333-360.
Rivera J, and DeLeon P. 2004. Is greener whiter? The Sustainable Slopes Program and the Voluntary Environmental Performance of western ski areas. Policy Studies Journal 32(3): 417-437.
41
Roe et al. 2001. US consumers’ willingness to pay for green electricity. Energy Policy 29: 917-925.
Rossi, J. 2010. The Limits of a National Renewable Portfolio Standard. Connecticut Law Review 42(5): 1425-1450
Russo, M. V. 2003. The emergence of sustainable industries: Building on natural capital. Strategic Management Journal, 24: 317–331.
Sine, W., & Lee, B. 2009. Tilting at Windmills? The environmental movement and the emergence of the U.S. Wind Energy Sector. Administrative Science Quarterly,54(123–155).
Solsky, ST., and Bielenberg. AC. 2004. "State RPS- A regulatory wind incentive." Project Finance International 297 (2004): 67-70. Baker Botts LLP. <http://www.bakerbotts.com/fcwsite/otherfiles/sfx31.pdf>.
Vachon, S. and. Menz. FC. 2006. "The role of social, political, and economic interests in promoting state green energy policies." Environmental Science and Policy 9: 652-62.
Vandenberghe, V. and Robin, S. 2004. Evaluating the effectiveness of private education across countries: a comparison of methods. Labour Economics, 11(4):487-506
Viscusi, WK, Hamilton JT. 1999. Are Risk Regulators Rational? Evidence from Hazardous Waste Cleanup Decisions. American Economic Review 89(4): 1010-1027.
Welch EW, Mazur A, and Bretschneider S. 2000. Voluntary behavior by electric utilities: Levels of adoption and contribution of the Climate Challenge Program to the reduction of carbon dioxide. Journal of Policy Analysis and Management 19(3): 407-424.
Wiser, R, and Barbose, G. 2008. Renewables Portfolio Standards in the United States: A Status Report with Data through 2007. Rep. Lawrence Berkeley National Laboratory..
Wiser, R. H., M. Fowlie and E. A. Holt (2001), ‘Public Goods and Private Interests: Understanding Non-Residential Demand for Green Power’, Energy Policy 29, 1085–1097.
Wiser, Ryan, Christopher Namovicz, Mark Gielecki, and Robert Smith. 2007.The Experience with Renewable Portfolio Standards in the United States. The Electricity Journal: 8-20.
Zarnikau, J. 2003. Consumer demand for ‘green power’ and energy efficiency. Energy Policy 31, pg. 1661-1672.
Yin, H. and N. Powers. 2010. Do state renewable portfolio standards promote in-state renewable generation? Energy Policy 38(2), 1140–1149.
42
APPENDIX
Table A0. Renewable policies and total electric capacity by state in 2007.
State RPS MGPO DISCLOSURE TAX* Capacity (MW) Percentage of Renewable Capacity
Alabama 30,614 1.87 % Alaska 1,961 < 1% Arizona X X 25,579 2.28% Arkansas 15,296 < 1% California X X 63,813 5.75% Colorado X X X X 12,288 7.92% Connecticut X X X 7,725 2.56 % Delaware X X X 3,357 < 1% Florida X X 55,451 1.83% Georgia X 36,472 1.79% Hawaii X X 2,436 7.97% Idaho X 3,196 5.71% Illinois X X X 42,731 1.85% Indiana X 27,021 < 1% Iowa X X X X 12,287 8.85% Kansas X 11,241 2.98% Kentucky X 19,968 < 1% Louisiana X 26,323 1.41% Maine X X X 4,213 17.91% Maryland X X X 12,486 1.14% Massachusetts X X X 13,557 2.46% Michigan X X 30,305 1.27% Minnesota X X X 12,890 11.33% Mississippi 16,204 1.23% Missouri X 20,558 < 1% Montana X X X 5,479 3.75% Nebraska X 6,971 1.09% Nevada X X X 9,954 3.37% New Hampshire X X 4,280 4.23% New Jersey X X X 18,352 1.23% New Mexico X X X 7,202 6.31% New York X X X 39,121 2.01% North Carolina X X 27,644 1.24% North Dakota X X 5,091 7.35% Ohio X X 33,755 < 1% Oklahoma X 19,962 3.56% Oregon X X X X 13,209 9.00% Pennsylvania X X X 45,106 1.70% Rhode Island X X X 1,782 1.29% South Carolina X 23,566 10.06% South Dakota X 2,870 1.38% Tennessee X 20,861 <1% Texas X X X 101,938 4.28%
43
State RPS MGPO DISCLOSURE TAX* Capacity (MW) Percentage of Renewable Capacity
Utah X 7,122 < 1% Vermont X X 1,111 8.35% Virginia X X 22,992 2.94% Washington X X X X 28,615 5.27% West Virginia X 16,099 < 1% Wisconsin X X 16,365 2.19% Wyoming X 6,667 4.08%
* Tax column includes corporate, sales, and property taxes. An “X” demonstrates that a state has implemented at least one of these taxes.
44
Table A1. Description of the variables.
Name Description Source
Renewable Capacity
Nameplate capacity: sum of the maximum rated output of all renewable units, excluding hydro, owned by the utility (MW)
Energy lnformation Administration (EIA), Form 860
RPS RPS program based on the enacted year Database of State Incentives for Renewable Energy (DSIRE)
Mandatory Green Power Option (MGPO)
Mandatory Utility Green Power Option for Renewable Energy using enacted year
Several states require certain electric utilities to offer customers the option of buying electricity generated from renewable resources, commonly known as “green power.” Typically, utilities offer green power generated using renewable resources that the utilities own (or for which they contract), or they buy renewable energy credits (RECs) from a renewable energy provider certified by a state public utilities commission
Database of States Incentives for Renewable Energy (DSIRE)
http://www.dsireusa.org
Disclosure Disclosure program based on enacted year
1 the enacted year and after, 0 otherwise
Database of States Incentives for Renewable Energy (DSIRE)
http://www.dsireusa.org
Financial incentives
Index of corporate, sales and property tax Database of States Incentives for Renewable Energy (DSIRE)
http://www.dsireusa.org
Wind Potential Sum of km2 of land subject to all class of wind with environmental exclusion27 and moderate land-use28 exclusions
Elliot, Wendell & Gower, 1987.
Solar Potential Ratio of insolation National Renewable Energy Laboratory (NREL)
http://www.nrel.gov
Biomass Potential
Biomass tons Milbrandt 2005
Deregulation Deregulation based on enacted year. Energy lnformation Administration (EIA)
27 Environmental exclusion areas are defined as largely represent natural areas including parks, monuments, wilderness areas, ecological preserves, and wildlife refuges where industrial, commercial, and residential developments are restricted or very 1imited. 28 Land-use exclusion considers the 11 land-use types: 1) agricultural land; 2) range land; 3) mixed agricultural and range land; 4) deciduous forest ; 5) coniferous forest; 6) mixed forest; 7) urban land; 8) barren land; 9) nonforested wetland, 10) water; and 11) open, low scrub land.
45
Name Description Source
It takes 1 the enacted year and after, 0 Otherwise http://www.eia.doe.gov/cneaf/electricity/page/restructuring/restructure_elect.html
Dem. Governor
Democrat governorship National Conference of the State Legislature
http://www.ncsl.org
Dem. Representative
Weighted Percentage of house and senates seats occupied by democrats
National Conference of the State Legislature
http://www.ncsl.org
League Conservation Voters
Score for LCV League Conservation Voters
http://lcv.org
Sierra Club Membership
Sierra Membership over total population per state
Sierra Club chapters
Renewable Associations
Presence of American Solar Energy Society ASES Chapter in each state.
Includes both solar and renewable chapters.
ASES Member listing
http://www.ases.org
Percentage of renewable generation
Percentage of renewable generation excluding hydro over the total net generation of total electric industry at state level
Energy lnformation Administration, State Electric Profiles
http://tonto.eia.doe.gov/state
Emissions Factor of CO2, SO2 and NOx emissions Environmental Protection Agency, Clean Air market.
http://www.epa.gov/airmarkt/
Income per capita
Per capita income per thousand dollars
This measure of income is calculated as the income of the residents of a given area divided by the resident population of the area
Bureau of Economic Analysis (BEA)
http://www.bea.gov
Unemployment
Unemployment rate
Bureau of Labor Statistics
http://www.bls.gov
Electricity Retail Price
Average price for total electric industry (Cents per KWh)
Energy lnformation Administration, State Electric Profiles
http://tonto.eia.doe.gov/state
Investor Owned
Dummy for investor owned utilities Investor-owned electric utilities are privately-owned entities29
Green residential customers
Percentage of residential customers that purchase green power over total number of residential customers served by the utility
Energy lnformation Administration (EIA), Form 861
Percentage of Percentage of generation from fossil fuels Energy lnformation Administration (EIA),
29 EIA website: Investor owned utilities represent 6 percent of the total number of electric utilities and approximately 38 percent of utility installed capacity, 42 percent of generation, 66 percent of sales, and 67 percent of revenue in the United States.
46
Name Description Source
generation from fossil fuels
Form 906
Total customers
Total number of customers served per utility Energy lnformation Administration (EIA), Form 861
Publicly Owned
Dummy for publicly owned utilities Publicly-owned electric utilities are nonprofit government entities that are organized at either the local or State level30
30 EIA website: Publicly owned utilities are 2,009 publicly-owned electric utilities in the United States. They represent about 61 percent of the number of electric utilities, supply approximately 9 percent of generating capability, 8 percent of generation, and account for about 15 percent of retail sales and 13 percent of revenue.
47
Table A2. Descriptive statistics and correlation matrix of the variables used in the Renewable Portfolio Standard analysis.
N=480. The states of Alaska and Hawaii are not included in the analysis due to lack of data on natural resources. Correlations with values equal or greater than 0.09 are significant at 5% (in bold).
48
Table A3a. Descriptive statistics of the variable used in the renewable capacity model analysis.
Mean SD
Renewable capacity 0.01 0.10
RPS 0.32 0.46
MPGO 0.09 0.28
Disclosure 0.40 0.49
Financial incentives 0.91 0.86
Wind resources 8.75 2.93
Solar resources 19.52 2.68
Biomass resources 9.23 1.07
Deregulation 0.27 0.44
Democratic Governor 45.85 52.92
Democratic representative 48.12 11.43
League of Conservation Voters 41.25 24.48
Sierra membership 1.90 1.17
Renewable associations 0.78 0.41
Percent of electricity generated from renewables 2.07 2.75
Emissions 0.08 1.58
Income per capita 29.69 4.63
Unemployment 4.67 1.20
Electricity retail price 6.87 1.75
Investor owned 0.20 0.40
Green residential customers 0.12 0.72
Percent of generation from fossil fuel 0.82 0.35
Total customers 0.16 0.49
49
Table A3b. Correlation matrix of the variable used in the renewable capacity model analysis.
1 2 3 4 5 6 7 8 9 10 11 12 13
1 Renewable capacity
2 RPS 0.04
3 MPGO 0.00 0.37
4 Disclosure 0.06 0.27 0.21
5 Financial incentives -0.03 0.44 0.14 0.24
6 Wind resources 0.00 0.31 0.18 -0.06 0.16
7 Solar resources 0.02 -0.26 -0.07 -0.38 -0.31 0.24