2.1 General ............................................................................................................................3 2.2 Outfall Locations ..............................................................................................................5 2.3 Outfall Descriptions and Wastewater Treatment ............. Error! Bookmark not defined. 2.4 Changes in Operation ....................................................................................................10
3.0 Permit History ................................................................................................ 10 3.1 Compliance History .......................................................................................................10
4.0 Location Of Discharge/Receiving Water Use Designation........................ 13 4.1 Total Maximum Daily Loads (TMDLs)............................................................................14
5.0 Permit limitations ........................................................................................... 15 5.1 Technology-Based Effluent Limits (TBEL) .....................................................................15 5.2 Water Quality-Based Effluent Limits ..............................................................................16 5.3 Effluent Limitations and Monitoring Requirements by Outfall ........................................17 5.4 Whole Effluent Toxicity (WET) TESTING ......................................................................21 5.5 Antibacksliding .............................................................. Error! Bookmark not defined.1 5.6 Antidegradation ........................................................................................................... 221 5.7 Storm Water ................................................................................................................ 222 5.8 Water Treatment Additives ............................................................................................25
6.0 Permit Draft Discussion .............................................................................. 266 6.1 Discharge Limitations, Monitoring Conditions and Rationale ....................................... 266 6.2 Schedule of Compliance ................................................................................................33 6.3 Consent Decree Requirement-Wastewater Operation and Maintenance Plan ..............33 6.4 Thermal Effluent Requirements .....................................................................................34 6.5 Clean Water Act Section 316(b) Cooling Water Intake Structure(s) (CWIS)..................40 6.6 Streamlined Mercury Variance (SMV) ...........................................................................60 6.7 Spill Response and Reporting Requirement ..................................................................61 6.8 Permit Processing/Public Comment ..............................................................................62
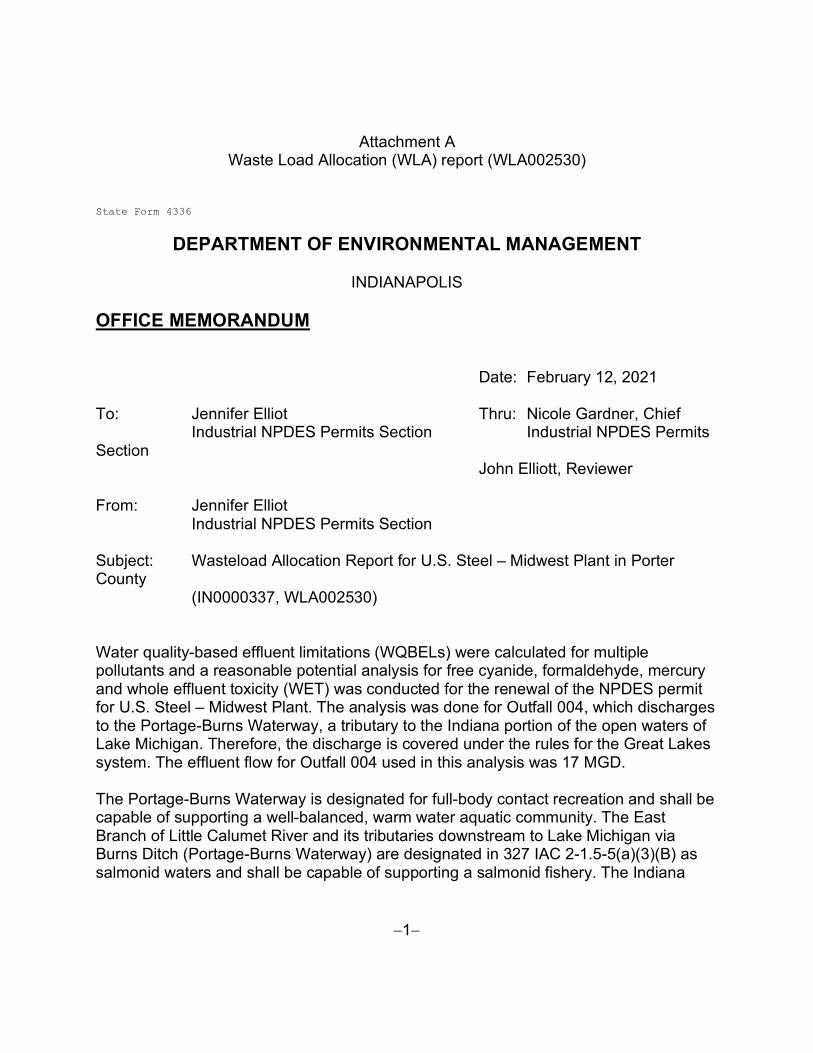
The Indiana Department of Environmental Management (IDEM) received a National Pollutant Discharge Elimination System (NPDES) Permit application from U.S. Steel Corporation – Midwest Plant on October 1, 2020. In accordance with 327 IAC 5-2-6(a), the current five-year permit was issued with an effective date of April 1, 2016. A five-year permit is proposed in accordance with 327 IAC 5-2-6(a). The Federal Water Pollution Control Act (more commonly known as the Clean Water Act), as amended, (Title 33 of the United States Code (U.S.C.) Section 1251 et seq.), requires an NPDES permit for the discharge of pollutants into surface waters. Furthermore, Indiana law requires a permit to control or limit the discharge of any contaminants into state waters or into a publicly owned treatment works. This proposed permit action by IDEM complies with and implements these federal and state requirements. In accordance with Title 40 of the Code of Federal Regulations (CFR) Sections 124.8 and 124.56, as well as Title 327 of the Indiana Administrative Code (IAC) Article 5-3-8, a Fact Sheet is required for certain NPDES permits. This document fulfills the requirements established in these regulations. This Fact Sheet was prepared in order to document the factors considered in the development of NPDES Permit effluent limitations. The technical basis for the Fact Sheet may consist of evaluations of promulgated effluent guidelines, existing effluent quality, receiving water conditions, Indiana water quality standards-based wasteload allocations, and other information available to IDEM. Decisions to award variances to Water Quality Standards or promulgated effluent guidelines are justified in the Fact Sheet where necessary.
2.0 FACILITY DESCRIPTION
2.1 General U.S. Steel Corporation, Midwest Plant is classified under Standard Industrial Classification (SIC) Codes 3316 – Cold Rolled Steel, 3443 – Tin Mill Products and 3325 – Galvanized Steel. The facility manufactures steel and related products. Activities conducted involve acid pickling, cold rolling, alkaline cleaning, operation of sheet temper mill, continuous annealing, electro-galvanizing, and tin electroplating. A map showing the location of the facility has been included as Figure 1.
4
Figure 1: Facility Location
6300 U.S. Highway 12 Portage, Indiana 46368 Porter County
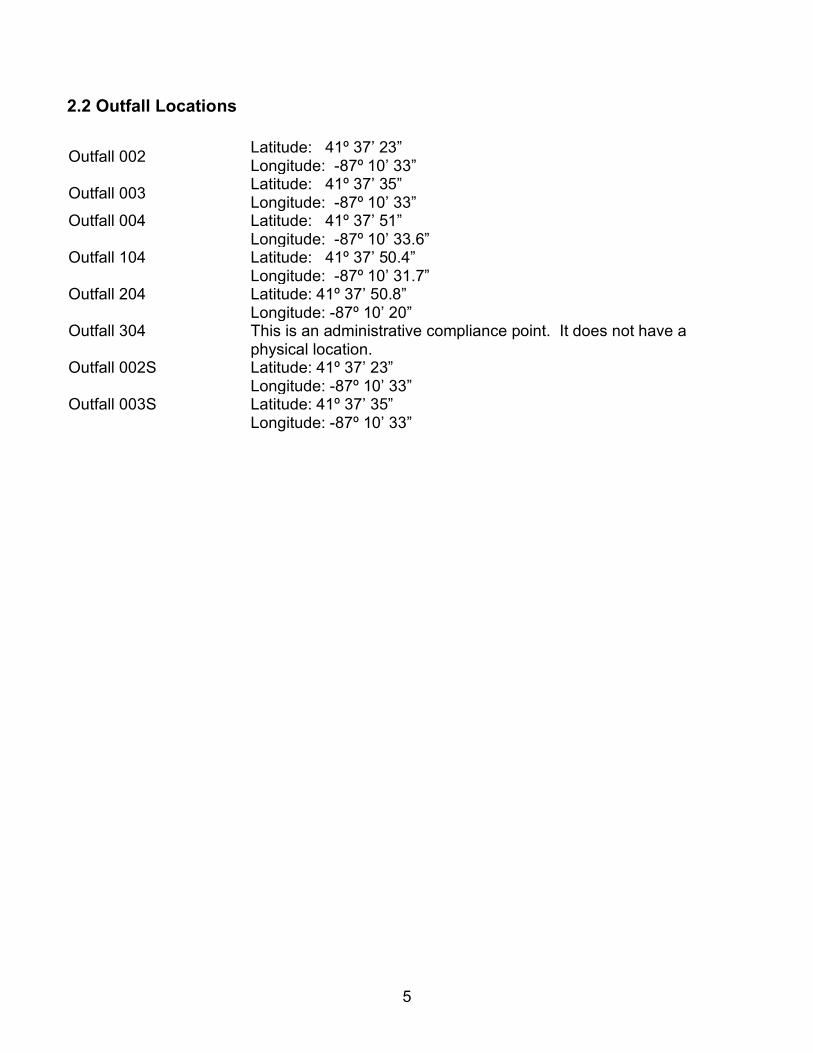
2.3 Outfall Descriptions and Wastewater Treatment Each outfall is described in detail below including waste streams, wastewater treatment, and long-term average flow as given in the renewal application Form 2C. Flows given in (parentheses) were used in the wasteload allocation and/or calculation of mass-based limits and are explained in Sections 5.2 and 5.3 of this fact sheet. The facility has an average total discharge of approximately 38.18 MGD. Outfall 002 The discharge from Outfall 002 is composed of Non-Contact Cooling Water (NCCW) and stormwater. There is no treatment at this outfall. The highest monthly average flow for the last two years, from August 2018 to August 2020, is 0.329 MGD and occurred in March 2019. Outfall 002 discharges to the Portage-Burns Waterway. Outfall 003 The discharge from Outfall 003 is composed of Non-Contact Cooling Water (NCCW) and stormwater. There is no treatment at this outfall. The highest monthly average flow from the last two years, from August 2018 to August 2020, is 15.17 MGD and occurred in September 2019. Outfall 003 discharges to the Portage-Burns Waterway. Outfall 004 The discharge from Outfall 004 is composed of Non-Contact Cooling Water (NCCW), stormwater, and process wastewater from internal Outfalls 104 and 204 (Administrative Outfall 304). The highest monthly average flow from the last two years, from August 2018 to August 2020, is 17.06 and occurred in August 2018. Outfall 004 discharges to the Portage-Burns Waterway. Outfall 104 Outfall 104 is composed of treated non-hexavalent chromium process wastewaters (continuous anneal line, No. 1 and 2 tin recoil lines, electrolytic tinning line, chrome line, No. 3 galvanize line. 72-inch galvanizing line, pickle line, combination line, sheet temper mill), backwashes, washdowns, blowdowns from Portside Energy and the U.S. Steel – Midwest intake. Treatment includes flow equalization and mixing, API oil separating, dissolved air floatation, settling and a filter press. Outfall 104 discharges to the Portage-Burns Waterway via Outfall 304, which discharges via Outfall 004. Outfall 204 Outfall 204 is composed of Chrome treatment plant effluent (treated Greenbelt II Landfill leachate and hexavalent chromium bearing wastewaters from the Tin Free Steel, Electrolytic Tinning, and Galvanizing Lines). The chrome treatment plant treats hexavalent chrome bearing wastewaters from the Tin Free Steel (TFS), Electrolytic Tinning Lines (ETL), and Galvanizing Lines via a reduction process (i.e., chrome removal) using sodium bisulfite, sulfuric acid, and sodium hydroxide. Outfall 204 discharges to the Portage-Burns Waterway via Outfall 304, which discharges via Outfall 004. Outfall 304 Outfall 304 is an administrative compliance point and is where the sum of the mass for the internal Outfalls 104 and 204 is applied. Sampling at 104 and 204 must occur on the same day.
7
Outfall 500 Outfall 500 is an instream compliance point used, to measure compliance with the applicable temperature criteria. Water balance diagrams have been included as Figures 2a and 2b.
8
Figure 2a: Water Balance Diagram Outfalls 002, 003 and 004
9
Figure 2b: Water Balance Diagram Outfalls 104 and 204
10
2.4 Changes in Operation In the permit application, no changes in operation were identified as occurring since the previous permit renewal. 2.5 Facility Storm Water There is no suitable storm water sampling location available that will allow effective sampling in accordance with the storm water event requirements. Therefore, under the current permit, the facility conducted storm water sampling at Outfalls 002 and 003 in lieu of sampling at internal monitoring points. This practice is continued for this permit renewal and storm water reporting requirements have been included in Outfalls 002 and 003.
3.0 PERMIT HISTORY
3.1 Compliance History 3.1.1 Review of Discharge Monitoring Report Data A review of this facility’s discharge monitoring data was conducted for compliance verification. This review indicates the permit limitation violations listed in Section 3.1.2.A.1. 3.1.2 Federal and State Enforcement Actions There are two ongoing enforcement actions related to this NPDES permit. There is a joint federal-state enforcement action that was initiated in April 2018 and a state enforcement action that was initiated by a notice of violation issued October 31, 2019. A summary of these two enforcement actions is as follows: A. April 2018 Joint State and Federal Enforcement Action On April 2, 2018, the U.S. Department of Justice, on behalf of the U.S. Environmental Protection Agency, the National Park Service of the United States Department of the Interior, and the National Oceanic and Atmospheric Administration of the U.S. Department of Commerce; and the State of Indiana, on behalf of the Indiana Department of Environmental Management and the Indiana Department of Natural Resources lodged a proposed Consent Decree with the United States District Court for the Northern District of Indiana in United States and State of Indiana v. United States Steel Corporation, Civil Action No. 2:18-cv-00127. The lodging of the proposed Decree immediately followed the filing in the same court of a civil complaint (Complaint) against United States Steel Corporation (U.S. Steel). After lodging the proposed consent decree in April 2018, approximately 2,700 public comments were received, including extensive comments from the City of Chicago and the Surfrider Foundation (plaintiff intervenors in the Governments’ action). Having taken those comments into account, a revised proposed decree was filed in November 2019.
11
U. S. Steel has already complied with several requirements of the proposed decree that was lodged in April 2018, including enhanced daily wastewater sampling, even though the decree has not been in effect. Once the decree is entered, all of the decree’s requirements, including implementation of key operation and maintenance plans and an improved wastewater process monitoring system, will be enforceable. When fully implemented, the decree is expected to help prevent future spills such as the April 2017 spill, and to achieve the decree’s objective of promoting U. S. Steel’s compliance with the Clean Water Act and related requirements. Both IDEM and EPA have established websites for this enforcement action at: IDEM Website: https://www.in.gov/idem/cleanwater/2538.htm EPA Website: https://www.epa.gov/in/u-s-steel-corporation-consent-decree The following is a list of alleged NPDES permit violations listed in the Compliant that was filed for this enforcement action: 1. Violations of Quantitative and Qualitative Limits
Outfall Violation Date(s) of Violation Violation Type
304A Chromium, Total Recoverable 02/03/2013 Daily Maximum Effluent Limit; Operations & Maintenance
NA Storm water 1/2016 Failure to submit 2015 SWPPP Annual Report
500A Reporting
04/23/2016 Incorrectly calculated temperature difference Incorrectly calculated temperature difference Incorrectly calculated temperature difference Incorrectly calculated temperature difference
500A Reporting 08/21/2016 Incorrectly calculated temperature difference
NA Reporting 10/2016 Missing Total Toxic Organic Certification 002, 003 Monitoring 12/2016 Failure to monitor weekly pH
204A, 304A Monitoring 12/2016 Failure to monitor multiple parameters NA Storm water 04/20/2017 Incomplete SWPPP
13
B. October 31, 2019 IDEM Enforcement Action. With respect to this enforcement action, IDEM issued notice of violations (NOVs) to the permittee on October 31, 2019, December 13, 2019, and February 7, 2020. In addition, an IDEM inspection summary dated October 26, 2020 for an inspection conducted October 7, 2020 noted additional violations and referred those violations to IDEM enforcement. A summary of the violations noted in these NOVs and inspection summary are as follows: 1. Numerous discharges of foam, scum, solids, discolored effluent and/or an oil sheen at
Outfall 004 and Outfall 003. 2. Failure to notify downstream users of spills in May and September 2019. 3. Failure to minimize or correct adverse impacts to the environment resulting from permit
noncompliance on May 9, 2019 and October 30, 2019. 4. Failure to provide information requested by IDEM in May 2019. 5. Failure to maintain all treatment and collection facilities and systems in good working order
on May 9, 2019 and August 20, 2019, and in September 2019 and December 2019. 6. Reporting hourly average temperatures on its DMR instead of the maximum hourly
temperatures as required by the permit. 7. Violation of daily maximum copper limitation at Outfall 004 on October 13, 2019. 8. Violation of daily maximum load limit for hexavalent chromium at Outfall 304 on October 30,
2019. 9. Deficiencies in chain of custody reports in August 2020 and September 2020.
4.0 LOCATION OF DISCHARGE/RECEIVING WATER USE DESIGNATION
The receiving stream for Outfalls 002, 003, and 004 is the Portage-Burns Waterway (this stream is also referred to as Burns Ditch [in Indiana water quality rules] and the Little Calumet River [on USGS Topo maps]. The Q7,10 low flow value of the Portage-Burns Waterway is 100 cfs. The Portage-Burns Waterway is designated for full-body contact recreation and shall be capable of supporting a well-balanced, warm water aquatic community in 327 IAC 2-1.5-5(a)(1) and (a)(2). In addition, the “East Branch of Little Calumet River and its tributaries downstream to Lake Michigan via Burns Ditch” (Portage-Burns Waterway) are designated in 327 IAC 2-1.5-5(a)(3)(B) as salmonid waters and shall be capable of supporting a salmonid fishery. The Indiana portion of the open waters of Lake Michigan is classified in 327 IAC 2-1.5-19(b)(2) as an outstanding state resource water (OSRW). The permittee discharges to a waterbody that has been identified as a water of the state within the Great Lakes system. Therefore, it is subject to NPDES requirements specific to Great Lakes system dischargers under 327 IAC 2-1.5 and 327 IAC 5-2-11.4 through 11.6. These rules contain water quality standards applicable to dischargers within the Great Lakes system and the procedures to calculate and incorporate water quality-based effluent limitations. A Site Map has been included as Figure 3.
14
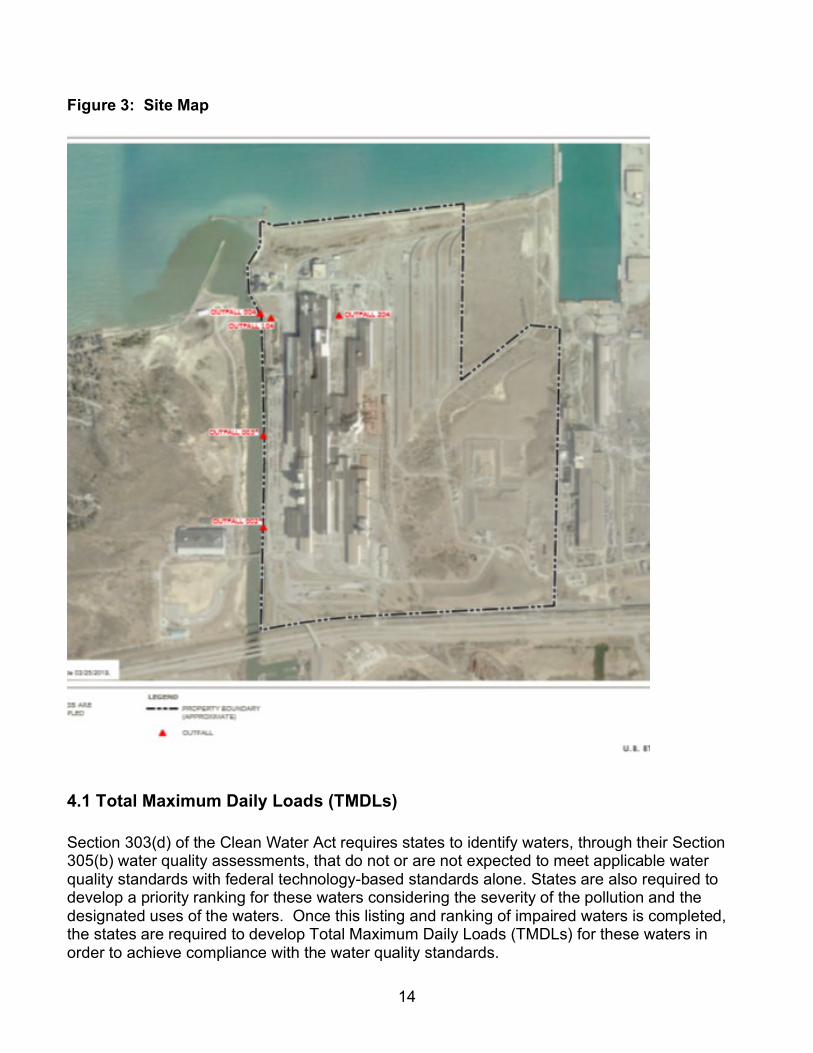
Figure 3: Site Map
4.1 Total Maximum Daily Loads (TMDLs) Section 303(d) of the Clean Water Act requires states to identify waters, through their Section 305(b) water quality assessments, that do not or are not expected to meet applicable water quality standards with federal technology-based standards alone. States are also required to develop a priority ranking for these waters considering the severity of the pollution and the designated uses of the waters. Once this listing and ranking of impaired waters is completed, the states are required to develop Total Maximum Daily Loads (TMDLs) for these waters in order to achieve compliance with the water quality standards.
Indiana's 2018 303(d) List of Impaired Waters was developed in accordance with Indiana's Water Quality Assessment and 303(d) Listing Methodology for Waterbody Impairments and Total Maximum Daily Load Development for the 2018 Cycle. The Portage-Burns Waterway, Burns Ditch, (Assessment-Unit INC 0159_02), HUC (40400010509), is on the 2018 303(d) list for PCBs in fish tissue. A TMDL for the Burns Ditch (Assessment Unit INC 0159-02) has been developed for E. Coli. https://www.in.gov/idem/nps/2853.htm
5.0 PERMIT LIMITATIONS
Under 327 IAC 5-2-10 (see also 40 CFR 122.44), NPDES permit limits are based on either TBELs (including TBELs developed on a case-by-case basis using BPJ, where applicable) or WQBELs, whichever is most stringent. The decision to limit or monitor the parameters contained in this permit is based on information contained in the permittee’s NPDES application, and other available information relating to the facility and the receiving waterbody. In addition, when renewing a permit, the existing permit limits and the antibacksliding requirements under 327 IAC 5-2-10(a)(11) must be considered.
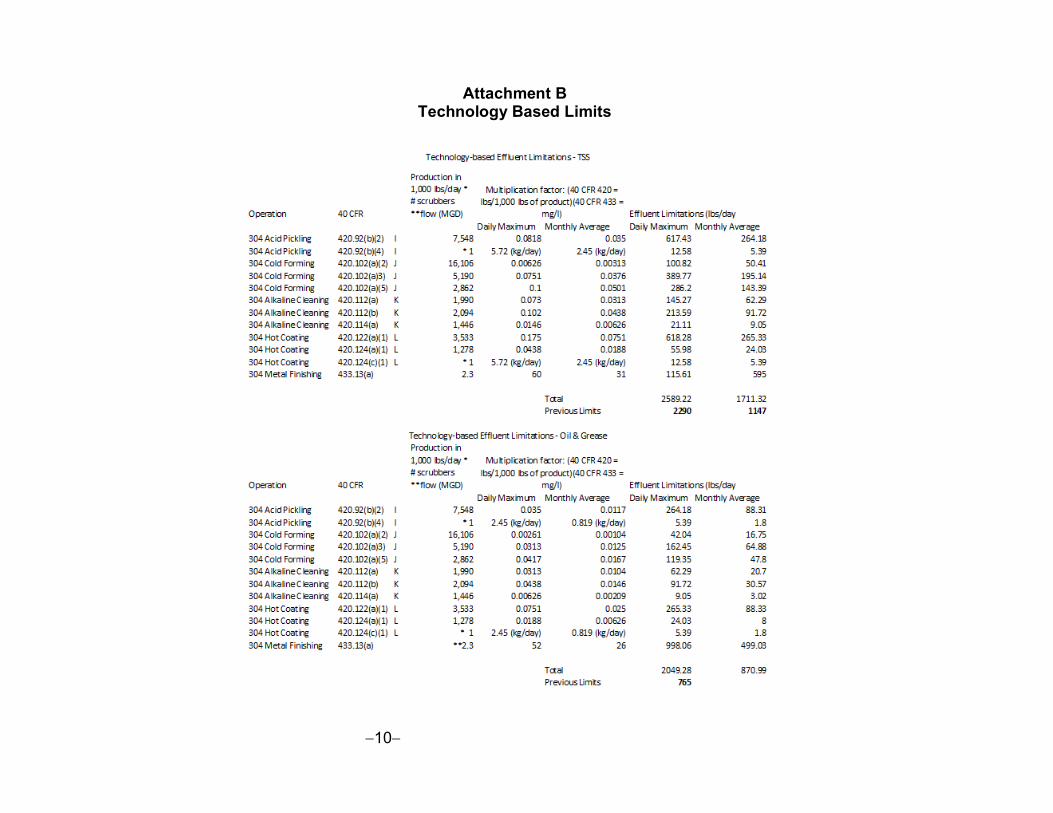
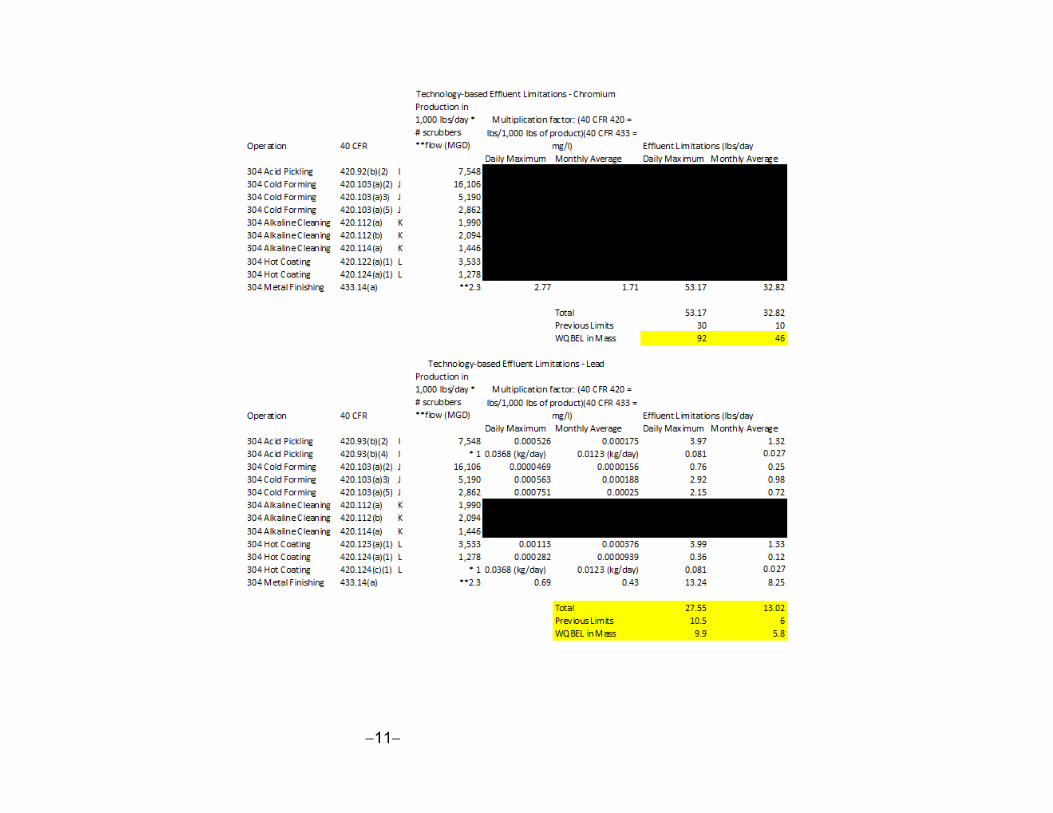
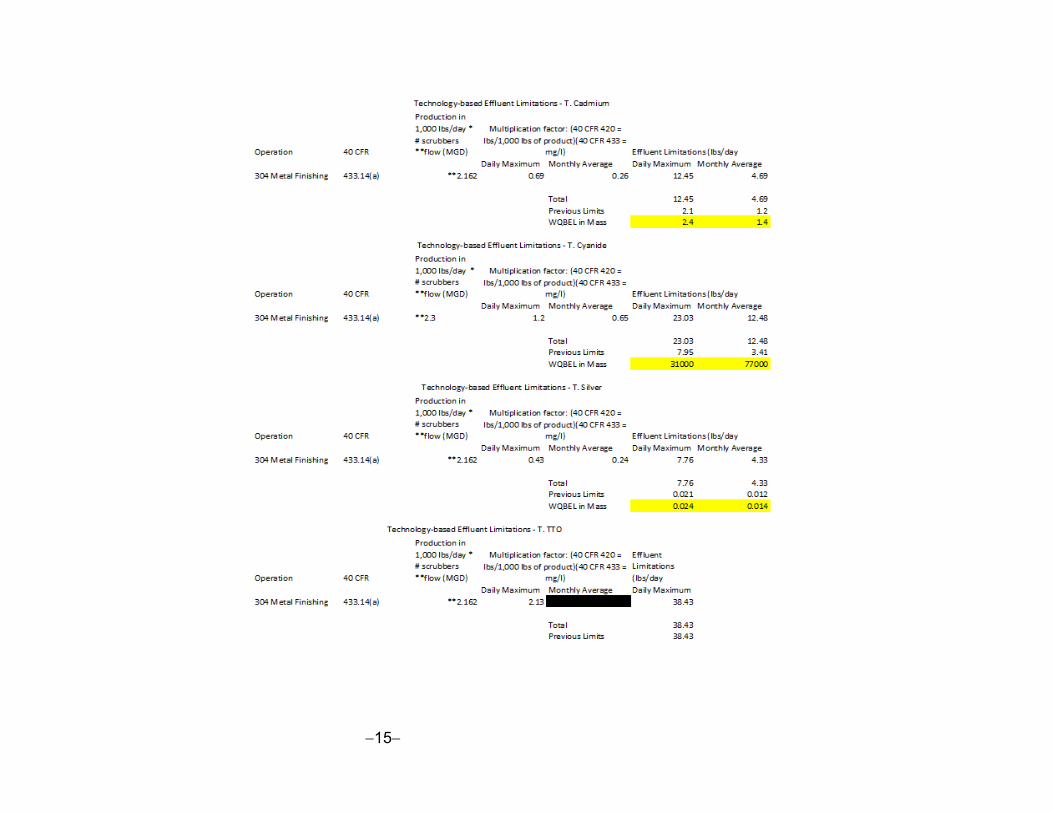
5.1 Technology-Based Effluent Limits (TBEL) TBELs require every individual member of a discharge class or category to operate their water pollution control technologies according to industry-wide standards and accepted engineering practices. TBELs are developed by applying the National Effluent Limitation Guidelines (ELGs) established by EPA for specific industrial categories. Technology-based treatment requirements established pursuant to sections 301(b) and 306 of the CWA represent the minimum level of control that must be imposed in an NPDES permit (327 IAC 5-5-2(a)). In the absence of ELGs, TBELs can also be established on a case-by-case basis using best professional judgment (BPJ) in accordance with 327 IAC 5-2-10 and 327 IAC 5-5 (which implement 40 CFR 122.44, 125.3, and Section 402(a)(1) of the Clean Water Act (CWA)). For each of the basic steelmaking and steel finishing operations, the NPDES production rates developed by US Steel Midwest were used in combination with the BPT, BAT, BCT effluent limitations and guidelines or NSPS from 40 CFR 420 (Iron and Steel Manufacturing Point Source Category) and 40 CFR 433 (Metal Finishing Point Source Category), as appropriate, to compute the allowable technology based effluent limitations of the regulated pollutants. The applicable technology based standards for the US Steel Corp, Midwest are contained in 40 CFR 420 Iron and Steel Manufacturing, Subparts I (Acid Pickling), J (Cold Forming), K (Alkaline Cleaning), L (Hot Coating) and 40 CFR 433 – Metal Finishing Category.
3,865 1,990 Sheet Batch Annealing 420.112(a) 3,962 2,094 Tin Continuous Annealing 420.112(b) 474 1,446 Tin Cleaner Line (CLNM) 420.114(a)
304 (Hot Coating)
3,057
3,533
72” Cont Galvanizing Line 420.122(a)(1) 48” Galvanizing Line (inactive)
1,375 1,278 No. 3 Cont Galvanizing Line 420.124(a)(1) --
1 Unit
Fume Scrubber for No. 3 Continuous Galvanizing Line
420.124(c)(1)
304 (Metal Finishing)
2.3MGD/2.162 MGD
2.3 MGD/ 2.162 MGD
Electrolytic Tinning Line 433.13(a) Tin Free Steel Line 433.13(a)
Attachment B includes the production/flow values for the applicable operations, the multiplication factors from the applicable Federal Effluent Guidelines, and the resulting technology based effluent limitations applied at Outfall 304.
5.2 Water Quality-Based Effluent Limits WQBELs are designed to be protective of the beneficial uses of the receiving water and are independent of the available treatment technology. The WQBELs for this facility are based on water quality criteria in 327 IAC 2-1.5-8 or developed under the procedures described in 327 IAC 2-1.5-11 through 16 and implementation procedures in 327 IAC 5. Limitations are required for any parameter which has the reasonable potential to exceed a water quality criterion as determined using the procedures under 327 IAC 5-2-11.5. For each pollutant receiving TBELs at an internal outfall, and for which water quality criteria or values exist or can be developed, concentration and corresponding mass based WQBELs are calculated at the final outfall. This was done for the following parameters at Outfall 004: cadmium, hex. chromium, total chromium, copper, lead, nickel, silver, zinc, total cyanide, naphthalene, and tetrachloroethylene. The mass-based WQBELs at the final outfall were compared to the mass-based TBELs at the internal outfall. Since the facility is authorized to discharge up to the mass-based TBELs at the internal outfall, if the mass-based TBELs at the internal outfall exceed the mass-based WQBELs at the final outfall, the pollutant may be discharged at a level that will cause an excursion above a numeric water quality criterion or value under 327 IAC 2-1.5 and WQBELs are required at the final outfall. This was the case for the following parameters at Outfall 004: cadmium, copper, lead, nickel and silver. Therefore,
17
WQBELs are required for cadmium, copper, lead, nickel and silver at Outfall 004 regardless of the results of the reasonable potential statistical procedure. However, the results of the reasonable potential statistical procedure were used to help establish the monitoring frequency. As part of this renewal, a Waste Load Allocation (WLA) report was completed and is included as Attachment A.
5.3 Effluent Limitations and Monitoring Requirements by Outfall Under 327 IAC 5-2-10(a) (see also 40 CFR 122.44), NPDES permit requirements are technology-based effluent limitations and standards (including technology-based effluent limitations (TBELs) based on federal effluent limitations guidelines or developed on a case-by-case basis using best professional judgment (BPJ), where applicable), water quality standards-based, or based on other more stringent requirements. The decision to limit or monitor the parameters contained in this permit is based on information contained in the permittee’s NPDES application and other available information relating to the facility and the receiving waterbody as well as the applicable federal effluent limitations guidelines. In addition, when renewing a permit, the existing permit limits, the antibacksliding requirements under 327 IAC 5-2-10(a)(11), and the antidegradation requirements under 327 IAC 2-1.3 must be considered. 5.3.1 All External Outfalls
Minimum Narrative Limitations The narrative water quality criteria contained under 327 IAC 2-1.5-8(b)(1) and (2) have been included in this permit to ensure that these minimum water quality conditions are met. Flow The permittee’s flow is to be monitored in accordance with 327 IAC 5-2-13(a)(2).
5.3.2 Outfalls 002, 003, and 004 The following provides the rationale for inclusion in the permit for the parameters for which monitoring and/or limitations are included at Outfalls 002, 003, and 004.
pH Limitations for pH in the proposed permit are based on the criteria established in 327 IAC 2-1.5-8(c)(2).
Total Residual Chlorine (TRC) The effluent limitations of 0.01 mg/l as a monthly average and 0.02 mg/l as a daily maximum are water quality based and are below the limit of quantitation (LOQ) of 0.06 mg/l. In accordance with 327 IAC 5-2-11.6(h)(3), compliance with the daily maximum limit will be demonstrated when effluent concentrations for total residual chlorine are less
18
than the LOQ. The permittee must comply with the monthly average limit, but may consider daily values that are less than the LOQ to be zero for purposes of calculating a monthly average value.
In accordance with 327 IAC 5-2-11.6(g)(1), mass limits and a mass-based compliance value for TRC are included in the renewal permit at Outfall 002, based on a flow of 0.329 MGD; Outfall 003, based on a flow of 15.17 MGD; and Outfall 004 based on a flow of 17 MGD. The flows used for calculating mass limits are based on the highest monthly flow from August 2018 to August 2020.
The facility adds chlorine to the intake water for Zebra and Quagga mussel control. At Outfalls 002 and 003, TRC monitoring is required on a daily basis during Zebra and Quagga mussel intake chlorination and must continue for three (3) additional days after Zebra and Quagga mussel treatment has been completed. Outfall 004 requires daily TRC monitoring, regardless of the status of Zebra and Quagga mussel control.
Oil and Grease (O & G) If oil and grease is measured in the effluent in significant quantities, the source of such discharge is to be investigated and eliminated. The facility is required to investigate and eliminate any significant or measured concentration of oil and grease (quantities in excess of 5 mg/l). The intent of this requirement is to assure that oil and grease is not added to once-through cooling water in measurable quantities (5 mg/l).
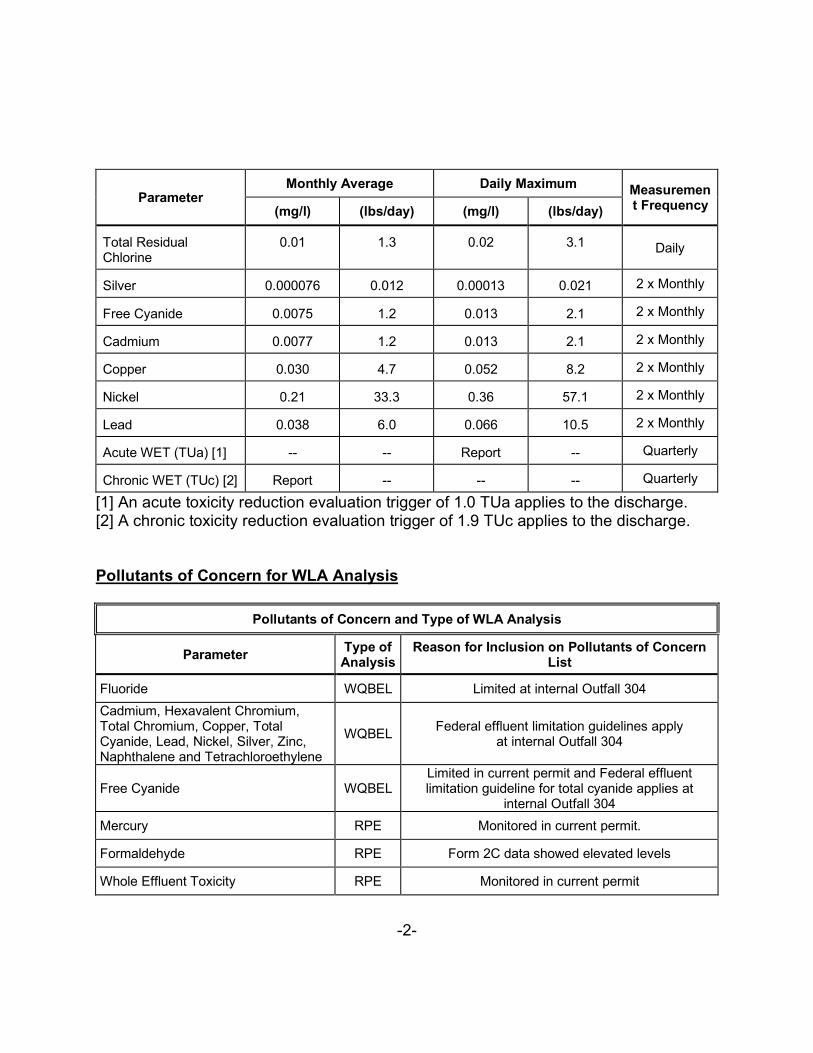
Outfall 004 In addition to the parameters listed above, Outfall 004 includes limits and monitoring requirements for Mercury, Free Cyanide, Silver, Cadmium, Copper, Nickel, Lead, Formaldehyde and Hexavalent Chromium, as follows: Mercury Mercury has been identified as a pollutant of concern discharged at Outfall 004. A reasonable potential analysis for Mercury was conducted in accordance with the reasonable potential statistical procedure in 327 IAC 5-2-11.5(b) as part of a Waste Load Allocation analysis performed by the Indiana Department of Environmental Management, WLA002530. The results of the reasonable potential procedure show that there is a reasonable potential to exceed (RPE) a water quality criterion for Mercury, therefore, concentration limits for Mercury of 3.2 ng/l Daily Maximum and 1.3 ng/l Monthly Average, have been included in the permit. Mass limits of 0.00045 lbs/day Daily Maximum and 0.00018 lbs/day Monthly Average have also been included in this permit. The permittee applied for a Streamlined Mercury Variance. See Section 6.6 for details. Free Cyanide A reasonable potential analysis for Free Cyanide was done in accordance with the reasonable potential statistical procedure in 327 IAC 5-2-11.5(b) as part of a Waste Load
19
Allocation (WLA002530) analysis performed by the Indiana Department of Environmental Management. The results of the reasonable potential procedure show that there was not a reasonable potential to exceed (RPE) a water quality criterion for Free Cyanide. The monthly average and daily maximum limits for Free Cyanide have been retained upon renewal of this permit as TBELs for total cyanide apply at internal Outfall 304 and insufficient information exists pertaining to potential sources of and treatment for cyanide. Formaldehyde Formaldehyde has been identified as a pollutant of concern discharged at Outfall 004. A reasonable potential analysis for Formaldehyde was conducted in accordance with the reasonable potential statistical procedure in 327 IAC 5-2-11.5(b) as part of a Waste Load Allocation analysis performed by the Indiana Department of Environmental Management, WLA002530. The results of the reasonable potential procedure show that there is a reasonable potential to exceed (RPE) a water quality value for Formaldehyde, therefore, concentration limits for Formaldehyde of 0.24 mg/l Daily Maximum and 1.4 mg/l Monthly Average, have been included in the permit. Mass limits of 34 lbs/day Daily Maximum and 20 lbs/day Monthly Average have also been included in this permit. Silver, Cadmium, Copper, Nickel, Lead These parameters have been identified as pollutants of concern, discharged at Outfall 004. The mass-based WQBELs at the final outfall were compared to the mass-based TBELs that apply at internal Outfall 304. The mass-based TBELs at the internal outfall exceed the mass-based WQBELs at the final outfall, therefore, WQBELs are included at Outfall 004. The WQBELs applied in the renewal permit are the more stringent of the limits in the current permit and WQBELs calculated as part of a Waste Load Allocation analysis performed by the Indiana Department of Environmental Management, WLA002530. See Section 5.2 for a detailed discussion on the establishment of limits for these parameters. Hexavalent Chromium Due to compliance issues with Hexavalent Chromium, monitoring requirements have been included in this permit at Outfall 004.
5.3.3 Outfall 500 (Temperature Requirements) The permit establishes an instream compliance point, Outfall 500, to measure compliance with the applicable temperature criteria. The permit authorizes the permittee to either use an equation or use an instream measurement device to determine compliance with the applicable water quality criteria. Section 6.4 of this Fact Sheet describes these temperature requirements in more detail.
20
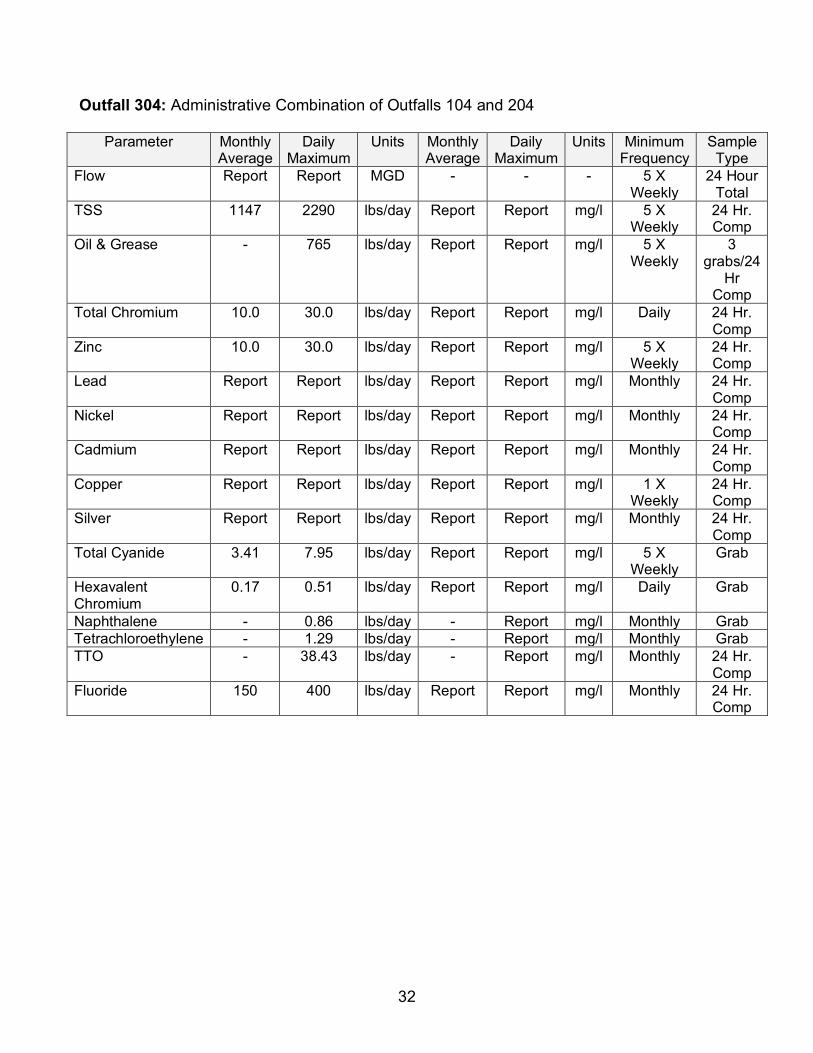
5.3.4 Internal Outfalls 104, 204 and 304 The following provides the rationale for inclusion in the permit for the parameters for which monitoring and/or limitations are included at Outfalls 104, 204 and 304. For all of the parameters below, monitoring requirements only are required at Internal Outfalls 104 and 204. Internal Outfall 304 is an administrative compliance point and is where the sum of the mass limitations for Internal Outfalls 104 and 204 is applied. Sampling at 104 and 204 must occur on the same day. Flow The permittee’s flow is to be monitored in accordance with 327 IAC 5-2-13(a)(2). TSS, Oil & Grease, Total Chromium, Total Zinc, Total Cyanide, Hexavalent Chromium, TTO, Tetrachloroethylene, and Naphthalene The limits calculated using updated information provided in the renewal application are less stringent than those contained in the previous permit, therefore, the limits from the previous permit have been retained in the renewal permit in accordance with the antibacksliding provisions of 40 CFR 122.44(l)(1) and (2). Fluoride The limits calculated using updated information provided in the renewal application are less stringent than those contained in the previous permit, therefore, the limits from the previous permit have been retained in the renewal permit in accordance with the antibacksliding provisions of 40 CFR 122.44(l)(1) and (2). Cadmium, Copper, Lead, Nickel and Silver The Water Quality-Based Effluent Limitations are more stringent at Outfall 004, therefore, the monitoring requirements at Outfalls 104, 204 and 304 have been retained from the previous permit.
5.4 Whole Effluent Toxicity (WET) TESTING
Under 327 IAC 2-1.5-8(b)(1)(E)(ii), a discharge shall not cause acute toxicity, as measured by whole effluent toxicity (WET) tests, at any point in the waterbody. Under 327 IAC 2-1.5-8(b)(2)(A)(iv) a discharge shall not cause chronic toxicity to aquatic life, outside of the applicable mixing zone, as measured by WET tests. Under 327 IAC 5-2-11.5(c)(2), IDEM may include WET test requirements in an NPDES Permit, or if determined to be necessary, WET limits based on a reasonable potential to exceed water quality standards.
WET monitoring was included for Outfall 004 in the 2016 permit renewal. As part of this permit renewal, a reasonable potential to exceed (RPE) analysis for WET was performed for this outfall. The results show that the discharge from Outfall 004 has a reasonable potential to
21
exceed the numeric interpretation of the narrative criterion for both acute and chronic WET. Therefore, WQBELs are required for WET. The WQBELs for WET and the toxicity reduction evaluation (TRE) triggers for the permit renewal for Outfall 004 are included in Appendix B of this Fact Sheet. This does not negate the requirement to submit a water treatment additive (WTA) application and/or worksheet for replacement or new additives/chemicals proposed for use at the site.
Due to pathogen interference in the WET testing program at U.S. Steel – Midwest Plant, IDEM has approved the use of the alternative test method of sampling filtration to demonstrate compliance for fathead minnow testing. This method has been approved by U.S. EPA and, based on prior determination by IDEM, is appropriate for use at U.S. Steel – Midwest Plant.
U.S. Steel Midwest Plant entered into a TRE under the current permit due to a WETT failure in September 2020. Therefore, the facility is currently under a compliance schedule for WET and has suspended WET testing. U.S. Steel Midwest Plant is required to complete the TRE by September 1, 2023. TRE reports are due quarterly, for up to 36 months from the September WETT failure. After successful completion of the TRE, WET testing will continue under the renewal permit and be subject to new limits for acute and chronic WET.
5.5 Antibacksliding Indiana’s prohibitions on backsliding under 327 IAC 5-2-10(a)(11) are applicable to BPJ case-by-case technology-based effluent limitations, when proposed to be increased based on subsequently promulgated effluent guidelines under Section 304(b) of the CWA, and limitations based on Indiana water quality standards or treatment standards (327 IAC 5-10). Prohibitions on other types of backsliding (e.g., backsliding from limitations derived from effluent guidelines, from existing case-by-case limitations to new case-by-case limitations, and from conditions such as monitoring requirements that are not effluent limitations) are covered under federal regulation at 40 CFR 122.44(l)(1). Under 5-2-10(a)(11), unless an exception under 10(a)(11)(B) applies, a permit may not be renewed, reissued or modified to contain effluent limitations that are less stringent than the comparable effluent limitations in the previous permit. For effluent limitations based on Indiana water quality or treatment standards, less stringent effluent limitations may also be allowed if they are in compliance with Section 303(d)(4) of the CWA. Under 40 CFR 122.44(l)(1), a permit may not be renewed or reissued to contain less stringent interim effluent limitations, standards or conditions than the final effluent limitations, standards or conditions in the previous permit unless the circumstances on which the previous permit was based have materially and substantially changed since the time the permit was issued and would constitute cause for permit modification or revocation and reissuance under 40 CFR 122.62. The renewal permit includes effluent limitations based on water quality standards, existing effluent guidelines, and case-by-case TBELs. Under 40 CFR 122.62(a)(1), a cause for modification exists when there are material and substantial alterations or additions to the permitted facility or activity which occurred after permit issuance which justify the application of permit conditions that are different or absent in the existing permit. Per 327 IAC 5-2-16(d)(1), production changes would constitute as “[m]aterial and substantial alterations or additions to the
22
discharger’s operation which were not covered in the effective permit.” The federal ELGs for 40 CFR 420 and 40 CFR 433 have not changed since the previous permit. The calculation of TBELs under existing effluent guidelines in Appendix B provides an increase in applicable limitations for TSS, Oil & Grease, Lead, Zinc, Hexavalent Chromium, Naphthalene and Tetrachloroethylene over those calculated for the 2016 permit renewal. The permittee has not requested an increase in any effluent limitations. IDEM has not made a determination on whether these increases would be considered substantial for purposes of antibacksliding. None of the effluent limitations are proposed to be relaxed, therefore, backsliding is not an issue in this permit renewal. 5.6 Antidegradation
Indiana’s Antidegradation Standards and Implementation procedures are outlined in 327 IAC 2-1.3. The antidegradation standards established by 327 IAC 2-1.3-3 apply to all surface waters of the state. The permittee is prohibited from undertaking any deliberate action that would result in a new or increased discharge of a bioaccumulative chemical of concern (BCC) or a new or increased permit limit for a regulated pollutant that is not a BCC unless information is submitted to the commissioner demonstrating that the proposed new or increased discharge will not cause a significant lowering of water quality, or an antidegradation demonstration submitted and approved in accordance 327 IAC 2-1.3-5 and 2-1.3-6.
This permit includes new permit limitations for Mercury, Formaldehyde and Whole Effluent Toxicity (WET). In accordance with 327 IAC 2-1.3-1(b), the new or increased permit limitations are not subject to the Antidegradation Implementation Procedures in 327 IAC 2-1.3-5 and 2-1.3-6 as the new or increased permit limitations are not the result of a deliberate activity taken by the permittee. A reasonable potential analysis was completed using Mercury data from April 2016 to October 2020 and Formaldehyde data included with the permit renewal application. It was found that there is a reasonable potential to exceed water quality standards for these pollutants. Therefore, limits for Mercury, Formaldehyde, and WET are required in the permit.
5.7 Storm Water Under 327 IAC 5-4-6(d), if an individual permit is required under 327 IAC 5-4-6(a) for discharges consisting entirely of storm water, or if an individual permit is required under 327 IAC 5-2-2 that includes discharge of commingled storm water associated with industrial activity, IDEM may consider the following in determining the requirements to be contained in the permit:
(1) The provisions in the following: (A) 327 IAC 15-5, 327 IAC 15-6, and 327 IAC 15-13, as appropriate to the type of storm water discharge, (B) NPDES Pesticide General Permit for Point Source Discharges to Waters of the State from the Application of Pesticides, Permit Number ING870000, effective October 31, 2011, available at: http://www.in.gov/idem/cleanwater/2480.htm#pesticide or from the IDEM Office of Water Quality, Permits Branch, 100 North Senate Avenue, Indianapolis, IN 46204-2251, and (C) 327 IAC 5-2 [Basic NPDES Requirements], 327 IAC 5-5 [NPDES Criteria and Standards for Technology-based Treatment Requirements], and 327 IAC 5-9 [Best Management Practices; Establishment].
(2) "Interim Permitting Approach for Water Quality-Based Effluent Limitations in Storm Water Permits", EPA 833-D-96-001, September 1, 1996, available from U.S. EPA, National Service Center for Environmental Publications at https://www.epa.gov/nscep or from IDEM. (3) The nature of the discharges and activities occurring at the site or facility. (4) Other information relevant to the potential impact on water quality.
In accordance with 327 IAC 15-2-2(a), the commissioner may regulate storm water discharges associated with industrial activity, as defined in 40 CFR 122.26(b)(14), consistent with the EPA 2008 NPDES Multi-Sector General Permit for Stormwater Discharges Associated with Industrial Activity, as modified, effective May 27, 2009, under an NPDES general permit. Therefore, using Best Professional Judgment to develop case-by-case technology-based limits as authorized by 327 IAC 5-2-10, 327 IAC 5-5, and 327 IAC 5-9 (see also 40 CFR 122.44, 125.3, and Section 402(a)(1) of the Clean Water Act (CWA)), IDEM has developed storm water requirements for individual permits that are consistent with the EPA 2008 NPDES Multi-Sector General Permit for Stormwater Discharges Associated with Industrial Activity. The 2008 Multi-Sector General Permit and Fact Sheet is available from: https://www.epa.gov/npdes/previous-versions-epas-msgp-documents. According to 40 CFR 122.26(b)(14) and 327 IAC 15-6-2 facilities classified under Standard Industrial Classification (SIC) Codes 2216 Coiled Rolled Steel, 3443 – Tin Mill Products and 2225 – Galvanized Steel., are considered to be engaging in “industrial activity” for purposes of 40 CFR 122.26(b). Therefore, the permittee is required to have all storm water discharges associated with industrial activity permitted. Treatment for storm water discharges associated with industrial activities is required to meet, at a minimum, best available technology economically achievable/best conventional pollutant control technology (BAT/BCT) requirements. EPA has determined that non-numeric technology-based effluent limits have been determined to be equal to the best practicable technology (BPT) or BAT/BCT for storm water associated with industrial activity. Storm water associated with industrial activity must also be assessed to ensure compliance with all water quality standards. Effective implementation of the non-numeric technology-based requirements should, in most cases, control discharges as necessary to meet applicable water quality standards. Violation of any of these effluent limitations constitutes a violation of the permit. Additionally, IDEM has determined that with the appropriate implementation of the required control measures and Best Management Practices (BMPs) found in Part I.D. of the permit, the discharge of storm water associated with industrial activity from this facility will meet applicable water quality standards and will not cause a significant lowering of water quality. Therefore, the storm water discharge is in compliance with the antidegradation standards found in 327 IAC 2-1.3-3, and pursuant to 327 IAC 2-1.3-4(a)(5), an antidegradation demonstration is not required. The technology-based effluent limits (TBELs) require the permittee to minimize exposure of raw, final, or waste materials to rain, snow, snowmelt, and runoff. In doing so, the permittee is required, to the extent technologically available and economically achievable, to either locate industrial materials and activities inside or to protect them with storm resistant coverings. In addition, the permittee is required to: (1) use good housekeeping practices to keep exposed
areas clean, (2) regularly inspect, test, maintain and repair all industrial equipment and systems to avoid situations that may result in leaks, spills, and other releases of pollutants in storm water discharges, (3) minimize the potential for leaks, spills and other releases that may be exposed to storm water and develop plans for effective response to such spills if or when they occur, (4) stabilize exposed area and contain runoff using structural and/or non-structural control measures to minimize onsite erosion and sedimentation, and the resulting discharge of pollutants, (5) divert, infiltrate, reuse, contain or otherwise reduce storm water runoff, to minimize pollutants in the permitted facility discharges, (6) enclose or cover storage piles of salt or piles containing salt used for deicing or other commercial or industrial purposes, including maintenance of paved surfaces, (7) train all employees who work in areas where industrial materials or activities are exposed to storm water, or who are responsible for implementing activities necessary to meet the conditions of this permit (e.g., inspectors, maintenance personnel), including all members of your Pollution Prevention Team, (8) ensure that waste, garbage and floatable debris are not discharged to receiving waters by keeping exposed areas free of such materials or by intercepting them before they are discharged, and (9) minimize generation of dust and off-site tracking of raw, final or waste materials. To meet the non-numeric effluent limitations in Part I.D.4, the permit requires the facility to select control measures (including BMPs) to address the selection and design considerations in Part I.D.3. The permittee must control its discharge as necessary to meet applicable water quality standards. It is expected that compliance with the non-numeric technology-based requirements should ensure compliance with applicable water quality standards. However, if at any time the permittee, or IDEM, determines that the discharge causes or contributes to an exceedance of applicable water quality standards, the permittee must take corrective actions, and conduct follow-up monitoring and IDEM may impose additional water quality-based limitations. “Terms and Conditions” to Provide Information in a Storm Water Pollution Prevention Plan (SWPPP) Distinct from the effluent limitation provisions in the permit, the permit requires the discharger to prepare a SWPPP for the permitted facility. The SWPPP is intended to document the selection, design, installation, and implementation (including inspection, maintenance, monitoring, and corrective action) of control measures being used to comply with the effluent limits set forth in Part I.D. of the permit. In general, the SWPPP must be kept up-to-date, and modified when necessary, to reflect any changes in control measures that were found to be necessary to meet the effluent limitations in the permit. The requirement to prepare a SWPPP is not an effluent limitation. Rather, it documents what practices the discharger is implementing to meet the effluent limitations in Part I.D. of the permit. The SWPPP is not an effluent limitation because it does not restrict quantities, rates, and concentrations of constituents which are discharged. Instead, the requirement to develop a SWPPP is a permit “term or condition” authorized under sections 402(a)(2) and 308 of the Act. Section 402(a)(2) states, “[t]he Administrator shall prescribe conditions for [NPDES] permits to assure compliance with the requirements of paragraph (1) of this subsection, including conditions on data and information collection, reporting, and such other requirements as he deems appropriate.” The SWPPP requirements set forth in this permit are terms or conditions
25
under the CWA because the discharger is documenting information on how it intends to comply with the effluent limitations (and inspection and evaluation requirements) contained elsewhere in the permit. Thus, the requirement to develop a SWPPP and keep it up to date is no different than other information collection conditions, as authorized by 327 IAC 5-1-3 (see also CWA section 402(a)(2)). It should be noted that EPA has developed a guidance document, “Developing your Storm Water Pollution Prevention Plan – A guide for Industrial Operators (EPA 833-B09-002), February 2009, to assist facilities in developing a SWPPP. The guidance contains worksheets, checklists, and model forms that should assist a facility in developing a SWPPP. Public availability of documents Part I.E.2.d(2) of the permit requires that the permittee retain a copy of the current SWPPP at the facility and make it immediately available, at the time of an onsite inspection or upon request, to IDEM. When submitting the SWPPP to IDEM, if any information in the SWPPP is considered to be confidential, that information shall be submitted in accordance with 327 IAC 12.1. Interested persons can request a copy of the SWPPP through IDEM. Any information that is confidential pursuant to Indiana law will not be released to the public.
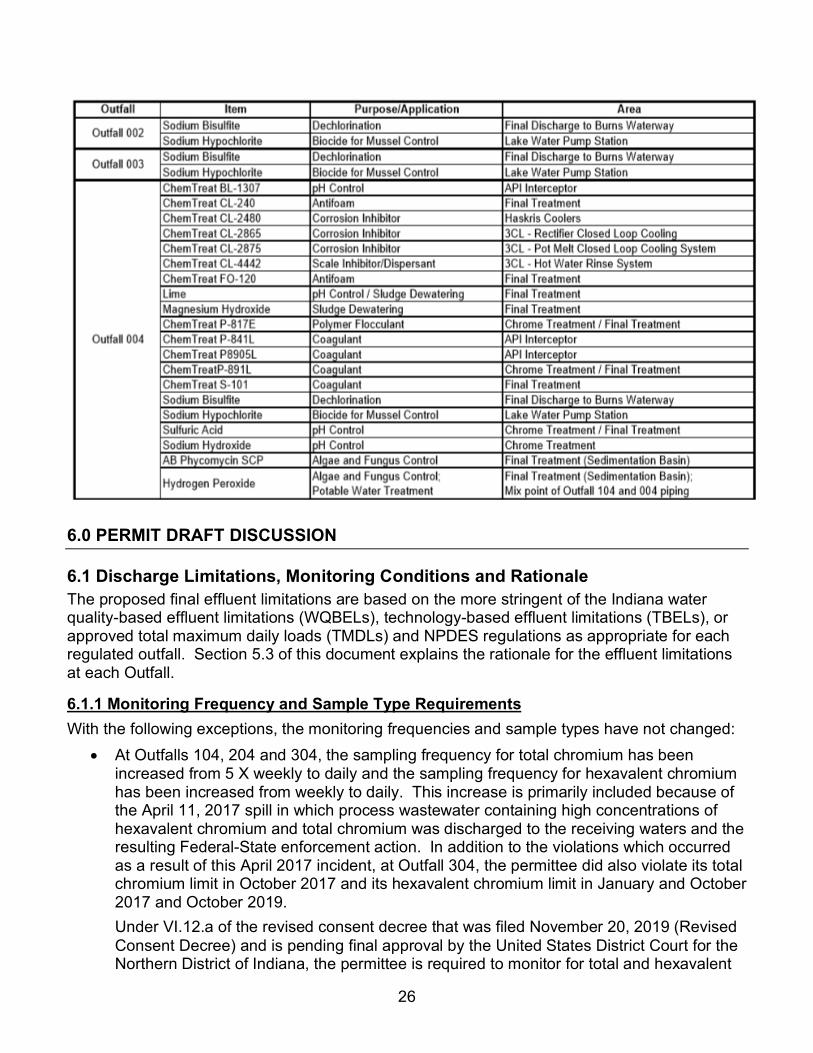
5.8 Water Treatment Additives In the event that changes are to be made in the use of water treatment additives that could significantly change the nature of or increase the discharge concentration of any of the additives contributing to an outfall governed under the permit, the permittee must apply for and obtain approval from IDEM prior to such discharge. Discharges of any such additives must meet Indiana water quality standards. The permittee must apply for permission to use water treatment additives by completing and submitting State Form 50000 (Application for Approval to Use Water Treatment Additives) available at: http://www.in.gov/idem/5157.htm and submitting any needed supplemental information. In the review and approval process, IDEM determines, based on the information submitted with the application, whether the use of any new or changed water treatment additives/chemicals or dosage rates could potentially cause the discharge from any permitted outfall to cause chronic or acute toxicity in the receiving water. The authority for this requirement can be found under one or more of the following: 327 IAC 5-2-8(11)(B), which generally requires advance notice of any planned changes in the permitted facility, any activity, or other circumstances that the permittee has reason to believe may result in noncompliance with permit requirements; 327 IAC 5-2-8(11)(F)(ii), which generally requires notice as soon as possible of any planned physical alterations or additions to the permitted facility if the alteration or addition could significantly change the nature of, or increase the quantity of, pollutants discharged; and 327 IAC 5-2-9(2) which generally requires notice as soon as the discharger knows or has reason to know that the discharger has begun or expects to begin to use or manufacture, as an intermediate or final product or byproduct, any toxic pollutant that was not reported in the permit application. The following is a list of water treatment additives currently approved for use at the facility:
6.1 Discharge Limitations, Monitoring Conditions and Rationale The proposed final effluent limitations are based on the more stringent of the Indiana water quality-based effluent limitations (WQBELs), technology-based effluent limitations (TBELs), or approved total maximum daily loads (TMDLs) and NPDES regulations as appropriate for each regulated outfall. Section 5.3 of this document explains the rationale for the effluent limitations at each Outfall.
6.1.1 Monitoring Frequency and Sample Type Requirements With the following exceptions, the monitoring frequencies and sample types have not changed:
• At Outfalls 104, 204 and 304, the sampling frequency for total chromium has been increased from 5 X weekly to daily and the sampling frequency for hexavalent chromium has been increased from weekly to daily. This increase is primarily included because of the April 11, 2017 spill in which process wastewater containing high concentrations of hexavalent chromium and total chromium was discharged to the receiving waters and the resulting Federal-State enforcement action. In addition to the violations which occurred as a result of this April 2017 incident, at Outfall 304, the permittee did also violate its total chromium limit in October 2017 and its hexavalent chromium limit in January and October 2017 and October 2019. Under VI.12.a of the revised consent decree that was filed November 20, 2019 (Revised Consent Decree) and is pending final approval by the United States District Court for the Northern District of Indiana, the permittee is required to monitor for total and hexavalent
27
chromium daily at Outfalls 104 and 204. Under VI.12.b. of the Revised Consent Decree, the permittee was required to address the requirements related to hexavalent and total chromium required by VI.12.a of the Revised Consent Decree in its permit renewal application. In addition, the Revised Consent Decree allowed the permittee to request a reduced monitoring frequency as part of its permit application. In its application, the permittee did not request a reduction in this monitoring frequency but did request that the permit include a reopening clause that would allow a reduction in the future. The permittee also requested the inclusion of specific language in the permit with respect to these monitoring requirements. This language was included in Attachment IV of the renewal permit application. IDEM has incorporated the requested reopening clause and language into the permit.
• The monitoring frequency for copper at Outfall 004 has been increased from 2 X monthly to weekly. The permittee has reported recent violations of its copper limit at this outfall in August and October 2019 and November 2020; therefore, an increase in the monitoring frequency is warranted for this parameter at this outfall.
• The monitoring frequencies for Silver, Cadmium, Nickel and Lead has decreased from 2 X Monthly to 1 X Monthly.
6.1.2 Analytical and Sampling Methods As specified at 327 IAC 5-2-13(d)(1), test procedures identified in 40 CFR 136, including analytical and sampling methods, shall be used for pollutants or pollutant parameters listed in that part unless an alternate test procedure has been approved under 40 CFR 136.5. The State of Indiana has currently incorporated by reference the July 1, 2016 version of 40 CFR 136 under 327 IAC 5-2-1.5 and 327 IAC 1-1-2; therefore, this is the version of 40 CFR 136 currently applicable in NPDES permits. Outfall 002: Non-Contact Cooling Water and Storm Water Parameter Monthly
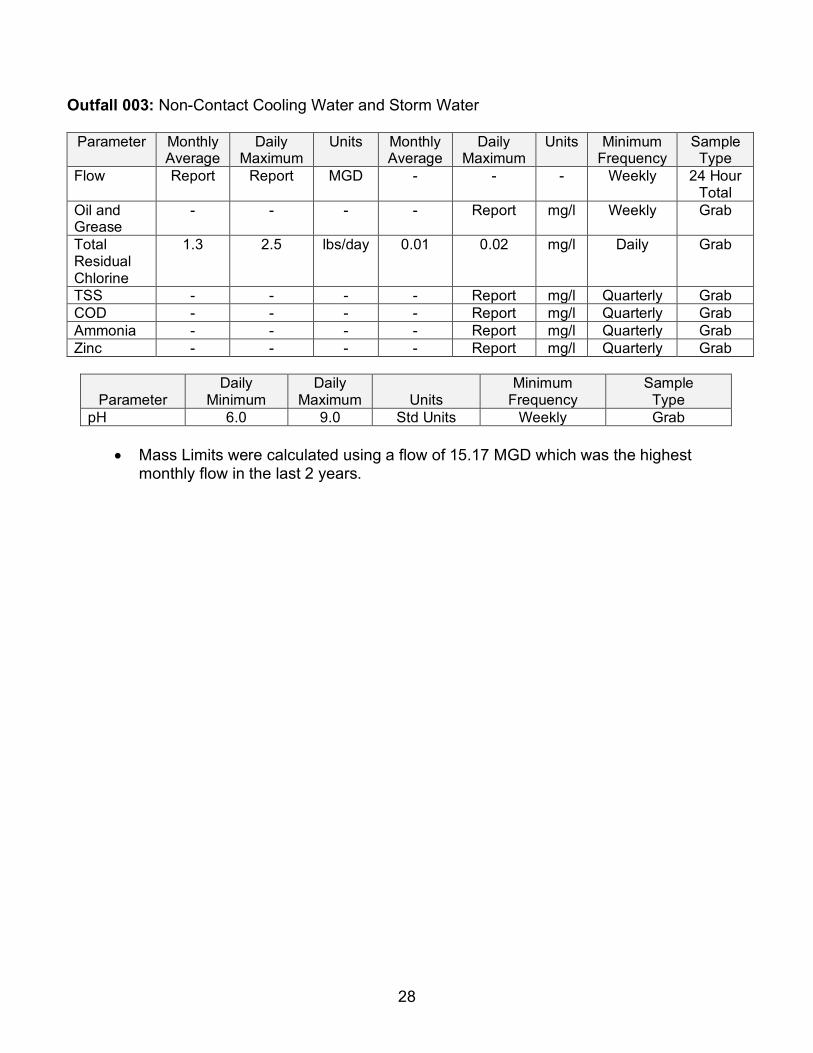
• Mass Limits were calculated using a flow of 15.17 MGD which was the highest
monthly flow in the last 2 years.
29
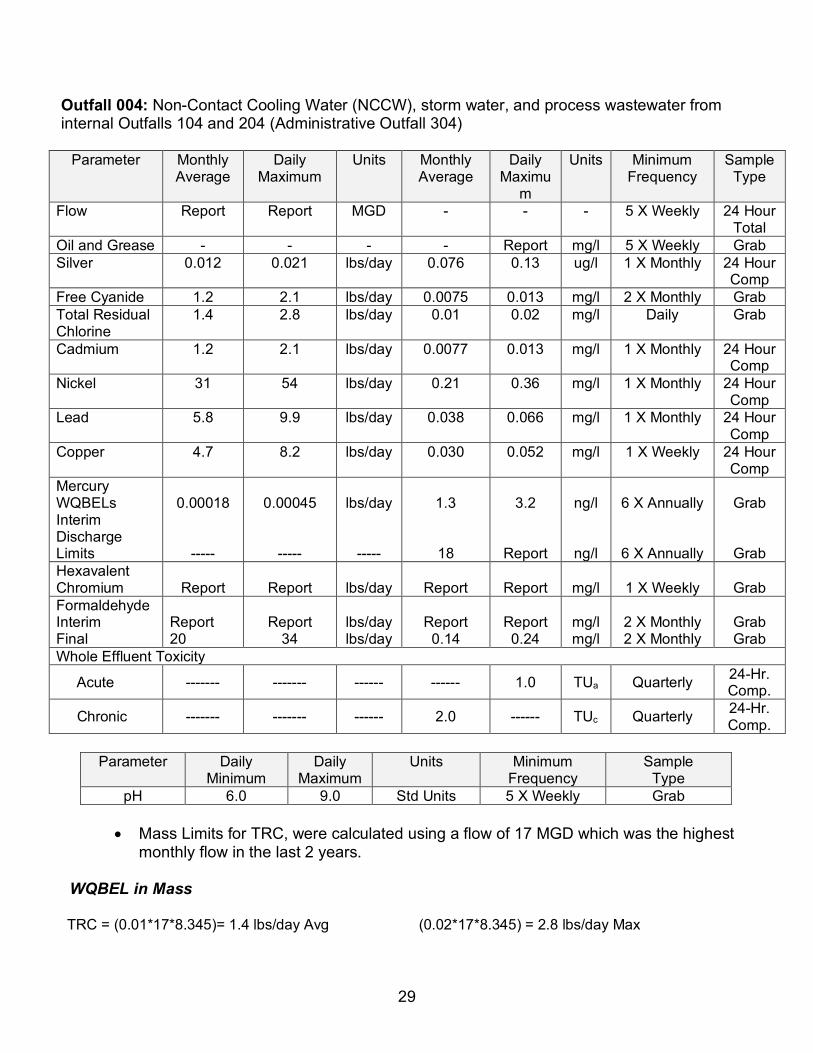
Outfall 004: Non-Contact Cooling Water (NCCW), storm water, and process wastewater from internal Outfalls 104 and 204 (Administrative Outfall 304) Parameter Monthly
Average Daily
Maximum Units Monthly
Average Daily
Maximum
Units Minimum Frequency
Sample Type
Flow Report Report MGD - - - 5 X Weekly 24 Hour Total
Oil and Grease - - - - Report mg/l 5 X Weekly Grab Silver 0.012 0.021 lbs/day 0.076 0.13 ug/l 1 X Monthly 24 Hour
Comp Free Cyanide 1.2 2.1 lbs/day 0.0075 0.013 mg/l 2 X Monthly Grab Total Residual Chlorine
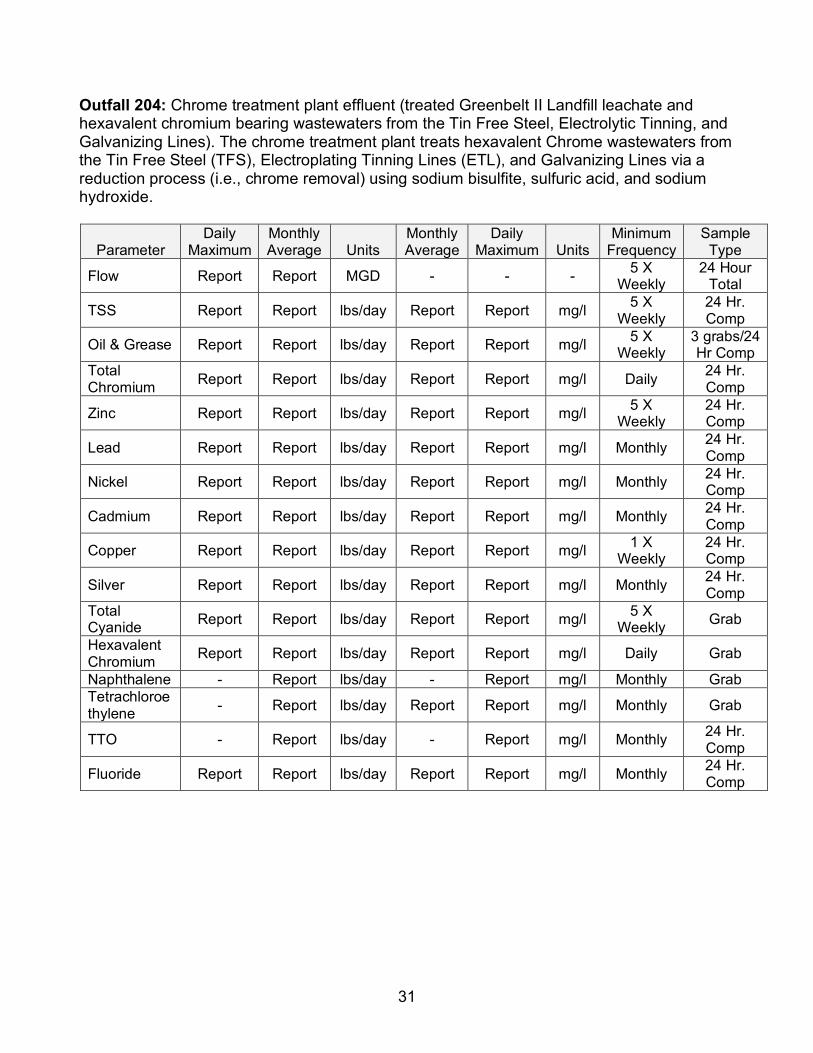
Outfall 204: Chrome treatment plant effluent (treated Greenbelt II Landfill leachate and hexavalent chromium bearing wastewaters from the Tin Free Steel, Electrolytic Tinning, and Galvanizing Lines). The chrome treatment plant treats hexavalent Chrome wastewaters from the Tin Free Steel (TFS), Electroplating Tinning Lines (ETL), and Galvanizing Lines via a reduction process (i.e., chrome removal) using sodium bisulfite, sulfuric acid, and sodium hydroxide.
Parameter Daily
Maximum Monthly Average Units
Monthly Average
Daily Maximum Units
Minimum Frequency
Sample Type
Flow Report Report MGD - - - 5 X Weekly
24 Hour Total
TSS Report Report lbs/day Report Report mg/l 5 X Weekly
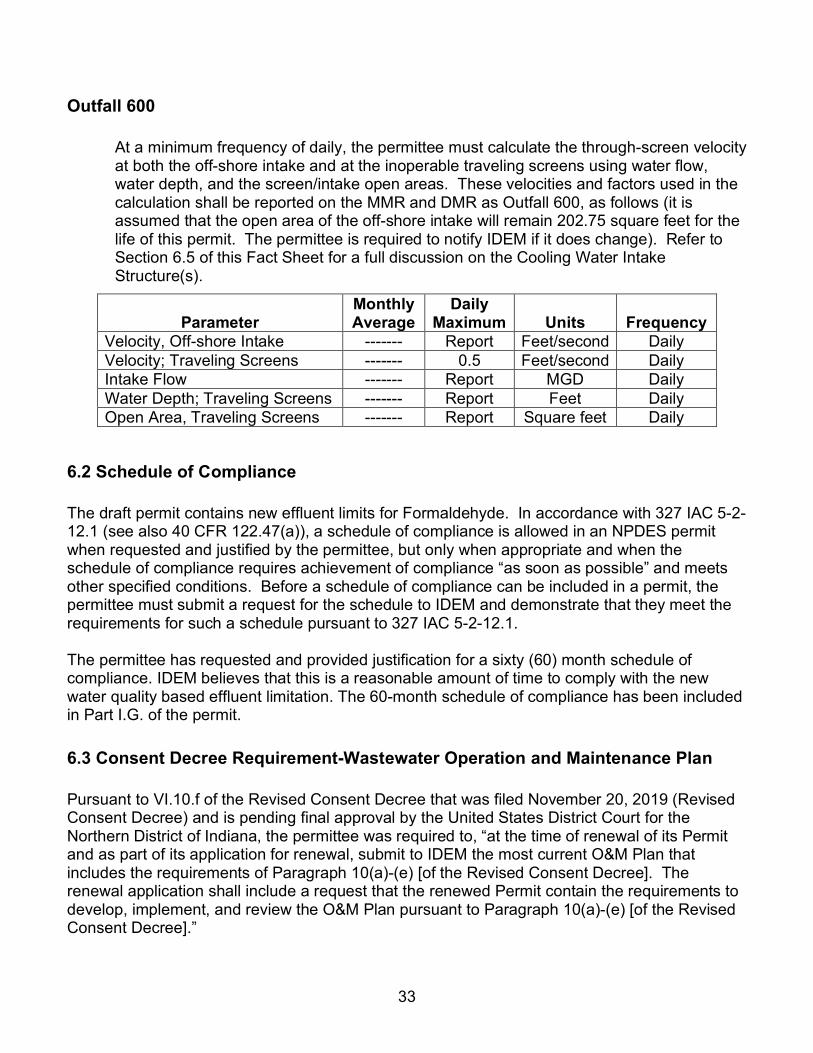
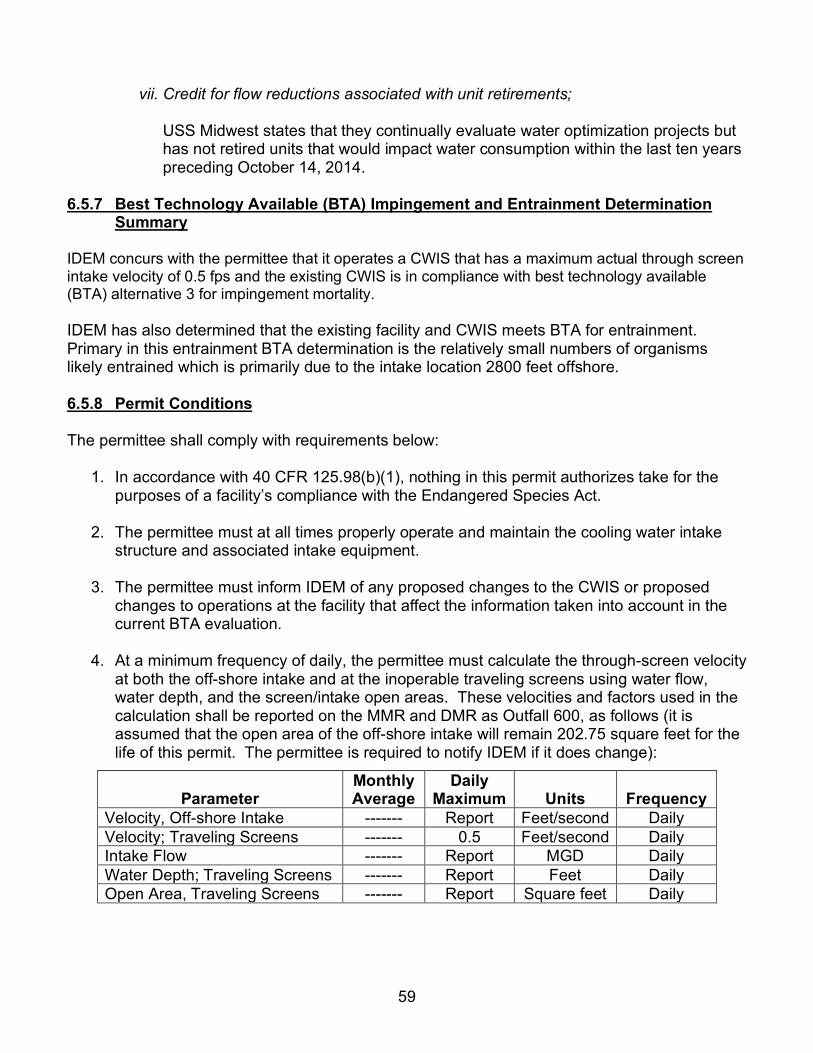
At a minimum frequency of daily, the permittee must calculate the through-screen velocity at both the off-shore intake and at the inoperable traveling screens using water flow, water depth, and the screen/intake open areas. These velocities and factors used in the calculation shall be reported on the MMR and DMR as Outfall 600, as follows (it is assumed that the open area of the off-shore intake will remain 202.75 square feet for the life of this permit. The permittee is required to notify IDEM if it does change). Refer to Section 6.5 of this Fact Sheet for a full discussion on the Cooling Water Intake Structure(s).
6.2 Schedule of Compliance The draft permit contains new effluent limits for Formaldehyde. In accordance with 327 IAC 5-2-12.1 (see also 40 CFR 122.47(a)), a schedule of compliance is allowed in an NPDES permit when requested and justified by the permittee, but only when appropriate and when the schedule of compliance requires achievement of compliance “as soon as possible” and meets other specified conditions. Before a schedule of compliance can be included in a permit, the permittee must submit a request for the schedule to IDEM and demonstrate that they meet the requirements for such a schedule pursuant to 327 IAC 5-2-12.1. The permittee has requested and provided justification for a sixty (60) month schedule of compliance. IDEM believes that this is a reasonable amount of time to comply with the new water quality based effluent limitation. The 60-month schedule of compliance has been included in Part I.G. of the permit. 6.3 Consent Decree Requirement-Wastewater Operation and Maintenance Plan Pursuant to VI.10.f of the Revised Consent Decree that was filed November 20, 2019 (Revised Consent Decree) and is pending final approval by the United States District Court for the Northern District of Indiana, the permittee was required to, “at the time of renewal of its Permit and as part of its application for renewal, submit to IDEM the most current O&M Plan that includes the requirements of Paragraph 10(a)-(e) [of the Revised Consent Decree]. The renewal application shall include a request that the renewed Permit contain the requirements to develop, implement, and review the O&M Plan pursuant to Paragraph 10(a)-(e) [of the Revised Consent Decree].”
34
The permittee included this information, including Revision 7 of its Wastewater Treatment O&M Manual and Preventative Maintenance Program Plan, dated 4-15-2020, as Attachment III of its NPDES permit renewal application. The proposed permit includes the requirements to develop, implement, and review the O&M Plan pursuant to Paragraph 10(a)-(e) of the Revised Consent Decree.
6.4 Thermal Effluent Requirements 6.4.1 History of Thermal Requirements A. NPDES Permit Issued January 31, 2011 The following is an excerpt from the Fact Sheet for the NPDES Permit issued January 31, 2011:
Noncontact cooling water is discharged at Outfalls 002, 003 and 004. The temperature of the effluent from the combined outfalls is regulated under 327 IAC 2-l.5-8(c)(4) for a warm water aquatic community. As Portage-Bums Waterway is designated as a salmonid water under 327 IAC 2-1.5-5(a)(3)(B), the effluent temperature is also regulated under. 327 IAC 2-l.5-8(d)(2) for cold water fish. According to the Lake Michigan Fisheries Office of the Indiana Department of Natural Resources, spawning and imprinting of salmonids occurs from September through the end of May annually and can occur at any place in the watershed. The temperature criteria for a warm water aquatic community and for cold water fish apply outside of a mixing zone. 327 IAC 2-1.5-8(c)(4) sets a maximum temperature limit by month, while 327 IAC 2-1.5-8(d)(2)(A) prohibits temperatures from exceeding 70° Fat any time, and 327 IAC 2-1.5- 8(d)(2)(B) prohibits temperatures from exceeding 65° F during spawning and imprinting of salmonids. 327 IAC 2-l .5-8(d)(2) states that these temperature limits apply unless due to natural causes. Therefore, the temperature limits for cold water fish are inapplicable when measured temperatures upstream of the discharge from Outfalls 002, 003 and 004 equal or exceed the temperature limit for that day. 327 IAC 2-1.5-8(d)(2) also states that the maximum temperature rise above natural shall not exceed 2°F at any time or place. The thermal effluent requirements in the previous permit are based on temperature criteria that applied prior to the 1990 change in water quality standards. Prior to 1990, Portage-Bums Waterway was considered a migration route for salmonids, so the permit included temperature criteria for migration routes for those months where they were more stringent than criteria that applied to a warm water aquatic community. Portage-Burns Waterway is now designated as a salmonid water and the temperature criteria are more stringent than those that applied to salmonid migration routes. Therefore, the temperature limits in the previous permit were updated to include the more stringent of the temperature criteria for cold water fish in 2-1.5-8(d) or for a warm water aquatic community in 2-1.5-8(c)(4). The previous permit includes a provision for instances where the upstream temperature equals or exceeds the temperature limit for any given day. In these instances, the temperature from the combined discharge from Outfalls 002, 003 and 004 is prohibited from raising the temperature greater than 2°F at the edge of the mixing zone. This provision is only consistent with the temperature criteria for cold water fish. Based on a review of upstream
35
temperature data presented in Attachment 35 of the wasteload allocation report in Appendix E [of the 2011 Fact Sheet], there is no reasonable potential to exceed the maximum temperature requirements for warm water aquatic communities during the months when temperature criteria for cold water fish are more stringent. Therefore, this provision was retained for those months when the temperature criteria for cold water fish are more stringent. Compliance with the thermal requirements in the previous permit is determined using a model developed by the facility in 1991 that calculates the temperature rise at the edge of the mixing zone for each outfall. A review of the model is included in the wasteload allocation report in Appendix E [of the 2011 Fact Sheet]. Based on the review, the model may no longer be used to determine compliance with the temperature limits in the permit. Instead, the permit includes a requirement to measure the temperature in Portage-Bums Waterway at the edge of the mixing zone. The thermal mixing zone for Outfalls 002, 003 and 004 is the area in Portage-Burns Waterway extending from Outfall 002 to one-half the width of Portage-Bums Waterway and to a distance of 300 feet downstream of Outfall 004. Temperature measurements shall be taken at the edge of the mixing zone approximately 300 feet downstream of Outfall 004 and at mid-stream. Instead of measuring the temperature at the edge of the mixing zone, the permittee may choose to submit a new model for review by IDEM as a measure to achieve compliance with the temperature limits in this permit. A reopening clause has been included in this permit to allow review for a proposed thermal model whereby the permit may be reopened to include such a provision for compliance. Any new model must limit the mixing zone to one-half the width of Portage-Bums Waterway and account for: upstream flow and temperature; effluent flow and temperature; and the combined effect of the discharges from Outfalls 002, 003 and 004 on the temperature at the edge of the mixing zone. The permittee has a 24-month schedule of compliance to develop a newly proposed model or install monitoring equipment to comply with the current thermal effluent requirements. Any proposed model should be provided to IDEM at least 90 (ninety) days prior to anticipated use of model for review and must be approved by IDEM before use.
B. NPDES Permit Modification Issued March 19, 2014 The permittee submitted an application to modify its NPDES permit on June 28, 2013 requesting approval to use a thermal model to assess compliance with Outfall 500 temperature requirements as an alternative to measuring the temperature instream. The following is an excerpt from the Fact Sheet for the NPDES permit modification issued March 19, 2014:
Outfall 500 is the temperature compliance point and is located at the edge of the mixing zone in Bums Waterway, 300 feet downstream of Outfall 004 in the middle of the channel (Buoy A). The thermal model is an alternative to direct, in-situ measurement. Buoy A is sited at a location frequented by boat traffic and is at risk for removal or damage. Its existence for the duration of the permit cannot be guaranteed and is beyond the control of USS. USS has demonstrated that when Buoy A is removed from Bums Waterway, a
36
regression model can be used to reliably assess temperature at the compliance point. The regression model (equation) incorporates hourly Outfall 002, 003, 004, and upstream Bums Waterway temperatures and flows currently measured by USS and the coefficients given in the table below. Upstream Bums Waterway flow is expressed as a 24-hour rolling average.
C. NPDES Permit Issued March 30, 2016 This same thermal regression model was included in the renewal permit issued March 30,2016. 6.4.2 Summary of Temperature Discharge Levels at Outfall 002, 003 and 004 The following tables were prepared using DMR data from December 2017 through November 2020.
Outfall 002
Month Average
Flow (MGD) Maximum
Flow (MGD)
Average Temperature
(ºF)
Maximum Temperature
(ºF) January 0.097 1.2 75 92 February 0.099 0.70 72 89 March 0.15 0.93 78 91 April 0.12 1.1 75 90 May 0.099 0.70 71 90 June 0.099 0.70 75 84 July 0.14 0.72 78 85 August 0.16 0.72 80 85 September 0.14 0.65 80 84 October 0.18 1.1 76 85 November 0.20 1.2 79 95 December 0.10 0.88 75 90
Outfall 003
Month Average
Flow (MGD) Maximum
Flow (MGD)
Average Temperature
(ºF)
Maximum Temperature
(ºF) January 13 15 42 49 February 13 14 41 63 March 13 14 46 53 April 13 15 50 58 May 13 15 58 67 June 13 16 67 77 July 14 16 73 86 August 14 16 78 85 September 14 16 73 84 October 14 16 64 76 November 14 15 53 62 December 13 15 45 54
37
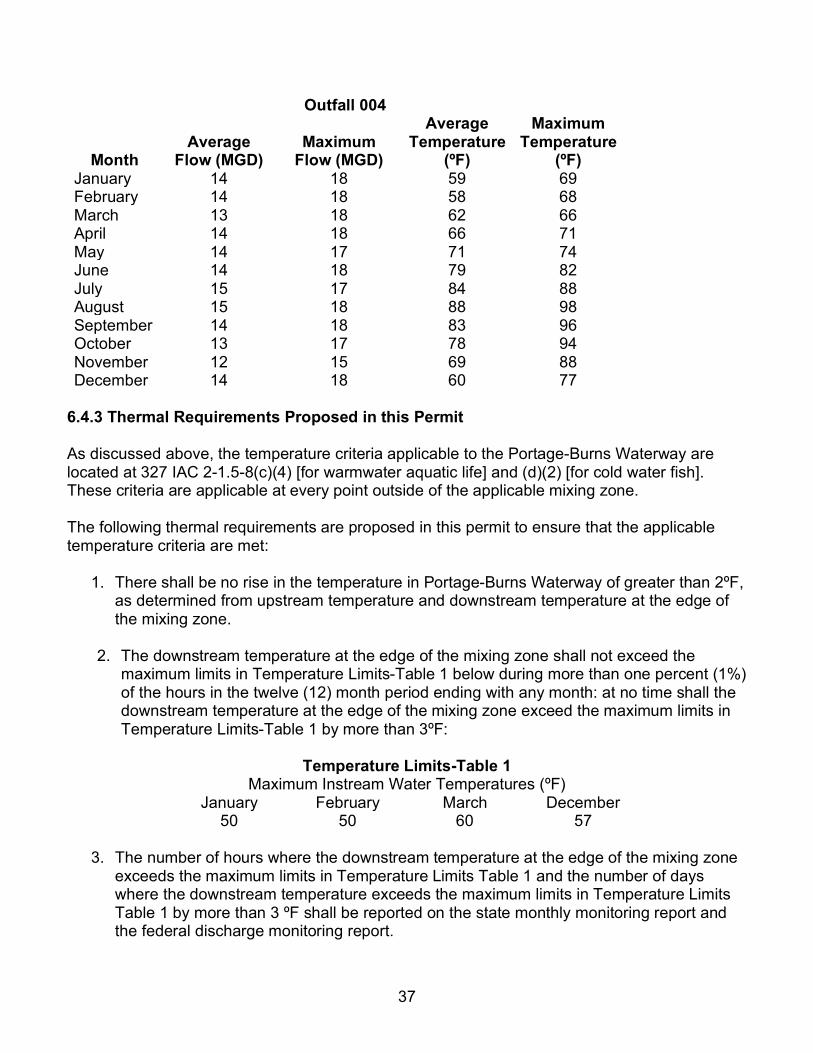
Outfall 004
Month Average
Flow (MGD) Maximum
Flow (MGD)
Average Temperature
(ºF)
Maximum Temperature
(ºF) January 14 18 59 69 February 14 18 58 68 March 13 18 62 66 April 14 18 66 71 May 14 17 71 74 June 14 18 79 82 July 15 17 84 88 August 15 18 88 98 September 14 18 83 96 October 13 17 78 94 November 12 15 69 88 December 14 18 60 77
6.4.3 Thermal Requirements Proposed in this Permit As discussed above, the temperature criteria applicable to the Portage-Burns Waterway are located at 327 IAC 2-1.5-8(c)(4) [for warmwater aquatic life] and (d)(2) [for cold water fish]. These criteria are applicable at every point outside of the applicable mixing zone. The following thermal requirements are proposed in this permit to ensure that the applicable temperature criteria are met:
1. There shall be no rise in the temperature in Portage-Burns Waterway of greater than 2ºF, as determined from upstream temperature and downstream temperature at the edge of the mixing zone.
2. The downstream temperature at the edge of the mixing zone shall not exceed the maximum limits in Temperature Limits-Table 1 below during more than one percent (1%) of the hours in the twelve (12) month period ending with any month: at no time shall the downstream temperature at the edge of the mixing zone exceed the maximum limits in Temperature Limits-Table 1 by more than 3ºF:
Temperature Limits-Table 1
Maximum Instream Water Temperatures (ºF) January February March December
50 50 60 57
3. The number of hours where the downstream temperature at the edge of the mixing zone exceeds the maximum limits in Temperature Limits Table 1 and the number of days where the downstream temperature exceeds the maximum limits in Temperature Limits Table 1 by more than 3 ºF shall be reported on the state monthly monitoring report and the federal discharge monitoring report.
38
4. The cumulative number of hours where the downstream temperature at the edge of the mixing zone exceeds the maximum limits in Temperature Limits Table 1 during the most recent twelve (12) months period shall be reported on the state monthly monitoring report and federal discharge monitoring report every month. The most recent twelve (12) months shall include the current month and the previous eleven (11) months.
5. The downstream temperature at the edge of the mixing zone shall not exceed the
maximum limits in Temperature Limits Table 2 below at any time:
Temperature Limits-Table 2 Maximum Instream Water Temperatures (ºF)
April May June July August September October November 65 65 70 70 70 65 65 65
6. The provisions of paragraph 5 above shall be inapplicable at any time when the upstream
temperature is within 2 ºF of the maximum limitation for that day. 7. The mixing zone is the area in Portage-Burns Waterway extending laterally from Outfall
002 to one-half the width of Portage-Burns Waterway and to a distance of 300 feet downstream of Outfall 004.
8. In order to verify compliance with the above limitations, the permittee is required to report
the following information as Outfall 500:
Parameter Monthly Average
Daily Maximum Units Frequency
Sample Type
Intake Temperature Report Report ºF 1 X Hourly [1] Upstream River Temperature Report Report ºF 1 X Hourly [1] Outfall 002 Effluent Temperature Report Report ºF 1 X Hourly [1] Outfall 003 Effluent Temperature Report Report ºF 1 X Hourly [1] Outfall 004 Effluent Temperature Report Report ºF 1 X Hourly [1] Downstream River Temperature [2] Report Report ºF 1 X Hourly [3] Delta T [4] ------- Report ºF 1 X Daily [5]
[1] Monitoring and reporting of temperature is to occur on a continuous basis. Temperature measurements shall be recorded continuously in one-hour intervals and the highest single recorded hourly measurement shall be reported on the federal discharge monitoring report as the maximum daily temperature of that month.
[2] The following equation shall be used to calculate the downstream river temperature using concurrent hourly temperature and flow measurements:
𝑇𝑇𝑑𝑑 = 𝛼𝛼 ∗ 𝑇𝑇𝑢𝑢 ∗𝑄𝑄𝑢𝑢𝑄𝑄𝑡𝑡
+ 𝛾𝛾 ∗ 𝑇𝑇2 ∗𝑄𝑄2𝑄𝑄𝑡𝑡
+ 𝛿𝛿 ∗ 𝑇𝑇3 ∗𝑄𝑄3𝑄𝑄𝑡𝑡
+ 𝜖𝜖 ∗ 𝑇𝑇4 ∗𝑄𝑄4𝑄𝑄𝑡𝑡
where:
39
Td = hourly downstream temperature Tu = hourly river temperature upstream of Outfall 002 T2 = hourly Outfall 002 temperature T3 = hourly Outfall 003 temperature T4 = hourly Outfall 004 temperature Qu = the 24-hour rolling average flow in Portage-Bums Waterway measured
upstream of Outfall 002 (MGD); this flow shall be calculated on an hourly basis as the average of the current hourly flow measurement and the previous 23 hourly flow measurements
These coefficients (α, γ, δ, and ε) are the coefficients from the June 28, 2013 letter from the permittee and have been approved by IDEM. The coefficients may be updated based upon additional data collection at Buoy A. Any changes shall be submitted for review and approval by IDEM before use by the permittee.
Alternatively, the permittee may measure the downstream temperature, Td, at the edge of the mixing zone approximately 300 feet downstream of Outfall 004. Temperature measurements shall be taken at mid-stream and at a depth of approximately one meter below the water’s surface. An annotation shall be made on the state monthly monitoring report each day this option is used.
[3] Monitoring and reporting of temperature is to occur on a continuous basis. Temperature measurements shall be recorded continuously in one-hour intervals and the total number of hours above the corresponding maximum limits in Part III.A.2 for the twelve (12) months shall be reported. The twelve (12) months shall include the current month and the previous elven (11) months. The highest single recorded hourly measurement shall be reported on the federal discharge monitoring report as a maximum daily temperature of that month.
[4] This is the difference each day between the maximum upstream and maximum downstream (peak) temperature.
[5] Calculated maximum.
9. The following narrative requirements for temperature shall apply outside the mixing zone: a. There shall be no abnormal temperature changes that may adversely affect aquatic
life unless caused by natural conditions. b. The normal daily and seasonal temperature fluctuations that existed before the
addition of heat due to other than natural causes shall be maintained.
40
6.4.4 Future Temperature Study Requirements IDEM is not proposing to add any additional study requirements in this permit renewal; however, in the next permit renewal, IDEM may consider adding a requirement that the permittee reevaluate or reconduct its thermal study during its next permit renewal.
6.5 Clean Water Act Section 316(b) Cooling Water Intake Structure(s) (CWIS) 6.5.1 Introduction
In accordance with 40 CFR 401.14, the location, design, construction and capacity of cooling water intake structures of any point source for which a standard is established pursuant to section 301 or 306 of the Act shall reflect the best technology available for minimizing adverse environmental impact. The EPA promulgated a CWA section 316(b) regulation on August 15, 2014, which became effective on October 14, 2014. 79 Fed. Reg. 48300-439 (August 15, 2014). This regulation established application requirements and standards for cooling water intake structures. The regulation is applicable to point sources with a cumulative design intake flow (DIF) greater than 2 MGD where 25% or more of the water withdrawn (using the actual intake flow (AIF)) is used exclusively for cooling purposes. All existing facilities subject to these regulations must submit the information required by 40 CFR 122.21(r)(2)–(r)(8) and facilities with an actual intake flow of greater than 125 MGD must also submit the information required by 40 CFR 122.21(r)(9)-(r)(13). The regulation establishes best technology available standards to reduce impingement and entrainment of aquatic organisms at existing power generation and manufacturing facilities. Impingement is the process by which fish and other aquatic organisms are trapped and often killed or injured when they are pulled against the cooling water intake structures (CWIS’s) outer structure or screens as water is withdrawn from a waterbody. Entrainment is the process by which fish larvae and eggs and other aquatic organisms in the intake flow enter and pass through a CWIS and into a cooling water system, including a condenser or heat exchanger, which often results in the injury or the death of the organisms (see definitions at 40 CFR 125.92(h) and (n)). The USS Midwest facility withdraws water for their process and cooling water needs through an intake structure located approximately 2800 feet offshore in Lake Michigan. The USS Midwest Plant has a design intake flow (DIF) of 69.12 MGD. The actual intake flow (AIF), as defined under 40 CFR 125.92(a), is the average volume of water withdrawn on an annual basis by the cooling water intake structures over the previous five years. The annual actual intake flows from January 2015 through December 2019 was 27.0 MGD and approximately 30% of the intake water on average is used for cooling purposes. Therefore, since the facility has a DIF greater than 2 MGD, and because the percentage of flow used at the facility exclusively for cooling is greater than 25%, the facility is required to meet the BTA standards for impingement and entrainment mortality, including any measures to protect Federally-listed threatened and endangered species and designated critical habitat established under 40 CFR 125.94(g).
41
As an existing facility with a DIF greater than 2 MGD and because the AIF is less than or equal to 125 MGD, the permittee was required to submit the application information required by 40 CFR 122.21(r)(2) through (r)(8). In a letter to IDEM dated October 8, 2018, the permittee, as authorized by 40 CFR 125.95(c), requested permission to reduce the 316(b) application information that was due with the submittal of its 2020 NPDES permit renewal application. IDEM denied this request in an e-mail dated January 29, 2019 and stated, in pertinent part:
“[t]he application does need to comply with 40 CFR 122.21(r). We believe that a new 316(b) application should be submitted with the renewal application. Some or even much of the new application can likely be taken from the previous application.
Even though IDEM denied the permittee’s request for a reduced 316(b) application, the permittee submitted a reduced 316(b) application with its October 1, 2020 permit renewal application. After a review of the 2020 reduced 316(b) application and the 2015 316(b) application which were both included with the permittee’s renewal application, IDEM has determined for this facility, in these circumstances, the application submitted by the permittee was satisfactory for IDEM evaluation of the 316(b) requirements. The regulation also established requirements that build on existing CWA requirements to coordinate with the U.S. Fish and Wildlife Service prior to issuing NPDES permits. Pursuant to 40 CFR 125.98(h), upon receipt of an NPDES permit 316(b) application for an existing facility subject to the rule, the Director (IDEM) must forward a copy of the permit application to the appropriate Field Office of the U.S. Fish and Wildlife Service for a 60-day review. A copy of this permit application was sent to the Bloomington Field Office of the U.S. Fish and Wildlife Service on October 1, 2020. A response was received from Mr. Daniel W. Sparks of the U.S. Fish and Wildlife Service on December 15, 2020 which is discussed in Section 6.5.5, below. Much of the factual information presented below was taken, sometimes directly, from the permittee’s October 2020 NPDES Application, primarily Attachment II which addresses the 316(b) application requirements and includes the August 2015 Cooling Water Intake Structure (CWIS) Report. This NPDES application is available from IDEM. After the permit is issued, the 2020 renewal application, including the 2015 CWIS report will be included in IDEM’s virtual filing cabinet with the issued permit. 6.5.2 Facility and Cooling Water Intake Structure (CWIS) Description
A. Detailed Description
The Midwest Plant finishes coils received from other U. S. Steel plants into cold rolled, galvanized, chromium or tin-plated strip and sheet products. The Midwest Plant is authorized to withdraw water for their process and non-contact cooling water needs from one intake. The intake is located approximately 2,800 ft. offshore of the Midwest Plant in the Southern Lake Michigan Basin at a depth of roughly 30 to 35 feet. The Midwest Pump Station intake is designed with a closed intake conduit that withdraws water from the bottom of Lake Michigan via four intake openings (diameter is approximately
42
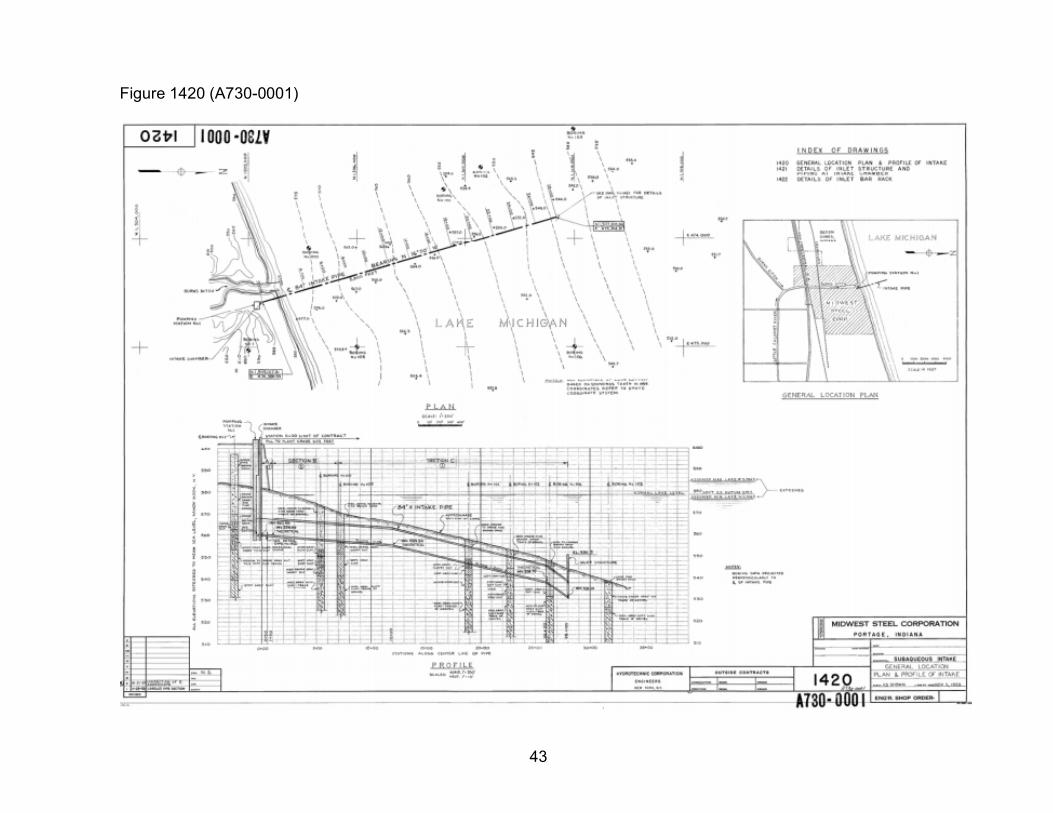
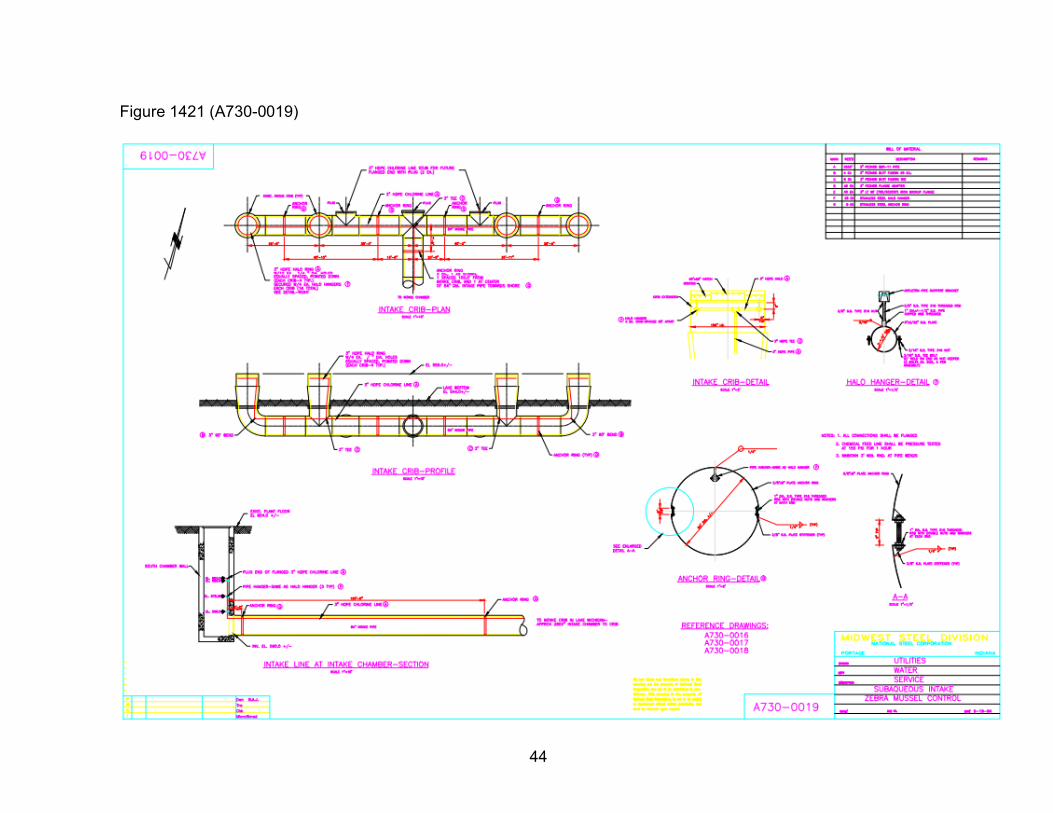
8 feet 8 inches each), which are capped with bars spaced approximately 7 inches apart in a grid pattern. An 84-inch diameter pipe transports water from the openings in Lake Michigan to the Midwest lakeside pump station (LSPS). See Figures 1420 (A730-0001) and 1421 (A730-0019) shown below which are taken from the 2015 CWIS report.
43
Figure 1420 (A730-0001)
44
Figure 1421 (A730-0019)
45
The basic infrastructure of the Midwest LSPS includes two wet wells equipped with one vertical traveling screen (1/4-inch mesh) each; four vertical Fairbanks – Morse Deep Well Turbine pumps with a maximum capacity of approximately 12,000 gallons per minute (gpm) or 17.2 million gallons per day (MGD) each; and a distribution manifold to deliver cooling water to all plant areas. In 1993, USS eliminated and plugged the return conduit for backwash from the traveling screens to discharge to Lake Michigan. The return conduit (previously Outfall 005) was reportedly removed because debris and impinged fish were typically absent and posed no risk to operations of the Midwest LSPS. Following closure of Outfall 005, operation of the two traveling screens was performed approximately once every 3-6 months to remove accumulated debris. Debris consisted of a few plastic bags, biofilm, and zebra mussel remains that were removed from the trough in the Midwest LSPS after backwash. Rotation of the traveling screens was found to be unnecessary and eventually stopped in approximately 2006 as debris and impinged fish were typically absent during backwash. Since 2006, the permittee has not operated the traveling screens at the Midwest LSPS because the permittee determined that debris and impinged fish are minimal and do not pose any operational issues. Other than routine maintenance, there has been no repair or replacement of infrastructure at the Midwest LSPS. Currently, the traveling screens at the Midwest LSPS are nonfunctional. Pump operation over the past 25 years has demonstrated debris and fish impingement do not occur at a significant amount. Therefore, Midwest does not currently have plans to refurbish, repair, or remove the infrastructure of the traveling screens. In addition, Midwest has considered complete removal of the traveling screens. However, due to the condition of the screens, removal activities pose a significant risk to the integrity of pump operations at the Midwest LSPS. Current maintenance includes annual inspection by divers for integrity and condition status of the intake system and normal preventative maintenance inspections of mechanical pump and water distribution components. USS has indicated in phone conversation and correspondence with IDEM that the inoperable traveling screens have deteriorated, and portions of screen are likely no longer present. USS also indicated that zebra mussel or debris buildup on the screens is minimal. Chlorination of the intakes near the openings in Lake Michigan occurs continuously from approximately mid-May to mid-November for zebra mussel control.
B. Intake Flows, Velocity of Intake Flows Through Submerged Intake Openings,
Velocity of Intake Flows Through Traveling Screens and Area of Influence The USS Midwest Plant has a design intake flow (DIF) of 69.12 MGD. The actual intake flow (AIF), as defined under 40 CFR 125.92(a), is the average volume of water withdrawn on an
46
annual basis by the cooling water intake structures over the previous five years. The annual actual intake flows from January 2015 through December 2019 was 27.0 MGD. As presented previously, water enters the CWIS at the Lake Michigan offshore intake structure, travels approximately 2800 ft in an 84-inch diameter buried pipe to the onshore wet wells and pumps. The pumps are preceded by the inoperable travelling screens. The hydrologic zone of influence for the Midwest intake is the area surrounding the intake mouth where intake velocity is in excess of local natural lake circulation or wind induced current velocity, or where intake velocity restricts the ability of fish to swim away. Typically, velocities that are less than 0.5 fps are considered low enough to allow fish to freely swim away. Specific distances of influence from the intake mouth are unknown but expected to be negligible based on the intake volume of water and divers’ observations that fish swim freely in and out of the pipe openings. The zone of influence could be variable depending upon seasonal differences and meteorological conditions. Intake velocities were calculated at the submerged intake openings in Lake Michigan as well as at the inoperable traveling screens in the wet well. At the design intake flow (DIF) of 69.12 MGD, the intake velocity at the submerged intake openings in Lake Michigan is calculated as 0.53 feet per second (fps). Assuming the traveling screens are in the original configuration and condition, the through screen design intake velocity is calculated to be 0.56 fps at the DIF. Typical operation is two pumps running continuously and a third pump that starts and stops as needed. This protocol has remained consistent 2007 to present. The CWIS operates continuously on a year-round basis. USS reports a maximum daily flow of 41.3 MGD from 2015 through 2019. With three of the 17.2 MGD capacity pumps running, the intake flow would be approximately 51.6 MGD. This 51.6 MGD flow is the maximum intake flow that used to calculate the maximum through-screen intake velocity for impingement BTA alternative at 40 CFR 125.94(b)(3). See Section 6.5.6 Best Technology Available (BTA) Determinations below. At 51.6 MGD, the maximum intake velocity at the submerged intake openings in Lake Michigan is calculated to be approximately 0.39 fps. Assuming the traveling screens are in their original configuration and condition, the maximum actual through screen intake velocity is calculated to be 0.42 fps at the 51.6 MGD maximum intake flow. At the AIF of 27.0 MGD, the intake velocities at the submerged Lake Michigan openings and traveling screens are calculated as 0.21 fps and 0.22 fps, respectively. This assumes the traveling screens are in their original condition. At the design intake flow (DIF) of 69.12 MGD, the velocity in the 84-inch diameter pipe that conveys water from the intake structure to the onshore pump stations was calculated by IDEM to be 2.8 fps; at the maximum intake flow of 51.6 MGD this velocity is calculated to be 2.1 fps, and at the AIF of 27.0 MGD, this velocity is calculated to be 1.1 fps.
47
Based on the above velocity calculations and reported observations by divers, it is likely that fish can freely enter and exit the offshore intake structure. However, once fish enter the 84-inch diameter pipe that conveys water from the intake structure to the pumps, velocities above 1.1 fps and up to 2.1 fps likely entrap and prevent fish from exiting the CWIS.
6.5.3 Source Water Biological Characterization
The intake structure is positioned a distance of approximately 2,800 feet offshore and at a lake depth of approximately 30 feet, and is designed with a closed intake conduit that withdraws water from the bottom of Lake Michigan via four intake openings The area where the intake structure is located receives minimal commercial boat or ship traffic but is subject to occasional recreational boat activity. Bottom substrates for this portion of the southern shoreline of Lake Michigan consist of sand, the surface of which is unconsolidated and is constantly disrupted by surface wave energy. No critical or significant habitats, such as submerged aquatic vegetation or “sea grass beds,” have been identified in the area of intake structure. Coastal shoreline fish assemblages in the vicinity of the Midwest Plant and the available habitat in the vicinity of the Midwest CWIS intake crib is limited. Moreover, the distance of the intake crib from the shore likely reduces this area of the lake to planktivorous fish. 6.5.4 Impingement and Entrainment – Aquatic Life Studies
A. Impingement
Studies have been conducted to characterize numbers and species of organisms impinged at USS Midwest and other facilities located in the same proximity as the USS Midwest facility. Those other facilities include U.S. Steel Gary Works and ArcelorMittal Burns Harbor. The ArcelorMittal Burns Harbor offshore intake withdraws water from the same general area in Lake Michigan as does USS Midwest. Yellow perch, round goby, alewife, and spottail shiner were the most frequently impinged fish species at the ArcelorMittal Burns Harbor pump stations, which pull from the offshore intake accounting for 39.8%, 31.3%, 18.9%, and 6.7% of the total impinged fish sample respectively (ENVIRON, 2015). The USS Gary offshore Lakeside intake is located approximately 20 miles west of the US Midwest intake. At the USS Gary Lakeside Pump Station, the three most abundant species encountered were yellow perch, round goby, and alewife respectively. These three species accounted for 95.7% of the total abundance. Total richness observed at Lakeside Pump Station over the four-year monitoring period was 20 species with peak spawning periods resulting in the greatest abundance in April, June, and November.
48
At the USS Midwest facility, impingement studies were conducted beginning in 2012 and into 2014. At the USS Midwest facility, species (with the exception of round goby) were not able to be identified. Results of the USS Midwest, ArcelorMittal Burns Harbor and USS Gary impingement studies are summarized in more detail below.
USS Midwest Impingement Study and Fish Observations During Underwater CWIS Inspections
Impingement Study: A typical fish impingement study involves the collection of fish from the fish return system following physical impingement on travelling screens and subsequent wash‐down cycles. This is not possible at the Midwest CWIS because the travelling screens are not operational, and the fish return system has been blocked since 2006. In place of sampling fish impinged on traveling screens, a dual‐frequency Identification Sonar (DIDSON) was used to estimate fish abundance and describe fish behaviors in the cooling water intake structures (CWIS) at the Midwest Plant. Beginning June 2012 through May 2014, DIDSON data were collected at the Midwest CWIS at multiple locations, depths, and aiming orientations during 21 sample dates. Results demonstrated that DIDSON was effective for detecting and imaging fish within the intake structures. Fish were observed to be present in low numbers in 18 sampling events, and not present during three sampling events (June and September in 2012 and March in 2013). Only small fish (< 25 cm) were observed. Estimated abundance per event of small fish ranged from zero to 53 fish with peak abundance during the November 6, 2012 and November 12, 2013 sample dates. Temporal expansion of per event estimates to obtain annual estimates indicated the mean annual abundance ranged from about 28,000 fish to about 34,000 fish. It is assumed that fish within the CWIS are considered the equivalent of impinged fish. DIDSON sampling at the Midwest CWIS demonstrated its effectiveness for assessing distributions of fish in the primary well and pre‐well structures. Few fish were observed with DIDSON, which suggests densities of fish are very low in the CWIS. DIDSON data also provided estimates of total length of fish. However, specific behaviors related to structural features of the CWIS could not be effectively assessed due to the low fish densities observed. Given that travelling screens are not installed at the Midwest CWIS, DIDSON provides the only means to estimate the relationship between fish abundance and potential impingement mortality. The method however is not without limitations; species identification is challenging with DIDSON since many of the species potentially present in the wells have similar body morphologies and swimming behaviors. The only species that could be identified was the round goby (Neogobius melanostomus), which is a benthic species that typically moves around in hopping motions. These motions were evident in DIDSON imagery. One round
49
goby was observed along the bottom of the pre‐well during the November 30, 2012 sample event, two individuals of this species were observed along the bottom of the primary well during the April 18, 2013 sample event, and one was observed along the bottom of the primary well during the May 20, 2014 sample event. Fish Observation from Underwater CWIS Inspections: Underwater video from inspections conducted by Sea Brex Marine Inc. during dives in June/July 2006, April/May 2007, and October 2008 was reviewed specifically to record the number of fish encountered during the inspection. Dives in 2006 and 2007 included the intake chamber and the 2800-foot intake pipe, but not the wet well. The October 2008 dives included the wet well and intake chamber only. The results indicated the following:
June 14, 2006: Pipeline inspection from intake chamber at pumphouse outwards 2000 ft: 34 total fish consisting of 23 live fish 1-3 in. long and 11 dead fish 1-2 in. long. All but 3 fish were gobies.
June 14, 2006: Intake cribs in Lake Michigan inward 1000 ft: 73 total fish consisting of 69 live fish 1-2 in. long. Fish identified included 5 live and 2 dead gobies 1-3 in. long, and one live perch 3 in. long.
July 17 and July 26, 2006: Pumphouse bar rack to intake crib in Lake Michigan: 37 total fish consisting of live fish 1-2 in. long. One fish identified as a goby 1-2 in. long.
April 9, 2007: Pipeline inspection from intake chamber at pumphouse outward 2400 ft: 1 total fish consisting of a dead goby 1-2 in. long.
April 9, 2007: Lake Michigan intake crib inspection: 12 total fish consisting of 11 live fish 1-3 in. long and 1 dead fish 1-2 in. long. Fish identified included 6 live gobies 1-3 in. long and 1 dead goby 1-2 in. long.
May 10-11, 2007: Lake Michigan east and west intake final inspection: 10 total fish consisting of live fish 1-3 in. long. Four fish identified as gobies 1-3 in. long.
October 16, 2008: Intake chamber: 4 total fish consisting of 3 live gobies and 1 dead goby. Wet well: 3 total fish consisting of 2 live gobies and 1 dead goby.
These video count results range from a total of zero to 73 fish depending upon time of inspection and location within the intake system. The video counts of fish demonstrate the variability in fish impingement that can occur over time. It is unknown whether the same fish were encountered more than once, and duplicate counted during the video recording of the inspections presented above. However, the video count in combination with available observational information from U. S. Steel personnel demonstrate that fish within the intake system at Midwest LSPS (at certain locations) can freely swim about. Intake water velocities in the 84-inch diameter conduit that transports water from the Lake Michigan intake to the onshore pump stations, however, likely prevent fish from exiting the intake once inside the pipe.
50
There are no known documents associated with Midwest or its previous owners prior to 2006 that report fish observations, or provide records of fish impingement, or other reports that indicate operational practices, pump or infrastructure maintenance, or changes in operations were necessary at any time due to fish impingement at Midwest LSPS. AM Burns Harbor 316(b) Impingement Study
Impingement studies were conducted at the ArcelorMittal Burns Harbor facility (BH) from June 2012 through May 2014. For BH, withdrawal is via two pump stations that withdraw water from Lake Michigan via two intake cribs located approximately 3,600 feet offshore in about 40 feet of water. The DIF for both pump stations is 748.8 MGD. During the sampling period at the BH pump stations, there were 11 different species impinged (alewife, round goby, yellow perch, smallmouth bass, bluegill, emerald shiner, spottail shiner, gizzard shad, rainbow smelt, burbot, unidentifiable). No species of special concern were impinged at the BH pump stations; however, there was one sport fish species impinged (yellow perch). Yellow perch, round goby, alewife, and spottail shiner were the most frequently impinged fish species at the BH pump stations, accounting for 39.8%, 31.3%, 18.9%, and 6.7% of the total impinged fish sample respectively (ENVIRON, 2015).
USS Gary Impingement Studies
Pursuant to the previous NPDES Permit No. IN0000281 (effective March 1, 2010), U. S. Steel was required to conduct monitoring studies for both impingement and entrainment during the 2nd (2011 - 2012), 3rd (2012 - 2013), 4th (2013 - 2014), and 5th (2014 – 2015) years of the Permit. Impingement monitoring was required at No. 1 Pump Station, No. 2 Pump Station, and Lakeside Pump Station, while entrainment monitoring was only required at No. 1 Pump Station and Lakeside Pump Station (see entrainment section below). Studies were abbreviated in 2015 with the agreement of IDEM due to the promulgation of the final federal 316(b) rule which eliminated the need for the final year of monitoring. At the Lakeside Pump Station which pulls approximately 64. MGD on average from an offshore intake structure, the three most abundant species encountered were yellow perch, round goby, and alewife respectively. These three species accounted for 95.7% of the total abundance. Total richness observed at Lakeside Pump Station over the four-year monitoring period was 20 species with peak spawning periods resulting in the greatest abundance in April, June, and November. More detail available in charts 6, 7, and 8 of the 40 CFR 122.21 (r)(2) – (r)(2) report submitted with the NPDES application. Charts 6, 7 and 8 from the 40 CFR 122.21 (r)(2) – (r)(8) report submitted with the NPDES application provide estimated annual impingement totals by year and species for PS No 1, PS No 2 and Lakeside Intakes based on the sampling conducted.
51
B. Entrainment
Entrainment studies have been conducted at USS Midwest as well as several other nearby facilities. The results of those studies indicate that for the volume of water used by these facilities, there were relatively small numbers of organisms entrained by their offshore intakes. Distance of intakes from shore at some intakes and lack of habitat likely contribute to the smaller number of organisms entrained. Based on the studies from the USS Midwest, USS Gary as well as other nearby Lake Michigan facility studies, it appears that entrainment impacts from operation of the USS Midwest facility are not significant in terms of numbers or species entrained as well as impacts on the nearby ecosystem. Results of the USS Midwest, USS Gary Works and ArcelorMittal Indiana Harbor East and Burns Harbor entrainment studies are summarized in more detail below.
U.S. Steel Midwest -Entrainment Study
The USS Midwest Plant operates a cooling water intake structure (CWIS) at the Portage facility which is located approximately 2,800 feet offshore at a depth of roughly 30 feet. Intake flows for this pump station average approximately 27 MGD. Entrainment samples were collected during 32 sample events over a 24-month period from June 2012 to May 2014. Samples were collected every other week during peak spawning months (March – May and October – November) and once a month during February, June – September. Of the 32 sample events, 28 did not indicate the presence of any ichthyoplankton. A check on entrainment subsampling effectiveness was accomplished by evaluating the presence/absence of zooplankton and mussel veligers in the entrainment samples. Therefore, is it believed that the subsampling system was operating effectively since nonicthyoplankton organisms (zooplankton and mussels) were present in the majority of samples. Samples that were positive for the presence of ichthyoplankton were June 25, 2012, June 24, 2012, June 17, 2013, and August 19, 2013. Projections of ichthyoplankton per 24-hours ranged from 58 to 1,121. For Sample Events #1 - #16, the annual projection of ichthyoplankton entrained is 15,667, and for Sample Events #17- #32 the projection is 26,900. These projections are a combination of fish eggs and larvae collected, which includes Actinopterygii (class for ray-finned fishes), Gobidae (family for goby) juveniles, Neogobius melanostomus (species and genus for Round Goby). Zooplankton (not identified to species) were present during every sample event except June 25, 2012, while the appearance of mussel veligers was more inconsistent. No threatened or endangered species were encountered; nor were there any species on the Indiana Department of Natural Resources list of species of concern collected during sampling.
52
The results of entrainment sampling and the subsequent data evaluation demonstrate that entrainment of critical fish eggs, larvae, and other valued ichthyoplankton by the Midwest Plant CWIS and equipment is likely negligible. This is likely due to a variety of factors, including the fact that coastal shoreline fish assemblages in the vicinity of the Midwest Plant and the available habitat in the vicinity of the Midwest CWIS intake crib is limited. Moreover, the distance of the intake crib from the shore likely reduces this area of the lake to planktivorous fish. Consequently, the high number of samples with no entrained ichthyoplankton, and the few positive samples dominated by round goby larvae indicate that the impact due to entrainment would be considered negligible (United States Steel Corporation Midwest, 2015).
ArcelorMittal Burns Harbor – Entrainment Studies
2012 -2014 Study: Concurrently with impingement studies, entrainment characterization studies were performed over a two-year period from 2012 to 2014. The BH pump stations withdraw water from Lake Michigan via two intake cribs located approximately 3,600 feet offshore in about 40 feet of water, with a total DIF of 748.8 MGD. Entrainment samples were collected during 32 sample events over a 24-month period from June 2012 to May 2014. Samples were collected more frequently during peak spawning months (February – May and October – November). The results of the 32 entrainment sampling events found no fish larvae and/or eggs in over 80 percent of all sampling events at both pump stations. Subsequently, the total daily entrainment estimates of ichthyoplankton varied radically from 0 to 132,000 larvae and/or eggs per day. Round goby larvae accounted for the majority of fish larvae entrained. The only other identified larvae were alewife from two sampling events at one of the pump stations. Fish eggs accounted for roughly two thirds of all ichthyoplankton entrained, but because they were only identified to the class or family level, no further assessment was possible. However, given the significant numbers of alewife found in the impingement data, it is assumed that the majority of the eggs are associated with alewife (ENVIRON, 2015). Given the high percentage of samples with no entrained ichthyoplankton, and with most of the positive samples being dominated by round goby larvae, the impact due to entrainment is considered negligible for AMBH. 2019 -2020 Study: AMBH also conducted entrainment studies in 2019 – 2020 as required by the federal 316(b) rule. AMBH concluded that: “positive samples being comprised solely of demersal spawning Centrarchidae or Percidae eggs, the impact due to entrainment is negligible. Estimated ichthyoplankton entrainment of 7,555 larvae and/or eggs per day at PS1 and 5,375 larvae and/or eggsper day at PS2 are significantly less than those rates found at other facilities in the Great Lakes Basin.” These more recent studies and conclusions are still under review by IDEM.
53
ArcelorMittal Indiana Harbor
The IHE has one offshore intake that withdraws water from Lake Michigan via the Main Intake and Pumphouse 2E. The total DIF for the Main Intake is 1152 MGD. During the IHE 2E Pumphouse sampling, entrainment samples were collected monthly or twice monthly over the two-year period per the sampling plan at the 7E and 2E intakes. Sample events spanned periods both with and without chlorination for mussel control. Water volume of entrained samples averaged 122 cubic meters. The results of 32 events found no fish/larvae or eggs in the majority of sampling events. Only one fish, all of the same species, (slimy sculpin) was entrained during the sampling period (Tetra Tech, 2016).
U. S. Steel Gary Works
Pursuant to the NPDES Permit No. IN0000281 (effective March 1, 2010) Part III.C.2(a), U. S. Steel was required to conduct scientifically valid entrainment studies at the Lakeside and #2 Pump Stations in two-year periods following Year 1 of the Permit. Due to logistical constraints, entrainment sampling was conducted at No. 1 Pump Station, rather than No. 2 Pump Station. This change in sampling location was reflected in the study plan submitted to IDEM. Entrainment characterization studies were conducted in the second half of 2011, 2012, 2013, and 2014 at the U. S. Steel Gary Works site, but were suspended in 2015 following a March 24, 2015 email from the Indiana Department of Environmental Management, stating that sampling could be stopped. Entrainment sample analysis focused on identification to the lowest practical taxonomic classification and enumeration of fish larvae/juveniles, fish eggs, mussel veligers, and immature mussels. Invertebrate forms of plankton that were noted included bivalve veligers and copepods as either present or absent. Ichthyoplankton were fairly rare (although invertebrate forms were observed in most samples). A certain degree of seasonality was observed during entrainment sampling. Ichthyoplankton, when encountered, were typically identified as present during the spring and summer months. Entrainment typically occurred in June, July, and August at both No. 1 Pump Station and Lakeside Pump Station. Raw data, daily entrainment estimates, and annualized totals are shown for each pump station in Tables 2 through 10 in the NPDES Permit Application 40 CFR 122.21 (r)(9) – (r)(12) report. The annualized entrainment estimate for the facility by species and life stage is shown in Table 11 in the NPDES Permit Application 40 CFR 122.21 (r)(9) – (r)(12) report. Table 12, from the same report, reflects the same information as shown in Table 11, but has been adjusted to remove the identified nuisance species (i.e., Round Goby). Table 10 from the same report provides same data but for Lakeside Intake only.
54
6.5.5 Protected Species Susceptible to Impingement and Entrainment The federal regulation requires that facilities identify all federally listed threatened and endangered species and designated critical habitat that are present in the “action area.” The “action area,” as defined by the USFWS and NMFS under Section 7, includes all areas that may be directly or indirectly affected by the operation of a facility’s CWIS and not merely the immediate area involved in the action; this is because the USFWS and NMFS consider that the effects of CWIS can extend well beyond the footprint of the CWIS. There are no known federally listed threatened or endangered (T&E) aquatic species in the vicinity of the intakes that may be susceptible to impingement and entrainment. However, Lake Sturgeon (Acipenser fulvescens) is listed as a state Endangered Species and is identified on IDNR’s Wildlife Action Plan. One tagged adult Lake Sturgeon was found during the 2011 316(a) Demonstration conducted by the BP Whiting refinery, although it was not at a location in the vicinity of the Whiting Refinery Intakes. It is possible, however, based on habitat preferences of Lake Sturgeon that they could be found near the BP or USS CWIS Intakes. In addition, Troutperch (Percopsis omiscomaycus) and Slimy Sculpin (Cottus cognatus), both being State Species of Concern, have been identified in 316(b) impingement studies in the area. IDEM received the following comment on the permittee’s 316(b) application from the U.S. Fish and Wildlife Service, Bloomington Field Office on December 15, 2020:
[T]here are no endangered species / CWIS issues with this permit. 6.5.6 Best Technology Available (BTA) Determinations
A. Impingement BTA
Under 40 CFR 125.94(c) existing facilities subject to the rule must comply with one of the following seven BTA Standards for Impingement Mortality:
1. Operate a closed-cycle recirculating system as defined at 40 CFR §125.92; 2. Operate a CWIS that has a maximum design through-screen design intake velocity of
0.5 fps; 3. Operate a CWIS that has a maximum actual through-screen intake velocity of 0.5 fps; 4. Operate an offshore velocity cap that is a minimum of 800 feet offshore; 5. Operate a modified traveling screen that the Director (IDEM) determines meets the
definition of the rule (at §125.92(s)) and that the Director (IDEM) determines is BTA for impingement reduction;
6. Operate any other combination of technologies, management practices, and operational measures that the Director (IDEM) determines is BTA for impingement reduction; or
7. Achieve the specified impingement mortality performance standard of less than 24 percent.
55
The permittee has proposed to comply with alternative 3, above. Under this alternative, the permittee must operate a cooling water intake structure that has a maximum through-screen intake velocity of 0.5 feet per second. The owner or operator of the facility must submit information to IDEM that demonstrates that the maximum intake velocity as water passes through the structural components of a screen measured perpendicular to the screen mesh does not exceed 0.5 feet per second. The maximum velocity must be achieved under all conditions, including during minimum ambient source water surface elevations (based on best professional judgment using hydrological data) and during periods of maximum head loss across the screens or other devices during normal operation of the intake structure. IDEM may authorize the owner or operator of the facility to exceed the 0.5 fps velocity at an intake for brief periods for the purpose of maintaining the cooling water intake system, such as backwashing the screen face. If the intake does not have a screen, the maximum intake velocity perpendicular to the opening of the intake must not exceed 0.5 feet per second during minimum ambient source water surface elevations. In addition, the permittee must monitor the velocity at the screen at a minimum frequency of daily. In lieu of velocity monitoring at the screen face, the permittee may calculate the through-screen velocity using water flow, water depth, and the screen open areas. The permit will specify the permittee’s selected compliance method for this alternative (monitor velocity or calculate velocity). As discussed in previously in Section 6.5.2 Facility and Cooling Water Intake Structure (CWIS) Description, at the maximum daily operating flow of 51.6 MGD, the intake velocity at the submerged intake openings in Lake Michigan is calculated at 0.39 fps. Assuming the traveling screens are in their original configuration and condition, the maximum actual through screen velocity is calculated to be 0.42 fps (this was calculated using the intake flow of 51.6 MGD). IDEM concurs with the permittee that it operates a cooling water intake structure that has a maximum actual through screen intake velocity of 0.5 fps and is in compliance with best technology available (BTA) alternative 3 for impingement mortality. B. Entrainment BTA
For existing facilities, EPA did not identify any single technology or group of technology controls as available and feasible for establishing national performance standards for entrainment. Instead, EPA’s regulations require the permitting agency to make a site-specific determination of the best technology available standard for entrainment for each individual facility. See 40 CFR 125.94(d). EPA’s regulations put in place a framework for establishing entrainment requirements on a site-specific basis, including the factors that must be considered in the determination of the appropriate entrainment controls. These factors include the number of organisms entrained, emissions changes, land availability, and remaining useful plant life as well as social benefits and costs of available technologies when such information is of sufficient rigor to make a decision. These required factors are listed under 40 CFR 125.98(f)(2). EPA’s regulations also establish factors that may be considered when establishing site-specific entrainment BTA requirements, including entrainment impacts on the waterbody,
56
thermal discharge impacts, credit for flow reductions associated with unit retirements, impacts on reliability of energy delivery, impacts on water consumption, and availability of alternative sources of water. (40 CFR 125.98(f)(3)) After considering all the factors that must and may be considered by the federal rules, see discussion below, IDEM finds that the existing facility meets BTA for entrainment.
Must and May Factor Discussion (40 CFR 125.98(f)(2) and (3))
1. MUST FACTORS (40 CFR 125.98(f)(2))
i. Numbers and types of organisms entrained, including, specifically, the numbers
and species (or lowest taxonomic classification possible) of Federally listed, threatened and endangered species, and designated critical habitat (e.g., prey base); The results of entrainment sampling and the subsequent data evaluation at USS Midwest and other nearby industrial facilities demonstrate that entrainment of critical fish eggs, larvae, and other valued ichthyoplankton by the Midwest Plant CWIS and equipment is likely negligible. This is likely due to a variety of factors, including the fact that coastal shoreline fish assemblages in the vicinity of the Midwest Plant and the available habitat in the vicinity of the Midwest CWIS intake crib is limited. Moreover, the distance of the intake crib from the shore likely reduces this area of the lake to planktivorous fish. Consequently, the high number of samples with no entrained ichthyoplankton, and the few positive samples dominated by round goby larvae indicate that the impact due to entrainment would be considered negligible (United States Steel Corporation Midwest, 2015). There are no known Federally listed threatened or endangered (T&E) aquatic species near the intakes that may be susceptible to impingement and entrainment. In addition, there is no Federally listed designated critical habitat in the vicinity of the intakes. A state-listed endangered species, lake sturgeon (Acipenser fulvescens) is listed for Lake County, Indiana and is identified on IDNR’s Wildlife Action Plan. One tagged adult lake sturgeon was found during the field work in 2011 in support of a 316(a) Demonstration, however it was not at a location near the USS Midwest intakes. In addition to lower withdrawal rates relative to other users in the area, the USS Midwest intake is located approximately 2800 feet offshore and submerged roughly 30 to 35 feet below the surface. Submerged, offshore intakes withdraw water from less biologically productive areas to reduce impingement and entrainment. Intakes designed in this manner, specifically in the southern basin of Lake Michigan, exhibit a lower density of organisms as well as modify the species found
57
as a function of the distance from the shoreline and depth in water column. Intakes at an offshore submerged location typically result in a larger proportion of round goby in the fish impacted than near shore intakes. IDEM agrees with USS Midwest that the entrainment impacts are expected to be negligible given the location of the intake openings in Lake Michigan, a lower withdrawal rate compared to other representative facilities and the low rates of entrainment observed at USS Midwest and in those other facility studies.
ii. Impact of changes in particulate emissions or other pollutants associated with
entrainment technologies; The installation of additional cooling towers would be expected to result in: • Significant increases in particulate emissions (e.g., PM, PM-10, and PM-2.5)
from the cooling towers drift; • Significant increases in carbon dioxide (CO2) and other criteria air pollutants
from the increase in energy required to operate the cooling towers; • A potential increase of mists, fog, and icing from the cooling towers
evaporation plumes impacting facility safety; • Impacts to nearby vegetation/structures from drift corrosion; and • An increase in the total dissolved solids (TDS) loading to Lake Michigan due to
concentrating pollutants in cooling tower cycles and use of water treatment additives to control corrosion.
iii. Land availability insofar as it relates to the feasibility of entrainment technology;
The following is taken from the 2020 NPDES Permit application:
The installation of cooling towers would result in a significant impact to land availability on the USS MW Plant footprint. The land availability is limited given the USS MW Plant proximity to heavily populated industrial and residential areas. The installation of cooling towers within the USS MW Plant’s process areas would be complex given the existing limited available space and the need for an additional area that can be used for buffer. The buffer area is required due to safety concerns from the increased potential for mists, fog, and icing (see response to Section 9.2 above).
iv. Remaining useful plant life; and
USS Midwest has operated at this location since the early 1900s and plans to continue operations for the foreseeable future.
v. Quantified and qualitative social benefits and costs of available entrainment
technologies when such information on both benefits and costs is of sufficient rigor to make a decision.
58
USS Midwest has not performed any detailed evaluation of quantified and qualitative social benefits and costs of available entrainment technologies such as cooling towers, wedgewire screen intakes or fine mesh screens. However, it is anticipated that the installation of these technologies would result in minimal further reductions in entrainment rates, given the predicted low rates of entrainment at USS Midwest and based on a review of entrainment characterization data from representative nearby Lake Michigan intakes (see above).
2. MAY FACTORS (40 CFR 125.98(f)(3))
i. Entrainment impacts on the waterbody;
As discussed above, the entrainment impacts on Lake Michigan from operation of the USS Midwest intakes are expected to be negligible.
ii. Thermal discharge impacts; Installation of cooling towers would significantly reduce the thermal load discharged by USS Midwest to the Burns Waterway. The benefit of such a reduction is not clear given the modeling studies showing that the current thermal discharge is in compliance with applicable NPDES permit limits that address both in-stream criteria and a rise in temperature above upstream values. That said, any reduction in thermal load would likely benefit fish passage.
iv. Impacts on the reliability of energy delivery within the immediate area; The impact of cooling towers or other entrainment control technologies on energy reliability is unknown.
v. Impacts on water consumption; and The installation of cooling towers would possibly result in an increase in net water consumption, due to the increase in consumptive use from cooling tower evaporation
vi. Availability of process water, gray water, wastewater, reclaimed water, or other
waters of appropriate quantity; and, quality for reuse as cooling water The USS Midwest facility has limited options for available process, gray, waste, or reclaimed water in appropriate quantity and/or appropriate quality that could be used for reuse of the total volume of cooling water.
59
vii. Credit for flow reductions associated with unit retirements; USS Midwest states that they continually evaluate water optimization projects but has not retired units that would impact water consumption within the last ten years preceding October 14, 2014.
6.5.7 Best Technology Available (BTA) Impingement and Entrainment Determination
Summary
IDEM concurs with the permittee that it operates a CWIS that has a maximum actual through screen intake velocity of 0.5 fps and the existing CWIS is in compliance with best technology available (BTA) alternative 3 for impingement mortality. IDEM has also determined that the existing facility and CWIS meets BTA for entrainment. Primary in this entrainment BTA determination is the relatively small numbers of organisms likely entrained which is primarily due to the intake location 2800 feet offshore. 6.5.8 Permit Conditions
The permittee shall comply with requirements below:
1. In accordance with 40 CFR 125.98(b)(1), nothing in this permit authorizes take for the purposes of a facility’s compliance with the Endangered Species Act.
2. The permittee must at all times properly operate and maintain the cooling water intake
structure and associated intake equipment. 3. The permittee must inform IDEM of any proposed changes to the CWIS or proposed
changes to operations at the facility that affect the information taken into account in the current BTA evaluation.
4. At a minimum frequency of daily, the permittee must calculate the through-screen velocity
at both the off-shore intake and at the inoperable traveling screens using water flow, water depth, and the screen/intake open areas. These velocities and factors used in the calculation shall be reported on the MMR and DMR as Outfall 600, as follows (it is assumed that the open area of the off-shore intake will remain 202.75 square feet for the life of this permit. The permittee is required to notify IDEM if it does change):
5. The permittee must either conduct visual inspections or employ remote monitoring devices during the period the cooling water intake structure is in operation as required by 40 CFR 125.96(e). The permittee must conduct such inspections at least weekly to ensure that any technologies operated to comply with 40 CFR 125.94 are maintained and operated to function as designed including those installed to protect Federally listed threatened or endangered species or designated critical habitat. Alternative procedures can be approved if this requirement is not feasible (e.g., an offshore intake, velocity cap, or during periods of inclement weather).
6. In accordance with 40 CFR 125.97(c), by January 31 of each year, the permittee must
submit to the Industrial NPDES Permit Section IDEM-OWQ an annual certification statement for the preceding calendar year signed by the responsible corporate officer as defined in 40 CFR 122.22 (see 327 IAC 5-2-22) subject to the following:
a. If the information contained in the previous year's annual certification is still pertinent,
you may simply state as such in a letter to IDEM and the letter, along with any applicable data submission requirements specified in this section shall constitute the annual certification.
b. If you have substantially modified operation of any unit at your facility that impacts
cooling water withdrawals or operation of your cooling water intake structures, you must provide a summary of those changes in the report. In addition, you must submit revisions to the information required at 40 CFR 122.21(r) in your next permit application.
7. Best technology available (BTA) determinations for entrainment mortality and impingement mortality at cooling water intake structures will be made in each permit reissuance in accordance with 40 CFR 125.90-98. The permittee must submit all the information required by the applicable provisions of 40 CFR 122.21(r)(2) through (r)(8) with the next renewal application. Since the permittee has submitted the studies required by 40 CFR 122.21(r), the permittee may, in subsequent renewal applications pursuant to 40 CFR 125.95(c), request to reduce the information required if conditions at the facility and in the waterbody remain substantially unchanged since the previous application so long as the relevant previously submitted information remains representative of the current source water, intake structure, cooling water system, and operating conditions. Any habitat designated as critical or species listed as threatened or endangered after issuance of the current permit whose range of habitat or designated critical habitat includes waters where a facility intake is located constitutes potential for a substantial change that must be addressed by the owner/operator in subsequent permit applications, unless the facility received an exemption pursuant to 16 U.S.C. 1536(o) or a permit pursuant to 16 U.S.C. 1539(a) or there is no reasonable expectation of take. The permittee must submit the request for reduced cooling water intake structure and waterbody application information at least two years and six months prior to the expiration of the NPDES permit. The request must identify each element in this subsection that it determines has not substantially changed since the previous permit application and the basis for the determination. IDEM has the discretion to accept or reject any part of the request.
61
8. The permittee shall submit and maintain all the information required by the applicable
provisions of 40 CFR 125.97. 9. All required reports must be submitted to the IDEM, Office of Water Quality, NPDES
6.6 Streamlined Mercury Variance (SMV) Based on a Reasonable Potential Analysis performed on February 12, 2021, it was determined that the Projected Effluent Quality (PEQ) was greater than the Projected Effluent Limitations (PEL) for mercury discharged from Outfall(s) 004. Therefore, water quality based effluent limitations were required and included in the permit. In anticipation of not being able to meet the final limitations for mercury, the permittee applied for a Streamlined Mercury Variance (SMV) on February 5, 2021. The SMV application was deemed complete on February 8, 2021. The SMV has been incorporated into this permit renewal and applies to the discharge from Outfall 004. The SMV establishes a streamlined process for obtaining a variance from a water quality criterion used to establish a WQBEL for mercury in an NPDES permit. The goal of the SMV is to reduce the effluent levels of mercury towards, and achieve as soon as practicable, compliance with the mercury WQBELs through implementation of a pollutant minimization program plan (PMPP). The SMV will remain in effect until the permit expires under IC 13-14-8-9. Pursuant to IC 13-14-8-9(e), when the SMV is incorporated into a permit extended under IC 13-15-3-6 (administratively extended), the SMV will remain in effect as long as the NPDES permit requirements affected by the SMV are in effect. Mercury Interim Discharge Limit The permit includes an interim discharge limit for mercury of 18 ng/l. Compliance with the interim discharge limit will be achieved when the average of the measured effluent daily values over the rolling twelve-month period is less than the interim limit. Each reporting period, the permittee shall report a daily maximum value. After the first year of the permit term, the permittee will also report the annual average value. The interim discharge limit was developed in accordance with 327 IAC 5-3.5-7 and with 327 IAC 5-3.5-8. Specifically, the interim discharge limit shall be based upon available, valid, and representative data of the effluent mercury levels collected and analyzed over the most recent two (2) year period from the facility. The interim limit of 18 ng/l represents the highest daily value for mercury from the most recent two (2) years of the permittee’s effluent data. This Office received a complete SMV application on February 5, 2021. Therefore, mercury data two (2) years prior to February 5, 2021 were utilized in determining the mercury interim discharge limit. The SMV establishes a streamlined process for obtaining a variance from a water quality criterion used to establish a WQBEL for mercury in an NPDES permit. The goal of the SMV is to reduce the effluent levels of mercury towards, and achieve as soon as practicable, compliance with the mercury WQBELs through implementation of a pollutant minimization
program plan (PMPP). The SMV renewal will remain in effect until the permit expires under IC 13-14-8-9. Pursuant to IC 13-14-8-9(e), when the SMV renewal is incorporated into a permit extended under IC 13-15-3-6 (administratively extended), the renewal will remain in effect until the permit expires. Pollutant Minimization Program Plan (PMPP) PMPP requirements are outlined in 327 IAC 5-3.5-9 and are included in Part V of the NPDES permit in accordance with 327 IAC 5-3.5-6. The PMPP focuses on pollution prevention and source control measures to achieve mercury reduction in the effluent. The PMPP was public noticed prior to submittal to IDEM in accordance with 327 IAC 5-3.5-9(c). No comments were received during the public notice period. The goal of the PMPP is to reduce the effluent levels of mercury towards, and achieve as soon as practicable, compliance with the mercury WQBELs established for the permitted facility. SMV Annual Reports The permittee is required to submit annual reports to IDEM by August 1 of each year in which the SMV is in effect. The annual report must describe the SMV applicant's progress toward fulfilling each PMPP requirement, the results of all mercury monitoring within the previous year, and the steps taken to implement the planned activities outlined under the PMPP. 6.7 Spill Response and Reporting Requirement Reporting requirements associated with the Spill Reporting, Containment, and Response requirements of 327 IAC 2-6.1 are included in Part II.B.2.(d), Part II.B.3.(c), and Part II.C.3. of the NPDES permit. Spills from the permitted facility meeting the definition of a spill under 327 IAC 2-6.1-4(15), the applicability requirements of 327 IAC 2-6.1-1, and the Reportable Spills requirements of 327 IAC 2-6.1-5 (other than those meeting an exclusion under 327 IAC 2-6.1-3 or the criteria outlined below) are subject to the Reporting Responsibilities of 327 IAC 2-6.1-7. It should be noted that the reporting requirements of 327 IAC 2-6.1 do not apply to those discharges or exceedances that are under the jurisdiction of an applicable permit when the substance in question is covered by the permit and death or acute injury or illness to animals or humans does not occur. In order for a discharge or exceedance to be under the jurisdiction of this NPDES permit, the substance in question (a) must have been discharged in the normal course of operation from an outfall listed in this permit, and (b) must have been discharged from an outfall for which the permittee has authorization to discharge that substance. 6.8 Permit Processing/Public Comment Pursuant to IC 13-15-5-1, IDEM will publish the draft permit document online at https://www.in.gov/idem/5474.htm. Additional information on public participation can be found in the "Citizens' Guide to IDEM", available at https://www.in.gov/idem/6900.htm. A 45-day comment period is available to solicit input from interested parties, including the public. A general notice will also be published in the newspaper with the largest general circulation within Porter County.
Industrial NPDES Permits Section Subject: Wasteload Allocation Report for U.S. Steel – Midwest Plant in Porter County
(IN0000337, WLA002530) Water quality-based effluent limitations (WQBELs) were calculated for multiple pollutants and a reasonable potential analysis for free cyanide, formaldehyde, mercury and whole effluent toxicity (WET) was conducted for the renewal of the NPDES permit for U.S. Steel – Midwest Plant. The analysis was done for Outfall 004, which discharges to the Portage-Burns Waterway, a tributary to the Indiana portion of the open waters of Lake Michigan. Therefore, the discharge is covered under the rules for the Great Lakes system. The effluent flow for Outfall 004 used in this analysis was 17 MGD. The Portage-Burns Waterway is designated for full-body contact recreation and shall be capable of supporting a well-balanced, warm water aquatic community. The East Branch of Little Calumet River and its tributaries downstream to Lake Michigan via Burns Ditch (Portage-Burns Waterway) are designated in 327 IAC 2-1.5-5(a)(3)(B) as salmonid waters and shall be capable of supporting a salmonid fishery. The Indiana
−2−
portion of the open waters of Lake Michigan is classified as an outstanding state resource water (OSRW) in 327 IAC 2-1.5-19(b)(2). The 2018 assessment unit for the Portage-Burns Waterway is INC0159_02. This assessment unit is on the 2018 303(d) list for PCBs in fish tissue. A TMDL for E. coli for the Portage-Burns Waterway was approved by U.S. EPA January 28, 2005 and is part of the Little Calumet/Burns Ditch TMDL. The TMDL requires load reductions from nonpoint sources, but not from point source discharges. The TMDL does not require permit limits for E. coli for Outfall 004. A TMDL for E. coli for the Lake Michigan shoreline was approved by U.S. EPA on September 30, 2004 and is part of the Lake Michigan Shoreline TMDL. The calculation of the monthly average and daily maximum projected effluent quality (PEQ) for individual toxic pollutants is included in Table 1. The results of the reasonable potential statistical procedure are included in Table 2. The results show that WQBELs are not required for free cyanide, but they are required for mercury and formaldehyde. The WQBELs for mercury and formaldehyde calculated for Outfall 004 are included in Table 3. This table also includes WQBELs for the pollutants regulated by Federal Effluent Limitation Guidelines (ELGs) at internal Outfall 304. The WQBELs for the ELG parameters are being provided for comparison to applicable technology-based effluent limitations. Free cyanide is also included in Table 3, even though reasonable potential was not demonstrated, for comparison to the existing WQBELs. A reasonable potential analysis for Outfall 004, for WET, was done in accordance with the Federal Great Lakes Guidance in 40 CFR Part 132. U.S. EPA overpromulgated Indiana’s reasonable potential procedure for WET in 327 IAC 5-2-11.5(c)(1) and Indiana is now required to apply specific portions of the Federal Great Lakes Guidance when conducting reasonable potential analyses for WET. Indiana’s requirements are included under 40 CFR Part 132.6. The results of the reasonable potential analysis for WET show that the discharge from Outfall 004 has a reasonable potential to exceed the numeric interpretation of the narrative criterion for acute and chronic WET. Therefore, WQBELs are required for WET. Once a determination is made that WQBELs are required for WET, the WQBELs are established in accordance with 327 IAC 5-2-11.6(d). This provision allows a case-by case determination of whether to establish a WQBEL for only acute or chronic WET, or WQBELs for both acute and chronic WET, the number of species required for testing and the species required for testing. The purpose of the WLA report is to provide the numerical limits. The numerical limits for acute and chronic WET are included in Table 3. The documentation of the wasteload allocation analysis is included as an attachment.
-1-
Documentation of Wasteload Allocation Analysis For Discharges to the Great Lakes System
Analysis By: Jennifer Elliot Date: February 12, 2021 Reviewed By: John Elliott WLA Number: 002530 Facility Information · Name: U.S. Steel – Midwest Plant · NPDES Permit Number: IN0000337 · Permit Expiration Date: March 31, 2021 · County: Porter · Purpose of Analysis: Recalculate WQBELs for permit renewal using updated flow and
conduct reasonable potential analysis for free cyanide, formaldehyde, mercury and WET. · Outfall: 004 · Facility Operations: Operations contributing to Outfall 004 include noncontact cooling
water, stormwater and wastewater from internal Outfall 304, which includes process wastewater from internal Outfalls 104 and 204.
· Applicable Effluent Guidelines: 40 CFR 420.92 – Acid Pickling (TSS, oil & grease, lead and zinc), 40 CFR 420.102 – Cold Forming (TSS, oil & grease, lead, zinc, naphthalene and tetrachloroethylene), 40 CFR 420.112 and 420.114 – Alkaline Cleaning (TSS and oil & grease), 40 CFR 420.122 and 420.124 – Hot Coating (TSS, oil & grease, lead, zinc and hexavalent chromium) and 40 CFR 433.14 – Metal Finishing (cadmium, total chromium, copper, lead, nickel, silver, zinc, total cyanide and TTO)
· Current Permitted Flow: 19 MGD · Type of Treatment: None besides the treatment for internal Outfalls 104 and 204. · Effluent Flow for WLA Analysis: 17 MGD (The highest monthly average flow from August
2018 through July 2020 and occurred during August 2018.) · Current Effluent Limits:
-2-
Parameter Monthly Average Daily Maximum Measuremen
t Frequency (mg/l) (lbs/day) (mg/l) (lbs/day) Total Residual Chlorine
0.01
1.3
0.02
3.1 Daily
Silver
0.000076 0.012 0.00013 0.021 2 x Monthly
Free Cyanide 0.0075 1.2 0.013 2.1 2 x Monthly
Cadmium 0.0077 1.2 0.013 2.1 2 x Monthly
Copper 0.030 4.7 0.052 8.2 2 x Monthly
Nickel 0.21 33.3 0.36 57.1 2 x Monthly
Lead 0.038 6.0 0.066 10.5 2 x Monthly
Acute WET (TUa) [1] -- -- Report -- Quarterly
Chronic WET (TUc) [2] Report -- -- -- Quarterly
[1] An acute toxicity reduction evaluation trigger of 1.0 TUa applies to the discharge. [2] A chronic toxicity reduction evaluation trigger of 1.9 TUc applies to the discharge. Pollutants of Concern for WLA Analysis
Pollutants of Concern and Type of WLA Analysis
Parameter Type of Analysis
Reason for Inclusion on Pollutants of Concern List
Fluoride WQBEL Limited at internal Outfall 304 Cadmium, Hexavalent Chromium, Total Chromium, Copper, Total Cyanide, Lead, Nickel, Silver, Zinc, Naphthalene and Tetrachloroethylene
WQBEL Federal effluent limitation guidelines apply at internal Outfall 304
Free Cyanide WQBEL Limited in current permit and Federal effluent limitation guideline for total cyanide applies at
internal Outfall 304 Mercury RPE Monitored in current permit.
Formaldehyde RPE Form 2C data showed elevated levels
Whole Effluent Toxicity RPE Monitored in current permit
−3−
Receiving Stream Information · Receiving Stream: Outfall 004 discharges to the Portage-Burns Waterway, about 0.06 miles
upstream of the Indiana portion of the open waters of Lake Michigan (See Attachment 1) · Drainage Basin: Lake Michigan · Drinking Water Intakes Downstream: None on Portage-Burns Waterway. There are several
public water system intakes in Lake Michigan, but none will impact this analysis. · Designated Stream Use: Portage-Burns Waterway is designated for full-body contact
recreation and shall be capable of supporting a well-balanced, warm water aquatic community. The East Branch of the Little Calumet River and its tributaries downstream to Lake Michigan via Burns Ditch (Portage-Burns Waterway) are designated in 327 IAC 2-1.5-5(a)(3)(B) as salmonid waters and shall be capable of supporting a salmonid fishery. Therefore, Portage-Burns Waterway is designated as a salmonid water. The Indiana portion of the open waters of Lake Michigan is designated for full-body contact recreation; shall be capable of supporting a well-balanced warm water aquatic community; is designated as salmonid waters and shall be capable of supporting a salmonid fishery; is designated as a public water supply; and is designated as an industrial water supply.
· Stream Classification: The Indiana portion of the open waters of Lake Michigan is classified in 327 IAC 2-1.5-19(b)(2) as an outstanding state resource water (OSRW).
· 12 Digit HUC: 040400010509 · Assessment Unit (2018): INC0159_02 (Portage-Burns Waterway) and INC0163_G1074
(Lake Michigan Shoreline) and INC0163_G1093 (Lake Michigan Shoreline) · 303(d) List: The Portage-Burns Waterway (assessment unit INC0159_02) is on the 2018
303(d) list for PCBs in fish tissue. The Lake Michigan Shoreline is on the 2018 303(d) list for mercury in fish tissue and PCBs in fish tissue.
· TMDL Status: A TMDL for E. coli for Portage-Burns Waterway was approved by U.S. EPA January 28, 2005 and is part of the Little Calumet/Burns Ditch TMDL. A TMDL for E. coli for the Lake Michigan shoreline was approved by U.S. EPA on September 30, 2004 and is part of the Lake Michigan Shoreline TMDL.
· Q7,10 (upstream of facility): 100 cfs (65 mgd) (USGS gaging station 04095090 Burns Ditch at Portage is on Portage-Burns Waterway at the bridge upstream of Outfall 002. The drainage area at this gage is 331 mi2, the Q7,10 is 100 cfs, the Q1,10 is 84 cfs, and the harmonic mean flow is 384 cfs. The drainage area and stream design flows were obtained from the book Low-Flow Characteristics for Selected Streams in Indiana by Kathleen K. Fowler and John T. Wilson, published in 2015 by the USGS.)
· Q1,10 (upstream of facility): 84 cfs (54 mgd) · Q90,10 (upstream of facility): 206 cfs (133 mgd) (the determination of this value is
documented in the January 20, 2016 WLA report) · Harmonic Mean Flow (upstream of facility): 384 cfs (248 mgd) · Nearby Dischargers: There are several dischargers to tributaries of Portage-Burns
Waterway upstream of this facility. The Chesterton WWTP (IN0022578), Praxair (IN0043435) and ArcelorMittal Burns Harbor (IN0000175) discharge to East Branch Little Calumet River. The Valparaiso WWTP (IN0024660) and South Haven WWTP
−4−
(IN0030651) discharge to Salt Creek and several sanitary WWTPs discharge to tributaries of Salt Creek. The Portage WWTP (IN0024368) discharges to Burns Ditch. Only ArcelorMittal, Valparaiso and Portage currently have monitoring data available for metals. All these dischargers contribute to the background concentrations upstream of U.S. Steel - Midwest. However, only the ArcelorMittal and Portage discharges were specifically considered in the WLA analysis because of the availability of data and their close proximity to U.S. Steel - Midwest.
Calculation of Preliminary Effluent Limitations The representative background concentration of a pollutant for use in developing wasteload allocations is determined in accordance with 327 IAC 5-2-11.4(a)(8). According to this provision, best professional judgment is to be used to select the one data set that most accurately reflects or estimates background concentrations when data in more than one of the following data sets exist: (A) Acceptable available water column data.
(B) Water column concentrations estimated through use of acceptable available caged or resident fish tissue data.
(C) Water column concentrations estimated through use of acceptable available or projected pollutant loading data.
The background concentration is calculated as the geometric mean of the selected data set. In the case of U.S. Steel - Midwest, instream data are available from fixed water quality monitoring station BD 1 Burns Ditch at Portage. This station is located at the U.S. Highway 12 Bridge upstream of Outfall 002. Water quality data from fixed station BD 1 were obtained for the period August 2015 through July 2020. Instream data for all of the pollutants of concern are not available from fixed station BD 1 so data were obtained from nearby waterbodies. The Surveys Section conducted quarterly trace metals sampling in Deep River downstream of the Lake George Dam during the period from 2002 through 2006. The data from the trace metals sampling were used for several pollutants that are not monitored at the fixed station and for cadmium and silver which were reported as non-detect at the fixed station. Water quality data were obtained from the Surveys Section database. The time periods chosen for the different data sets are based on the availability of data and the desire to have data for whole years. Fixed station data were limited to the last five years. Based on 327 IAC 5-2-11.4(b)(1), a mixing zone is not allowed for BCCs, so stream data were not required for mercury. The background concentration of each pollutant based on instream data was determined by calculating the geometric mean of the instream data for the pollutant (327 IAC 5-2-11.4(a)(8)). In 327 IAC 5-2-11.4(a)(8) a procedure is included for calculating background concentrations when the data set includes values below the limit of detection. The fixed station data are actually reported as less than the limit of
−5−
quantitation (LOQ). Therefore, a procedure based on best professional judgment was used for the fixed station data. The values below the LOQ were set equal to one-half the LOQ and then the geometric mean of the data set was calculated. The determination of background concentrations based on instream data is included in Attachments 2 through 5. Pollutant loading data for some pollutants of concern are available for the Portage WWTP and pollutant loading data for most of the pollutants of concern in this WLA analysis are available for ArcelorMittal Burns Harbor. However, considering the multiple sources of flow upstream of U.S. Steel - Midwest and the distance between the dischargers, it was decided that the instream data would more accurately reflect the background concentrations. However, the effluent concentrations available for ArcelorMittal and Portage were compared to the background concentrations calculated using the instream data to determine if the background concentration of any pollutant may potentially be underestimated, and if so, whether the potentially higher background concentration would significantly impact the calculation of WQBELs. After reviewing the data for ArcelorMittal and Portage, the background concentrations calculated using the instream data were considered to be acceptable to calculate WQBELs. The facility provided one background sample for chromium (VI) with a concentration of 0.0718 ug/l as part of their 2020 permit renewal application. After consideration of the trace metals sampling results for chromium (VI), the background concentration was set equal to 0.072 ug/l based on the application data. The background concentration of free cyanide was set equal to zero after consideration of the sampling results for total cyanide at the fixed station and the trace metals sampling results for free cyanide. There are no known upstream sources of formaldehyde, and for naphthalene and tetrachloroethylene, effluent data for ArcelorMittal Burns Harbor, the only known potential source upstream, have shown nondetectable concentrations. Therefore, the background concentrations of these organic chemicals were set equal to zero. According to 5-2-11.4(a)(13), the 50th percentile downstream hardness is to be used to determine the criteria for those metals whose criteria are dependent on hardness. There is no downstream fixed station, so hardness data were obtained from fixed station BD 1. The 50th percentile hardness calculated using the last five years of data is 265 mg/l. The data are included in Attachment 6. In addition to the aquatic life, human health and wildlife criteria that apply to all waters within the Great Lakes system, there are criteria in 327 IAC 2-1.5-8(j) that apply specifically to Lake Michigan. For the pollutants of concern, there is a Lake Michigan criterion for fluoride. The criterion for fluoride is more stringent than the aquatic life criteria that apply to Portage-Burns Waterway. In accordance with 327 IAC 5-2-11.4(a)(3), TMDLs, WLAs calculated in the absence of a TMDL, and preliminary WLAs
−6−
must ensure attainment of applicable water quality standards including all numeric and narrative water quality criteria set forth in 327 IAC 2-1.5-8 and 327 IAC 2-1.5-16, and Tier I criteria and Tier II values established under 327 IAC 2-1.5-11 through 327 IAC 2-1.5-16. Therefore, to ensure that the concentration of fluoride in Portage-Burns Waterway meets the Lake Michigan criterion for this pollutant at the confluence of Portage-Burns Waterway with Lake Michigan, preliminary effluent limitations (PELs) were calculated using the Lake Michigan criterion and 100% dilution of effluent and receiving stream flow. These PELs were compared to the PELs based on the discharge meeting aquatic life, human health and wildlife criteria in Portage-Burns Waterway and the more stringent PELs were used as the applicable PELs. The coefficient of variation used to calculate monthly average and daily maximum PELs was set equal to the default value of 0.6. The number of samples per month used to calculate monthly average PELs was based on the expected monitoring frequency. For cadmium, lead, nickel, silver, fluoride, free cyanide, formaldehyde, naphthalene and tetrachloroethylene, the number of samples per month was set equal to 2. For the other pollutants, the number of samples per month was set equal to 4. The spreadsheet used to calculate PELs is included in Attachment 7. The applicable PELs for fluoride are based on the Lake Michigan criterion.
−7−
Reasonable Potential Analysis for WET U.S. EPA disapproved the reasonable potential procedure for whole effluent toxicity at 327 IAC 5-2-11.5(c)(1). In place of 5-2-11.5(c)(1), IDEM is required to apply Paragraphs C.1 and D of Procedure 6 in Appendix F of 40 CFR Part 132. The following analysis is based on Paragraphs C.1 and D of Procedure 6 in Appendix F of 40 CFR Part 132. Effluent Data The permit renewal effective April 1, 2016 required the U.S. Steel - Midwest Plant to conduct whole effluent toxicity (WET) testing quarterly using Ceriodaphnia dubia and fathead minnow. As allowed under the permit, monitoring for fathead minnow was discontinued after three tests. WET data from May 2017 to September 2020 are included in Attachment 8. The first three tests were conducted to demonstrate successful completion of a toxicity reduction evaluation (TRE). Chronic toxicity was calculated using the NOEC and IC25 values. Reasonable Potential Analysis for Acute WET The WET of an effluent is or may be discharged at a level that will cause, have the reasonable potential to cause, or contribute to an excursion above the numeric interpretation of the narrative criterion for acute WET at 2-1.5-8(b)(1)(E)(ii) when effluent specific WET data demonstrates that: (TUa effluent) x (B) x (effluent flow)/(Qad + effluent flow) > AC where, TUa effluent = maximum acute WET result B = multiplying factor from 5-2-11.5(h) effluent flow = effluent flow used to calculate WQBELs for individual pollutants Qad = amount of receiving water available for dilution AC = numeric interpretation of the narrative criterion for acute WET For U.S. Steel - Midwest, the following apply: TUa effluent = 6.2 TUa (Ceriodaphnia dubia) B = 1.6 (based on 18 samples and a CV of 0.9) effluent flow = 17 mgd Qad = 0.0 mgd (an alternate mixing zone has not been approved for acute WET) AC = 1.0 TUa (the applicable numeric interpretation of the narrative criterion for acute WET for the case where an alternate mixing zone for acute WET has not been approved) (6.2 TUa) x (1.6) x (17 mgd)/(0.0 mgd+17 mgd) = 9.9 TUa The calculated value is greater than 1.0 TUa, so there is reasonable potential for acute WET.
−8−
Reasonable Potential Analysis for Chronic WET The WET of an effluent is or may be discharged at a level that will cause, have the reasonable potential to cause, or contribute to an excursion above the numeric interpretation of the narrative criterion for chronic WET at 2-1.5-8(b)(2)(A)(iv) when effluent specific WET data demonstrates that: (TUc effluent) x (B) x (effluent flow)/(Qad + effluent flow) > CC where, TUc effluent = maximum chronic WET result B = multiplying factor from 5-2-11.5(h) effluent flow = effluent flow used to calculate WQBELs for individual pollutants Qad = amount of receiving water available for dilution CC = numeric interpretation of the narrative criterion for chronic WET For U.S. Steel – Midwest, the following apply: TUc effluent = >15.2 TUc (Ceriodaphnia dubia) B = 2.0 (based on 18 samples and a CV of 1.5) effluent flow = 17 mgd Qad = 16.25 mgd (25% of the Q7,10 (65 mgd)) CC = 1.0 TUc (>15.2 TUc) x (2.0) x (17 mgd)/(16.25 mgd + 17 mgd) = >15.5 TUc Since the calculated value is greater than 1.0 TUc, there is reasonable potential for chronic WET. Reasonable Potential Analysis for Individual Pollutants Calculation of Projected Effluent Quality A reasonable potential analysis was conducted for free cyanide which is currently limited at Outfall 004. The current limit was established in the 2011 permit renewal based on a reasonable potential analysis conducted with a limited dataset. A reasonable potential analysis was conducted for which is currently monitored at Outfall 004. A reasonable potential analysis was also conducted for formaldehyde based on data reported on Form 2C of the 2020 permit renewal application. A reasonable potential analysis for hexavalent chromium, total chromium, zinc, fluoride, total cyanide, naphthalene and tetrachloroethylene, which are limited at internal Outfall 304, but not monitored at Outfall 004, was not conducted based on a review of Outfall 004 data provided with the permit renewal application and internal Outfall 304 data for these pollutants. The effluent data used in the reasonable potential analysis were provided by the facility in electronic format and obtained from monthly monitoring reports. Data for the period April 2016
−9−
through October 2020 were used in the analysis for mercury. Data for free cyanide from April 2016 through December 2020 were used. Due to the large number of samples, the data for mercury and free cyanide are not included in this report. The facility provided the following data for formaldehyde which were summarized on the Form 2C for Outfall 004: 2.2 mg/l (5-27-2020), <0.05 mg/l (7-27-2020), 0.102 mg/l (8-17-2020) and 0.123 mg/l (8-31-2020). The facility also provided the following data for formaldehyde on the Form 2C for internal Outfall 204: 4.3 mg/l (5-27-2020), 0.075 mg/l (7-27-2020), 0.413 mg/l (8-17-2020) and 0.545 mg/l (8-31-2020). Samples for formaldehyde collected at internal Outfall 104 on the same days as those for Outfall 004 and internal Outfall 204 in May and July 2020 were reported as non-detect. The effluent data include values reported as less than (<) the LOD. These values were assigned the reported less than value. Monthly averages were calculated for mercury and free cyanide for those months where at least two data points were available. Comparison of PEQs to PELs The reasonable potential analysis is included in Attachment 9. The results show that a projected effluent quality (PEQ) does not exceed a PEL for free cyanide, but it does for mercury and formaldehyde. Therefore, based on the reasonable potential statistical procedure, water quality-based effluent limitations (WQBELs) are not required for free cyanide, but they are required for mercury and formaldehyde. Calculation of Water Quality-based Effluent Limitations The PELs for mercury and formaldehyde in Attachment 7 are based on water quality criteria or values and may be included in an NPDES permit as WQBELs. For each pollutant receiving technology-based effluent limitations (TBELs) and for which water quality criteria or values exist or can be developed, concentration and corresponding mass-based WQBELs were calculated. For U.S. Steel – Midwest the pollutants receiving TBELs for which WQBELs can be calculated are cadmium, hexavalent chromium, total chromium, copper, lead, nickel, silver, zinc, total cyanide, fluoride, naphthalene and tetrachloroethylene. For these pollutants, the PELs in Attachment 7 are based on water quality criteria or values and may be applied as WQBELs. The mass-based WQBELs for Outfall 004 will be compared to the mass-based TBELs at internal Outfall 304. Since the facility is authorized to discharge up to the mass-based TBELs, if the mass-based TBELs exceed the mass-based WQBELs, the pollutant may be discharged at a level that will cause an excursion above a numeric water quality criterion or value under 2-1.5 and WQBELs are required for the pollutant at the final outfall. List of Attachments Attachment 1: Map of Outfall Location Attachments 2 thru 5: Calculation of Background Concentrations Attachment 6: Calculation of Water Quality Characteristics Attachment 7: Calculation of Preliminary Effluent Limitations Attachment 8: Whole Effluent Toxicity Data Attachment 9: Reasonable Potential to Exceed Analysis for Individual Pollutants