+ All Categories
Home > Documents > U.S. Uranium and Nuclear Power Outlook: 2008 -...

U.S. Uranium and Nuclear Power Outlook: 2008 -...

Date post: 28-May-2018
Category:
Upload: vantuong
View: 214 times
Download: 0 times
Share this document with a friend
46
U.S. Uranium and Nuclear Power Outlook: 2008 - 2030 Presented to: National Research Council of the National Academies Presented by: Tom Pool Chairman, International Nuclear November 18, 2008
Transcript

U.S. Uranium and Nuclear Power Outlook: 2008 - 2030

Presented to:National Research Council of the National Academies

Presented by: Tom Pool

Chairman, International Nuclear

November 18, 2008

U.S. Electricity Generation 2006

Coal49%

Petroleum2%

Natural Gas20%

Nuclear20%

Hydro7%

Renewables2%

Nuclear power is important in the US

U.S. Nuclear Power Generation

0

200

400

600

800

1000

1960 1965 1970 1975 1980 1985 1990 1995 2000 2005

Bill

ion

kWhr

s

Deregulation gave nuclear power a profit motive.

Nuclear Power – Impetus for Growth

• Global Warming – Minimal Carbon Emissions

• Acid Rain – Minimal SO2 Emissions

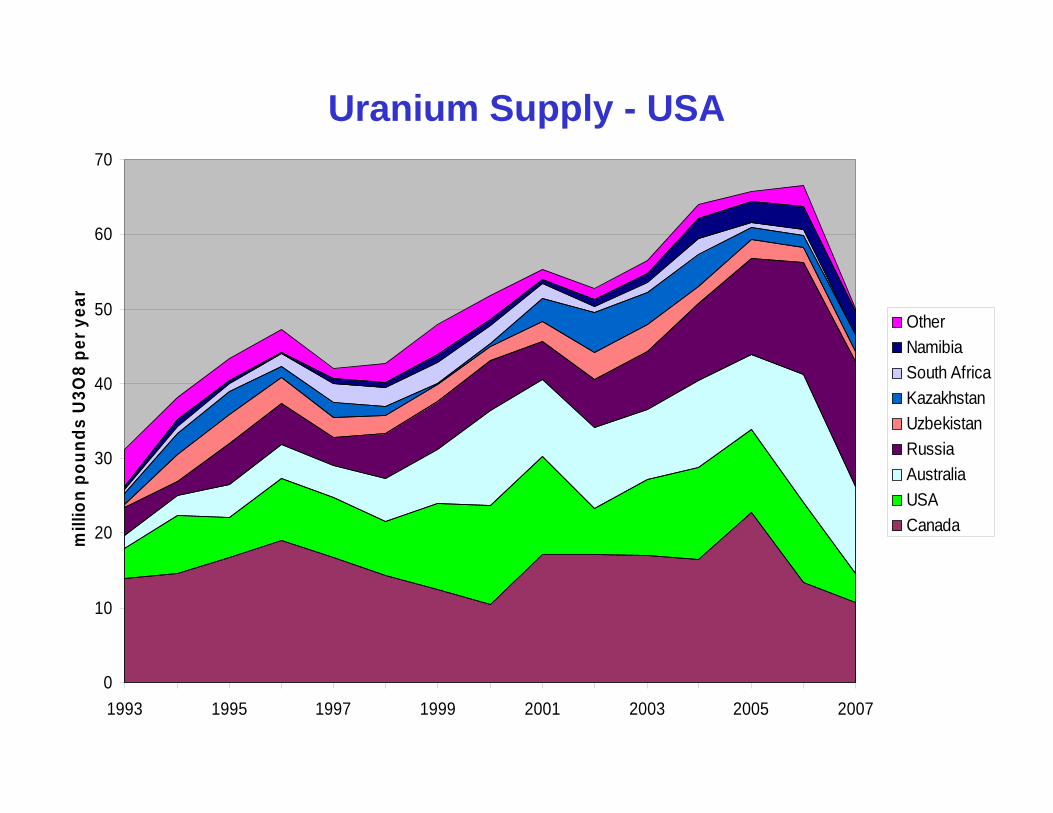
• Energy Independence – US Fuel Aplenty

• Technology is here now

• Low Operating Costs

• Stellar Safety Record

• Minimal Environmental Footprint

Electricity Production Costs(Operation, Maintence & Fuel)

0

2

4

6

8

10

12

1995 1997 1999 2001 2003 2005 2007

cent

s pe

r ki

low

att-

hour

CoalGasNuclearPetroleum

Nuclear Power – Constraints on Growth

• High Capital Cost, Particularly in the Current World Financial Crisis

Nuclear Power – Means of Growth

• Capacity Factor

• License Extensions

• Uprates

• New Units

40%

50%

60%

70%

80%

90%

100%

1971 1976 1981 1986 1991 1996 2001 2006

Capacity Factor - U.S. Nuclear Reactors

US Reactor License Extensions(20 years)

• Renewed – 49

• Filed for Renewal – 17

• Expected to File – 33

• Thus, 99 out of 104 existing licenses are expected to be renewed.

• ~2000 reactor years, ~2,000,000 mW years

p

0

200

400

600

800

1,000

1,200

1977 1982 1987 1992 1997 2002 2007

meg

awat

ts p

er y

ear

U.S. Nuclear Reactor Uprates

0

1,000

2,000

3,000

4,000

5,000

6,000

1977 1982 1987 1992 1997 2002 2007

meg

awat

ts

Cumulative U.S. Reactor Uprates

New Reactor Outlook

• 3 Early Site Permit Applications (ESP) Approved by NRC

• 2 Additional ESP Applications Under Review by NRC

• 24 Combined Construction and Operating License Applications (CCOL) Submitted to NRC

• 6 Additional CCOL Applications Expected

80,000

90,000

100,000

110,000

120,000

2005 2010 2015 2020

MW

e ne

t

LowReferenceHigh

Nuclear Generating Capacity – U.S.A.(WNA 2007)

100

110

120

130

140

150

160

170

180

190

200

2000 2005 2010 2015 2020

mill

ion

poun

ds U

3O8

per y

ear

20012000

2001 = Bush/Cheney2000 = Clinton/Gore

World Uranium Requirements Forecasts(US Energy Information Administration)

Worker Safety at U.S. Nuclear Power Plants vs. U.S. Occupational Injury Rate

0

2

4

6

8

10

1980 1985 1990 1995 2000 2005

Inju

ries

per

200

,000

hou

rs

Nuclear U.S. Average

An intense safety culture exists at nuclear power plants

0

2

4

6

8

10

12

14

16

18

20

Coal Uranium Oil & Gas

Fata

litie

s pe

r Ter

awat

t-Hou

r

U.S. Energy Production Fatalities(1992-2006)

Radiation Safety

• Linear-No-Threshold– Any additional radiation causes more

cancers

• Hormesis– Low level radiation stimulates natural

protection systems

0

10

20

30

40

50

60

70

1947 1957 1967 1977 1987 1997 2007

mill

ion

poun

ds U

3O8

per y

ear

Consumption Production

U.S. Uranium Balance

0

10

20

30

40

50

60

70

1993 1995 1997 1999 2001 2003 2005 2007

mill

ion

poun

ds U

3O8

per y

ear

OtherNamibiaSouth AfricaKazakhstanUzbekistanRussiaAustraliaUSACanada

Uranium Supply - USA

0 200 400 600 800 1,000 1,200 1,400 1,600 1,800 2,000

Australia

Kazakhstan

USA

Canada

South Africa

Niger

Namibia

Russia

Brazil

Ukraine

Uzbekistan

India

China

Mongolia

million pounds U3O8

<$15/lb U3O8 <$30/lb U3O8 <$50/lb U3O8

Uranium Resource by Country – 2007IAEA Reasonably Assured Resources

0 50 100 150 200 250 300 350 400 450 500

New Mexico

Wyoming

Arizona, Colorado, Utah

Texas

Nebraska, S. Dakota, Other

million pounds U3O8

<$30/lb <$50/lb

U.S. Uranium Reserves

0 500 1,000 1,500 2,000 2,500 3,000

Colorado Plateau

Wyoming Basins

Texas Coastal Plain

Northern Rockies

Central & Southern Rockies

Basin & Range

Other Regions

million pounds U3O8

US Uranium – Estimated Additional Resources by Region(USEIA – 2002)

Phosphates

• The US has huge resources of uraniferousphosphates in the southeastern US and in the northern Rockies: >40 billion pounds U3O8

• Uranium in these phosphates is recoverable at moderate to high cost.– Research is underway under private auspices to

reduce costs.

• Uranium in these phosphates currently goes into fertilizer products and onto the fields.

US Uranium Resources - Credibility

• Responsibility of US Energy Information Administration

• Last Major Update Was 1984

• Subsequent Updates Made By Subtraction and Inflation Adjustments

• Necessary and Important for Long-Term Policy Decisions

US Uranium Resources:Socio – Political Lock-Up

• Virginia – Moratorium (de facto) on Uranium Mining

• Montana – Moratorium (de facto) on Uranium Milling

• New Mexico – Large-Scale Navajo Cultural Issues

• Arizona – Grand Canyon Issues

Uranium - US Secondary Supply• Inventories ~ 160 M lbs U3O8

– US DOE ~ 50 M lbs U3O8– Suppliers ~ 30 M lbs U3O8

• Producers• Traders

– Utilities ~ 80 M lbs U3O8

• Enrichment Tails/Depleted Uranium ~ 400 M lbs U3O8(Potential @ $50 - $100/lb U3O8)

• US Nuclear Weapons ~ 200 M lbs U3O8

0

50

100

150

200

250

300

350

400

1982 1986 1990 1994 1998 2002 2006

mill

ion

poun

ds U

3O8

Utilities Suppliers U.S. Government

U.S. Uranium Inventories

Uranium from Nuclear Warheads (Highly Enriched Uranium)

13,795 Russian nuclear warheads dismantled and blended into nuclear fuel to date. Total of 20,000 scheduled by 2013.

$0

$20

$40

$60

$80

$100

$120

$140

$160

1945 1955 1965 1975 1985 1995 2005

US

$ pe

r pou

nd U

3O8

Nominal $ Constant 2008 $

Historical Uranium Prices

$0

$25

$50

$75

$100

$125

$150

Jan-03 Jan-04 Jan-05 Jan-06 Jan-07 Jan-08 Jan-09

week ending

US$

per

pou

nd U

3O8

Recent Uranium Spot Market Prices

Uranium Recovery Methods 1• Conventional Mining

– Surface– Underground

• Conventional Milling– Acid – Alkaline

• In Situ Recovery– Acid – Alkaline

Uranium Recovery Methods 2

• By Product– Copper (Australia)– Gold (South Africa)– Process Waste (USA)– Phosphoric Acid (USA Historical)

• Potential Methods– Hydraulic Borehole Mining– Engineered Percolation Recovery (Heap

Leaching)

0

5

10

15

20

25

30

35

40

45

50

1945 1950 1955 1960 1965 1970 1975 1980 1985 1990 1995 2000 2005 2010 2015 2020 2025 2030

mill

ion

poun

ds U

3O8

per y

ear

by-product conventional in situ recovery

US Uranium Production by Method

Highland Open Pit Mine, Wyoming

Uranium Mill - Colorado

Smith Ranch, WyomingIn Situ Recovery Uranium Mine

Regulatory Progress• NRC Early Site Permits

• NRC “Standard” Reactor Design Acceptance

• NRC Combined Construction and Operating License

• NRC Draft Generic Environmental Impact Statement for In Situ Recovery

Regulatory Issues• NRC Backlog and Timelines

• EPA – “Nothing is below regulatory concern to the EPA”

• Overlapping Regulatory Jurisdictions– Federal, State, County– “Indian Country”, New Mexico

• Interveners Ad Infinitum, Ad Nauseum– Too much opportunity to delay/derail a

reasonable process

Regulatory Issues

• Restoration to “Class of Use” for in situ recovery projects

• Consideration of “natural attenuation” for in situ recovery projects

• Reconsideration of the concept that in situ recovery constitutes “milling underground”

Opposition

Most Opposition to Nuclear Power and Uranium Can Be Characterized as:

– Lack of Understanding (Fear of the Unknown)• Connection With Nuclear Weapons• Chernobyl & Three Mile Island

– Prejudice– Mysticism– Political Positioning– Over Reaction– Media Sensationalism– Mistrust of Government Regulators

Rebuttal to Opposition

• Stakeholder Identification

• Stakeholder Engagement

• Stakeholder Education

• Transparency

• Regulatory Perfection

US Uranium & Nuclear Key Elements• Modest growth in US nuclear power

– Capital cost is major constraint

• Large US uranium resources– Mainly moderate to high cost

• Production increasingly focused on in situ recovery – Lower cost & lower environment impact

• Overlapping regulatory regimes– Federal, State, County

US Uranium & Nuclear Key Elements

• Interveners ad infinitum, ad nauseum

• Health & Safety– Exemplary!!!– Hormesis vs. Linear-No-Threshold

• Politics – Outlook is poor

• Sustainability – Fuel for >100 years

• Personnel – Behind the curve


Recommended