38
BG Duke DeLuca Commander, Mississippi Valley Division President-designee, Mississippi River Commission January, 2014 USACE Perspective on Mississippi River Sediment Diversions

BG Duke DeLuca Commander, Mississippi Valley Division President-designee, Mississippi River Commission
January, 2014
USACE Perspective on Mississippi River Sediment Diversions

BUILDING STRONG®
Presentation Outline
The Value of the Mississippi River to the United States
The Causes of Wetland Loss in Louisiana How Well Will Sediment Diversions Work? Can We Quantify and Mitigate for the
Unintended Consequences of Diversions? How Should a Full Array of Alternatives Best
Be Applied?
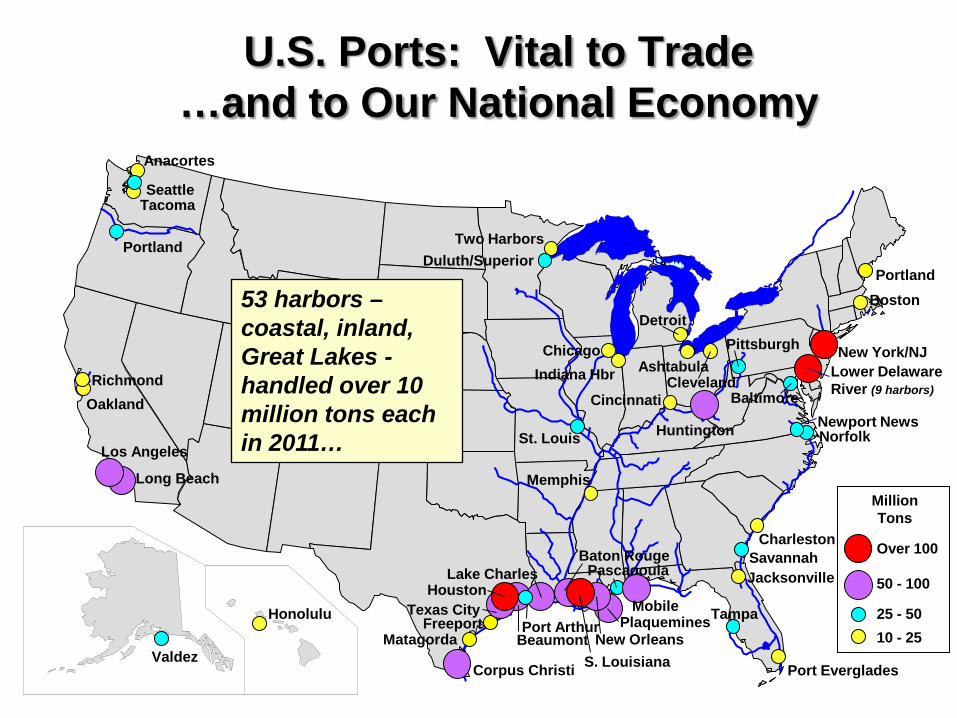
U.S. Ports: Vital to Trade …and to Our National Economy
Million Tons
Over 100
50 - 100
25 - 50 10 - 25
Houston
Corpus Christi S. Louisiana New Orleans
Baton Rouge
Texas City
Lake Charles
Plaquemines Tampa
New York/NJ
Valdez
Long Beach
Beaumont
Norfolk
Lower Delaware River (9 harbors)
Duluth/Superior
Los Angeles
Port Arthur
St. Louis
Portland
Seattle
Freeport
Huntington
Richmond Oakland
Tacoma
Boston
Newport News
Port Everglades
Jacksonville
Memphis
Detroit
Cleveland
Savannah Charleston
Indiana Hbr
Cincinnati
Portland
Two Harbors
Anacortes
Honolulu
Chicago Pittsburgh
Baltimore
Pascagoula
53 harbors – coastal, inland, Great Lakes - handled over 10 million tons each in 2011…
Ashtabula
Mobile
Matagorda

BUILDING STRONG®
2011
1927
1927 Flood = 16.8 million acres
2011 Flood = 6.4 million acres
$14 billion Investment since 1928
$234 billion damages prevented (2011) 84% of the damages prevented were in Louisiana
$612 billion since 1928
44 to 1 return on investment
Over 4 million people protected
$3 billion annual transportation rate savings
Untold economic productivity enabled: Farms, towns, factories
1927 vs. 2011 Mississippi River Record Flood: From “Levees Only” to “Room for the River”

BUILDING STRONG®
USFWS: “Louisiana is the most productive fishery in North America” 25% of continental US commercial
fisheries More than 1 billion pounds caught
annually with a dockside value $291 million
Recreation value $900 million to $1.2 billion
Louisiana has 40% of the coastal marshlands in the continental United States which support:
Five million waterfowl 25 million songbirds 70 rare, threatened or endangered species
Value to the Nation Coastal Louisiana Fisheries and Wetland
Values

BUILDING STRONG®
Causes of Land Loss in Coastal Louisiana
7

BUILDING STRONG®
Major Causes of Wetland Loss
Subsidence Sea Level Rise
Sediment Reduction
Levee System
Oil & Gas Development
Herbivory
Canals
Saltwater Intrusion
Storms Barrier Island Degradation
Cypress Harvesting
"Land Area Change in Coastal Louisiana from 1932 to 2010" USGS, 2011.

MISSISSIPPI RIVER INFLUENCE OUTSIDE OF MISS RIVER INFLUENCE
• Atchafalaya: 16 mi2 • Barataria: - 456 mi2 • Breton Sound: -174 mi2 • Miss. Delta: -124 mi2 • Pontchartrain: -194 mi2 TOTAL: - 932 mi2
• Calcasieu-Sabine: - 214 mi2 • Mermentau: - 154 mi2 • Teche-Vermillion: - 77 mi2 • Terrebone: - 506 mi2 TOTAL: - 951 mi2
Land Loss in Coastal Louisiana by Basin, 1932 – 2010
Couvillion, B.R., Barras, J.A., Steyer, G.D., Sleavin, W., Fischer, M., Beck, H., Trahan, N., Griffin, B., and Heckman, D. 2011. Land area change in coastal Louisiana from 1932 to 2010: U.S. Geological Survey Scientific Investigations Map 3164, scale 1:265,000, 12 p. pamphlet. 9

Oil and Gas Extraction • Impacts:
• 8,000 – 10,000 miles of canals • Salt water intrusion • Hydrologic alteration • Subsidence due to fluid withdrawal •Recent article puts value of oil and gas mediated losses are as high as 36%
Oil and Gas Exploration: • First Coastal Oil Well 1901 • First Offshore Well 1934 • By 1950’s, 92 Offshore Platforms to Depths of 100 Feet • End of 1960’s, 500 Platforms to Depths up to 350 feet • End of 1970’s, over 12,500 Offshore Rigs Producing Hydrocarbons (Louisiana DNR, http://dnr.louisiana.govassets/TAD/education/BGBB/6/la_oil.html)
1947. First bottom supported platform in 18 feet of water, 12 miles offshore.
Since 1901, Louisiana has had about 1,165,000 producing wells drilled.
http://thes.wordpress.com/2010/06/10/gulf-of-mexico-oil-rigs/ from MMS data.
Canal construction near Golden Meadow, Louisiana.
Turner, R.E. 1997. Wetland loss in the Northern Gulf of Mexico: Multiple Working Hypotheses. Estuarine Research Federation, Vol.20, No. 1, p.1-13 . 10

Wetland Loss Due to Hurricane Damage
•Direct impacts of selected storms: • Audrey (Max. Wind 100 mph)
•Beach Erosion: 200-300 ft • Increased Water Area: Not Measured
•Hilda (Max. Wind 134) •Beach Erosion: Not Measured • Increased Water Area: Not Measured
• Andrew (Max. Wind 121) •Beach Erosion: 200-330 ft • Increased Water Area: Not Measured
• Katrina (Max. Wind 125) •Beach Erosion: 180 ft • Increased Water Area: 89 mi2
• Rita (Max. Wind 125) •Beach Erosion: 130-260 ft • Increased Water Area: 114 mi2
• Gustav (Max. Wind 106) •Beach Erosion: 150-525 ft • Increased Water Area: 48 mi2
• Ike (Max. Wind 87) •Beach Erosion: 30-150 ft • Increased Water Area: 77 mi2
• Indirect impacts: • Salt water intrusion
•Impact unknown
•Summary: •Open water area has increased by 328 mi2 just from the four measured storms that have occurred since 2005 • USGS estimates that 25% to 35% of wetland loss since the 1940’s is due to direct and indirect storm-induced losses.
Morton, R.A. and J.A. Barras. 2011. Hurricane Impacts on Coastal Wetlands: A Half-Century Record of Storm-Generated Features from Southern Louisiana. Journal of Coastal Research, Vol. 27, pp 27-43.
Hurricane tracks that modified the southern Louisiana coastal wetlands between 1957 and 2008. Source: NOAA 2010 .
Breton Sound damage after Hurricane Katrina (2005).
Boudreaux Lake (A) Before and (B) After Hurricane Audrey 1957.
Remnants of march vegetation stripped to the sediment surface by Hurricane Rita (2005).
12

-2.0
-1.5
-1.0
-0.5
0.0
0.5
1.5
1.0
1900 1920 1940 1960 1980 2000
Feet
Pensacola, FL (0.08 inches/year)
Mean sea level trend is 0.08 ± 0.01 inches/year or 0.69 feet in 100 years.
Sea-Level Rise global rise = 0.07 inches/year
2.0
-2.5
-2.0
-1.5
-1.0
-0.5
0.0
0.5
1.0
-3.0
Feet
1900 1920 1940 1960 1980 2000
Grand Isle, LA (0.4 inches/year)
Relative Sea-Level Rise
global rise + local sinking
The mean sea level trend is 0.4 inches/year or 3.0 feet in 100 years.
High subsidence rate + sea-level rise makes wetlands more vulnerable to submergence and erosion.
NOTE: Grand Isle is an official NOAA gage with records back to the 1950’s. Other gages in the Mississippi River Delta show much higher rates of RSLR, up to 1.0 inches per year.
13

BUILDING STRONG®
Additional Estimates of Subsidence Rates
Shinkle & Dokka (2004). NOAA Technical Report – 50 Rates over 24mm (1 inch) per year.
LA State Master Plan, 2012. Maximum rates in the Bird’s Foot between 15-35 mm per year.
15

BUILDING STRONG®
How Well Will Sediment Diversions Work?
(What Have We Learned in the Last Few Years?)

BUILDING STRONG®
Water and Sediment Budgets
17
Allison, et. al. 2012. A water and sediment budget for the lower Mississippi-Atchafalaya River in flood years 2008-2010: J. of Hydrology.
About 50% of the water and suspended sediment of the Mississippi River is diverted from the river between Baton Rouge and Head of Passes – it is not all being “lost off of
the continental shelf.”

BUILDING STRONG® 18
Reach Assessment 1970s to 2000s
Tarbert ‘s Landing
Morganza St. Francisville
Baton Rouge
Donaldsonville
Algiers Lock Belle Chase
West Pointe La Hache
Aggradation Dynamic Equilibrium Degradation
Little, C. and Biedenharn, D. 2014. Mississippi River Hydrodynamic and Delta Management Study – Geomorphic Assessment. In press.

BUILDING STRONG®
Sustainability of Diversions
Dean, R. G., J.T. Wells, J. Fernando, P. Goodwin. 2012. River Diversions: Principles, Processes, Challenges and Opportunities A Guidance Document. LCA S&T Program.

BUILDING STRONG®
Atchafalaya Basin Land Building
Wax Lake Outlet has built about 1 km2 per (250 acres) year between 1983-2010, utilizing about 10% of the flow of the MS River. The overall land loss in Coastal Louisiana is about 10,600 acres per year over the same time period. Allen, et al., 2011. Using Multitemporal Remote Sensing Imagery and Inundation Measures to Improve Land Change Estimates in Coastal Wetlands. Estuaries and Coasts. DOI 10.1007/s12237-011-9437-z
20

BUILDING STRONG®
Fort St. Philips

BUILDING STRONG®

BUILDING STRONG®
Period of Analysis Years Land Area (initial) Land Area (ending) Area Change Area Change† Area Change‡
acres percentage
1956 to 1971 15 5,012 4,377 -635 -13% -13%
1971 to 1978 7 4,377 2,760 -1,617 -37% -32%
1978 to 1988 10 2,760 2,444 -316 -11% -6%
1988 to 1998 10 2,444 1,780 -664 -27% -13%
1998 to 2008 10 1,780 2,102 322 18% 6%
1956 to 2008 52 5,012 2,102 -2,910 -58% -58%
Table 3. Summary of Fort St. Philip study area acreages, and percentages of area change, for select time periods - from high resolution analyses. The color-ramp illustrates the type and magnitude of land change – the darkest red represents loss maxima and darkest green represent gain maxima.
† Land change percentage is based on initial land area of the period analysis. ‡ Land change percentage is based on the 1956 land area.
Suir , G. and Jones, W., Garber, A. and Barras. J. 2014. Pictorial Account and Landscape Evolution of the Crevasses near Fort Saint Philip, Louisiana. In press. MS River Geomorphology and Potamology Program.

BUILDING STRONG® 24 The fresh and brackish portions of the estuary experienced more than
25.7% failure versus 2-4% in the more saline regions. (Kulp, et.al., 2009.)

BUILDING STRONG® 25
“A general conclusion on the expected short-term and long-term responses of marsh belowground production to Freshwater Diversions in Louisiana could not be drawn from the available evidence.”
“With regard to Freshwater Diversions, data are particularly needed on how changes in water chemistry or plant community composition may influence plant production-decomposition processes and resultant effects on soil volume and elevation change.”

Energy Budget of a Sediment Diversion
HTOTAL
HST
HDC
HRB
The Energy Budget: HTOTAL = HDD + HST + HDC + HOF • HTOTAL = The total potential energy available to
transport water and sediment • HDD = The loss of potential energy in the river due to
the drawdown caused by the reduction in river flow • HST = The kinetic energy loss across the diversion
structure • HDC = The kinetic energy loss due to friction in the
diversion channel • HRB = the kinetic energy loss due to friction
(backwater effects) in the receiving basin
River Diversion Channel Receiving Basin
Diversion Structure
River Diversion Channel Receiving Basin
PLAN VIEW
SIDE VIEW HDD
Brown, G. 2014. White Ditch Study. Engineering Research and Development Center.
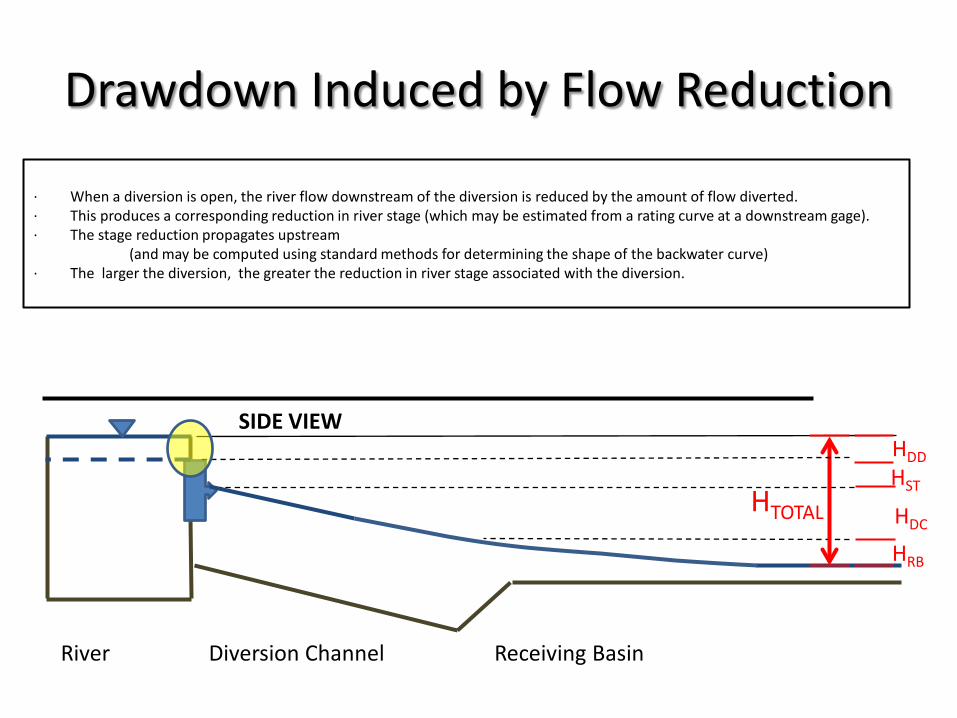
Drawdown Induced by Flow Reduction
HTOTAL
HST
HDC
HRB
River Diversion Channel Receiving Basin
SIDE VIEW HDD
· When a diversion is open, the river flow downstream of the diversion is reduced by the amount of flow diverted. · This produces a corresponding reduction in river stage (which may be estimated from a rating curve at a downstream gage). · The stage reduction propagates upstream (and may be computed using standard methods for determining the shape of the backwater curve) · The larger the diversion, the greater the reduction in river stage associated with the diversion.

Energy Loss at the Diversion Structure
HTOTAL
HST
HDC
HRB
River Diversion Channel Receiving Basin
SIDE VIEW HDD
• Energy losses at the diversion structure are typically
associated with drag, flow separation ,flow contraction, and flow expansion as water passes through the structure
• These losses can be minimized with design specifications that limit their magnitude and number.

Energy Loss in the Diversion Channel
HTOTAL
HST
HDC
HRB
River Diversion Channel Receiving Basin
SIDE VIEW HDD
• The diversion channel must be designed with sufficient “stream power” (essentially, velocity) to transport the
diverted sand. • Therefore, diversions with higher concentrations of sand require a higher velocity diversion channel than do
diversions with lower concentrations of sand. • This results in more energy loss, or a “steeper” water surface slope in the channel. • This results in a constraint. • For a given total available head (HTOTAL), a diversion carrying a higher sand concentration must be steeper and
shorter than a diversion carrying a lower sand concentration. Hence, a diversion with a higher sand concentration cannot transport sediment as far as a diversion with a lower sand concentration.

Energy Loss in the Channel Receiving Basin
HTOTAL
HST
HDC
HRB
River Diversion Channel Receiving Basin
SIDE VIEW HDD
• As water exits the diversion, it forms a jet of water into the receiving basin. • If the receiving basin is relatively shallow , this exiting water tends to pile up, forming a “dome” of water with a
maximum elevation at the channel outfall. • This “backwater” effect is more pronounced for larger discharges than it is for smaller discharges. • This results in a constraint • For a given total available head (HTOTAL), a diversion carrying a larger discharge will result in a larger backwater effect
in the receiving basin than a diversion carrying a smaller discharge. This means that there is less head available for use in transporting the sediment load for a diversion carrying a larger discharge than there is for a diversion carrying a smaller discharge.

Summary of Energy Budget Constraints on Diversion Design
Increasing stage over time due to sediment deposition
River Diversion Channel Receiving Basin
SIDE VIEW
• The application of basic hydraulic and geomorphic principles to a sediment diversion has shown that, for a given total available head, the
greater the sand load one diverts, the shorter the distance one can transport it. • As time progresses, deposition in the diversion outfall will become emergent land and begin to obstruct flow. This will induce an increase
in the water surface elevation at the downstream end, and an upstream extension of the of the zone of deposition. • When the water surface elevation increases to the point where the diversion can no longer pass the design flow, the diversion can no
longer be operated at full capacity. • If the diversion channel is too short to be truncated or redirected, and if there is no mechanical redistribution of the deposited sediment,
then the life-cycle of the diversion is effectively complete. • Hence, this results in the following general statement of the consequences of the energy constraint on sediment diversion design: • In the absence of any mechanical redistribution of the deposited sediment, the greater the sand load diverted, the
shorter the life-span of the diversion. • Note that this conclusion is essentially qualitative and simplified. To determine whether or not this principle has a measureable and
quantifiable impact on any specific diversion, it is necessary to do a more sophisticated analysis, including modeling. • Preliminary attempts at this type of analysis have indicated that the energy budget is likely to be a significant and measureable
constraint on diversion design.
Shading = zone of deposition

Preliminary Outfall Channel Analysis


BUILDING STRONG®
Can We Quantify and Mitigate for the Unintended
Consequences of Diversions?

BUILDING STRONG®
ACCCUMULATED DEPOSITION 2020 - 2079
35 Thomas, M. T.and Trawle, M. 2014. One-Dimensional Modeling of the lower Mississippi River. In press.

BUILDING STRONG®
Alternative 18 allows for the “free flow” of Davis Pond, subject to river head, and assumes a 15,000 cfs diversion at Myrtle Grove
36

BUILDING STRONG®
Should a Full Array of Alternatives be Applied?

BUILDING STRONG®
Diversion Science Issues
Need to be addressed by existing federal projects, environmental documentation for permits or certifications, or other means. Includes, but not limited to: ► Land building estimation and sustainability
► Inadequacy of field data collection for salinity and temperature
► Ecological Effects to Oysters, Brown Shrimp, Sea Trout, etc.
► Ecological Effects of Nutrient-rich freshwater on salt and brackish marshes
► Extent of increase of water elevation on communities and back levees
► Geotechnical considerations
► The ability of the sediment to “disperse” into the Delta, or the cost of O&M to redistribute the material
► The sustainability of the diversion – when will head differences render the diversion unusable
38

BUILDING STRONG®
August 23, 2012 ADCP
175,000 cfs
CTD/turbidity/LISST casts
Myrtle Grove Vicinity
Figure from Mead Allison, 2013
BUILDING STRONG®
17
Res
ourc
e U
nits
Time Time
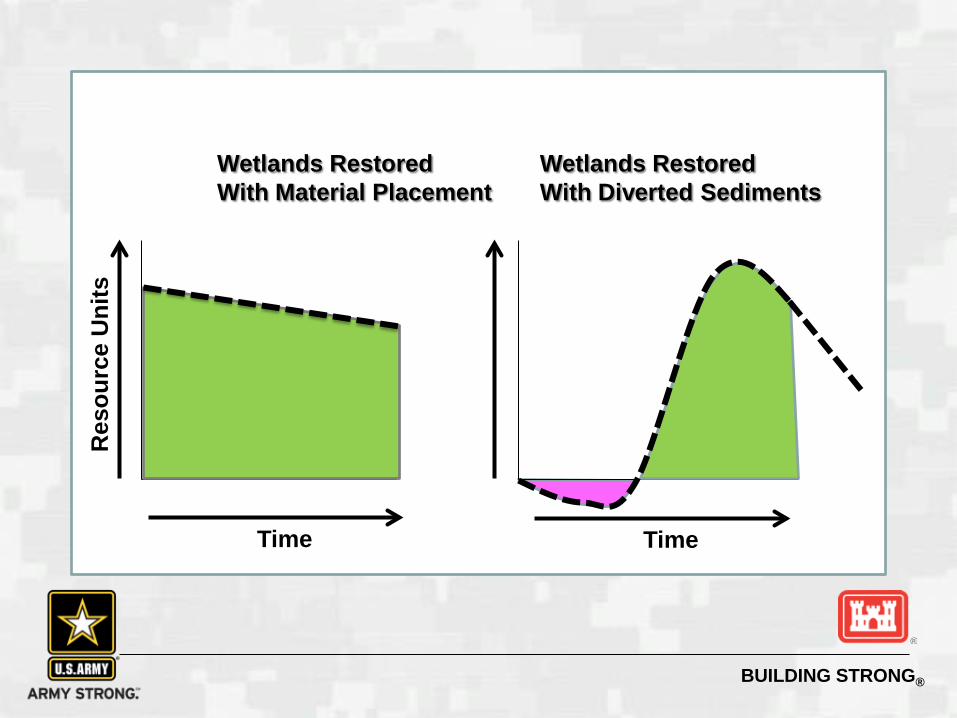
Wetlands Restored With Material Placement
Wetlands Restored With Diverted Sediments

BUILDING STRONG®
Summary: LMR Diversion Principles
Consider All Coastal Loss Mechanisms
Balance Competing Uses of the River and River Resources
Apply Sound Science
Reasonable Use of River Resources
Evaluate State’s Diversion Portfolio as a System
Utilize Controlled Diversions
Employ Diversion Adaptive Management
Consider Mississippi River Commission Recommendations
41


