72
2014 Usage of Iodized Salt in Processed Food in Indonesia

2014
Usage of Iodized Salt in Processed Food
in Indonesia

Usage of Iodized Salt in Processed Food in Indonesia
2
TABLE OF CONTENT
Table of Content ............................................................................................................... 2
Abbreviations ................................................................................................................... 3
1.0 Executive Summary ................................................................................................ 4
Study Background ............................................................................................................................... 4
Study Aim and Rationale ..................................................................................................................... 4
Methods .............................................................................................................................................. 4
Findings ............................................................................................................................................... 4
Conclusions ......................................................................................................................................... 5
2.0 Salt Supply for Food Industries ............................................................................... 7
Indonesia salt consumption ................................................................................................................ 7
Salt producers’ market share .............................................................................................................. 9
3.0 Salt Regulatory Environment ................................................................................ 13
Introduction ...................................................................................................................................... 13
Regulatory overview ......................................................................................................................... 13
Salt classification ............................................................................................................................... 14
Salt labeling ....................................................................................................................................... 15
Salt importation ................................................................................................................................ 16
Salt inspections ................................................................................................................................. 17
Final food product labeling ............................................................................................................... 18
4.0 Processed Food Industry Review .......................................................................... 19
Overview of food industries targeted for inclusion in the review .................................................... 19
Review Methodology ........................................................................................................................ 20
Key findings ....................................................................................................................................... 21
Results by Food Industry Segment.................................................................................................... 31
Instant Noodles ............................................................................................................................. 31
Stock .............................................................................................................................................. 36
Soy sauce ....................................................................................................................................... 40
Chili sauce ..................................................................................................................................... 43
Biscuit ............................................................................................................................................ 47
Bread ............................................................................................................................................. 51
5.0 Conclusions .......................................................................................................... 57
Appendix 1: SNI .............................................................................................................. 58
Appendix 2: Discussion Guide ......................................................................................... 60
Appendix 3: Salt Inspections ........................................................................................... 68
Appendix 4: Percentage of Population by SES ................................................................. 71
Appendix 5: Fortified Products ....................................................................................... 72

Usage of Iodized Salt in Processed Food in Indonesia
3
ABBREVIATIONS
AKG Nutritional Adequacy Rate
b/b weight/weight
Bn Billion
BPOM National Agency of Drugs and Food Control
CoA Certificate of Analysis
g Gram
IDR Indonesian Rupiah
IP Manufacturer with import license
IT Registered Importer (non manufacturer) with import license
KIO3 Potassium Iodate
Kg Kilogram
Km Kilometer
Mg Milligram
Mn Million
Ml Milliliter
MT Metric Ton
NaCl Sodium chloride (salt)
p.a Per annum
ppm Parts per million
PET Polyethylane Terephthalate
PT Limited Liability Company
QA Quality Assurance
QC Quality control
RISKESDAS Riset Kesehatan Dasar (Basic Health Research Survey Ministry of Health)
R&D Research and Development
RTK Rapid Test Kit
SES Social Economic Status
SNI Indonesian National Standard
Tr Trillion
UD Usaha Dagang (Trade Venture)
UNICEF The United Nations Children’s Fund
USD United States Dollars

4
1.0 EXECUTIVE SUMMARY
Study Background:
Ensuring that iodized salt is used in processed foods is a key BMGF GAIN-UNICEF Partnership Project
goal. According to the 2007 RISKESDAS survey, the Indonesian population has adequate iodine status
even though the goal of Universal Salt Iodization (USI) was not met. RISKESDAS concluded that the
median urinary iodine concentration (UIC) among 6-12 year olds was well above 100µg/l, the
international cut-off for determining adequacy of iodine nutrition among that population group,
while household use of adequately iodized salt was well below the 90% target. As such it was
hypothesized that Indonesians consume iodine through other sources that could include iodized salt
in processed food, or iodine in ground water.
Study Aim and Rationale:
This study aimed to estimate the potential and actual contribution of iodized salt in key processed
foods to population iodine intake, with some analysis of differences in contribution according to
socio-economic grouping. In addition, the study was conducted to provide information on food
industry attitudes and practices with regard to the use of iodized salt. The rationale for conducting
this study was to provide additional information on non-table salt sources of edible salt (and
potentially iodine) to improve the evidence base for strengthening the USI strategy and program.
Methods:
Six processed foods considered to be centrally-produced and with high market penetration across
population groups were identified1 as: instant noodles, stock, soy sauce, chili sauce, bread and
biscuits.
Clarity undertook a preliminary market scan of each food sector, covering the related salt sector, to
determine market size, key players and specific industry trends. Clarity approached 45 large and
medium sized producers to participate in the survey which took place between May to September
2013. Many of the surveyed companies produce more than one type of surveyed food products.
Clarity primarily undertook face-to-face interviews with the food producers’ R&D and QA
departments. All companies participating in the survey were asked to provide a salt sample for
independent testing to assess its iodine content. Clarity also reviewed the regulatory framework for
using salt in processed food and interviewed key regulatory stakeholders including representatives
from the Ministry of Health, the National Agency of Drug and Food Control (BPOM), and the Ministry
of Industry.
Findings:
The food industry consumes approximately 620,000 MT of salt per annum however 73% is estimated
to be used by the salted fish segment that consumes only non-iodized salt. Within the processed
food industry (which excludes salted fish),food categories found to consume the largest amount of
1Communication with AC Nielsen, Indonesia, produced a list of 5 centrally-produced foods with highest market
penetration. Bread was also included in order to compare the potential impact of iodized salt in its production compared to other countries.

5
salt are: instant noodles (22% of all salt used for processed food production), stock2(24%) and soy
sauce (13%). Other processed foods consuming a relatively high percentage of salt, but not covered
by this analysis, include cooking oil, margarine, snacks, and canned fish.
Data from the survey and from other Ministry and industry information indicates that, if all salt in
these products was iodized, one serving could contribute the following proportion of the
recommended adequate daily iodine intake for adults (150µg): instant noodles 36%,stock 20%, soy
sauce 14%, biscuits 6% and chili sauce 3% (although some of this s already accounted for in the chili
sauce used to season instant noodles), data to calculate this were unavailable for bread. Using
average annual per capita intakes, this would mean up to 6.3% of recommended adequate daily
iodine intake from instant noodles for adults per day across the population (the per capita intake for
other products ranged from 0.2% for chili sauce to 4% for stock). Based on interviews with
participating companies, most distribute at least 40% of their product through the general market
and target all SES groups, indicating relatively high market penetration, although higher SES groups
still tend to be the highest consumers of these processed foods and condiments.
The Government passed a Presidential Decree requiring salt for human or livestock consumption,
including salt used in the food industry, to be iodized, once implementing regulations from the
responsible supervisory body were issued. However no subsequent legislation appears to exist to
ensure the iodization of salt for animal feed, salted fish preservation or food processing.
Only 16 out of 45 food processors agreed to participate in the survey, therefore industry specific
results are only valid for the market share for that product and should not be extrapolated to
describe the national situation for the product. The companies surveyed accounted for 37-95%
market share of their respective food segments. Clarity’s survey found that 14 of the 16 food
producers (or 88%) used iodized salt primarily because they found there was no barrier to its use.
Two food producers, including one very large food manufacturer, understood that in the absence of
specific implementing regulations3, there was no legal requirement to use iodized salt so opted to
use non-iodized salt for the reasons that it was cheaper (one company) and that it simplified the
supply chain (the second company, that also produced margarine products). These two companies
would be willing to switch to iodized salt if they were legally required to do so.
Food processing companies use the Certificate of Analysis (CoA)with salt shipments to check
whether the salt they use is iodized or not. Most companies are not concerned with the exact level
of iodine as long as it meets the Indonesian National Standard (SNI) requirement, which is 30 ppm
KIO3, equivalent to 18 ppm iodine.
Conclusions:
The use of iodized salt in the production of key processed foods with high market penetration has
the potential to at least partially protect the population consuming these products from iodine
deficiency, which would be particularly beneficial for population groups who do not have access to
adequately iodized table salt.
2The term “stock” as used throughout this report includes both stock and complete food seasoning, it was not
possible for producers to differentiate salt used in each product separately. 3The situation regarding specific requirement for use of iodized salt by the food industry is currently unclear
and is addressed in more detail in later in this report and in a 2014 UNICEF-supported Review of Progress towards the Sustainable Elimination of Iodine Deficiency Disorders in Indonesia

6
The food industry appears generally reluctant to discuss the type of salt used in their food products,
which may be due to the lack of clarity surrounding the regulations on the use of iodized salt within
the industry. From the companies that agreed to participate in this study but who did not currently
use iodized salt in their products, it was evident that clear regulations for the use of iodized salt
would be needed in order for them to change this practice. Two potential options to change the
situation, discussed during interviews with the food industry and Government ministries, were that:
specific implementing regulations for Presidential Decree 69 / 1994 would need to be issued by the
Ministry of Industry, requiring food industries to use iodized salt; and/or key processed food
products should be required to have an SNI (Indonesian National Standard) certificate which as a
pre-requisite requires the use of adequately iodized salt.

7
2.0 SALT SUPPLY FOR FOOD INDUSTRIES
Indonesia salt consumption
Data on salt production and use and on the relative proportion of edible and non-edible salt in
Indonesia are difficult to determine accurately, despite the fact that the national salt industry is
considered very important.
The Ministry of Maritime and Fisheries estimates that total salt demand reached 3.25mn MT in
20124, with an annual growth rate of 5.1% per annum (p.a) over the previous four years. Salt
production has been very low over the last few years due to adverse weather conditions and
resulting poor harvests during 2010-2012; consequently Indonesia has had to rely at least partially
on salt imports. However, in the drive to promote salt self-sufficiency5, the Government restricted
table salt6 imports. Consequently, there have been a number of years where demand for edible salt
(for use as both table and food industry salt has far exceeded supply and Indonesia has had to resort
to using salt stock piles or importing industrial salt and processing it in Indonesia to meet demand.
Clarity conducted interviews with the Ministry of Maritime and Fisheries, with the Directorate of
Manufacturing Base Industry Ministry of Industry, and with BPOM (the National Agency of Drugs and
Food Control), from which estimates were obtained for recent trends in total salt supply, demand
and some breakdown of this amount by end use, e.g. food industry, table salt, as shown in the
following charts.
Salt supply and demand in Indonesia (2008-2012)
Salt demand by category (2008-2012)
Source: Interview with Directorate of Manufacturing Base Industry Ministry of Industry, Clarity
Analysis
However, data from these sources differs lightly with data provided in the ongoing UNICEF-
supported USI Programme Review, draft in particular with respect to the amount of salt supplied to
the animal feed industry, which was thought to be included in salt for the food industry from
4Suara Karya, 6 May 2013 - Indonesia is capable for salt self-sufficiency
5 The Jakarta Globe, March 22, 2011 – Gov’t targets self-sufficiency by 2014
6Indonesian regulations refer to table salt as consumption salt. However to avoid confusion as consumption
salt could also be interpreted as salt for use in food industries, this report will refer to it as table salt.
0
500
1,000
1,500
2,000
2,500
3,000
3,500
2008 2009 2010 2011 2012
'00
0 t
on
s
Supply Demand
0
500
1,000
1,500
2,000
2,500
3,000
3,500
2008 2009 2010 2011 2012
'00
0 t
on
s
Table Salt Food Industries Other Industries
8
Ministry of Industry figures above. Given these limitations in the data provided during the interviews
conducted by Clarity, the data in the flow diagram below for best estimates of total salt demand by
end use for 2012 is that provided in annex 1 of the draft of USI Programme Review, also
incorporating more recent data on iodized salt from the 2013 Riskesdas.
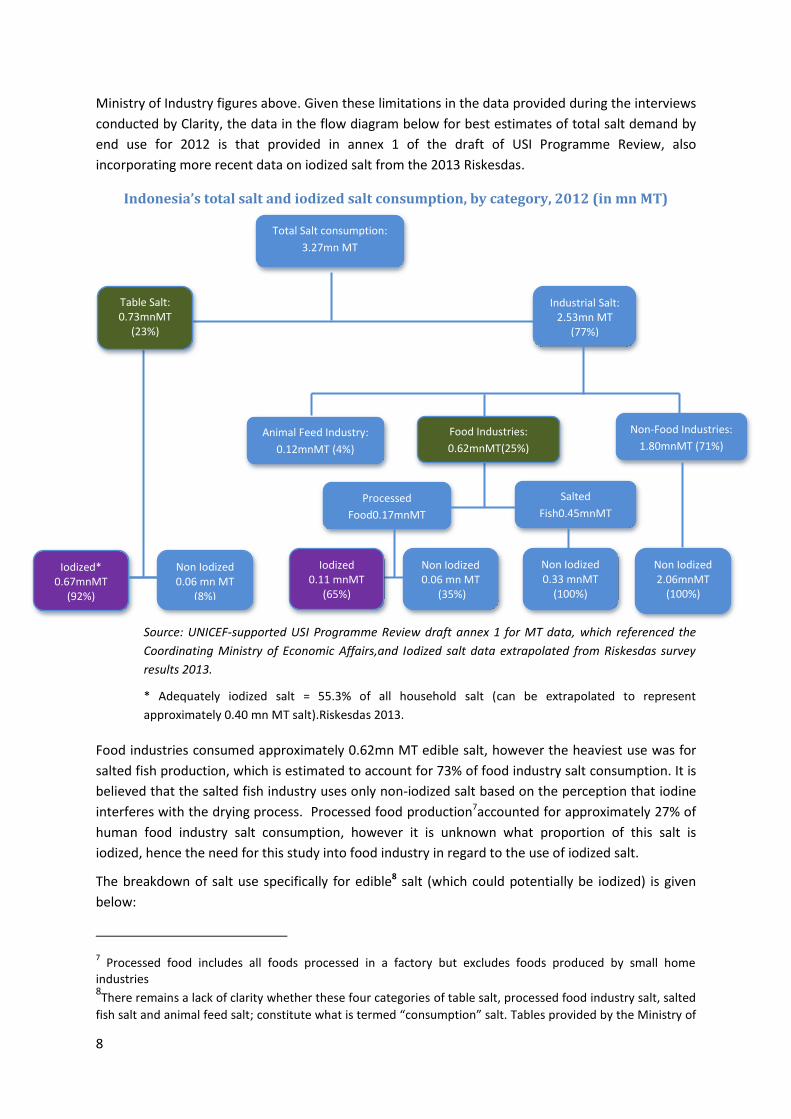
Indonesia’s total salt and iodized salt consumption, by category, 2012 (in mn MT)
Source: UNICEF-supported USI Programme Review draft annex 1 for MT data, which referenced the
Coordinating Ministry of Economic Affairs,and Iodized salt data extrapolated from Riskesdas survey
results 2013.
* Adequately iodized salt = 55.3% of all household salt (can be extrapolated to represent
approximately 0.40 mn MT salt).Riskesdas 2013.
Food industries consumed approximately 0.62mn MT edible salt, however the heaviest use was for
salted fish production, which is estimated to account for 73% of food industry salt consumption. It is
believed that the salted fish industry uses only non-iodized salt based on the perception that iodine
interferes with the drying process. Processed food production7accounted for approximately 27% of
human food industry salt consumption, however it is unknown what proportion of this salt is
iodized, hence the need for this study into food industry in regard to the use of iodized salt.
The breakdown of salt use specifically for edible8 salt (which could potentially be iodized) is given
below:
7 Processed food includes all foods processed in a factory but excludes foods produced by small home
industries 8There remains a lack of clarity whether these four categories of table salt, processed food industry salt, salted
fish salt and animal feed salt; constitute what is termed “consumption” salt. Tables provided by the Ministry of
Total Salt consumption:
3.27mn MT
Industrial Salt: 2.53mn MT
(77%)
Food Industries:
0.62mnMT(25%)
Non-Food Industries:
1.80mnMT (71%)
Processed
Food0.17mnMT
(27%)
Salted
Fish0.45mnMT
(73%)
Non Iodized 0.06 mn MT
(35%)
Non Iodized 0.33 mnMT
(100%)
Iodized* 0.67mnMT
(92%)
Non Iodized 0.06 mn MT
(8%)
Non Iodized 2.06mnMT
(100%)
Iodized 0.11 mnMT
(65%)
Animal Feed Industry:
0.12mnMT (4%)
Table Salt: 0.73mnMT
(23%)

9
Edible salt breakdown by main category of use (2012)
Food industry salt consumption by use
(2012)
Source: UNICEF-supported USI Programmed Review draft, annex 1, which referenced the source as
Coordinating Ministry of Economic Affairs
Salt producers’ market share
Salt producers harvest their own salt as well as importing salt and further processing (e.g. iodizing
and drying) salt from other countries. Consequently salt producers include a proportion of imported
salt within their own production figures.
Based on interviews with leading salt producers about production and imports in the past year,
Clarity estimates that the 18 registered salt producers process approximately 1.4mnMTof salt a year
that includes domestic salt and imported salt requiring further processing. Small manufacturers and
farmers are estimated to produce 0.2mnMT. The remaining approximately 1.6mn MT of salt is
imported without further processing, either by end users directly (e.g. non-food and food industries)
or by Indonesian salt producers who then sell it on to the end users.
Salt supply by type of supplier
Source: Clarity Analysis, based on interviews with large salt producers.
Industry with the breakdown of national salt use indicates that they are all considered as consumption salt, however existing implementing regulations for iodization of table salt imply that consumption salt refers only to table salt (sold in sealed packages up to 50Kg). To avoid confusion, the term edible salt is used in this report for these four categories and, as above, table salt is used to define salt for used in the household for cooking or adding to foods.
Table Salt 54%
Processed Food
46%
Fish Salting
31%
Animal Feed 8% Processe
d food 27%
Salting fish 73%
0.62 mn tons
37%
6% 6%
51%
Large salt producers
Medium salt producers
Small salt producers
Direct Import
1.4mn MT

10
There are 18 registered salt producers of which seven are considered large players producing more
than 50,000 MT(86% of domestic production) per annum9. The remaining 11 players are considered
medium sized players and produce 10-50,000 MT per annum. In addition to this, there are at least
30,000 small scale salt farmers producing salt in Indonesia.
During the research process, Clarity interviewed 11 salt producers, including all of the large players
plus four medium sized players, to determine total salt production, percentage of salt iodized and
their main target markets. These 11 producers accounted for 87% of national salt production.
Producers unwilling to participate in the survey were all medium and small sized producers. From
interviews with the 11 producers, it is estimated that just over 50% of their total salt production is
iodized; however the two largest producers primarily produce non-iodized salt, probably for
industrial use and for salted fish producers.
Salt producers’ production volumes, 2012
No Company Name Salt Production (MT/year)
Total Iodized Non Iodized
1 PT Garam 395,000 150,000 245,000
2 PT Budiono 225,000 60,000 165,000
3 PT Susanti Megah 180,000 180,000 0
4 PT Sumatraco 120,000 60,000 60,000
5 PT Garindo 72,000 24,000 48,000
6 PT Cheetam Garam Indonesia 60,000 24,000 36,000
7 UD Takim 60,000 48,000 12,000
8 PT Elister Primajaya 36,000 28,800 7,200
9 PT Saltindo Perkasa 35,400 10,200 25,200
10 PT Eka Sari Lestari 18,500 16,650 1,850
11 PT Kalian Maju Bersama 12,000 12,000 0
Sub Total 1,213,900 613,650 600,250
Medium sized producers (7 producers)10
185,000
TOTAL 1,398,900
Source: Clarity Analysis, based on interviews with large salt producers.
9Interviews with large salt producers
10These seven producers were not interviewed and production volumes have been estimated by Clarity based
on total market size excluding interviewed producers’ volumes.

11
Salt producers’ market share (2012) Salt producers’ split iodized vs. non iodized salt (2012)
Source: Clarity Analysis, based on interviews with large salt producers.
PT Garam, the state owned salt company, is the largest salt producer with 28% market share and
primarily produces non-iodized salt accounting for 62% of its production. As PT Garam is a state
owned company and the only company to have a non-manufacturers import license it is prohibited
from selling salt directly to end users and is required to channel salt through distributors; however as
a result it does not know the breakdown of salt sales to the food industry.
PT Budiono, the second largest player, holds 16% of the market share and again is mostly producing
non-iodized salt, accounting for 73% of production. Budiono targets industrial users and the salted
fish segment, which explains the high proportion of non-iodized salt. Budiono only sells a limited
quantity of iodized salt to the processed food industry.
PT Susanti Megah holds 13% of the market share and claims to only produce iodized salt as it
primarily supplies table salt and processed food industries, which all require iodized salt.
PT Sumatraco holds 9% of the market share and produces 50% iodized salt. Non-iodized salt is used
by the food industry for production of cooking oil as well as other industrial users such as the textile
industry.
PT Garindo holds 5% of the market share and produces 67% non-iodized salt. Garindo only sells a
small quantity of table salt and iodized salt to the processed food industry. Garindo claims all non-
iodized salt is sold to non-food industrial customers.
PT Cheetam Garam holds 4% of the market share and produces 40% iodized salt. Cheetam does not
sell table salt and claimed that all salt supplied to the processed food industry is iodized, however
during the survey process one large processed food producer purchased non-iodized salt from
Cheetam.
UD Takim holds 4% of the market share and produces 80% iodized salt. Takim primarily supplies
table salt.
Most of the smaller producers, with the exception of Saltindo Perkasa, claim that they produce more
than 80% iodized salt as they primarily supply table salt.
28% 16%
13%
9%
5% 4%
4%
21%
Garam
Budiono
Susanti Megah
Sumatraco
Garindo
Cheetam Garam
Takim
Others
0
100,000
200,000
300,000
400,000
ton
s
Non-Iodized
Iodized

12
Iodized salt distribution Non Iodized salt distribution11
Source: Clarity Analysis based on interview producer interviews
11Other industries include salted fish
0
50,000
100,000
150,000
200,000Su
san
ti…
Bu
dio
no
Sum
atra
co
Taki
m
Elis
ter
Ch
eet
am
Gar
ind
o
Eka
Sari
…
Kal
ian
Maj
u
Salt
ind
o
ton
s/ye
ar
Table Salt
Processed Food Industries
0
50,000
100,000
150,000
200,000
Bu
dio
no
Sum
atra
co
Gar
ind
o
Ch
eet
am
Salt
ind
o
Taki
m
Elis
ter
Pri
maj
aya
Eka
Sari
Les
tari
ton
s /
year
Other Industries
Food Industries

13
3.0 SALT REGULATORY ENVIRONMENT
Introduction
The following analysis focuses primarily on mapping the regulatory process of food inspections.
However, during the research it came very apparent that the food inspection process must be placed
within the context of the complete regulatory environment of salt industry.
Regulatory overview
Currently in Indonesia only table salt is legally required to be iodized. The Government issued a
Presidential Decree12 in 1994 that required table salt and industrial salt used by food industries,
including for salted fish and animal feed, to use iodized salt. However, in order for the Presidential
Decree to be effective it requires the responsible supervisory bodies to issue implementing
regulations.
The Ministry of Industry subsequently passed implementing regulations for table salt and,
consequentially, all table salt is legally required to be iodized. However no subsequent legislation
appears to exist to ensure the iodization of salt for animal feed, salted fish preservation or food
processing. In 2009, the MoI issued a Regulation on the “Roadmap for the Development of the Salt
Industry.13 Although the document includes a figure which suggests that all salt for the “food
industry” and “fishery industry (salted and canned fish)” should be iodized, there is no specific
requirement for use of iodized salt in food processing mentioned in the text, and the Roadmap are
not widely known to many people. Therefore, it is understood that food industries are not legally
required to use iodized salt.
12 Presidential Decree No.69 / 1994
13 Regulation No. 134/M-IND/PER/10/2009

14
Salt regulatory overview
Type of salt Use Law Presidential Decree Implementing
Regulation Regulated
Consumption Table X √ √ √
Industry Food X √ X X
Non-Food
X √ X X
Comment Indonesia has no specific law on iodized salt
Presidential Decree No 69 / 1994 requires that iodized salt must be used for human consumption, salting fish, animal feed and processed foods. Salt for non-food industries is not required to be iodized
Implementing regulations required to be put into effect
Table salt – implementing regulation passed by Ministry of Industry Food salt – no implementing regulation have been passed by Ministry of Industry
Food industry has no implementing regulations for the use of iodized salt, therefore there is no framework for regulation
Source: Clarity Analysis translation and interpretation of The 1994 Presidential Decree (Kepres
69/1994) and the Ministry of Industry regulation No. 42/2005
Salt classification
Presidential Decree No 69/1994 refers to iodization of salt for human
or livestockconsumption, fish salting, or salt as an additive for foodprocessing to meet the National
Standards of Indonesia (SNI). Differences and similarities in required properties of table salt and food
industry salt are provided in the table below along with reference to (non-food) industrial salt also.

15
Salt classification and criteria
Criteria Table Salt Industrial Salt
Food Non Food
Raw materials NaCl: 94.7%
Dry basis: 2%
Impurities: 1%
Moisture content: max 7%
NaCl: 94.7%
Dry basis: 2%
Impurities: 1%
Moisture content: max 7%
NaCl: 97%
Use Household consumption Food industry, industrial cooking oil, industrial fish salting
Non food industrial uses
Required to use Iodized salt
Yes No
The Ministry of Industry has not yet issued implementing regulations for food industry salt.
No
Permitted Iodine content
≥18ppmiodine(> 30ppm KIO3) ≥18ppm iodine (> 30ppm KIO3)
-
Indonesian National Standard (SNI)
Compulsory SNI Yes No - as no implementing regulation passed
No
SNI Requirement Minimum KIO3 is 30 mg/kg (equivalent to 18ppm iodine)
Water content max 7% b/b
Chloride min 94.7 % b/b
Metal content:
Lead max 10 mg/kg Cuprum max 10 mg/kg Mercury max 0.1 mg/kg Arsenic max 0.1 mg/kg
NA
Quality checks Quality testing either internally or through accredited laboratories
NA NA
Source: Clarity Analysis based on SNI accreditation criteria
See appendix 1 for an explanation and overview of the Indonesian SNI accreditation
Salt labeling
Table salt must be labeled as iodized salt and carry an Indonesian National Standard (SNI) logo
among other requirements14. See appendix 1 for an explanation and overview of the Indonesian SNI
accreditation. For non-food industrial salt it should be labeled industrial salt non- iodized. For food
14 Ministry of Industry Decree No 29/M/SK/2/1995

16
industry salt again there are no implementing regulations that specifically sets out labeling
requirements and, as such, it is generally labeled iodized salt or non-iodized salt.
Salt suppliers normally provide a Certificate of Analysis (CoA) with industrial salt. Again there is no
legal requirement to do so however large suppliers typically provide a CoA with every shipment
while smaller suppliers may only provide the CoA with every other shipment or once every one to
two months.
Salt labeling
Criteria Table Salt Industrial Salt
Food Non Food
Type of salt labeled Iodized Salt Not clearly defined as no implementing regulation has been passed – but labeled as:
Iodized salt
Non iodized salt
Industrial Salt Non Iodized
Other labeling required
Name / Trademark ≥30 ppm KIO3 content
(18 PPM iodine) Product code Ministry of Health
Registration number Producers’ name and
address The composition of food
/ packaged salt SNI Logo
Not clearly stated in the regulation but suppliers provide CoA
Not clearly stated in the regulation but suppliers provide CoA
Packaging size 50kg, 25kg, 5kg, 1kg, 500gr, 250gr and 100gr
25 kg or 50kg 25 kg or 50kg
Source: Clarity Analysis based on Ministry of Industry Decree No 29/M/SK/2/1995
Salt importation
Regulations on salt importation are clear as the Ministry of Trade has issued a series of regulations
covering salt imports with the latest one issued in 201215. Importation of table salt is strictly
controlled and restricted to five table salt producers that also have import licenses. In 2012, the
import quota was set at 533,000 MT of which 495,000 MT were realized16. The Government has
introduced banson table salt imports since July 2012, these bans cover the period during and around
the salt harvest. Companies are prohibited from importing table salt for approximately six months of
the year, from one month prior to two months after the salt harvest (with the salt harvest lasting
around 3 months).
15 Ministry of Trade Regulation No 58 /M-DAG/PER/9/2012
16Detik Finance, 14
th September 2013 citing Ministry of Trade Press Release – The year Indonesia still import
consumption salt of 495,000 tons

17
Industrial salt imports are not restricted as long as the salt producer has an importation license or is
the one approved salt trader, the state owned company, PT Garam. Importation of industrial salt is
permitted throughout the year.
Salt importation regulatory requirements
Criteria Table Salt Industrial Salt
Food Non Food
Import permissions Prohibited for 6 months per year from 1 month before to 2 months after the salt harvest of around 3 months duration
Permitted year round
Type of importer Table salt producer with importing license
Producer with salt importing license (IP)
Approved importer (only PT Garam) (IT)
Quotas Yes (however no quota given since July 2012)
No
Importers PT Garam
PT Garindo
PT Sumatraco L.M
PT Budiono Madura BangunPersada
PT Garam
PT Garindo
PT Cheetham Garam Indonesia
PT Asahi Mas
PT Tjiwi Kimia
PT Riau Andalan
PT KAO
PT Sanbe Farma
PT Riau Andalan Pulp and Paper
Plus others
Source: Ministry of Trade Regulation No 58/2012; interviews with Ministry of Trade; Clarity Analysis
In reality, companies import salt under the industrial salt classification to then iodize or further dry
the salt in Indonesia and sell it as table salt, to avoid the import quotas imposed on table salt. As a
result, in 2012, only five MT of table salt was reported as imported compared to 2.2 million MT of
industrial salt17.
Salt inspections
BPOM and the Ministry of Industry are the supervisory bodies for industry salt, however in the
absence of implementing regulations for iodization of this salt, they have no authority to regulate
this. BPOM carried out a first, limited, assessment of food industry salt in 2012 by collecting 12
samplesfrom10 companies for information purposes only, no details on the sampling method were
provided. BPOM indicated that they intended to undertake annual sampling of food producer salt
but as of June 2013 had not yet collected any samples in 2013.
The Ministry of Industry and Ministry of Trade are the supervisory bodies for imported industrial
salt. Inspections are undertaken in ports custom area by two appointed assessors, however they are
17 Central Bureau of Statistics (BPS) import-export data 2012

18
only tasked with checking documentation including import license, import quotas and quantity
imported. The assessors are not responsible for carrying out any inspection of the salt quality
including the iodine level.
Additional information obtained on inspections for table and industrial salt is provided in appendix 3.
Final food product labeling
Final food product labeling in Indonesia is somewhat simplistic. Food products with a shelf life of six
days or more are required to provide food labels that list the ingredients without giving any specific
details. Only products that make claims about fortified ingredients such as vitamins or fortified
materials must provide nutritional information including percentages of daily requirements. As
iodized salt is not classified as a fortified material, producers only need to list salt as an ingredient
(without specifying whether it iodized or not) and do not need to include salt and / or iodine content
in the nutritional information.
Some food producers list sodium in the nutritional facts including mg and percentage of Nutritional
Adequacy Rate (AKG), however this includes sodium from mono sodium glutamate as well as salt.
Final food products are not required to have an SNI. To date, SNI guidelines have been released for
many food products. In the example of the instant noodle SNI it requires producers to use salt and
flour that is SNI certified and, in order for these ingredients to be SNI certified, salt must be iodized
and flour fortified with iron. At present there is no requirement for oil to be fortified.
Final food product labeling
Criteria Requirement
Compulsory use of Iodized salt No
Food labeling Required to list ingredients only
Nutritional information Only foods that claim to contain vitamins and fortified materials (which does not include iodized salt)
SNI for final food product Not compulsory
Source: Clarity Analysis based on various Government regulations

19
4.0 PROCESSED FOOD INDUSTRY REVIEW
Overview of food industries targeted for inclusion in the review
The following section looks at the market size and iodized salt use for six processed foods proposed
for inclusion in the food industry review. These products were proposed based on their production
by large scale producers, and their wide-spread distribution and use18, as well as on their resulting
relatively high contribution to salt consumption across the population.
The products included were:
Instant noodles
Stock and complete food seasoning (referred to as stock)
Soy sauce
Chili sauce
Biscuits
Bread
Other food products consuming a relatively high percentage of salt, but not covered by this analysis
include: fresh noodles, cooking oil, margarine, snacks, and canned fish. They were not included in
the study because they are produced by multiple small scale producers and/or else have been
reported to use non-iodized salt (e.g. oil and margarine), since producers believe that iodized salt
adversely affects the production process19.
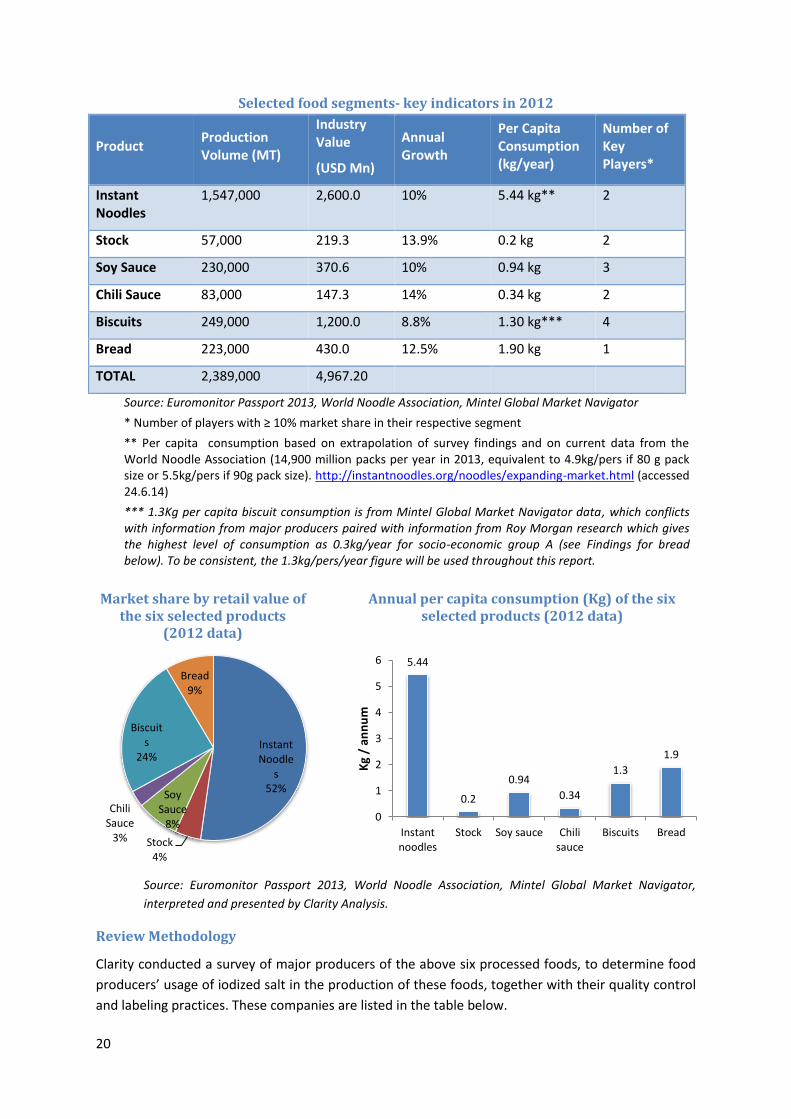
Combined, the six food segments above hada retail value of US$5 bn20 in 2012, of which instant
noodles accounted for 52% followed by biscuits with a 26% share. On average, each of the selected
product segments has only 1-4 major players holding more than 10% market share each.
In terms of annual per capita consumption of non-condiment products from the list above,
Indonesians consume a significantly higher amount of instant noodles at 5.44kg than bread (1.9kg)
and biscuits (1.3kg). Stock, soy sauce and chili sauce are considered condiments and are either
added during the cooking process or as a sauce to compliment flavor and expected consumption is
below 1kg per capita per annum for each product.
18 Communication with AC Nielsen, Indonesia, produced a list of 5 centrally-produced foods with highest
market penetration: instant noodles, stock, soy sauce, chili sauce and biscuits. Bread was also included in order to compare the potential impact of iodized salt in its production compared to other countries. However only large scale producers were considered, not the many small bakeries. 19
Perception of margarine producers using non-iodized salt was based on discussions with GAIN Jakarta office and confirmed by oil and margarine producers. 20
Euromonitor Passport 2013, Clarity Analysis
20
Selected food segments- key indicators in 2012
Product Production Volume (MT)
Industry Value
(USD Mn)
Annual Growth
Per Capita Consumption (kg/year)
Number of Key Players*
Instant Noodles
1,547,000 2,600.0 10% 5.44 kg** 2
Stock 57,000 219.3 13.9% 0.2 kg 2
Soy Sauce 230,000 370.6 10% 0.94 kg 3
Chili Sauce 83,000 147.3 14% 0.34 kg 2
Biscuits 249,000 1,200.0 8.8% 1.30 kg*** 4
Bread 223,000 430.0 12.5% 1.90 kg 1
TOTAL 2,389,000 4,967.20
Source: Euromonitor Passport 2013, World Noodle Association, Mintel Global Market Navigator
* Number of players with ≥ 10% market share in their respective segment
** Per capita consumption based on extrapolation of survey findings and on current data from the World Noodle Association (14,900 million packs per year in 2013, equivalent to 4.9kg/pers if 80 g pack size or 5.5kg/pers if 90g pack size). http://instantnoodles.org/noodles/expanding-market.html (accessed 24.6.14)
*** 1.3Kg per capita biscuit consumption is from Mintel Global Market Navigator data, which conflicts with information from major producers paired with information from Roy Morgan research which gives the highest level of consumption as 0.3kg/year for socio-economic group A (see Findings for bread below). To be consistent, the 1.3kg/pers/year figure will be used throughout this report.
Market share by retail value of the six selected products
(2012 data)
Annual per capita consumption (Kg) of the six selected products (2012 data)
Source: Euromonitor Passport 2013, World Noodle Association, Mintel Global Market Navigator,
interpreted and presented by Clarity Analysis.
Review Methodology
Clarity conducted a survey of major producers of the above six processed foods, to determine food
producers’ usage of iodized salt in the production of these foods, together with their quality control
and labeling practices. These companies are listed in the table below.
Instant Noodle
s 52%
Stock 4%
Soy Sauce
8%
Chili Sauce
3%
Biscuits
24%
Bread 9%
5.44
0.2
0.94
0.34
1.3
1.9
0
1
2
3
4
5
6
Instantnoodles
Stock Soy sauce Chilisauce
Biscuits Bread
Kg
/ an
nu
m

21
Many of the surveyed companies produced more than one type of the six food products and were
therefore interviewed about each product. Clarity primarily undertook interviews with personnel
from the R&D and QA departments.
Companies participating in the survey according to food product of interest
Instant Noodles
Stock Soy Sauce Chili Sauce Biscuit Bread
Indofood CBP Sukses Makmur
Nestle Indofood Citarasa Indonesia
Heinz ABC Indonesia
Heinz ABC Indonesia
Arnotts Indonesia
Nippon Indosari
Nissin Mas Unilever Indonesia
Jakarana Tama
Nestle Indofood Citarasa Indonesia
Mayora Indah Pangan Rahmat Buana
Sentra food Indonusa
Nestle Indofood Citarasa Indonesia
Ikafood Putramas
Orang Tua Group
Jakarana Tama
Unilever Indonesia
Jakarana Tama
ABC President Indonesia
Sparindo Food
Mayora Indah
SekarLaut
Source: Clarity Analysis
A summary of overall findings related to iodized salt use and related practices is given below,
followed by results for each food product.
Key findings
In total 16 out of 45 food producers that Clarity approached, agreed to participate in the survey.
These 16 companies accounted for between 37-95% of the market share for their respective food
segment(s). It is not known why the other companies declined to take part in the survey, however,
it needs to be considered that the findings here relate only to the products and percent market
share of the product represented by the companies that took part. It is not possible to give
information for the national situation.
From the 16 producers all but two producers used iodized salt in the production of at least some
food products. One of the non-users was a major player in the stock and soy sauce segment, hence
the relatively low proportion of salt that was iodized shown in the table below. While the other
company was a small player in the instant noodle segment.
It should be cautioned that in the stock and biscuit segment, participating producers representing
only one third of the national market share, also that only bread companies producing on a large

22
(industrial) scale were invited to participate, therefore findings cannot be considered representative
of the total food segment.
Survey key findings (for companies that participated in the survey)
Product No of Companies
Production Share of surveyed companies
Annual Production
Total Salt Usage (MT)
Iodized Salt Usage (MT)
% Mkt share using iodized salt*
Instant Noodles
6 67% 11.8Bn packs**
Approx. 1 Mn MT
22,000 21,692 66%
Stock 2 36.7% 24,000 MT 13,000 2,990 8.4%
Soy Sauce
4 82% 145,330 MT 11,608 7,197 50.8%
Chili Sauce
6 94% 67,300 MT 2,974 2,974 94%
Biscuits 3 37.5% 38,200 MT 702 702 37.5%
Industrial Bread
2 95%**** 326.2 Mn packs***
590 590 95%
* Percentage market share using iodized salt based on surveyed companies market share multiplied by the percentage of iodized salt. Therefore representative for participating companies only.
**Typical pack size between 75-90g
*** Pack size varies considerably, from 70-370g
**** Production share based on the industrial bread segment only (about 10% national market)
Source: Clarity Analysis based on Euromonitor Passport 2013, interviews with Directorate of Manufacturing Base Industry Ministry of Industry and with BPOM and survey results and Survey results

23
Breakdown of salt used by processed food categories (2012). Based on salt use reported by food producers in the survey and extrapolation
based on the % market share they represent
* Salt use for instant noodle production estimated from information provided by food producers in this survey (presented here) is about 70% of the value estimated by the Ministry of Industry in 2010 (50,000 MT).
**Other processed foods include: Cooking oil, margarine, savory snacks and chips, processed meat
and ready to eat meals, canned fish
Source: Clarity Analysis based on Euromonitor Passport 2013, interviews with Directorate of Manufacturing Base Industry Ministry of Industry and with BPOM and survey results
Clarity extrapolated total salt usage per food segment for the six segments included in the study,
based on surveyed companies’ salt usage and their respective market share. Clarity estimates that
the six food product segments consumed 88,000 MT of salt in 2012, with instant noodles, stock and
soy sauce accounting for 93%. See graph below.
Salt consumption by selected food segments
(MT (rounded value), % total salt used for these 6 food segments)
Source: Clarity Analysis based on survey results
20%
21%
8%
2% 1% 0%
48%
Instant noodles*
Stock
Soy Sauce
Chili sauce
Biscuits
Bread
Other processedfood**
38%
40%
16%
4%
2% 1%
Instant Noodles
Stock
Soy Sauce
Chili Sauce
Biscuits
Bread

24
Most food producers surveyed used iodized salt, with only 12% of companies (2/16) preferring to
use non-iodized salt. However one of the users of non-iodized salt is one of the major salt
consumers as it is a major player in its respective food segments with 31.5% market share for stock
and 33.8% for soy sauce.
Nationally, the total proportion of non-iodized salt used in these six products may be different,
especially for the stock and biscuit food segments as participating producers only represented one
third of total market share and there is no information available about whether companies who
declined to join the survey use iodized or non-iodized salt.
Types of salt used in the production process for the 16 companies who participated in the
survey
Source: Clarity Analysis based on survey results
Processed food usage of iodized vs non-iodized salt for the 16
companies who participated in the survey, 2012 estimates
Breakdown of volume of iodized vs non-iodized salt by selected food segments for the 16 participating companies, 2012 estimates21
Source: Clarity Analysis based on survey results. Without knowing more about the expected iodized
salt usage of other companies, it is not valid to extrapolate these findings for the complete national
market.
21Breakdown for iodized and non-iodized salt is for six food categories only while estimates on page 7 cover all
processing industries including margarine and home industry companies that are expected to use non-iodized salt.
98.6%
23%
62%
100%
100%
100%
1.4%
77%
38%
0% 20% 40% 60% 80% 100%
Instant noodles
Stock
Soy Sauce
Chili Sauce
Biscuits
Bread
Iodized Non Iodized
Iodized 71%
Non Iodized
29%
0
5,000
10,000
15,000
20,000
25,000
InstantNoodles
Stock SoySauce
ChiliSauce
Biscuit Bread
ton
s
Iodized Non-Iodized

25
Salt and potential iodine content per serving
Based on the above data provided for salt usage in production of for each processed food, additional
estimations were done to determine the approximate amount of salt intake per serving. From this,
the potential iodine intake, if all salt used was iodized, was calculated. This is shown in the table
below. Of the six products, instant noodles and stock have the highest salt content per serving. One
serving of instant noodles has the potential to provide approximately 36% of an adult’s adequate
daily iodine intake (150µg)if produced using iodized salt. While a 3 g serving of stock could provide
approximately 20% of adequate daily iodine intake and a 15 g serving of soy sauce could provide
approximately 14%. Chili sauce (5g serving) and biscuits (25g serving) could provide approximately
3% and 6% of an adult’s adequate daily iodine intake respectively.
The table overleaf also provides an illustration of these amounts in terms average daily per capita
consumption.
Barriers to using iodized salt
88% (or 14/16) companies using iodized salt said there was no barrier to using iodized salt, however
soy sauce producers mentioned that they perceived that iodized salt could not be used to ferment
soy beans but could be used in the soy sauce production process.
Only a minority, 12% (2/16), of food producers were not using iodized salt in the production process
and they cited barriers to its use as:
Complicating the supply chain; this food producer also produced margarine for which they used
non-iodized salt and preferred not to handle two types of salt in their supply chain.
Perception that iodized salt could not be used for certain food processing such as fermenting soy
or manufacturing margarine.
The price difference between iodized and non-iodized salt.
Non-users of iodized salt would be willing to switch to iodized salt if the government passed
developed specific implementing regulations for the use of iodized salt in the production of all, or of
certain, food products. An alternative solution would be to require all processed food products to
have an SNI which in effect would require them to use iodized salt.

26
Summary of key findings related to potential iodine intake from selected products if all salt used in production is iodized
Food product Salt by product unit
Unit Est. average serving size (g)
Equivalent salt intake from one serving size of product (g)
Potential iodine intake from one serving size of product (µg)*
% of Recommended adequate daily iodine intake for an adult (150µg)
Est. per capita daily iodine intake (µg)*
% Recommended adequate daily iodine intake for an adult(150µg)
Instant noodles**
3 Pack 85 3 54 36% 9.5 6.3%
Stock 54.2% % / by weight 3 1.6 29 20% 5.3 3.6%
Soy sauce 8.0% % / by weight 15 1.2 22 14% 3.7 2.5%
Chili sauce 4.4% % / by weight 5 0.2 4 3% 0.7 0.5%
Biscuits 1.8% % / by weight 25 0.5 8 6%
1.2 0.8%
0.3*** 0.2%
Bread 1.5%
% by serving size
Cannot be calculated from available data
* Based on average per capita consumption of each product (from Euromonitor Passport 2013, World Noodle Association, Mintel Global Market Navigator and survey findings as above) and using a minimum salt iodine content of 18ppm (18µg iodine/g salt) if the salt is iodized. In reality,
** Data for instant noodles is based on estimates of g salt per pack taken from a variety of sources. Information provided to Clarity during the interviews was incomplete due to missing data (producers did not have the data available or did not want to share it) and data that implied either only salt used in noodles (not spice packs) was provided or only salt for the spice pack was provided (not accounting for the weight of the noodles). Therefore data for salt used in instant noodle production (Min of Industry) compared with number packets consumed per year (World Noodle Association and Clarity interviews) and a personal communication with a noodle manufacturer were used to propose an average figure of 3g salt per product unit (usually 80-90g pack).
***Two different options presented for biscuits based on the per capita consumption figures of 1.3kg/pers/year and an average from interviews with biscuit producers of 0.3kg/pers/year.
Source: Interview findings and as above for instant noodles.

27
Companies perception of iodized salt regulations
Fourteen of the food producers interviewed (88%) saw no barriers to using iodized salt in their
production process and abided by the regulations outlined in the 1994 Presidential Decree, although
some did not use iodized salt for soy fermenting but used it for soy sauce processing.
Two of the companies interviewed (12%) fully understood that according to the current regulatory
framework, there is no requirement for food producers to use iodized salt because no implementing
regulation has been issued by the Ministry of Industry. These companies primarily use non-iodized
salt for cost/supply chain reasons and would only switch to iodized salt if they were legally required
to do so.
Several companies mentioned that if the food industry was required to use iodized salt that this
should not be inclusive of all products, since food producers perceived that iodized salt interfered
with the production process of certain products including:
Salted fish
Margarine
Cooking oil
Soy bean fermentation.
Origin of salt supplies
Salt suppliers typically give food producers the option of purchasing imported or domestically
produced salt, with imported salt sold at a higher price than domestically produced salt. Most food
producers opt for imported salt as it has higher purity and lower moisture content. Only soy sauce,
chili sauce and bread production uses some domestically produced salt. Food producers are not
aware of salt’s country of origin but claim that they can tell whether it’s imported from visually
inspecting the salt.
Salt origin
Source: Clarity Analysis based on survey results
Key salt suppliers
Typically food producers’ source salt from one or two salt producers, however very large food
producers with very high salt usage source salt from five or more producers to ensure continuous
supply.
0% 10% 20% 30% 40% 50% 60% 70% 80% 90% 100%
Bread
Biscuits
Chili Sauce
Soy Sauce
Stock
Instant Noodles
Imported Local

28
Number of salt suppliers used by a single processed food company
Preferred suppliers
Source: Clarity Analysis based on survey results
Food producers interviewed reported that they sourced salt from 10 salt producers, however the
two main suppliers are Cheetam and Garam Indonesia supplying 56% (9/16) of the food producers
and Susanti Megah supplying 38%(6/16) of the food producers. Many of the other salt producers
only supplied one or two of the food producers interviewed.
Quality Control procedures
Food producers interviewed for the most part only undertake rudimentary quality control checks on
salt as a raw material and are mostly reliant on salt suppliers providing them with salt that meets the
technical specifications set out in the Certificate of Analysis (CoA).
The majority of companies, 62.5% (10/16), undertake visual checks plus basic laboratory tests on
moisture content and NaCl content and a further 25% (4/16) only undertake visual tests.
Iodized salt QC
Only the very large food producers also undertake a rapid test kit (RTK) to check that the salt is
iodized. However, no food producer tests the iodine content (ppm) or undertakes full analysis to
check that the iodine level conforms to the CoA.
5 or more 13%
2 supplier 31%
1 supplier 56%
56%
38%
25%
13%
13%
6%
6%
6%
6%
6%
6%
0% 20% 40% 60%
Cheetam
Susanti Megah
Saltindo
Unichem
Niaga
Sumatraco
Sumber Laut
Inti Laut
Garam Jago
Andalas
Imported by food producer
% of companies using supplier

29
Food producers’ QC checks on salt raw materials
Type of Test Key criteria checked % of companies conducting this test
Visual test Cleanliness 100%
Basic lab test Moisture and NaCl content
75%
Rapid test kit (RTK)
Iodine content (Yes/No) 12.5%
Laboratory test Iodine content (ppm) 0%
Source: Clarity Analysis based on survey results
Food producers informed Clarity that the iodine ppm test on salt was not easy to carry out and that
companies were not concerned with the iodine level providing that it exceeds the minimum
requirement for iodized salt (30 ppm KIO3 equivalent to 18ppm iodine). Some 62.5% (10/16) food
producers informed Clarity of the ppm level provided in one or two of their CoA22. From companies
that provided the ppm, all results were above the minimum 18ppm iodine with 60% (6/10) between
18-23 ppm iodine and the other 40% higher than 23ppm iodine.
All of the large salt suppliers provide a Certificate of Analysis (CoA) for each delivery, while small salt
suppliers generally only provide a CoA every month.
Labeling of iodized salt and nutritional information on the packaging
All food producers list ingredients on the food package but provide no additional details. Only
instant noodles, bread and biscuits provide nutritional values. Stock, soy sauce and chili sauce are
considered condiments that are not consumed in large quantities making them exempt from this
requirement. Only instant noodles provide facts about additional for tificants and the related
percent of daily values for these.
22Some food producers provided CoA that were several month’s old as an example of the CoA results.
25%
62.5%
12.5%
0% 0%
10%
20%
30%
40%
50%
60%
70%
Visual test only Visual test & basic labtest
Visual test, basic labtest, and RTK
Visual test, basic labtest, RTK and
laboratory test
Pe
rce
nta
ge o
f co
mp
anie
s

30
Food labels of the selected food products surveyed
Instant noodles Stock Soy/Chili Sauce Bread Biscuits
Total energy (kcal)
Total fat
- Saturated fat (g)
- Cholesterol (mg)
Protein (g)
Total Carbohydrate
- Dietary Fiber (g) - Sugar (g)
Natrium (mg)
No nutrition fact information
No nutrition fact information
Total energy (kcal)
Total fat
- Saturated fat (g) - Cholesterol (mg)
Protein (g)
Total Carbohydrate
- Dietary fiber (g) - Sugar (g)
Natrium (mg)
Calcium (mg)
Total energy (kcal)
Total fat
- Saturated fat (g)
- Cholesterol (mg)
Protein (g)
Total Carbohydrate
- Dietary fiber (g)
- Sugar (g)
Natrium (mg)
Calcium (mg)
Additional fortificants including supplement facts
Vitamin A
Vitamin B1
Vitamin B6
Vitamin B12
Niacin
Folic Acid
Pantothenic Acid
Calcium
Iron
No fortificant listed
No fortificant listed
No fortificant listed No fortificant listed
Source: Clarity Analysis based on surveyed companies’ food packaging
None of the food producers surveyed currently list iodized salt on their food label as they are not
legally required to do so. Most of the food producers sampled (10/ 16) perceived that listing iodized
salt would not provide any added value as consumers are generally not health conscience or
concerned about iodized salt, nor do they read food labels. Most of the food producers that do
perceive labeling iodized salt will bring value added are instant noodle producers.
All companies stated that if the Government passed a new regulation that required more
comprehensive food labeling including listing iodized salt and salt and / or iodine content they would
all be happy to comply with the regulation.

31
Results by Food Industry Segment
Instant Noodles – market overview and iodized salt usage
Market size
In 2012, some estimated 14.8bn packs of instant noodles were sold in Indonesia, valued at US$2.6
bn. The sector grew by 10% in 2012 primarily driven by Indofood launching new flavors of Indomie.
Instant noodle consumption in Indonesia
(Billion Packs)
Source: World Instant Noodle Association website http://instantnoodles.org/noodles/expanding-market.html
(Accessed June 2014)
Number of players and market share
There are five major instant noodle producers with 25-30 factories located across Indonesia.
Indofood CBP Sukses Makmur (Indofood CBP) is by far the largest player with 60% market share and
14 factories across Indonesia. In comparison the second largest player Prakarsa Alam Segar (Wings
Group) has 31% market share and only one brand, produced at two factories. Other producers
individually hold less than three percent share.
In terms of brand share, Indomie (Indofood CBP) is the brand leader with 41% share followed by Mie
Sedaap (Wings Group). Indofood’s other brands, Supermi, Sarimi and Pop Mie, hold 3rd to 5th
position in terms brand share.
13.7 13.9
14.4 14.5 14.8
12
15
2008 2009 2010 2011 2012
Bill
ion
pac
ks

32
Instant noodle producer - market share (2010-2012)
Instant noodle brand – market share (2012)
Source: Credit Suisse’ Indonesia Consumer Survey
Most instant noodle facilities are located in the Greater Jakarta area or scattered across Sumatra.
Only Indofood has production facilities in Eastern Indonesia.
Instant noodle factory location
Source: Clarity Analysis based on survey results and company websites
Industry trends
The current players are expected to dominate the industry for the foreseeable future as no new
entrant is expected, with annual projected growth at 8-10% p.a over the next five years.
Producers will focus on increasing market share primarily through launching new variants and
expanding their distribution reach. Producers are not expected to build new factories until they are
operating at close to full capacity.
Instant noodles come in two types of packaging – plastic packaging or cups. Plastic packaging
remains the more popular form, accounting for 95% market share, as they are more affordable than
the cups.
59 54 60
29 32 31
12 14 9
0
20
40
60
80
100
2010 2011 2012
Co
mp
any
Shar
e (
%)
Indofood Wings Others
Indomie, 41%
Mie Sedap,
31%
Sarimi, 8%
Supermi, 8%
Pop Mie, 3%
Others, 9%

33
Consumer market segments
Virtually all Indonesians eat instant noodles regardless of consumer segment. Consumers of lower
and middle income group typically eat instant noodles as a complete meal while upper middle and
higher income groups typically consume instant noodles as a quick snack.
In terms of brands, middle and upper income consumers tend to flavor Indomie while lower income
consumers have fairly equal preference for Indomie and Mie Sedaap.
Instant noodle brand preference by income group
Income Group (SES class)
Indomie (Indofood)
Mie Sedaap (Wings Group)
Upper Income (A&B) 33% 24%
Middle Income (C1 & C2)
41% 30%
Lower income (D & E) 39% 35%
Source: Credit Suisse’ Indonesia Consumer Survey
Per capita consumption
Indonesian’s annual per capita consumption reached 74 packs in 2012 up from 64 packs in 2009.
Instant noodle per capita consumption (2008-2012)
Source: World Instant Noodles Association, Clarity Analysis (based on pack size of approx. 80g)
According to the World Noodle Association Indonesia had the second highest per capita
consumption of instant noodles after South Korea. Indonesia’s per capita consumption is 1.3-2.5
times higher than in neighbouring Asian countries.
Population reach
Instant noodles have the highest population reach of all basic consumer staples. According to the
Indonesian Consumer Survey 2013 conducted by Credit Suisse, 95% of adults surveyed (aged
between 18-65) had consumed instant noodles in the past three months. The survey found similar
penetration rates across urban and rural consumers as well as by geographical location i.e Java and
non-Java residents. The survey found that 41% of respondents intended to consume more instant
noodles in the next three month period.
The two major brands, Indomie and Mie Sedaap, are primarily retailed through general trade
channels in order to reach the low to medium class consumers. Some smaller niche brands such as
57 64
70 72 74
0
10
20
30
40
50
60
70
80
2008 2009 2010 2011 2012
Pac
ks p
er
cap
ita

34
ABC President and Nissan target medium to high end consumers and primarily sell through modern
trade channels.
Iodized salt usage interview results
Clarity interviewed six instant noodle manufacturers that accounted for approximately 67% of
market share.
Iodized salt usage
Six companies were interviewed representing 67% market share of noodles. Five of the six
companies interviewed use iodized salt. Total annual salt used by these companies was 22,020 tons
of which 98.6% was iodized.
One small producer does not use iodized salt and gave their reasons as iodized salt is more
expensive than non-iodized salt and there is no legal requirement to use iodized salt.
Source of salt
All producers purchased salt from salt producers however they all ordered imported salt as it was
better quality than domestically produced salt. The companies informed us that their suppliers
provided them with the option of domestically produced or imported salt and all chose imported
salt.
Salt and potential iodine content per serving
Each company has their own recipe and the salt content per portion and that reported ranged from
4% to 40% suggesting that some were reporting salt per unit weight of the noodle and some per unit
weight of the spice pack only. Based on data from the Ministry of Industry for the total amount of
salt used in instant noodle production, compared with the number packets consumed per year
(World Noodle Association and Clarity interviews) and access to a personal communication with a
noodle manufacturer, it is proposed to use an average figure of 3g salt per pack (usually 80-90g
pack).If salt used in the production of instant noodles was all adequately iodized, one serving
(packet) would be expected to contain at least 54µg iodine (or 36% of the recommended daily iodine
intake of 150µg for an adult). From the consumption data below, estimated daily per capita
consumption over a year ranges from <0.01 packs (SES class D& E) to 0.5 packs (SES class A).
Therefore instant noodles have the potential to contribute an average of 18% of the daily
requirement for consumers in SES class A.
SNI
Two of the six companies have SNI for their instant noodles, however neither company labels iodized
salt on the package. Refer to Appendix 1 for SNI information.
Food labeling
None of the companies list iodized salt in their ingredient list. Several brands used fortified
products, such as fortified wheat flour, and label these on the front of the pack and include
information including the percent recommended daily intake of the micronutrients provided.
Value added of listing iodized salt
Instant noodle producers were split on their view of whether labeling iodized salt would provide any
perceived added value to the consumer:

35
67% (4/6) consider labeling iodized salt would be perceived by the consumer as the product
having added value
33% (2/6)consider labeling iodized salt would not provide any added value as consumers are not
concerned about the ingredients
All companies are willing to list iodized salt if they are legally required to do so.
Distribution channel
Instant noodle producers channel 58% of their sales through general trade outlets (primarily mom
and pop shops) with the remaining 42% channeled through modern trade outlets (hypermarkets and
super markets). The market leaders typically have a greater emphasis on general trade distribution
channels as they want to reach the majority of the population, while the smaller niche players
typically focus on the modern trade distribution route as it is costly to build up a good general trade
distribution network.
As most producers are located in Java, there is a geographical bias towards Java which absorbs 49%
of the total market share, followed by Sumatra with 29%. This is fairly in line with the population
distribution between islands.
Instant noodle sales by region (%)
Source: Clarity Analysis based on survey results
Market segment
Instant noodle producers claim that 69% of instant noodles are consumed by SES A and B class (i.e
consumers that spend more than IDR2mn a month on non-capital goods(see Appendix 3 for a
breakdown of the population by SES class).
49%
29%
11%
4% 7%
Java
Sumatra
Sulawesi
Kalimantan
Others

36
Consumer by SES market segment
Source: Interviews and Roy Morgan Research
Stock– market overview and iodized salt usage
Introduction
Stock refers to stock and complete food seasoning as large producers typically produce both types of
seasoning and it is not possible to differentiate between the two products in terms of salt usage.
Market size
Approximately 57,000 MT of stock valued at US$219.3 mn were produced in 2012. The segment
grew at 13.9% p.a over the past five years in value terms.
Stock(volume ‘000 MT) Stock (value term US$ Mn)
Source: Euromonitor Passport 2013
Number of players and market share
There are a limited number of stock producers in Indonesia. In total there are only five producers of
which the top two players hold 89% market share: Ajinomoto 57.4% share with its brand Masako;
Unilever 31.5% market share with its brand Royco. Both companies produce stocks and complete
19%
20%
30%
20%
10% 1%
A1 (>IDR 1.5Mn)
A2 (IDR 3-4.5Mn)B (IDR 2-3Mn)
C1 (IDR 1.5-2Mn)C2 (IDR 1-1.5Mn)D (IDR 0.7-1Mn) 0 100 200
SES A
SES B
SES C1
SES C2
SES D
SES E
packs/person
39.3 41.1 42.7 47
51.8
57
0
10
20
30
40
50
60
2007 2008 2009 2010 2011 2012
Sale
s (v
olu
me
te
rm ‘0
00
to
ns)
114.3 128.9
142.8
164.2
190.5
219.3
0
50
100
150
200
250
2007 2008 2009 2010 2011 2012
Sale
s (v
alu
e t
erm
US$
Mn
)
Market Segment by SES
Instant noodle consumption by
SES class (packs/person/year)

37
food seasonings. Other producers are far smaller and mostly produce only complete food
seasonings.
Stock market share by value (2012)
Source: Euromonitor Passport 2013
All stock producers are located in the Greater Jakarta area and only one company has a factory in
the Greater Surabaya area.
Stock factory location
Source: Clarity Analysis based on survey results and websites
Industry trends
Current players are expected to dominate the market over the medium term but are not expected to
add additional factories.
Large producers typically produce a range of stocks and complete food seasoning. Complete food
seasoning is more popular that stock. The most popular package sizes are 8 g powder sachets.
Ajinomoto 57.4%
Unilever, 31.5%
Nestle, 5.2%
Indofood, 3.5%
Others, 2.4%

38
Types of packaging for stock
Form Packaging Size Customers / Users
Cube PET Bottle 4g x 25 or 4gr x 50 Household
Powder Sachet 8g, 50gr, 100gr Household
Liquid /Gel Stick Sachet 128 g Household
Source: Clarity Analysis based on interviews with producers
Consumer market segments
Stock and complete food seasonings are consumed by most Indonesian households. Typically the
middle to low income households will use stocks and complete food seasoning in powder form while
the upper middle income households favor seasonings in gels and cubes.
Per capita consumption
Average per capita consumption is 0.2kg per annum of stock and complete food seasoning.
Population reach
Stocks and food seasonings are primarily sold in single serving powder sachets and are readily
available in all types of retail outlets from small kiosks through to the large hypermarkets.
Unilever and to a lesser extent Ajinomoto have very broad distribution networks and do penetrate
most of Indonesia.
Iodized salt usage interview results
Clarity interviewed two stock manufacturers including one of the major players. Combined, both
players held 36.7% market share of the stock segment and consumed 13,000 MT of salt in 2012.
One of the largest producers declined to participate in the survey. Results for the surveyed
companies may not be representative of the whole stock segment as only 36.7% of segment
participated in the survey.
Iodized salt usage
One producer used iodized salt while the other producer used non-iodized salt.
The producer using non-iodized salt stated that this was because 1) it simplifies the supply chain
management to purchase only one type of salt for a number of different products and 2) it is
possible for them to do this because there is no legal requirement to use iodized salt. The company
stated that they needed to use non-iodized salt in margarine production since they believed iodized
salt affected the product quality. The company believes that the Government should focus on law
enforcement of table salt as most households use salt in the cooking preparation, rather than
requiring food processors to use iodized salt. However, if the regulations are changed, they would
comply with using iodized salt in stock production.
Source of salt
Both producers use imported salt. Both companies purchase from domestic suppliers, in addition
one producer imports a small quantity of salt directly from China.

39
40% 60%
Modern Trade General Trade
Salt and potential iodine content per serving
Stock has a much higher salt content compared to other products with 1.6 g per serving size,23
equivalent to 54.2% of the product weight. If stock is produced using only adequately iodized salt,
the potential iodine from one serving would be at least 29µg or 20% of daily iodine intake
requirement. In terms of potential average daily iodine intake over the year from stock, this would
vary from less than 1µg (SES class C consumers) iodine to 13µg iodine (SES class A consumers),
based on per capita consumption per SES class, listed below.
SNI
The producer that uses iodized salt has an SNI for its stock but does not list iodized salt on the food
label.
Food labeling
Neither producer lists iodized salt or fortified materials in their ingredients list. If required by law
both companies stated they would label iodized salt.
Value added of listing iodized salt
Both companies considered that labeling iodized salt would not result in consumer perception of
added value as consumers do not read the ingredient list.
Distribution channel
Only one producer gave details on their distribution channel with 40% of their stock sold through
modern trade outlets (minimarkets, hypermarkets and supermarkets); with 40% of this sold in Java,
20% in Sumatra and 15% in Sulawesi.
Based on results with one producer only which has nationwide coverage
Source: Clarity Analysis based on survey results
Market segment
Stock producers that participated in the survey claimed that 60% of stock are consumed by SES A
and B.
23Estimated average serving size is 3g
40%
20%
15%
10%
10% Java
Sumatra
Sulawesi
Kalimantan
Others
Stock distribution channel Stock distribution by region (%)

40
Source: Survey interviews and Roy Morgan Research
Soy sauce – market overview and iodized salt usage
Introduction
Soy sauce includes sweet and savory soy sauce. It is estimated that sweet soy sauce accounts for
80% of production. Sweet soy sauce is Indonesian’s favorite condiment used by most Indonesian
households as a cooking ingredient as well as a condiment to add flavor and color to dishes.
Market size
The total soy sauce market size in Indonesia is 230,000 MT, valued at US$370.6 Mn in 2012. The soy
sauce segment has grown by 10% p.a from 2007 to 2012 in value terms.
Volume of soy sauce sales (Volume ‘000 MT)
Value of soy sauce sales (Value term US$ Mn)
Source: Euromonitor Passport 2013
Number of players and market share
There are more than 400 soy sauce producers in Indonesia, of which more than 60% are home
industries producing small quantities for their local market, with only a few large national sized
players. Excluding the home industry producers, the top five national producers hold 94% market
share.
20%
20%
20%
10%
10%
10%
10%
Market segment by SES
A1 (>IDR 1.5Mn)
A2 (IDR 3-4.5Mn)
B (IDR 2-3Mn)
C1 (IDR 1.5-2Mn)
C2 (IDR 1-1.5Mn)
D (IDR 0.7-1Mn)
E (<IDR 0.7Mn)0 0.2 0.4
SES A
SES B
SES C1
SES C2
SES D
SES E
kg/person
Stock consumption by SES class (kg/person/year)
0
50
100
150
200
250
2007 2008 2009 2010 2011 2012
Sale
s (v
olu
me
te
rm ‘0
00
to
ns)
0
50
100
150
200
250
300
350
400
2007 2008 2009 2010 2011 2012
Sale
s (v
alu
e t
erm
US$
Mn
)
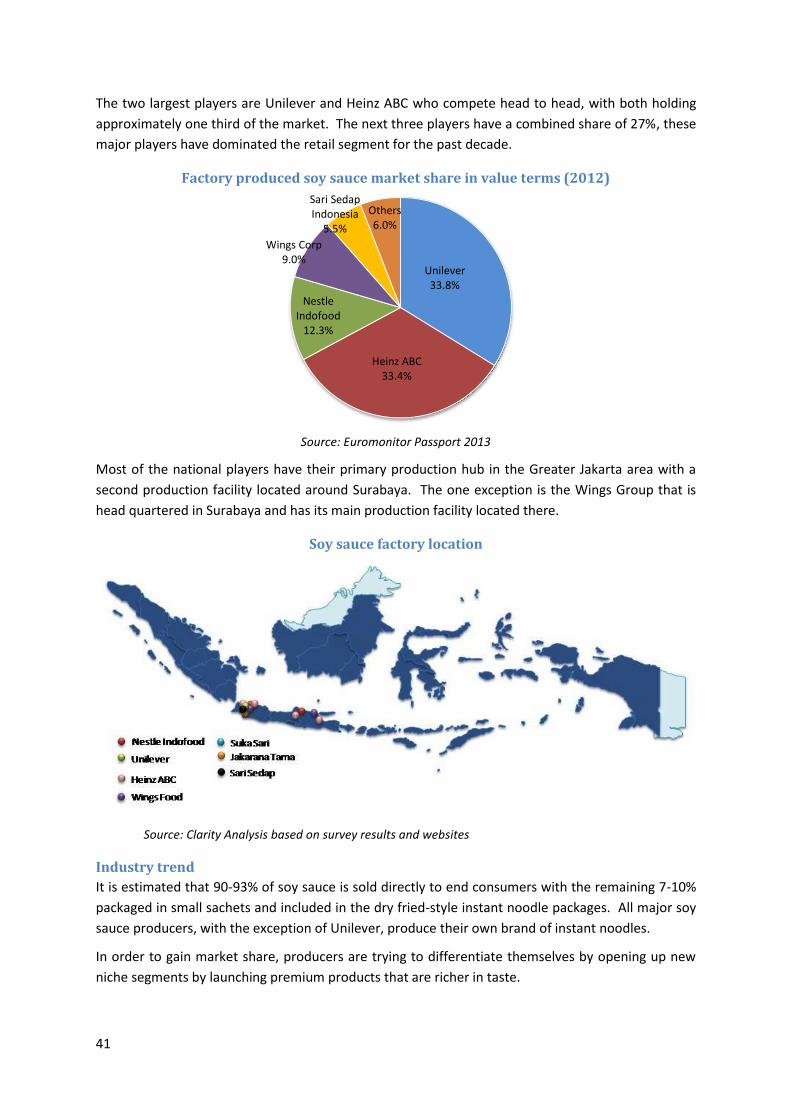
41
The two largest players are Unilever and Heinz ABC who compete head to head, with both holding
approximately one third of the market. The next three players have a combined share of 27%, these
major players have dominated the retail segment for the past decade.
Factory produced soy sauce market share in value terms (2012)
Source: Euromonitor Passport 2013
Most of the national players have their primary production hub in the Greater Jakarta area with a
second production facility located around Surabaya. The one exception is the Wings Group that is
head quartered in Surabaya and has its main production facility located there.
Soy sauce factory location
Source: Clarity Analysis based on survey results and websites
Industry trend
It is estimated that 90-93% of soy sauce is sold directly to end consumers with the remaining 7-10%
packaged in small sachets and included in the dry fried-style instant noodle packages. All major soy
sauce producers, with the exception of Unilever, produce their own brand of instant noodles.
In order to gain market share, producers are trying to differentiate themselves by opening up new
niche segments by launching premium products that are richer in taste.
Unilever 33.8%
Heinz ABC 33.4%
Nestle Indofood
12.3%
Wings Corp 9.0%
Sari Sedap Indonesia
5.5%
Others 6.0%

42
Consumer market segments
Indonesians typically consume sweet soy sauce either as a condiment or in instant noodles.
Soy sauce reaches most Indonesians since it is distributed through both the general trade channel
(60%) and the modern trade channel (40%) in various sized packages. To reach the upper income
groups some companies have launched premium products that are sold only in modern trade
outlets.
Per capita consumption
Per capita consumption of soy sauce is 0.94kg per annum.
Population reach
Almost all Indonesians across Indonesia consume soy sauce, either choosing nationally-produced
brands or a local brand that is well known in the area. Several well-known local brands include Maja
(West Java), Benteng (Banten), Sukasari (Central Java), and Sate (East Java), Zebra (West Java).
Iodized salt usage interview results
Clarity interviewed four soy sauce manufacturers including the market leaders that produce both
sweet and savory soy sauce with sweet soy sauce estimated at 80% of production.
Iodized salt usage
Some soy food producers are reluctant to use iodized salt for fermenting soy as they believe that
iodine affects the fermentation process. However, once the soy is fermented iodized salt can be
used in the production of soy sauce.
Two producers (2/4) claim they only use iodized salt while one producer (1/4) does not use iodized
salt and one producer (1/4) uses non-iodized salt for soy fermentation and iodized salt for soy sauce
production.
Interviewed companies accounted for 82% of soy sauce market share and consumed11,608 tons of
salt in 2012.
Source of salt
75% (3/4) of producers only use imported salt purchased from domestic salt producers. One
producer also imports directly from China. One company uses both domestic and imported salt
however domestically produced salt accounts for less than one percent of salt consumption.
Salt content per serving
Soy sauce has 1.2 gram of salt per serving size,24 equivalent to 8% of product weight. If all soy sauce
was produced using adequately iodized salt then it could provide at least 22µg iodine, equivalent to
14% of an adult’s daily intake requirement. In terms of potential average daily iodine intake over the
year, this would vary from around 1.5µg iodine (SES class E consumers) to at least 3µg iodine (SES
class A consumers), based on per capita consumption per SES class, listed below).
SNI
All companies using iodized salt have an SNI but none list iodized salt on the label.
24Average serving size is 15g

43
40% 60%
Soy sauce distribution channel
Modern Trade General Trade
Food labeling
None of the companies list iodized salt or fortified materials in their ingredient list.
Value added of listing iodized salt
None of producers perceive that labeling for iodized salt would affect consumers’ perception of the
product value, since they do not believe that consumers read the ingredient list.
Distribution channel
Soy sauce producers’ channel 60% of total production through general trade and 40% through
modern trade.43% of all soy sauce is distributed in Java and another 27% is distributed in Sumatra.
Source: Clarity Analysis based on survey results
Market segment
38% is consumed by SES C, a further 38% is consumed by SES A and B combined.
Source: Interviews and Roy Morgan
Chili sauce – market overview and iodized salt usage
Introduction
Indonesians’ second most popular condiment is chili sauce. Traditionally Indonesian housewives
would make homemade chili sauce but due to changing lifestyles most Indonesians now rely on
factory produced chili sauce.
43%
27%
15%
7% 8%
Soy sauce distribution by region (%)
Java
Sumatra
Sulawesi
Kalimantan
Others
7%
11%
20%
19%
19%
19%
6%
Market segment by SES
A1 (>IDR 1.5Mn)
A2 (IDR 3-4.5Mn)
B (IDR 2-3Mn)
C1 (IDR 1.5-2Mn)
C2 (IDR 1-1.5Mn)
D (IDR 0.7-1Mn)
E (<IDR 0.7Mn) 0 0.5 1
SES A
SES B
SES C1
SES C2
SES D
SES E
kg/person
Soy sauce consumption by SES class (kg/person/year)

44
Market size
The total chili sauce market size for Indonesia was approximately 83,000 MT in 2012 with 67% sold
to end consumers and 33% included as small sachets in instant noodle packages. The retail value of
chili sauce sold direct to consumers is US$147.3mn with the segment growing by 14% p.a in value
terms.
Volume sales of chili sauce (Volume ‘000 MT)
Value sales of chili sauce (Value term US$ Mn)25
Source: Euromonitor Passport 2013 and Clarity Analysis
Number of players and market share
Indonesia has more than 20 companies producing chili sauce however most produce unbranded or
private label brands. Nationally there are only 3-5 large sized companies.
The top two producers, Heinz ABC and Nestle Indofood control more than 90% share of the chili
market. Heinz ABC is the market leader with 60% share followed by Nestle Indofood with 30%.
There are several other national players including La Salle Foods, Sari Sedap Indonesia, Sekar Laut,
and others.
Factory produced chili sauce market share in value terms (2012)
Source: Euromonitor Passport 2013
Chili sauce factories are mostly located in the Greater Jakarta and Greater Surabaya areas.
25Excludes soy sauce packed in instant noodles.
0
20
40
60
80
100
2007 2008 2009 2010 2011 2012
Sale
s (
volu
me
te
rm t
on
s /
year
)
Retail Instant Noodles
0
20
40
60
80
100
120
140
160
2007 2008 2009 2010 2011 2012
Sale
s (v
alu
e t
erm
US$
Mn
)
Heinz ABC, 60%
Nestle Indofood,
30%
Others, 10%

45
Chili sauce factory location
Source: Clarity Analysis based on survey results and industry websites
Industry trend
Most producers are currently operating below full capacity but indicated that they will expand once
their facilities are running close to full capacity.
Consumer market segment
Virtually all Indonesians eat chili as a condiment either as a homemade ground chili paste (sambal)
or factory produced chili sauce. Typically, the urban middle class prefer chili sauce as it is more
convenient than making their own sambal, while the urban lower and upper class and rural
consumers will prefer to make their own sambal.
Traditional restaurants typically offer customers a choice of sambal and factory produced chili sauce
while fast food restaurants will only offer factory produced chili sauce.
Per capita consumption
Per capita consumption of chili sauce is 0.34kg per annum.
Population reach
Factory-produced chili sauce is primarily sold in urban and semi-urban areas and can easily be found
in modern trade and general trade establishments. Chili sauce sachets packed in instant noodle
packages will have a wider distribution reach due to the distribution networks of major instant
noodle producers.
Iodized salt usage interview results
Clarity interviewed six chili sauce manufacturers accounting for 94% of production. Combined, the
six producers consume 2,974 tons of salt.
Iodized salt usage
All companies interviewed use iodized salt.

46
53% 47%
Chili sauce distribution channel
Modern Trade General Trade
Source of salt
The two market leaders and one small player use imported salt. Other small players use locally
produced salt as it is cheaper than imported salt.
Salt content per serving
Similar to soy sauce, the salt content of chili sauce averages 1.2 g per serving size26 equivalent to
4.4% of product weight. Similarly to soy sauce, if the salt used in production of chili sauce was all
adequately iodized it would contribute 4 µg or 3% of an adult’s adequate daily iodine intake. Across
the income levels this would range from 0.5µg iodine (SES class E and C consumers) to at least 1.2µg
iodine (SES class A consumers), based on per capita consumption per SES class, listed below.
When considering the additional salt and iodine from all these products together, there will be some
overlap between salt (and potential iodine from iodized salt) in chili sauce and in instant noodles,
since instant noodle data already accounts for the salt in chili sauce used in the final product.
SNI
Five out of six producers have an SNI but again none list iodized salt.
Food labeling
None of the companies list iodized salt or fortified materials in their ingredient list.
Value added of listing iodized salt
Only one company (a small player), considers that including iodized salt on the label would increase
consumers’ perception of the product value. Other producers perceive that it would not change
consumers’ perception of the product value since they believe that consumers do not read the
ingredient lists.
Distribution channel
Chili sauce producers channel 53% of total production through modern trade and 47% through
general trade. 55% of chili sauce is distributed in Java and another 21% is distributed in Sumatra.
Source: Clarity Analysis based on results of interviews with producers
26Estimated average serving size of 5g
55%
21%
9%
5% 10%
Chili sauce distribution by region (%)
Java
Sumatra
Sulawesi
Kalimantan
Others

47
Market segment
34% of chili sauce is consumed by SES C, 22% is consumed by SES A and another 20%is consumed by
SES B.
Source: Interviews and Roy Morgan Research
Biscuit – market overview and iodized salt usage
Market Size
The total biscuit market size in Indonesia in 2012 was 249,000 MT valued at US$1.2bn. In value
terms the biscuit industry has been growing 8.8% in value term.
Biscuit sales volume terms ( ‘000MT)
Biscuit sales value terms (US$ Mn)
Source: Euromonitor Passport 2013
Number of players and market share
There are more than 100 biscuit manufacturers with four major players including Khong Guan,
Mayora, Kraft and Orang Tua Group.
Kraft has the biggest market share of biscuits in Indonesia with 19%, followed by Mayora with 17%.
9%
13%
20%
17%
17%
17%
6%
Market segment by SES
A1 (>IDR 1.5Mn)
A2 (IDR 3-4.5Mn)
B (IDR 2-3Mn)
C1 (IDR 1.5-2Mn)
C2 (IDR 1-1.5Mn)
D (IDR 0.7-1Mn)
E (<IDR 0.7Mn) 0 0.2 0.4 0.6
SES A
SES B
SES C1
SES C2
SES D
SES E
kg/person
Chili sauce annual consumption by SES class
(kg/person/year)
0
50
100
150
200
250
300
2007 2008 2009 2010 2011 2012
Bis
cuit
Sal
es
('0
00
to
ns)
0
200
400
600
800
1,000
1,200
1,400
2007 2008 2009 2010 2011 2012
Bis
cuit
Sal
es
(US$
Mn
)

48
Biscuit market share in value terms (2012)
Source: Euromonitor Passport 2013
Most of the biscuit producers are located in the Greater Jakarta and West Java area with only Khong
Guan having a third factory in East Java.
Biscuit factory location
Source: Clarity Analysis based on survey results and websites
Industry trends
Biscuit production is expected to increase 3-5% p.a over the next five years with the large mass
producers gaining more market share. Home industry producers increasingly struggle to compete in
the sector and are increasingly being replaced by small mass produced biscuit brands that more
effectively develop brands and distribution networks. Large mass produced brands are expected to
dominate the business segment for the foreseeable future and several are expected to expand
production facilities within the next few years to keep up with growing demand.
Biscuit producers are increasingly packaging biscuits in single portion sizes that are both more
convenient and affordable.
Kraft 19.5%
Mayora 17.3%
Khong Guan 15.2%
Ultra Prima (Orang Tua)
10.9%
Arnotts 6.3%
Garuda Food 6.1%
Others 24.7%

49
Consumer market segments and population reach
Virtually all Indonesians, regardless of age, income or location consume biscuits. Lower income
groups and those located in semi-rural areas typically favor home industry made biscuits while upper
income groups from urban areas prefer branded biscuits.
Per capita consumption
Although the biscuit market is large in Indonesia, per capita consumption remains low at just over
1.3 kilogram per capita per annum. Indonesia per capita biscuit consumption is similar to India but
still below most of ASEAN countries (with per capita consumption 1.9-5.2kg / per annum) and
Western countries such as Western Europe, North America and Australia where per capita
consumption can reach 6.5-7.5kg / per annum. Data on consumption by SES27 indicates even lower
per capita consumption.
Biscuit per capita consumption (kg)
Source: Mintel Global Market Navigator
Iodized salt usage interview results
Clarity interviewed three biscuits producers accounting for 37.5% share of the biscuit segment.
Combined, the companies used only 702 tons of salt in 2012.It should be cautioned that the results
may not be representative of the whole biscuit segment as the sample size was less than 40%.
Iodized salt usage
All companies surveyed used iodized salt.
Source of salt
All biscuits producers purchased imported salt from domestic suppliers as it has better quality than
local salt.
Salt content per serving
Salt content of biscuits averages 0.5 g per serving size equivalent to 1.8% of product weight. If the
salt used in production of biscuits was all adequately iodized it would potentially contribute at least
8 µg of iodine per serving,28or 6% of an adult’s adequate daily iodine intake.
27 Roy Morgan research
28Estimated average serving size of 25g
10 10
5.2
4.1 4 3.6
2 1.9 1.3
0.2
0
2
4
6
8
10
Kg
pe
r an
nu
m

50
57% 43%
Biscuits distribution channel
Modern Trade General Trade
SNI
None of the biscuits producers have SNI for their products.
Food labeling
None of the companies list iodized salt or fortified materials in their ingredient list.
Value added of listing iodized salt
Two large producers companies perceive that it would bring added value to include iodized salt on
the label as urban dwellers are health conscience. One mid-sized producer does not consider
labeling iodized salt will provide any added value as consumers do not look at the ingredients.
All companies would willingly label if legally required to do so.
Distribution channel
Biscuits producers channel 57% through modern trade and 43% through general trade. Some 47% of
biscuits are distributed in Java and 18% in Sumatra.
Source: Clarity Analysis based on survey results
Market segment
59% of biscuits nationally are consumed by SES A, B and C according to these data below. However,
the overall quantities are not in line with other data from Mintel Global Market Navigator that
estimates consumption to be 1.3kg/pers/year.
Source: Interviews and Roy Morgan Research
47%
18%
15%
10%
10%
Biscuits distribution by region (%)
Java
Sumatra
Sulawesi
Kalimantan
Others
9%
13%
16%
21%
15%
15%
10%
Market segment by SES
A1 (>IDR 1.5Mn)
A2 (IDR 3-4.5Mn)
B (IDR 2-3Mn)
C1 (IDR 1.5-2Mn)
C2 (IDR 1-1.5Mn)
D (IDR 0.7-1Mn)
E (<IDR 0.7Mn)0 0.2 0.4
SES A
SES B
SES C1
SES C2
SES D
SES E
kg/person
Biscuit consumption by SES class (kg/person/year)

51
Bread – market overview and iodized salt usage
Market size
The size of the bread segment in Indonesia is 223,000 MT valued at US$430 million in 2012 with a
volume growth of 12.5% per annum over 2007-2012 in value term.
Bread sales in volume terms (‘000 MT)
Bread sales in value terms (US$ Mn)
Source: Euromonitor Passport 2013
In Indonesia there are three types of bread producers:
i) Home/small bakeries;
ii) Mass produced / industrial
iii) Boutique bakeries.
Home / small bakeries still dominate and account for 80% of the market share, with industrial and
boutique bakeries accounting for the remaining 20%. The balance of market share is expected to
change over the next five years to an increasing contribution from the industrial bread sector.
Current bread share by category 2012 Forecasted bread share by category 2017
Source: Nippon Indosari
0
50
100
150
200
250
2007 2008 2009 2010 2011 2012
Bre
ad S
ale
s ('
00
0 t
on
s)
0
100
200
300
400
500
2007 2008 2009 2010 2011 2012B
read
Sal
es
(US$
Mn
)
60-70%
20-30%
10%
Home / small bakeries
Mass production
Boutique
80%
10% 10%
Home / small bakeries
Mass production
Boutique

52
Number of players and market share
It is estimated that there are about 5,000 home bakeries supplying unpackaged bread within local
areas (catchment area of less than 10km). In contrast, industrial bakeries have only been present in
Indonesia for less than 20 years and account for only 10% market share. Industrially-produced bread
has a longer shelf life, of four days, that permits distribution up to 200-300km from the factory.
Boutique bakeries also account for 10% market share, these are popular in urban areas and usually
have franchise outlets located in malls with small catchment area.
Type of bread producers and their distribution reach
Home / Small Industries
80%
Mass Production
10%
Boutique Bakery
(10%)
Many Players (5,000) 10-15 players Franchise Format
Distribution coverage:
5-20km
Distribution coverage:
200-300 km
Permanent Shop
No branding Branding Franchising / Branding
Source: Nippon Indosari
Currently the major player is Nippon Indosari (brand: Sari Roti) which has approximately 90% market
share. The remaining 10% share is distributed between other brands such as Le Gitt, Sharon,
Swanish, Maxim, Lees, Holland Bakery, Dynamic etc.
Bread market share in value terms (2012)
Source: Nippon Indosari, Clarity Analysis
Most of the bread factories are located in the Greater Jakarta area with only Nippon Indosari
opening factories across Indonesia.
Sari Roti , 90% Other, 10%
Sari Roti
Le Gitt
Swanish
Maxim
Sharon
Lees
Dynamic
Lauw
Others

53
Bread factory location
Source: Clarity Analysis based on survey results and websites
Types of bread produced by industrial bakeries
Industrial bakeries focus on two types of bread – sliced bread and sweet bread. Sliced bread
remains the most popular, accounting for 68% of industrial bakery production; however Nippon
Indosari noted there was a regional difference with consumers in East Java preferring sweet bread to
sliced bread.
Types of bread produced
Type of Bread Variants Share
Sliced Bread Milk, Regular, Wheat, Flavored, without crust etc.
68%
Sweet Bread Filled-in bread, Tear-off bread, sandwich, etc.
31%
Source: Clarity Analysis
Industrial bakeries produce primarily white bread with only a few premium bakeries producing
whole meal bread that is primarily sold to upper-income consumers.
Industry trends
The bread segment is expected to grow by 5.5%p.a over the next five years to reach 285,400 MT.
Convenience of bread as an instant meal / snack is the key driver behind growth. By 2017, industrial
bakeries are expected to more than double their market share to 20-30% at the expense of small /
home bakeries as consumers switch to branded bread with a longer shelf life.
Nippon Indosari is expected to remain the market leader in the industrial bread segment as it is the
only bakery with nationwide distribution with seven factories serving all of Indonesia’s major cities
,as well as being the only bakery that covers both the modern and traditional trade segments. Other
industrial bakeries will either have to focus on niche markets or compete with Nippon Indosari by
expanding their distribution network by adding new factories as well as broadening their distribution
reach to cover traditional as well as modern trade outlets.
In terms of taste, Indonesians are expected to continue to favor white sliced bread.

54
Consumer market segments
Home/small bakeries typically target lower to middle income consumers who want to purchase fresh
bread from their neighborhood. Industrial bakeries and boutique bakeries target middle and upper
income consumers.
Nippon Indosari targets the middle class with its products widely available through modern
trade outlets (mini-markets, supermarkets and hypermarkets), cycle vendors and small general
trade outlets.
Le Gitt targets the premium segment with its bread only available in premium supermarkets.
Bread preference by consumer group
Categories Lower Middle Upper
Home/small bakeries √ √
Mass production √ √
Boutique bread √ √
Source: Clarity Analysis based on survey results
Per capita consumption
Indonesians per capita consumption of bread has risen from 1.5kg in 2008 to 1.9kg in 2012 and is
expected to continue rising at a similar pace.
Indonesia’s bread consumption (1.9kg / capita) is one of the lowest in the region and is similar to
Taiwan and far lower than in Singapore (14.9kg / capita) and Malaysia (6kg / capita).
Bread consumption per capita (kg / year)
Country comparison on bread per capita consumption (kg / year)
Source: Nippon Indosari, Pefindo
There is a noticeable drop in demand for bread products during the month of Ramadan as
Indonesian prefer to eat rice based meals to sustain them through the fasting hours.
1.5 1.6
1.7 1.8 1.9
0.0
0.5
1.0
1.5
2.0
2008 2009 2010 2011 2012
Kg
pe
r an
nu
m
0
2
4
6
8
10
12
14
16
Kg
/ ye
ar

55
Population reach
Small bakeries and boutique bakeries have small catchment areas of typically less than 5km,
whereas the catchment area of an industrial bakery can extend up to 200-300km as the bread has
longer shelf life.
Currently, all industrial bakeries with the exception of Nippon Indosari only have one production
facility located within the Greater Jakarta area and primarily target the city. Nippon Indosari has
seven factories and can cover all of Indonesia’s major cities.
Most industrial bakeries primarily target the modern retail segment, again Nippon Indosari is the
main exception as it retails its products through bicycle bread sellers and small general trade outlets
as well as through modern trade outlets.
Iodized salt usage interview results
Clarity interviewed two bread manufactures accounting for 90-92% share of the industrial bread
segment or 9% of the total bread market. Combined the companies used only 590 tons of salt in
2012.
Both bread producers use iodized salt.
Source of salt
The market leader in the bread segment uses a combination of local and imported salt while the
smaller player uses only imported salt.
Salt content per serving
Similar to biscuits, salt content in bread is approximately 1.5% per portion on average. Based on
available data the iodine levels per serving cannot be calculated.
SNI
None of the bread producers have SNI for their products.
Food labeling
None of the companies list iodized salt or fortified materials in their ingredient list.
Value added of listing iodized salt
None of producers consider labeling iodized salt will provide any perceived additional value to the
consumer, since it is believed that consumers do not look at the ingredients. All companies would
willingly include iodized salt on their label if legally required to do so.
Distribution channel
Bread producers interviewed channel 80% of total production through modern trade channels and
20% through general trade. 83% of bread is distributed in Java and another 12.5% is distributed in
Sumatra.

56
80% 20%
Bread distribution channel
Modern Trade General Trade
Source: Clarity Analysis based on survey results
Market segment
39% of bread packs are consumed by SES A, 30% are consumed by SES B and other 30% are
consumed by SES C. These data currently have limited meaning given that the size of a pack has not
been well-defined within the industry.
Source: Interviews and Roy Morgan Research
83%
12.50%
3%
1.50%
Bread distribution by region (%)
Java
Sumatra
Sulawesi
Others
19%
20%
30%
20%
10%
1%
Market segment by SES
A1 (>IDR 1.5Mn)
A2 (IDR 3-4.5Mn)
B (IDR 2-3Mn)
C1 (IDR 1.5-2Mn)
C2 (IDR 1-1.5Mn)
D (IDR 0.7-1Mn)
E (<IDR 0.7Mn) 0 2 4 6
SES A
SES B
SES C1
SES C2
SES D
SES E
packs/person
Bread consumption by SES class (packs/person)

57
5.0 CONCLUSIONS
The use of iodized salt in the production of these six key processed foods which have high market
penetration has the potential to at least partially protect the population consuming these products
from iodine deficiency, which would be particularly beneficial for population groups who do not
have access to adequately iodized table salt.
Above findings indicate that, if all salt in these products was iodized, one serving of instant noodles
could contribute 36% of the recommended adequate daily iodine intake for adults (150µg), this
would be higher if the iodine content of salt used is above the minimum of 18ppm. Similarly, one
serving of stock could contribute to 20% of recommended adequate iodine intake, soy sauce 14%,
biscuits 6% and chili sauce 3%. Using average annual per capita intakes, this would mean up to 6.3%
of recommended adequate daily iodine intake from instant noodles for adults per day across the
population (the average per capita intake for other products ranged from 0.2% for chili sauce to 4%
for stock).
Information from companies participating in the survey indicate that 71% of salt used by these
companies for production of the six selected food types is already iodized. Extrapolating from the
results based on reported market share for these industries would suggest that at least 65% of salt
used by these key processed food industry segments is iodized (possibly higher is any of the non-
participating companies use iodized salt in their product).
There is currently no legal requirement for processed food industries to use iodized salt in their
production process. Although the Government passed Presidential Decree 69 / 1994, the Ministry of
Industry has not issued implementing regulations for industrial salt for food industries which would
make it mandatory for food industries to use iodized salt.
Most food producers that participated in the survey willingly use iodized salt. This may be because
these producers are under the impression that they are required by law to use iodized salt, or may
do so because they recognize that there are significant health benefits to consumers in the use of
iodized salt. The inclusion of information on product labels about iodized salt as a product ingredient
may help both producers and consumers recognize this added value, although the majority of
producers who participated in the survey did not think consumers give much attention to product
labeling. A minority of companies gave reasons (cost and supply chain) for their decision not to use
iodized salt and understood that the regulatory environment allowed them to make this choice.
Non-users of iodized salt participating in the survey, indicated that they would only switch to using
iodized salt if the Ministry of Industry issues implementing regulations for Presidential Decree 69 /
1994 making it mandatory for processed food industries to use iodized salt. They suggested that,
prior to issuing an implementing regulation an assessment should be made on whether any food
categories should be exempted from using iodized salt if there is evidence that it interferes with the
production process.
An alternative could be that the Government could require that key processed food products are
required to have an SNI (Indonesian National Standard) certificate, which as a pre-requisite requires
the producers to use iodized salt.

Iodized Salt in Processed Food
58
APPENDIX 1: SNI
Indonesian National Standard (SNI) is an accreditation given by the Indonesian National
Standardization Agency (BSN). SNI has three objectives:
Increase protection for consumers, business players, workers and the general public in terms of
safety, security, healthy and environmental sustainability
Support trade
Create healthy competition between players
Currently 26429 products, services and institutions must have a mandatory SNI in order to be sold in
Indonesia. In addition, a further 7,95830 products, services and institutions have SNI guidelines and
companies can undergo SNI accreditation on a voluntary basis.
Within the food category, table salt was first product to require a mandatory SNI in 1995 with the
key requirement that the table salt be iodized. In 2009, the Ministry of Industry expanded
mandatory SNI to a further five food and beverage products including:
1. Flour for food product ingredients
2. Refined sugar
3. Cacao powder
4. Packaged water
5. Natural mineral water
The Ministry of Industry is currently discussing further expanding mandatory SNI to an additional six
food and beverage products including:
1. Instant noodles
2. Biscuits
3. Palm oil
4. Milk powder
5. Sweet condensed milk
6. Dew drinking water
The Ministry of Industry aims to have the regulation passed prior to the start of the ASEAN Economic
Community in 201531.
BSN has issued SNI guidelines for all six food products32 covered by this survey and as such food
producers can opt to undertake SNI accreditation for these product on a voluntary basis.
29 www.bsn.go.id
30www.bsn.go.id
31Kontan article, 25 November 2013
32SNI 3551-2012: Instant noodles
SNI 01-4218-1996: Broth and consommé (stock) SNI 01-3543-1999: Soybean sauce SNI 01-2976-2006: Chili sauce SNI 2973:2011: Biscuit SNI 01-3840-1995: Bread

Iodized Salt in Processed Food
59
The SNI guidelines are very detailed but the key requirement for products to meet SNI standard are
that:
Food ingredients must be fortified
o Salt must be iodized
o Flour must be fortified with iron
Final products must use SNI certified ingredients
o Instant noodles must use SNI certified ingredients including salt and flour which by
definition must be fortified
Food producers that have achieved SNI accreditation can use the SNI logo on the food packaging
which gives customers assurance that the products are high standard and use only good quality
ingredients.

Iodized Salt in Processed Food
60
APPENDIX 2: DISCUSION GUIDE
Iodized salt in processed food
Discussion Guide (Food Manufacturer)
Company :
Address :
Phone Number :
Email :
Respondent Name :
Division :
Interview Date :
Interviewer Name:
Opening
Thank you for taking time off to participate in our study. As per the email / fax we sent, we are
currently conducting a study on “Iodized Salt in Processed Food” for the Ministry of Health,
Direktorat Bina Gizi Masyarakat. This study is to help us to get an overview of iodized salt in
processed food consumption in Indonesia and how to develop strategies in order to improve the
public nutrition in Indonesia. All information will be kept strictly confidential.
GENERAL INFORMATION
1. Which products do you produce (from selected categories)?
2. How much (ask for units) do you produce (per annum or per month)?
3. What are you key brands?
4. Do you know your market share (for company or brands)?
5. Do you have an SNI for your products?
Please indicate for each product category
Tons Packs Pieces
Annually Monthly Daily

Iodized Salt in Processed Food
61
Instant
Noodles Soy Sauce Chili Sauce Stock Soup Biscuit Bread
Production Volume
Key brands
Market share
SNI
Amount of salt per serving (in gms or %)
Production
We would like to understand a little bit about production of your company
1. What production facilities do you have?
2. What products do they produce?
3. What is your production capacity and actual production?
4. Do you have any plans to expand production?
Please indicate for each product category
Tons Packs Pieces
Annually Monthly Daily
Factory Name &Location
Products Produced
(one product per line)
Production Capacity
Production Volume
Expansion Plans
Use of iodized salt and fortified ingredients
Do you use iodized or non-iodized salt in your product?
a) Is there a difference between factories?
b) Does it vary according to product?
c) Does it vary according to brand?
Do you use fortified products? If yes, which products are fortified and with what?
Do you add micro-nutrients? If yes, what?

Iodized Salt in Processed Food
62
Factory Name
&Location
Products Produced
(one product per line)
Brand (If difference
in Iodized usage state on different
lines)
Iodized salt used in
production?
(Y all, Y partial, No)
If non-iodized
salt used, give 1-2 reasons
why?
If iodized salt is used Do you list
“iodized salt” in
package ingredients
If iodized salt is used
Do you include any informatio
n about iodine on the label?
Other fortified ingredients
Additional micronutrient fortification
Ingredient Fortificants Fortificants
e.g. flour/oil
e.g. iron, retinol (type and amount/g product)
e.g. iron, retinol (type and amount/g product)

Iodized Salt in Processed Food
63
If Iodized salt is not used or only partially used, what are the barriers to using iodized salt? (I.e.
product colour change, cost, taste, other) and how do you cope with it?
Barrier Why? Ways to cope with it?
1
2
3
Product labeling
Would you mind explain us about labeling practices for salt / fortified products? i.e.
a. If iodized salt is used in production process it is listed in product ingredients as
“iodized salt”?
b. And/or is iodine mentioned on the packaging as being value-added?
c. Do you refer to other fortified ingredients in the ingredients list or on the packaging?
Salt supplier
Who is your current salt supplier(s)?
a. Do you have different suppliers for different products? (i.e noodles, bread, biscuit, soy
sauce, chili sauce and stock soups)
b. Do you have different suppliers for different factories?
What kind of salt are they supplying (Iodized or non-iodized)?
How much do you purchase per annum from each supplier?
What is the PPM iodine of salt?
Is the salt domestically produced or imported?
Salt Supplier
Factory (All
factories, if not listed)
Products (Is it used for each product,
if not list)
Type of salt (iodized/non-
iodized)
Quantities purchased per annum
(metric tons)
PPM iodine
Domestically sourced (D) or imported (I)
QA / QC procedures
Do you have any QA /QC procedures of fortified raw materials?
Do you receive Certificate of Analysis from your supplier – what criteria is included?
What procedures does your company employ to ensure that fortified raw material meets your
expectation?
Average iodine content of salt for the last quarter?

Iodized Salt in Processed Food
64
Is it possible to have copies of the last three CoA certificates?
Iodized Salt Fortified ingredients
Use a QA/QC procedure
Certificate of analysis criteria
Procedures undertaken by your company to ensure the raw materials are in-line with expectations?
Average iodine content for last quarter
Copies of Real CoA
Does the government any inspections of your companies’ production process?
How frequently are these inspections made?
Who makes the inspections?
What is checked in the process?
Is Iodized salt checked?
Do you know how the Government stores the data?
Government Inspections of Production Process
Any inspections made?
If so how frequently?
Which Gov’t body makes the inspection?
What is checked in the process?
Is iodized salt checked?
If yes, how is it checked?
If yes, if feedback provided to the salt supplier?
How is the data stored by the inspection body?

Iodized Salt in Processed Food
65
Distribution and target segments
Where do you distribute your products?
Products Distribution Area Share
Island name
Island name
Island name
Island name
Island name
Island name
1. Instant Noodles ____% ____% ____% ____% ____% ____%
2. Soy Sauce ____% ____% ____% ____% ____% ____%
3. Chili Sauce ____% ____% ____% ____% ____% ____%
4. Stock ____% ____% ____% ____% ____% ____%
5. Biscuit ____% ____% ____% ____% ____% ____%
6. Bread ____% ____% ____% ____% ____% ____%
Do you have a maximum distribution area from your factory- if so how many km radius (______Km)
What channels are you using to distribute your products?
Products Channel Market
Modern Trade General Trade
Instant Noodles ____% ____%
Soy Sauce ____% ____%
Chili Sauce ____% ____%
Stock ____% ____%
Biscuit ____% ____%
Bread ____% ____%
For modern trade – do you mostly distribute to mini-market or supermarket / hypermarkets?

Iodized Salt in Processed Food
66
Are you targeting a particular segment? If so, can you kindly describe what segment are you
targeting for each product?
SES (Social Economic Status) – based on income level
Instant Noodles
Soy Sauce
Chili Sauce
Stock Biscuit Bread
A1(> IDR4.5Mn) ____% ____% ____% ____% ____% ____%
A2(IDR3,000,001- 4,500,000) ____% ____% ____% ____% ____% ____%
B (IDR2,000,001- 3,000,000)
____% ____% ____% ____% ____% ____%
C1 (IDR1,500,001-2,000,000) ____% ____% ____% ____% ____% ____%
C2 (IDR1,000,001- 1,500,000)
____% ____% ____% ____% ____% ____%
D (IDR700,001- 1,000,000) ____% ____% ____% ____% ____% ____%
E (<IDR 700,000) ____% ____% ____% ____% ____% ____%
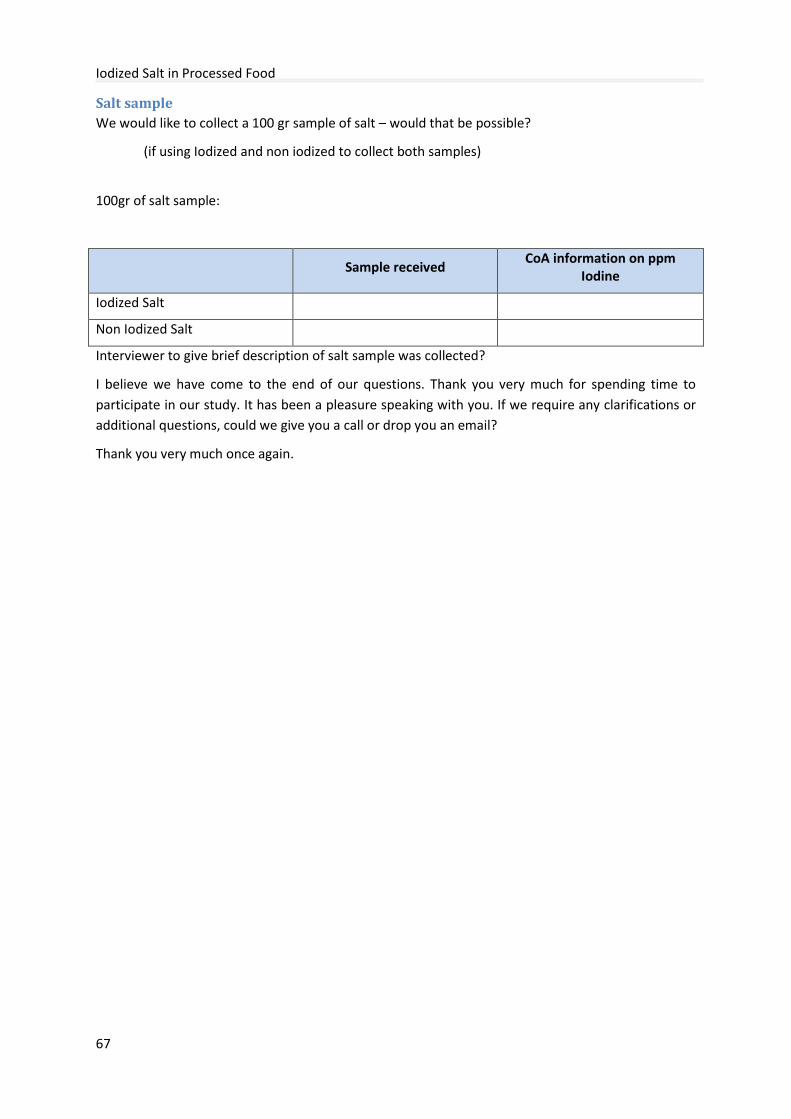
Iodized Salt in Processed Food
67
Salt sample
We would like to collect a 100 gr sample of salt – would that be possible?
(if using Iodized and non iodized to collect both samples)
100gr of salt sample:
Sample received CoA information on ppm
Iodine
Iodized Salt
Non Iodized Salt
Interviewer to give brief description of salt sample was collected?
I believe we have come to the end of our questions. Thank you very much for spending time to
participate in our study. It has been a pleasure speaking with you. If we require any clarifications or
additional questions, could we give you a call or drop you an email?
Thank you very much once again.

Iodized Salt in Processed Food
68
APPENDIX 3: SALT INSPECTIONS
Traditionally the Government only monitors table salt (not salt for the food industry) to ensure that
it meets the minimum iodine standard. The National Agency of Drugs and Food Control (BPOM)
together with the local government collect approximately 1,720 table salt samples per annum from
the table salt distributors that are then tested by BPOM to ensure the iodine content exceeds the
minimum requirement of 18 ppm (≥30 ppm KIO3). For samples failing to meet the minimum
standard BPOM will either issue a written warning to the responsible salt produce and/or provide
technical assistance to improve the quality. BPOM’s authority is somewhat limited as it is unable to
issue any sanctions against violators. Although the Ministry of Industry is one of the supervisory
bodies it does not participate in monitoring table salt.
Many of the salt producers interviewed by Clarity complained about sampling undertaken at the
distributors, rather than at the point of production, since there is a major problem of counterfeit salt
entering the distribution chain under the large producers’ brand names, which means that
legitimate producers receive the blame for failed samples which are potentially counterfeit.
For industry salt again BPOM and the Ministry of Industry are the supervisory bodies. BPOM carried
out its first limited assessment of food industry salt in 2012 by collecting 12 samplesfrom10
companies. Again, as there is no implementing regulation for food salt, BPOM undertook the data
collection for information purposes only. BPOM provided no details on the salt sampling method
from surveyed food producers. BPOM indicated that they intended to undertake annual sampling of
food producer salt but as of June 2013 had not yet collected any samples in 2013.
The Ministry of Industry and Ministry of Trade are the supervisory bodies for imported industrial
salt. Inspections are undertaken in ports custom area by two appointed assessors, however they are
only tasked with checking documentation including import license, import quotas and quantity
imported. The assessors are not responsible for carrying out any inspection of the salt quality
including the iodine level.

Iodized Salt in Processed Food
69
Iodine-related salt inspections implemented in 2012
Criteria Table Salt Industrial Salt
Food Imported
Supervisory body BPOM,
Ministry of Industry
BPOM,
Ministry of Industry
Ministry of Industry
Ministry of Trade
Inspector BPOM & Local Government BPOM & Local Government
Sucofindo
Surveyor Indonesia
Sample size Yes,
1,720 samples in 2012
Started in 2012
12 samples
NA
Sampling location Table Salt Distributor Food producer’ production plant
Port (at time of import)
Qualitative / quantitative Checks
KIO3exceeds 30 ppm (equivalent to 18 ppm iodine)
KIO3 exceeds 30 ppm (equivalent to 18 ppm iodine)
Documentation, quota allowance, import license.
Do not check quality or iodine levels
Sanctions (for iodization)
Written warning None
Data on iodine content for information only
Not relevant
Source: interview with Government departments including BPOM, Ministry of Industry and Ministry of
Trade; BPOM table salt survey results 2012; Clarity Analysis
Government Inspection Results
Table salt
Of the 1,722 samples of table salt collected from salt distributors in 2012, some 66% of samples met
the minimum iodine requirement of 18 ppm (using quantitative testing methodology). From the
33% failed samples, the majority (60.7%) had iodine in the range of 9-18 ppm; 34.4% had 1-9 ppm
and 4.9% had no iodine (0 ppm). From the failed samples there has been a noticeable improvement
in iodine levels with 60.7% of sample in the range of 9-18ppm compared to only 38.5% in 2011. The
number of salt samples with no iodine content (0 ppm) has remained fairly constant at just under
five percent.
Industrial salt for food industries
BPOM took 12 salt samples from 10 food processing companies in seven food segments and found
that 83% of companies’ samples had iodine levels above 18 ppm. Details of the food companies
surveyed including food category, size and salt supplier are found in the following table. Data were
not provided on the results of these tests so it is not known which tests were positive and which
were negative. It is also not known whether the 17% samples with < 18ppm iodine, were non-
iodized or iodized with iodine content below 18 ppm.

Iodized Salt in Processed Food
70
BPOM food processors’ salt sample descriptions (2012)
Food Manufacturer Segment Size Salt Supplier
Indofood CBP Sukses Makmur Noodles Large Cheetam Garam
Mikie Oleo Nabati Industri Palm Oil Medium Susanti Megah
Mitratama Kencana Sejati Food Seasoning Medium Cheetam Garam
- Susanti Megah
Seasonal Supplies Snacks Small – Medium Sumber Laut
Netani Kasih Milk & Beverage powder Small Merck
ABC President Noodles Medium – Large Cheetam Garam
Astaguna Wisesa Fruit Jam Medium Menjangan Sakti
Kobe & Lina Food Seasoning Medium Cheetam Garam
Kobe & Lina Food Seasoning Medium Cheetam Garam
Anugerah Setia Lestari Food Seasoning Medium Saltindo Perkasa
Perfetti Van Melle Candy Medium – Large -
Source: Interview with BPOM

Iodized Salt in Processed Food
71
APPENDIX 4: PERCENTAGE OF POPULATION BY SES
SES Class Percentage
A 11.5%
B 15%
C1 23.8%
C2 25.8%
D 14.3%
E 9.7%
Source: Roy Morgan Research

Iodized Salt in Processed Food
72
APPENDIX 5: FORTIFIED PRODUCTS
Of the six food products surveyed only instant noodles and bread use fortified materials (which
doesn’t include salt/other seasoning). The fortified materials are typically fortified flour or else
fortified vegetable oil and/or micronutrient premixes.
Only some brands of instant noodles claim to include fortified products and as such are required to
list nutritional information including details on fortified products and the percentage of daily values.
Fortified raw materials added to food products
Product Fortified raw materials Method of adding fortified raw
materials
Instant Noodles Vitamin, Mineral, Folic Acid
Fortified flour, fortified vegetable oil and micronutrient premix
Bread Vitamin, Mineral Fortified flour
Source: Clarity Analysis
QC Checks
No food producer undertook any QC checks on fortified raw materials. Food producers only want to
list the fortified products on the food packaging and not concerned if the raw materials do not meet
the standard providing they are provided a CoA that lists the technical specification of the raw
materials. No supervisory body (i.e BPOM) samples the raw materials to ensure that they meet the
standard set out in the CoA.


