USAID KENYA DAIRY SECTOR COMPETITIVENESS PROGRAM 623-C-00-08-00020-32 MARKET SURVEY ON MILK AND MILK RELATED PRODUCTS Contractor Information: Land O’Lakes, Inc. Peponi Plaza, Block B, Second Floor Off Peponi Road, Westlands Tel. +254-20-374-8685 Fax +254-20-374-5056
Transcript
USAID KENYA DAIRY SECTOR COMPETITIVENESS PROGRAM 623-C-00-08-00020-32
MARKET SURVEY ON MILK AND MILK RELATED PRODUCTS
Contractor Information: Land O’Lakes, Inc. Peponi Plaza, Block B, Second Floor Off Peponi Road, Westlands Tel. +254-20-374-8685 Fax +254-20-374-5056
2.2 Focus Group Discussions ................................................................................................................ 10
2.3 Retail & Distribution Audit .............................................................................................................. 10
2.4 Processor Census ........................................................................................................................... 10
3.0 Overview of Key Findings................................................................................................................... 11 3.1 Processor Capacity Census ............................................................................................................. 11
3.1.1 Processor Capacities .......................................................................................................... 11 3.1.2 Cooling Plant & Collection Capacities ................................................................................. 12 3.1.3 Collection and Storage Capacities ...................................................................................... 12 3.1.4 Quality Control Policies ...................................................................................................... 13 3.1.5 Planned Infrastructure ....................................................................................................... 13 3.1.6 Product Mix, Marketing and Distribution ........................................................................... 14 3.1.7 Exporting of Kenyan Dairy Products ................................................................................... 18
3.2 Focus Group Discussions ................................................................................................................ 18
3.2.1 Key Motivators in purchasing Milk and Milk Related Products ............................................ 19 3.2.3 Communication and Advertising ........................................................................................ 20 3.2.4 Pricing ............................................................................................................................... 21
3.4 Summary of Key Findings ............................................................................................................... 23
4.0 Proposed Strategies ........................................................................................................................... 25 4.1 Marketing strategies for increased demand and supply for milk and dairy products ...................... 25
4.1.1 Marketing Strategies focused on the consumer.................................................................. 25 4.1.2 Marketing Strategies for Trade – Processed Milk and Value Added Products ..................... 26 4.1.3 Trade Pricing and Retailer Satisfaction Marketing Strategies .............................................. 27 4.1.4 Marketing Strategies focusing on Processor Capacity Development ................................... 28
4.2 Designing consumer awareness campaigns to increase consumption .............................................. 30
5.0 Conclusion and Recommendations .................................................................................................... 32 Annexes ......................................................................................................................................................... 33
Annex 1: Detailed Work Plan....................................................................................................................... 33
3 | P a g e
Strategic Business Advisors (Africa) Ltd
Executive Summary
1. Introduction and Background
The USAID Kenya Dairy Sector Competitiveness Program (KDSCP) is a 5 year project aimed at improving the competitiveness of Kenya’s dairy industry. The project is under the management of Land O’Lakes, Inc and funded by USAID. The key objective of this project is to improve Kenya’s dairy industry competitiveness. Currently, KDSCP is in the process of reviving the Kenya Dairy Processors Association (KDPA). One key constraint to this activity is the lack of domestic and export market information.
In order to understand the current market state a survey would inform stakeholders on the existing and potential market for milk and milk related products hence guiding KDSCPs vision through enabling meaningful and highly effective investments.
The overall approach for this study was to undertake a diagnostic of the market and develop effective market strategies.
• Stage 1 Diagnostic of the market
• Stage 2 Development of effective market strategies
The market diagnostic focused on developing a targeted understanding of the characteristics and dynamics of the market. It included four key activities; a comprehensive literature review, fourteen intensive focus group discussions, a retail audit with a sample size of 600 and a cross country processor census.
2. Processor Census
Ø The processor census showed the industry with an estimated 35 processors is dominated by few players; a revived New KCC, Brookside, Githunguri, and Buzeki dairies.
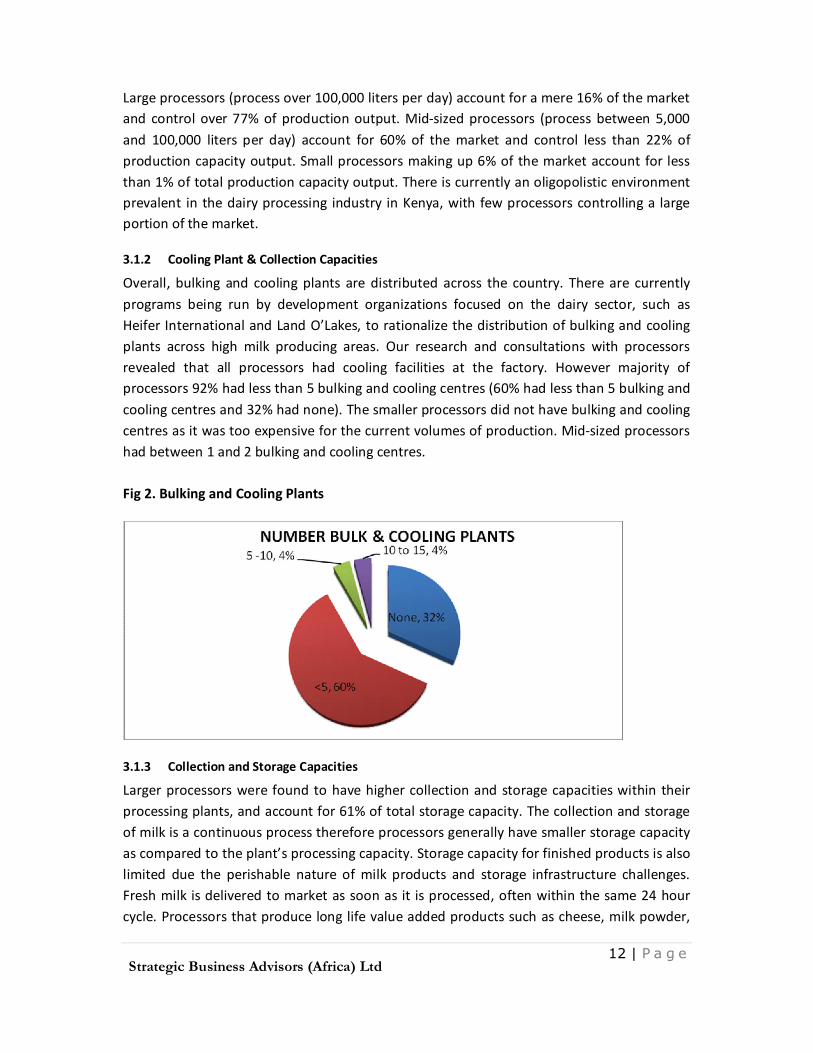
Ø Further, it revealed that all processors had cooling facilities at the factory. However majority of processors 92% had less than 5 bulking and cooling centres (60% had less than 5 bulking and cooling centres and 32% had none). The smaller processors did not have bulking and cooling centres as it was too expensive for the current volumes of production. Mid-sized processors had between 1 and 2 bulking and cooling centres. Total processor bulking and cooling capacity (949,200 ltrs/day) and collection and storage capacity (781,200 ltrs/day) is 1,730,400 ltrs/day.
Ø All processors surveyed conformed to Kenya Dairy Board and Kenya Bureau of Standards quality standards. Basic quality tests were conducted at intake/ collection of milk and during processing. General quality tests conducted by processors include the following; Rasazurin test to determine microbiological load; Lactometer, total
4 | P a g e
Strategic Business Advisors (Africa) Ltd
solids and butterfat tests to determine adulteration of milk; and Organoleptic test to ensure the right smell, look and taste.
Ø The milk glut that affected the dairy industry in Kenya in 2010 caused processors to reconsider investment in increased capacity for product and market diversification within the next 2 to 5 years. Different processors are examining varied strategies to mitigate fluctuations in milk supply.
Ø An overall examination of total production of milk products and milk related value added products showed that fresh milk products represents a higher proportion of industry product mix at 74% of total processor production. Milk related value added products accounted for 26% of total production.
Ø Majority of processors sited financial constraints as the reason why they did not undertake exhaustive market research before launching a new product. Large processors and niche processors however undertook extensive in-house and outsourced product and market research before introducing a new product.
Ø Word of mouth was noted as the most commonly used form of marketing communication at 26% followed by branded clothing (t-shirts, caps etc) 21% and stickers 15% and posters 12%. Traditional forms of advertising i.e. print-media, television and radio are not largely used by processors because of their high costs.
Ø Observed during the course of this census was the use of different packaging serving different market segments for fresh milk and yoghurt products. Lower income segment packaging for fresh milk is mainly distributed in the plastic pouch. This is because the pouch is cheaper to produce than the commonly recognized triangular format and has a remarkable impact on end-user pricing. ‘Tetra Classic (TC)’, is mainly used for packaging fresh milk serving mid and high income segments.
Ø Product pricing for all processors was seen to be firstly based on the cost of production, transportation and prevailing market prices. Mid-sized and smaller processors normally bench mark their prices against the larger processors (NewKCC and Brookside) after taking into consideration their costs of production. Niche processors by and large follow premium pricing for their products but also benchmark their prices to the larger processor but oftentimes their products are slightly more expensive than the larger processor.
Ø Majority of Kenyan processors, 72% that participated in this market survey did not export their products, 28% exported some of their products. The main dairy export products are long life milk products (whole, flavoured and fat free long life milk). 30% of exporting processors had long-life milk products. Cheese is another major export
5 | P a g e
Strategic Business Advisors (Africa) Ltd
product and was exported by 24% of exporting processors. Powdered milk is exported only by NewKCC and Brookside. The main export market for Kenyan dairy processors is the East African Community (EAC).
3. Focus Group Discussions
Ø The focus group discussions showed that milk is primarily consumed in the daily diet of all consumers talked to. Milk products taken regularly included Mala and yoghurt with Mala consumed predominantly by the lower and middle income groups.
Ø While there were generic motivators such as taste, smell and availability across all strata, there were others that stood out more in each income group. Price was the major motivator for respondents in the lower income cluster. Motivators for the middle and upper income groups overlapped somewhat, with packaging, storage, hygiene and company reputation (brand) mentioned as key motivators.
Ø Quality parameters revolved around consumers’ perceptions of smell, taste, feel and colour. For instance, milk should be a pure white, while butter should look creamy-yellow and must be easy to spread. Real yoghurt should be heavy and fruity not “watery”.
Ø Communication for milk and value added milk products was seen to have been weak especially at the point of purchase (POP) where respondents do not appear to be well versed with the products they are buying. For instance they were seen to confuse flavored Mala for drinkable yoghurt.
Ø The general feel was that the pricing of Milk and Valued Added Milk products is too high. There is no available benchmark on acceptable pricing as most suggestions allude to slashing prices in half.
4. Retail Audit
Ø The retail audit showed Fresh Pasteurized Milk emerges as the biggest category in terms of sales across the country taking 67.9% whereas Added Value processed milk takes 32.1% share.
Ø Total volumes of processed milk products in all regions was seen to be significantly low in proportion to pasteurised fresh milk, with UHT white milk and cultured milk showing the highest consumption in each region. Yoghurt consumption was seen to be highest in Eastern and Nairobi province.
6 | P a g e
Strategic Business Advisors (Africa) Ltd
Ø 50% of processed milk was noted as being sold through Small Dukas followed by Kiosks 20%. Larger outlets (self service stores) contributed to only 10% of the sales. The same was seen for Dairy shops and large dukas.
5. Overview of Key Findings
Below is an overview of the key findings.
a) Today’s Dairy consumer segmentation is unique and motivated by intrinsic and extrinsic benefit relevant to their lifestyle.
b) Focus should be on Value Added products and key drivers to aid consumption i.e. information, education, availability and lifestyle considerations, are important to the growth of the Dairy Industry
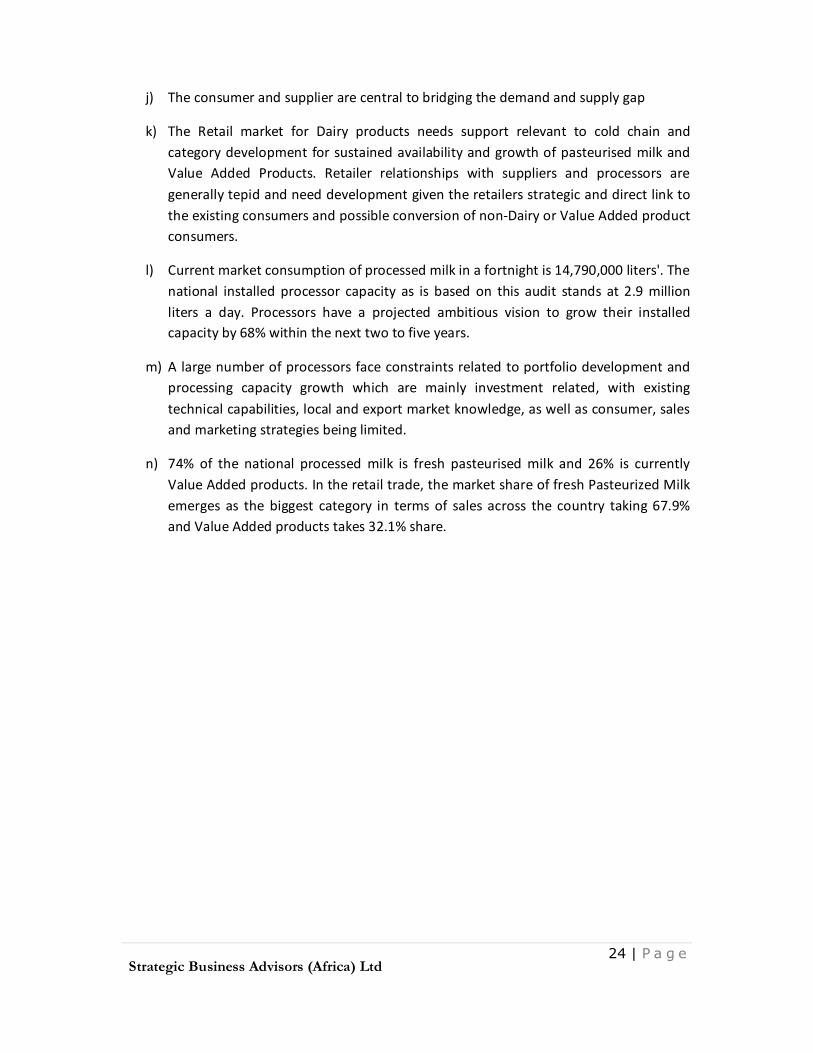
c) The consumer and supplier are central to bridging the demand and supply gap
d) The Retail market for Dairy products needs support relevant to cold chain and category development for sustained availability and growth of pasteurised milk and Value Added Products.
e) Current market consumption of processed milk in a fortnight is 14,790,000 liters'.
f) A large number of processors face constraints related to portfolio development and processing capacity growth which are mainly investment related, with existing technical capabilities, local and export market knowledge, as well as consumer, sales and marketing strategies being limited.
g) 74% of the national processed milk is fresh pasteurised milk and 26% is currently Value Added products.
6. Proposed Strategies
Following the detailed research carried out below are the proposed strategies:-
a) Marketing strategies that would lead to increased demand and supply for milk and dairy products including; Communication Avenue Optimisation, Value Addition Communication, Promotion and sampling exercises and Consumer Education.
b) Marketing Strategies focused on trade of processed milk and Value Added products including; High Potential Area focus , Product Growth potential , Distributor Development , Channel Support and Development , Market Mapping – regional distribution , Growth Potential Focus , Quality and Taste Benchmarking (NPD) ,
7 | P a g e
Strategic Business Advisors (Africa) Ltd
Channel Development , Local Product Range extension , Imports Market Share Cannibalization and Local Commercialisation.
c) Trade Pricing and Retailer Satisfaction Marketing Strategies such as; Development of Retailer relationship programs and Addressing price sensitive strata.
d) Marketing Strategies focusing on Processor Capacity Development such as New Product Development interventions, Interventions related to fluctuations of milk supply, Promote consumption of value added products by suppliers as part of a rebate scheme, Export Market Development and Generic Execution Campaigns.
e) Designing consumer awareness campaigns to increase consumption. Such campaigns would include; Trade Relationship Building campaigns, unbranded generic intrinsic and extrinsic milk and Value Added Products (Value) Campaigns.
8 | P a g e
Strategic Business Advisors (Africa) Ltd
Acronyms, Abbreviations & Definitions A.I. Artificial Insemination a.m. Ante Meridiem Avg. Average COMESA Common Market for Eastern and Southern Africa Co-op Cooperative EAC East African Community e-Marketing Electronic Marketing EPC Export Promotion Council GMP Good Manufacturing Practices HACCP Hazard Analysis Critical Control Point ISO International Organization for Standardization KDB Kenya Dairy Board KDPA Kenya Dairy Processors Association KDSCP Kenya Dairy Sector Competitiveness Program LOL Land O'Lakes Ltd. Limited lts/day Litres per day ml Milliliter NewKCC New Kenya Cooperative Creameries OHS Occupational Health and Safety SBA Strategic Business Advisors (Africa) Ltd. TC Tetra Classic UAE United Arab Emirates UHT Ultra High Temperature USAID United States Agency for International Development
9 | P a g e
Strategic Business Advisors (Africa) Ltd
1.0 Background
1.1 Kenya Dairy Sector Competitiveness Program
The USAID Kenya Dairy Sector Competitiveness Program (KDSCP) is a 5 year project aimed at improving the competitiveness of Kenya’s dairy industry. The project is under the management of Land O’Lakes, Inc and funded by USAID. The key objective of this project is to improve Kenya’s dairy industry competitiveness. The KDSCP project is to be implemented through a series of programs:
• Program 1
Upgrading the capacity of the dairy industry to compete in local, regional and international markets.
• Program 2
Transforming dairy small holder business organizations into viable enterprises supplying quality milk to the market and facilitating access to critical services and inputs for farmers.
• Program 3
Strengthening support markets, increasing availability and utilization of business development services to dairy enterprises.
1.2 Rationale for the Project
Currently, KDSCP is in the process of reviving the Kenya Dairy Processors Association (KDPA). One key constraint to this activity is the lack of domestic and export market information.
In order to understand the current market state a survey would inform stakeholders on the existing and potential market for milk and milk related products hence guiding KDSCPs vision through enabling meaningful and highly effective investments.
10 | P a g e
Strategic Business Advisors (Africa) Ltd
2.0 Approach and Methodology
The methodology proposed for the study is as discussed in the following sections.
2.1 Overall Approach
The overall approach for this study was to undertake a diagnostic of the market and develop effective market strategies.
• Stage 1 Diagnostic of the market
• Stage 2 Development of effective market strategies
The market diagnostic focused on developing a targeted understanding of the characteristics and dynamics of the market. It included four key activities; a comprehensive literature review, fourteen intensive focus group discussions, a retail audit with a sample size of 600 and a cross country processor census. The strategy development involved thorough examination of the market diagnostics after which milk and dairy products market development strategies including campaign strategies were designed.
2.2 Focus Group Discussions
A total of 140 consumers (14 FGDs) living in Nairobi, Mombasa, Kisumu, Athi River and Thika participated in the discussions with a higher concentration of these being in Nairobi and its environs.
2.3 Retail & Distribution Audit
The Retail audit sought to determine channels through which the ‘well served markets’ are served and the current levels this happens, whereas the distribution audit sought to understand where distribution potential lies and where the distribution gaps are .hence realization of the underserved markets based on the various processor distribution reach, product mix availed and potential distribution levels. Results were extrapolated from a market sample size of 600 retail outlets
2.4 Processor Census The processor census sought to determine the installed capacity and value addition in the country. A list of processors was drawn from the Kenya Dairy Board and other industry sources after which interviews were undertaken. A total of 23 processors were interviewed.
11 | P a g e
Strategic Business Advisors (Africa) Ltd
3.0 Overview of Key Findings
3.1 Processor Capacity Census
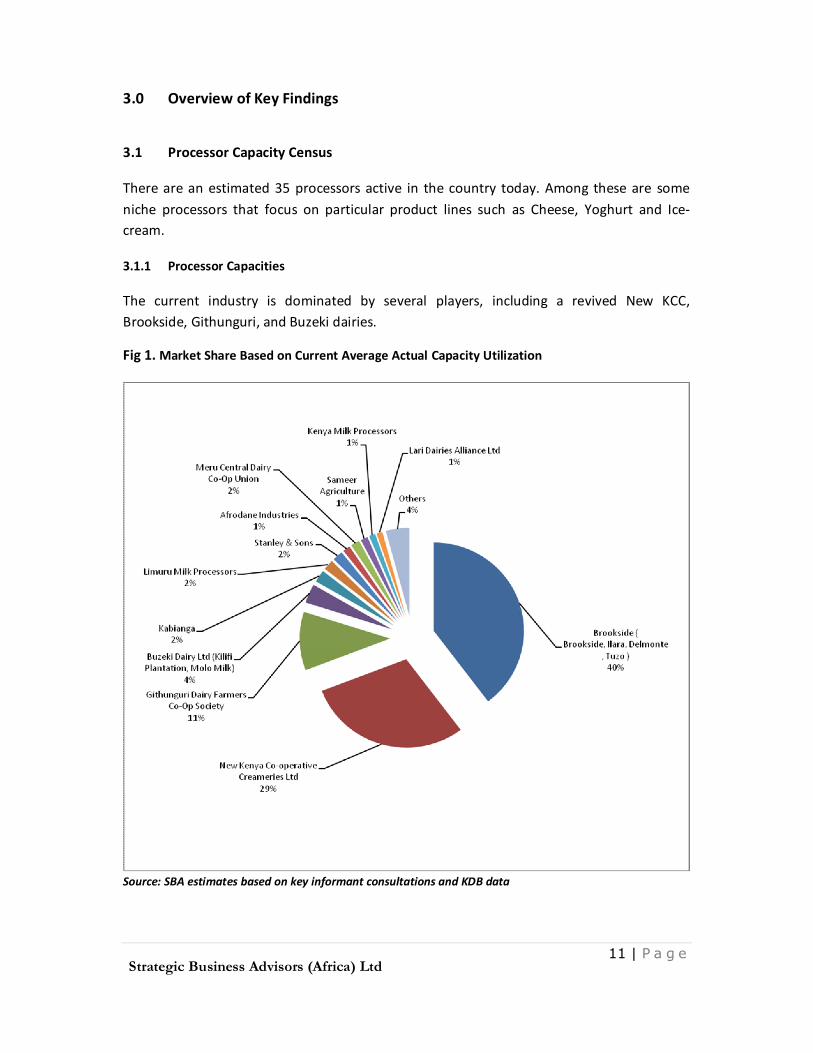
There are an estimated 35 processors active in the country today. Among these are some niche processors that focus on particular product lines such as Cheese, Yoghurt and Ice-cream.
3.1.1 Processor Capacities
The current industry is dominated by several players, including a revived New KCC, Brookside, Githunguri, and Buzeki dairies.
Fig 1. Market Share Based on Current Average Actual Capacity Utilization
Source: SBA estimates based on key informant consultations and KDB data
12 | P a g e
Strategic Business Advisors (Africa) Ltd
Large processors (process over 100,000 liters per day) account for a mere 16% of the market and control over 77% of production output. Mid-sized processors (process between 5,000 and 100,000 liters per day) account for 60% of the market and control less than 22% of production capacity output. Small processors making up 6% of the market account for less than 1% of total production capacity output. There is currently an oligopolistic environment prevalent in the dairy processing industry in Kenya, with few processors controlling a large portion of the market.
3.1.2 Cooling Plant & Collection Capacities
Overall, bulking and cooling plants are distributed across the country. There are currently programs being run by development organizations focused on the dairy sector, such as Heifer International and Land O’Lakes, to rationalize the distribution of bulking and cooling plants across high milk producing areas. Our research and consultations with processors revealed that all processors had cooling facilities at the factory. However majority of processors 92% had less than 5 bulking and cooling centres (60% had less than 5 bulking and cooling centres and 32% had none). The smaller processors did not have bulking and cooling centres as it was too expensive for the current volumes of production. Mid-sized processors had between 1 and 2 bulking and cooling centres. Fig 2. Bulking and Cooling Plants
3.1.3 Collection and Storage Capacities
Larger processors were found to have higher collection and storage capacities within their processing plants, and account for 61% of total storage capacity. The collection and storage of milk is a continuous process therefore processors generally have smaller storage capacity as compared to the plant’s processing capacity. Storage capacity for finished products is also limited due the perishable nature of milk products and storage infrastructure challenges. Fresh milk is delivered to market as soon as it is processed, often within the same 24 hour cycle. Processors that produce long life value added products such as cheese, milk powder,
13 | P a g e
Strategic Business Advisors (Africa) Ltd
ghee and UHT long-life milk, usually have greater storage facilities as compared to processors dealing mainly in fresh milk, butter and yoghurt products. Total processor bulking and cooling capacity (949,200 ltrs/day) and collection and storage capacity (781,200 ltrs/day) is 1,730,400 ltrs/day.
3.1.4 Quality Control Policies
All processors surveyed conformed to Kenya Dairy Board and Kenya Bureau of Standards quality standards. Basic quality tests were conducted at intake/ collection of milk and during processing. General quality tests conducted by processors include the following:-
§ Rasazurin test to determine microbiological load; § Lactometer, total solids and butterfat tests to determine adulteration of milk; § Organoleptic test to ensure the right smell, look and taste. Processors also conducted periodic testing of incubated samples, sampling during the processing cycle and additionally carried out testing of their dairy products in the market. All processors require KEBS certification. Larger processors, such as NewKCC and Brookside, have additional quality certification such as OHS&AS 18001, ISO Food Safety Management and Environmental Certifications, Halal Certification, Superbrand (EAC), and Diamond Mark of Quality. They also followed Good Manufacturing Practices (GMP) and Hazard Analysis Critical Control Point (HACCP) principles during processing. Niche processors are able to control quality more stringently and also followed GMP and HACCP principles. Internationally recognized quality certification such as the ISO standards are an expensive endeavour for most processors to undertake. Therefore as the processor grows in size the general observed trend is to pursue international certification. This is the case with the larger processors such as Githunguri Dairy and larger mid-sized processors such as Meru Central Dairy Cooperative Union and Afrodane Industries that are in the process of attaining ISO Certification.
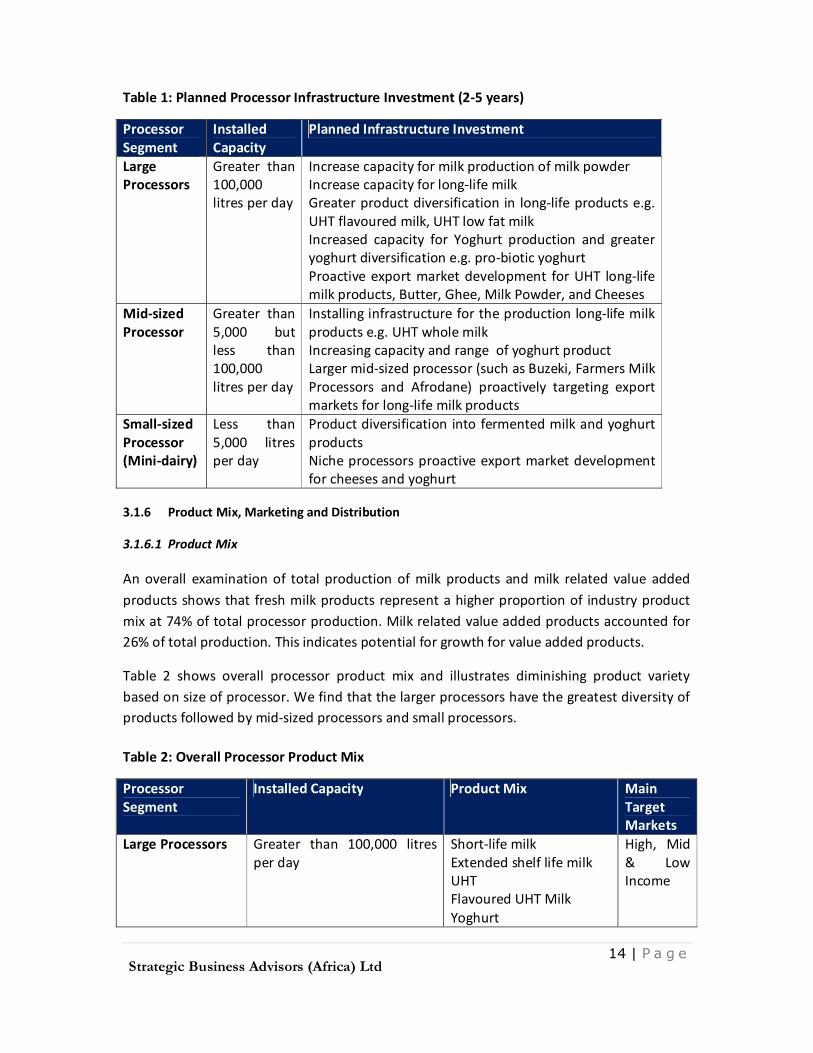
3.1.5 Planned Infrastructure
The milk glut that affected the dairy industry in Kenya in 2010 caused processors to reconsider investment in increased capacity for product and market diversification within the next 2 to 5 years. Different processors are examining varied strategies to mitigate fluctuations in milk supply. Outlined in the table below are some strategies being applied by different processor segments.
Increase capacity for milk production of milk powder Increase capacity for long-life milk Greater product diversification in long-life products e.g.
UHT flavoured milk, UHT low fat milk Increased capacity for Yoghurt production and greater
yoghurt diversification e.g. pro-biotic yoghurt Proactive export market development for UHT long-life
milk products, Butter, Ghee, Milk Powder, and Cheeses Mid-sized Processor
Greater than 5,000 but less than 100,000 litres per day
Installing infrastructure for the production long-life milk products e.g. UHT whole milk
Increasing capacity and range of yoghurt product Larger mid-sized processor (such as Buzeki, Farmers Milk
Processors and Afrodane) proactively targeting export markets for long-life milk products
Small-sized Processor (Mini-dairy)
Less than 5,000 litres per day
Product diversification into fermented milk and yoghurt products
Niche processors proactive export market development for cheeses and yoghurt
3.1.6 Product Mix, Marketing and Distribution
3.1.6.1 Product Mix
An overall examination of total production of milk products and milk related value added products shows that fresh milk products represent a higher proportion of industry product mix at 74% of total processor production. Milk related value added products accounted for 26% of total production. This indicates potential for growth for value added products.
Table 2 shows overall processor product mix and illustrates diminishing product variety based on size of processor. We find that the larger processors have the greatest diversity of products followed by mid-sized processors and small processors. Table 2: Overall Processor Product Mix
Processor Segment
Installed Capacity Product Mix Main Target Markets
Large Processors Greater than 100,000 litres per day
Less than 5,000 litres per day Short-life milk Yoghurt Cream Fermented Liquid Milk
(Lala)
Low Income
Small-sized Niche Processors
Less than 5,000 litres per day Yoghurt Cheese Ice cream Mursik
High Income
3.1.6.2 Product Research
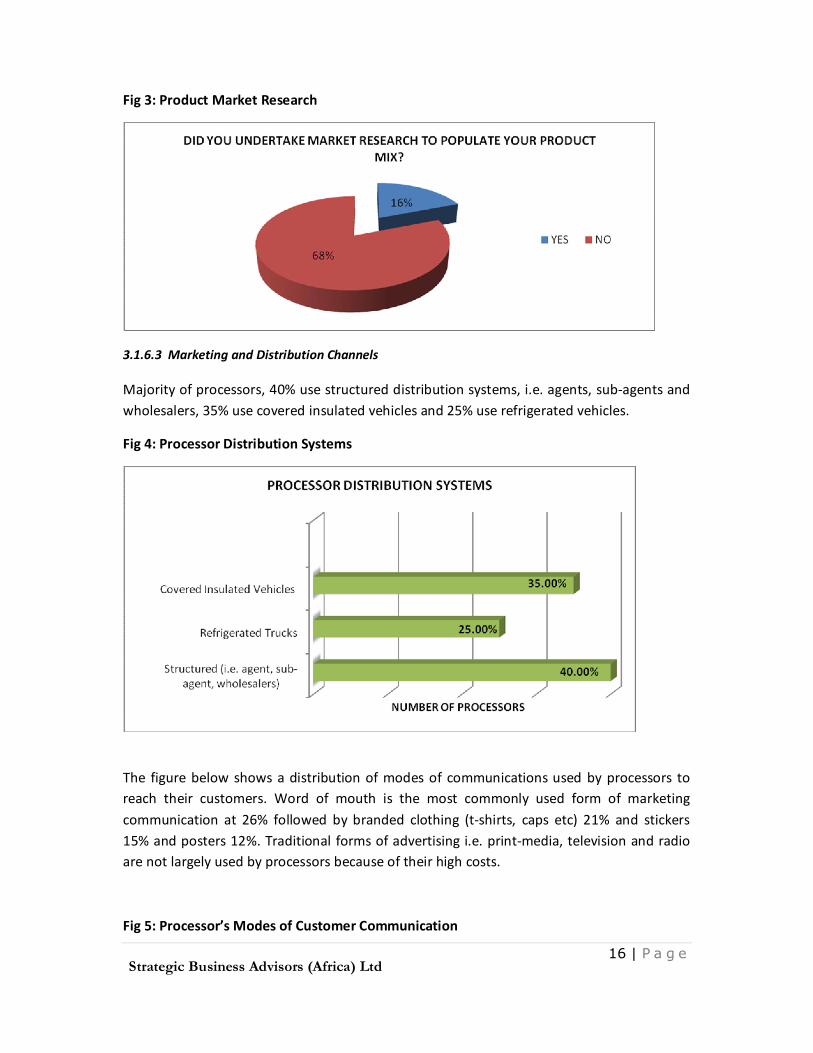
As shown in the figure below above 68% of processors did not undertake any product research before introducing a new product to the market. Majority of processors sited financial constraints as the reason why they did not undertake exhaustive market research before launching a new product. Large processors and niche processors however undertook extensive in-house and outsourced product and market research before introducing a new product.
16 | P a g e
Strategic Business Advisors (Africa) Ltd
Fig 3: Product Market Research
3.1.6.3 Marketing and Distribution Channels
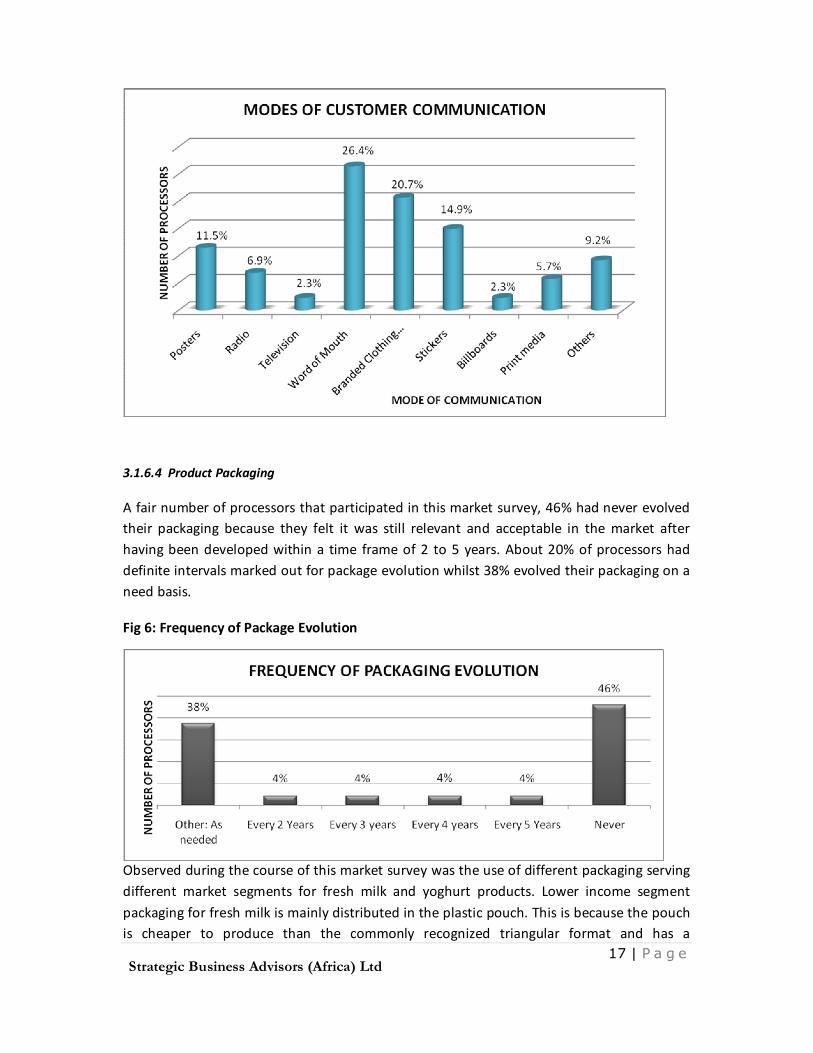
Majority of processors, 40% use structured distribution systems, i.e. agents, sub-agents and wholesalers, 35% use covered insulated vehicles and 25% use refrigerated vehicles.
Fig 4: Processor Distribution Systems
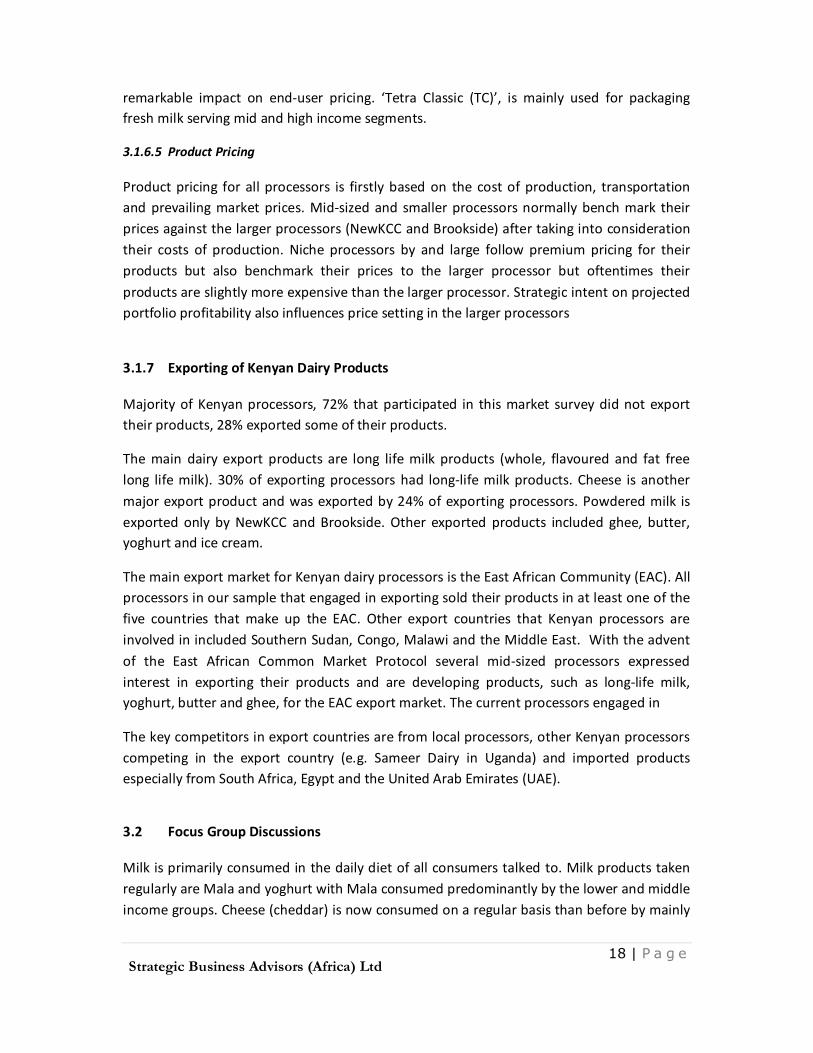
The figure below shows a distribution of modes of communications used by processors to reach their customers. Word of mouth is the most commonly used form of marketing communication at 26% followed by branded clothing (t-shirts, caps etc) 21% and stickers 15% and posters 12%. Traditional forms of advertising i.e. print-media, television and radio are not largely used by processors because of their high costs.
Fig 5: Processor’s Modes of Customer Communication
17 | P a g e
Strategic Business Advisors (Africa) Ltd
3.1.6.4 Product Packaging
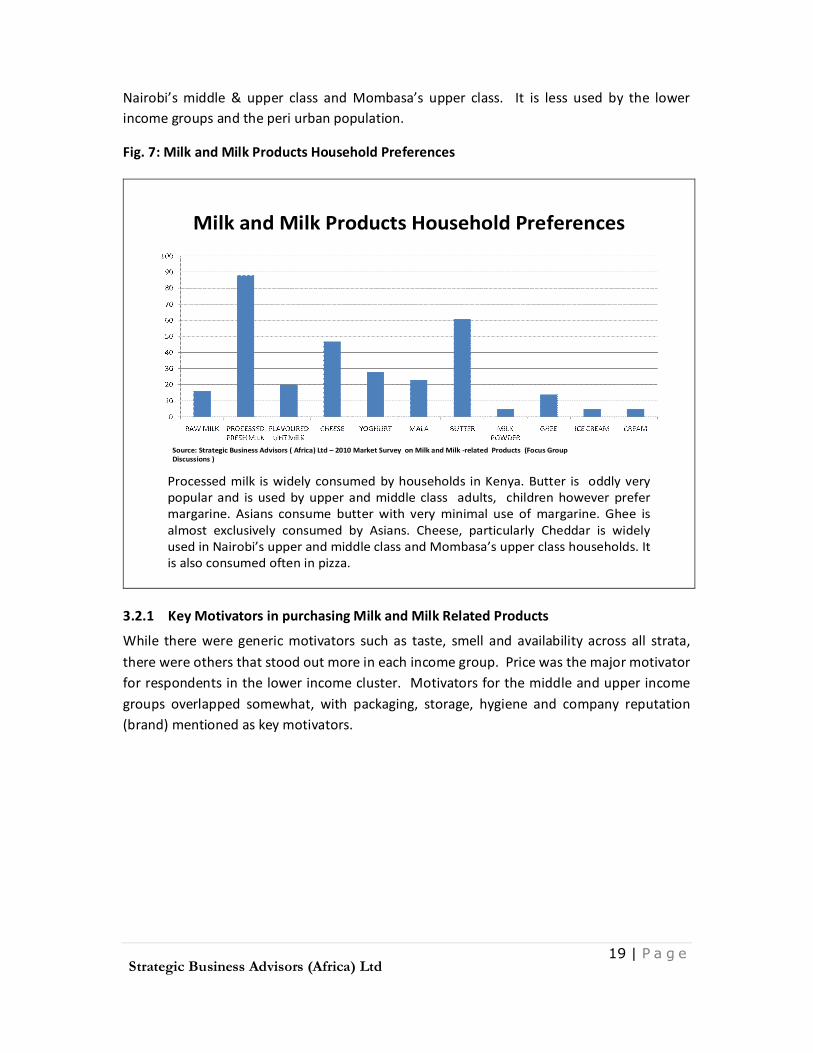
A fair number of processors that participated in this market survey, 46% had never evolved their packaging because they felt it was still relevant and acceptable in the market after having been developed within a time frame of 2 to 5 years. About 20% of processors had definite intervals marked out for package evolution whilst 38% evolved their packaging on a need basis.
Fig 6: Frequency of Package Evolution
Observed during the course of this market survey was the use of different packaging serving different market segments for fresh milk and yoghurt products. Lower income segment packaging for fresh milk is mainly distributed in the plastic pouch. This is because the pouch is cheaper to produce than the commonly recognized triangular format and has a
18 | P a g e
Strategic Business Advisors (Africa) Ltd
remarkable impact on end-user pricing. ‘Tetra Classic (TC)’, is mainly used for packaging fresh milk serving mid and high income segments.
3.1.6.5 Product Pricing
Product pricing for all processors is firstly based on the cost of production, transportation and prevailing market prices. Mid-sized and smaller processors normally bench mark their prices against the larger processors (NewKCC and Brookside) after taking into consideration their costs of production. Niche processors by and large follow premium pricing for their products but also benchmark their prices to the larger processor but oftentimes their products are slightly more expensive than the larger processor. Strategic intent on projected portfolio profitability also influences price setting in the larger processors
3.1.7 Exporting of Kenyan Dairy Products
Majority of Kenyan processors, 72% that participated in this market survey did not export their products, 28% exported some of their products.
The main dairy export products are long life milk products (whole, flavoured and fat free long life milk). 30% of exporting processors had long-life milk products. Cheese is another major export product and was exported by 24% of exporting processors. Powdered milk is exported only by NewKCC and Brookside. Other exported products included ghee, butter, yoghurt and ice cream.
The main export market for Kenyan dairy processors is the East African Community (EAC). All processors in our sample that engaged in exporting sold their products in at least one of the five countries that make up the EAC. Other export countries that Kenyan processors are involved in included Southern Sudan, Congo, Malawi and the Middle East. With the advent of the East African Common Market Protocol several mid-sized processors expressed interest in exporting their products and are developing products, such as long-life milk, yoghurt, butter and ghee, for the EAC export market. The current processors engaged in
The key competitors in export countries are from local processors, other Kenyan processors competing in the export country (e.g. Sameer Dairy in Uganda) and imported products especially from South Africa, Egypt and the United Arab Emirates (UAE).
3.2 Focus Group Discussions
Milk is primarily consumed in the daily diet of all consumers talked to. Milk products taken regularly are Mala and yoghurt with Mala consumed predominantly by the lower and middle income groups. Cheese (cheddar) is now consumed on a regular basis than before by mainly
19 | P a g e
Strategic Business Advisors (Africa) Ltd
Nairobi’s middle & upper class and Mombasa’s upper class. It is less used by the lower income groups and the peri urban population.
Fig. 7: Milk and Milk Products Household Preferences
Milk and Milk Products Household Preferences
Processed milk is widely consumed by households in Kenya. Butter is oddly very popular and is used by upper and middle class adults, children however prefer margarine. Asians consume butter with very minimal use of margarine. Ghee is almost exclusively consumed by Asians. Cheese, particularly Cheddar is widely used in Nairobi’s upper and middle class and Mombasa’s upper class households. It is also consumed often in pizza.
Source: Strategic Business Advisors ( Africa) Ltd – 2010 Market Survey on Milk and Milk -related Products (Focus Group Discussions )
3.2.1 Key Motivators in purchasing Milk and Milk Related Products
While there were generic motivators such as taste, smell and availability across all strata, there were others that stood out more in each income group. Price was the major motivator for respondents in the lower income cluster. Motivators for the middle and upper income groups overlapped somewhat, with packaging, storage, hygiene and company reputation (brand) mentioned as key motivators.
20 | P a g e
Strategic Business Advisors (Africa) Ltd
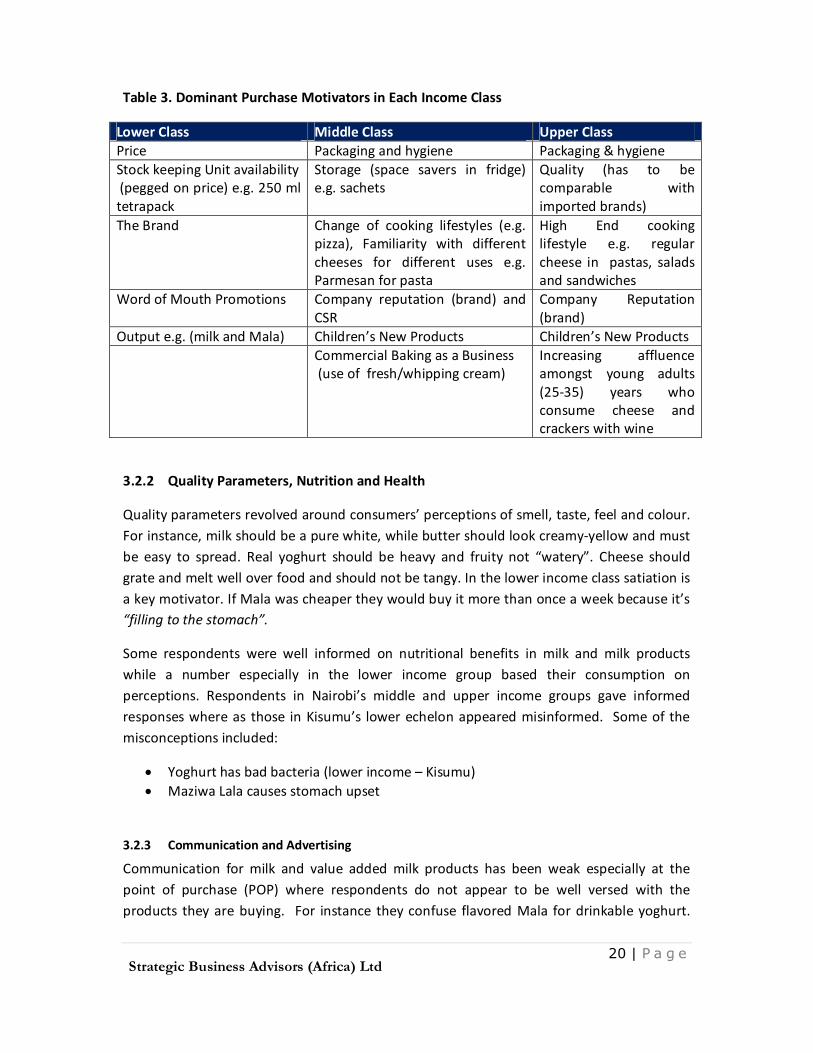
Table 3. Dominant Purchase Motivators in Each Income Class
Lower Class Middle Class Upper Class Price Packaging and hygiene Packaging & hygiene Stock keeping Unit availability (pegged on price) e.g. 250 ml tetrapack
Storage (space savers in fridge) e.g. sachets
Quality (has to be comparable with imported brands)
The Brand Change of cooking lifestyles (e.g. pizza), Familiarity with different cheeses for different uses e.g. Parmesan for pasta
High End cooking lifestyle e.g. regular cheese in pastas, salads and sandwiches
Word of Mouth Promotions Company reputation (brand) and CSR
Company Reputation (brand)
Output e.g. (milk and Mala) Children’s New Products Children’s New Products Commercial Baking as a Business
(use of fresh/whipping cream) Increasing affluence amongst young adults (25-35) years who consume cheese and crackers with wine
3.2.2 Quality Parameters, Nutrition and Health
Quality parameters revolved around consumers’ perceptions of smell, taste, feel and colour. For instance, milk should be a pure white, while butter should look creamy-yellow and must be easy to spread. Real yoghurt should be heavy and fruity not “watery”. Cheese should grate and melt well over food and should not be tangy. In the lower income class satiation is a key motivator. If Mala was cheaper they would buy it more than once a week because it’s “filling to the stomach”.
Some respondents were well informed on nutritional benefits in milk and milk products while a number especially in the lower income group based their consumption on perceptions. Respondents in Nairobi’s middle and upper income groups gave informed responses where as those in Kisumu’s lower echelon appeared misinformed. Some of the misconceptions included:
• Yoghurt has bad bacteria (lower income – Kisumu) • Maziwa Lala causes stomach upset
3.2.3 Communication and Advertising
Communication for milk and value added milk products has been weak especially at the point of purchase (POP) where respondents do not appear to be well versed with the products they are buying. For instance they confuse flavored Mala for drinkable yoghurt.
21 | P a g e
Strategic Business Advisors (Africa) Ltd
This has hence brought about product identification and differentiation issues (dissonance) as indicated below:
• UHT – is only KCC UHT and not any other brand • Long Life - refers to Brookside Dairy Fresh • Tuzo is whole milk and Brookside isn’t • Flavored Mala and drinkable yoghurt are the same • Cream – As discussions ensued, it was difficult to differentiate between Fresh cream,
Whipped cream, Double cream and sour cream
That said, there are a few products that had strong advertising recall amongst respondents:
• Brookside Billboard – Slim lady with tape measure (Get into Shape Ad) • Brookside Delivery Truck – Man drinking milk • Tuzo T.V. commercial – “The Cow has refused” • Tuzo T.V. commercial– Tu Tu Tuzo jingle • Tuzo Radio commercial – Luo song with lady singing about Tuzo • Blue Band T.V. commercial - Child measuring their height • Blue Band T.V. commercial – Child spreading Blue Band generously on bread
3.2.4 Pricing
The general feel is that the pricing of Milk and Valued Added Milk products is too high. There is no available benchmark on acceptable pricing as most suggestions allude to slashing prices in half. In a number of discussions reference was made by discerning respondents to farm gate prices for raw milk being shs. 18-20 per litre, with most not factoring in Value addition processes. However there appears to be some appreciation for the price Long Life milk (shs. 103 per half litre) because of its extended shelf life. Products like Cheddar Cheese were found to be expensive relative to imported brands. For instance 500 g KCC butter is shs. 400 compared to 500 g Anchor butter pegged at shs. 430. Consumers feel that there should be pricing controls on milk and milk products.
This has driven some (Asians) from Supermarkets to making value added products (yoghurt) at home. Others have home deliveries for non licensed yoghurts as was the case in Athi River.
22 | P a g e
Strategic Business Advisors (Africa) Ltd
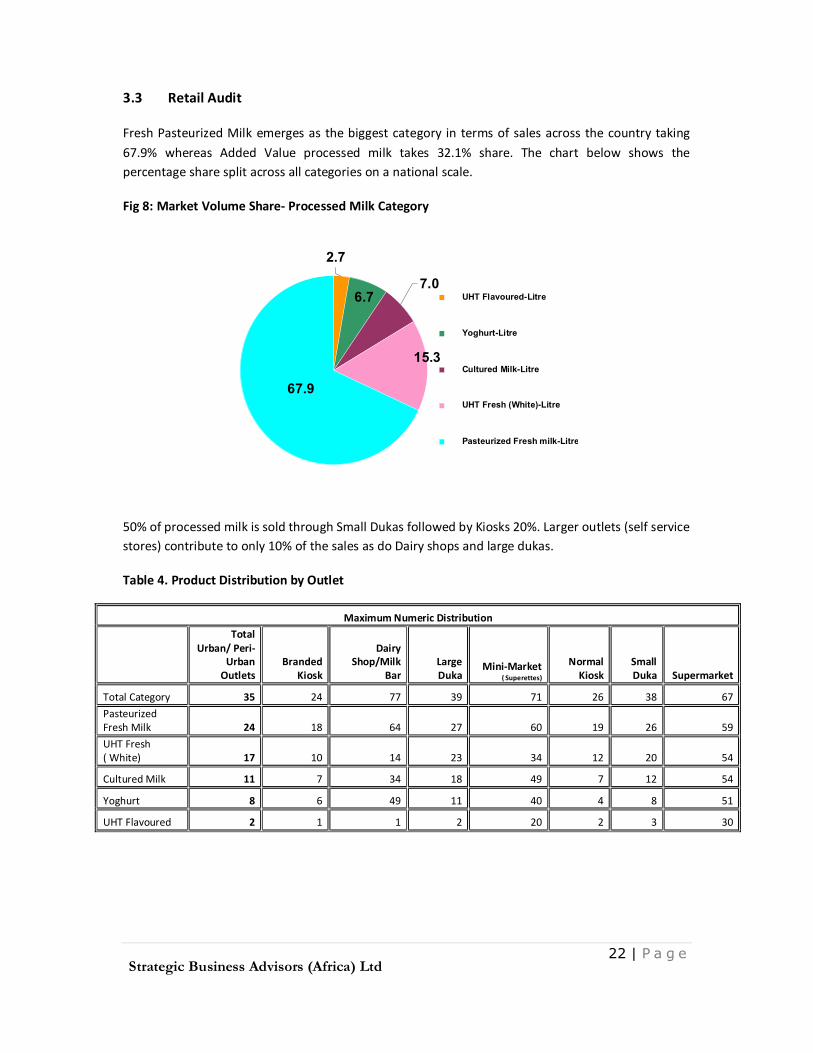
3.3 Retail Audit
Fresh Pasteurized Milk emerges as the biggest category in terms of sales across the country taking
67.9% whereas Added Value processed milk takes 32.1% share. The chart below shows the percentage share split across all categories on a national scale.
50% of processed milk is sold through Small Dukas followed by Kiosks 20%. Larger outlets (self service stores) contribute to only 10% of the sales as do Dairy shops and large dukas.
Table 4. Product Distribution by Outlet
Maximum Numeric Distribution
Total Urban/ Peri-
Urban Outlets
Branded Kiosk
Dairy Shop/Milk
Bar Large Duka
Mini-Market ( Superettes)
Normal Kiosk
Small Duka Supermarket
Total Category 35 24 77 39 71 26 38 67
Pasteurized Fresh Milk 24 18 64 27 60 19 26 59
UHT Fresh ( White) 17 10 14 23 34 12 20 54
Cultured Milk 11 7 34 18 49 7 12 54
Yoghurt 8 6 49 11 40 4 8 51
UHT Flavoured 2 1 1 2 20 2 3 30
6.7
67.9
15.3
7.0
2.7
UHT Flavoured-Litre
Yoghurt-Litre
Cultured Milk-Litre
UHT Fresh (White)-Litre
Pasteurized Fresh milk-Litre
23 | P a g e
Strategic Business Advisors (Africa) Ltd
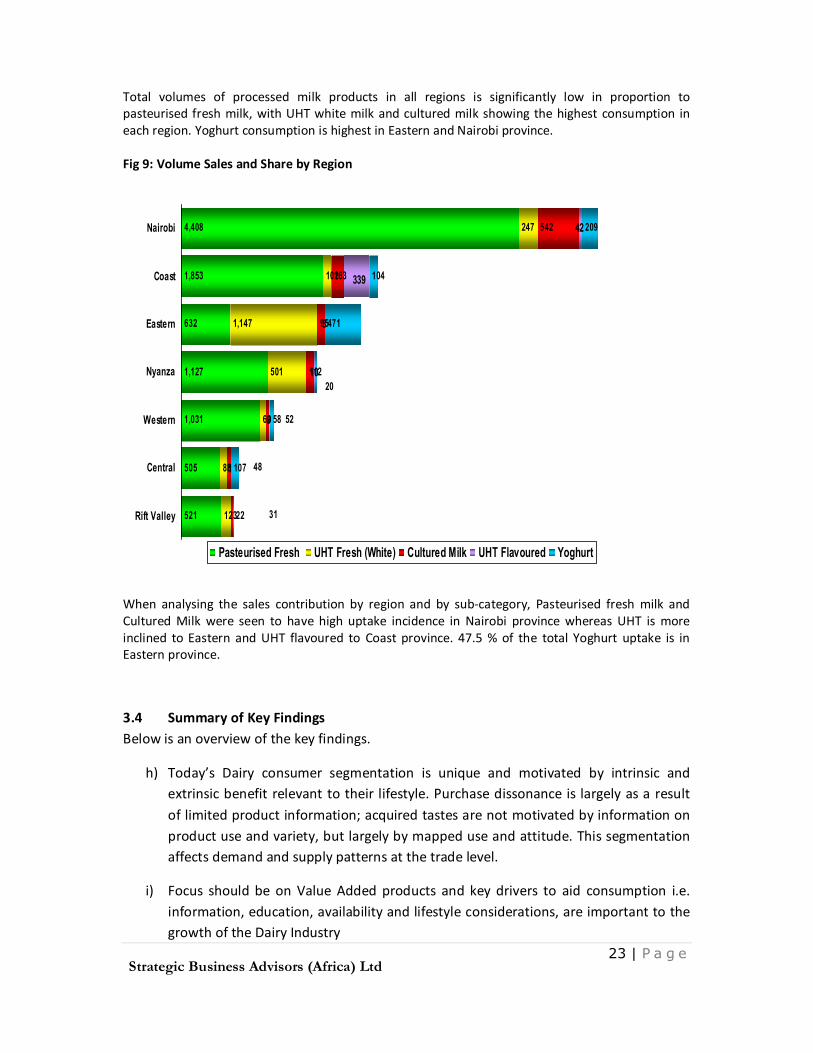
Total volumes of processed milk products in all regions is significantly low in proportion to pasteurised fresh milk, with UHT white milk and cultured milk showing the highest consumption in each region. Yoghurt consumption is highest in Eastern and Nairobi province. Fig 9: Volume Sales and Share by Region
When analysing the sales contribution by region and by sub-category, Pasteurised fresh milk and Cultured Milk were seen to have high uptake incidence in Nairobi province whereas UHT is more inclined to Eastern and UHT flavoured to Coast province. 47.5 % of the total Yoghurt uptake is in Eastern province.
3.4 Summary of Key Findings Below is an overview of the key findings.
h) Today’s Dairy consumer segmentation is unique and motivated by intrinsic and extrinsic benefit relevant to their lifestyle. Purchase dissonance is largely as a result of limited product information; acquired tastes are not motivated by information on product use and variety, but largely by mapped use and attitude. This segmentation affects demand and supply patterns at the trade level.
i) Focus should be on Value Added products and key drivers to aid consumption i.e. information, education, availability and lifestyle considerations, are important to the growth of the Dairy Industry
24 | P a g e
Strategic Business Advisors (Africa) Ltd
j) The consumer and supplier are central to bridging the demand and supply gap
k) The Retail market for Dairy products needs support relevant to cold chain and category development for sustained availability and growth of pasteurised milk and Value Added Products. Retailer relationships with suppliers and processors are generally tepid and need development given the retailers strategic and direct link to the existing consumers and possible conversion of non-Dairy or Value Added product consumers.
l) Current market consumption of processed milk in a fortnight is 14,790,000 liters'. The national installed processor capacity as is based on this audit stands at 2.9 million liters a day. Processors have a projected ambitious vision to grow their installed capacity by 68% within the next two to five years.
m) A large number of processors face constraints related to portfolio development and processing capacity growth which are mainly investment related, with existing technical capabilities, local and export market knowledge, as well as consumer, sales and marketing strategies being limited.
n) 74% of the national processed milk is fresh pasteurised milk and 26% is currently Value Added products. In the retail trade, the market share of fresh Pasteurized Milk emerges as the biggest category in terms of sales across the country taking 67.9% and Value Added products takes 32.1% share.
25 | P a g e
Strategic Business Advisors (Africa) Ltd
4.0 Proposed Strategies
The key deliverable for this assignment was strategies that will drive the demand and supply of milk and milk related products in Kenya. Following the detailed research carried out through the literature review, focus group discussions, processor census and retail audit, the following are the proposed strategies.
4.1 Marketing strategies that would lead to increased demand and supply for milk and dairy products
4.1.1 Marketing Strategies focused on the consumer
a) Communication Avenue Optimisation
• Lower and middle strata peri - urban and rural consumer targeting through popular media- radio based on focus group communication recall and media accessibility
• Targeted at young Adults (18-24, 25-35 years) - aspiring, shaping lifestyles, associating
b) Value Addition Communication
• Interest and engage consumers through lifestyle linkages
c) Promotion and sampling exercises
• More preference tasting for acquired taste conversions & quality benchmarking
• Product sampling at research and development stages to ensure consumer differentiation when launched
• More co-branding promotions for meal accompaniments and usage (e.g. cheese and crackers, yoghurt and cereals).
d) Consumer Education
• Education and demonstrative communication on better value addition(e.g. a fruitier yoghurt, healthier breakfast – cereals with yoghurt, fortification with taste eg cheese added to soups, vegetables )
• Communication content to heavily emphasise on product differentiation – to avert dissonance
26 | P a g e
Strategic Business Advisors (Africa) Ltd
4.1.2 Marketing Strategies focused on Trade – Processed Milk and Value Added Products
a) High Potential Area focus
Nairobi & Coast province are key regions for increasing pasteurized fresh milk up-take, whereas cultured milk has more opportunity in Central and partly eastern province with increased communication reach. For UHT eastern province has the highest uptake.
b) Product Growth potential
Opportunity for emergent processors and distributors to tap into and focus on growing Added Value Product Categories namely UHT fresh which currently has 15.3% of the total market volumes, cultured milk which is steadily growing at 7% volume share and yoghurt at 6.7% volume share. Total processed milk products (liquid’) are at 32.1%. Steady growth potential for these products are notably in Eastern, Coast, Western and Central province for yoghurt, Eastern and Nyanza Province for UHT ( white) and Nairobi, Coast and Western Provinces for Cultured Milk.
c) Distributor Development
More trade support by distributors is needed to maintain current channel sales contribution of 50% of milk and pasteurized milk products by small dukas.
d) Channel Support and Development
New innovations are needed in promotions, merchandising and trade margin/ consumer pricing for better channel support for Kiosks (20% contribution), Dairy shops, Supermarkets/ Self service store and large dukas that each contribute to 10% of category sales.
e) Market Mapping – regional distribution
There is a huge opportunity for all players to change the current market mapping for preferred brands through more targeted regional distribution of their products starting with areas where competing brands are in demand as this will then encourage trial and offtake of their particular brands within the same regions.
New Sales drives and trade storms for wider market penetration of Added Value products in existing markets can be more targeted to areas where the weighted distribution is low by channel such as Kiosks, large and small dukas for UHT flavored, Kiosks and small dukas for yoghurt and cultured milk respectively.
27 | P a g e
Strategic Business Advisors (Africa) Ltd
f) Growth Potential Focus
Growth focus in this category should be targeted in the cheese and butter category given the 74% current combined volume share and consumption
g) Quality and Taste Benchmarking (NPD)
Quality and acquired taste parameters sought after by consumers from imported cheese and butter brands (Happy Cow and New Zealand) should be benchmarked for better sales and uptake of local cheeses and butter
h) Channel Development
Uptake of cream, ghee and cheese in supermarkets must be encouraged further given supermarkets currently sell the highest tonnage of these products due to consumer frequency and purchase point preference. This uptake should be encouraged through promotion and pricing strategies and retailer relationships
i) Local Product Range extension
Existing range extension and NPD of cheeses to accommodate consumption preferences (packaging, use, pricing) found in imported cheeses and butter by local consumers.
j) Imports Market Share – cannibalization, local commercialisation
Potential to grow Butter and Cheese tonnage lies in cannibalizing the imported brands volume share.
NPD supported commercialisation of Local popular ‘home-made’ cream and ghee products at regional levels (Kisumu, Kisii, Kericho) and progressive range extension needs to be researched and motivated
Regulations to curb cheap, subsidised dairy or dairy related products (yoghurt sweets, ice-creams, milk powders, cheeses)
4.1.3 Trade Pricing and Retailer Satisfaction Marketing Strategies
a) Development of Retailer relationship programs
These will be key to supporting the enhanced product category distribution on a National scale and reducing dissonance due to poor relationships that hinder growth of emergent small scale milk and milk product entrepreneurs through the same retailer channels experiencing this dissonance.
28 | P a g e
Strategic Business Advisors (Africa) Ltd
Enhance category stocking levels, sales trials, and customer feedback channels so as to have a direct impact on category development and encouraged consumer product trial due to increased confidence in retailer support by processors.
b) Addressing price sensitive strata
- The highest milk up-take falls within the mid and Sub-premium value sector (price range of Kshs 58 to Kshs 67 per liter). There is high potential for introduction and growth potential of Added Value products in the same sector through new product trial, consumption and promotion.
- Purchase dissonance due to current pricing will be a hindrance to new Added Value product introduction into the same value sectors.
- Promotion, product sampling and communication
- Information on actual product offering or differentiation to consumers, needs to be done by individual companies, so as to counter dissonance due to price sensitivity issues as well as to ensure product uptake by retailers is enhanced
4.1.4 Marketing Strategies focusing on Processor Capacity Development
a) New Product Development interventions
- Industry supported importation of New Product Development related inputs such as flavours, packaging, and added value processors to avert current expensive monopoly of existing suppliers.
- Adoption of modern sales and distribution methods
- Industry supported technical training for product development and research for emerging processors.
- Support in development of technical proposals for emerging processors open to support from and partnerships with larger conglomerates in the dairy industry. This will help in faster, strategic knowledge transfer and financial advise and support
- Financial product development with key banks and financial institutions in Kenya and COMESA region
- Farmers’ and producers’ organisation support through training, market visits, technical development
b) Interventions related to fluctuations of milk supply
- Inclusion of milk powder to the country strategic food reserve - Farmer education on planning for low production season
29 | P a g e
Strategic Business Advisors (Africa) Ltd
- Industry supported rebate schemes for regular farm input utilization by farmers
c) Promote consumption of value added products by suppliers as part of a rebate scheme
d) Export Market Development
- Enhance market intelligence and information dissemination on key export markets - Feasibility studies in preparation for exports and investments
e) Generic Execution Campaigns
Generic communication campaigns should be strategic and focus on areas that will have immediate impact on trade, consumer and processor development and eventual increase in demand and consumption of milk and Value Added Products
It is vital that prior to any consumer awareness campaigns, focus must be given at the retailer level given the current tepid Supplier-Retailer relationships and the strategic direct link the retailer has with the consumer. For any campaign to be successful, this relationship must be positive and the retailer must be engaged and well informed.
30 | P a g e
Strategic Business Advisors (Africa) Ltd
4.2 Designing consumer awareness campaigns to increase consumption
a) Trade Relationship Building campaigns
Recognition of the trade as key to supporting sustainability of Milk and milk products and as being a direct and cost effective link to both the processor and consumer as an information source, confidence builder and market mapper
- Incentive based schemes on proof of Value Added portfolio growth over various oscillations
- Product knowledge related competitions managed by each processor or by the processor stakeholder body
- Retailer of the year/ month nominations that are consumer nominated through below the line initiatives at the estate level/ urban centre level , with selection criteria being ranking based on relationship criteria
- Category Management programmes in their basic element. Merchandising competitions, promotion drives, sales drives supported by interested organisations will be the best platforms to evolve the category management programmes
- Focus Product Initiatives that take advantage of trade cycles and consumption oscillations such as holidays, festivities, flush floods and excess product conversion / management at the farmer, consumer and processor levels
b) Unbranded generic intrinsic and extrinsic milk and Value Added Products ( Value) Campaigns
Use media segmented communication campaigns that take a four pronged approach
- Demographic strata communication
- Consumer Education on product variety and useage
- Emphasis on making informed purchasing decisions based on intrinsic and extrinsically demonstrated stringent quality aspects of processed milk and Value Added Products
- Home grown element
To expound further, the four tier communication campaign should take into consideration the following aspects:-
31 | P a g e
Strategic Business Advisors (Africa) Ltd
i. Use of media that is appropriately segmented and suitable for different strata and lifestyle motivations
ii. Ensure targeting of messages reaches four key demographic strata namely mothers, school going children, young adults and elderly
iii. Develop communication specific to convenience of products for every day use
iv. These communication campaigns should only feature generic product packs to communicate significance of processed milk and should also communicate on the quality verification aspects to consumers to aid in informed product purchase and stop post purchase dissonance – regardless of manufacturer
v. These communication campaigns should also front the relevance of retailing purchase , consumption and useage of homegrown products
32 | P a g e
Strategic Business Advisors (Africa) Ltd
5.0 Conclusion and Recommendations
In addition to the highlighted insights and strategic recommendations, further motivation for industry players to thrive should be from the broader perspective of certain elements that, if taken into consideration, will actualise more strategic planning for longer term success and growth of the Dairy industry at trade, consumer and processor levels. These elements include:-
Ø The evolving dairy markets in the regions Ø Availability of one the biggest dairy herds in Sub-Saharan Africa with pure and cross
breed animals with good genetic potential for milk production Ø Large community of farmers and pastoralist well committed to dairy production and
eager to improve Ø A society with a long tradition in dairy farming and a variety of organisations,
institutes and companies related to the dairy industry Ø Availability of a reasonably well developed dairy processing industry Ø Low value chain labor cost Ø Government of Kenya Export promotion policy and Foreign investment policy
Support organizations and lobby groups within the industry are very crucial to the success of Kenya’s dairy industry. These organizations and lobby groups are potentially vehicles with which industry players can lobby for improvement of industry dynamics by the government via the Kenya Dairy Board and strategic support from various organizations such as Land O’Lakes.
33 | P a g e
Strategic Business Advisors (Africa) Ltd
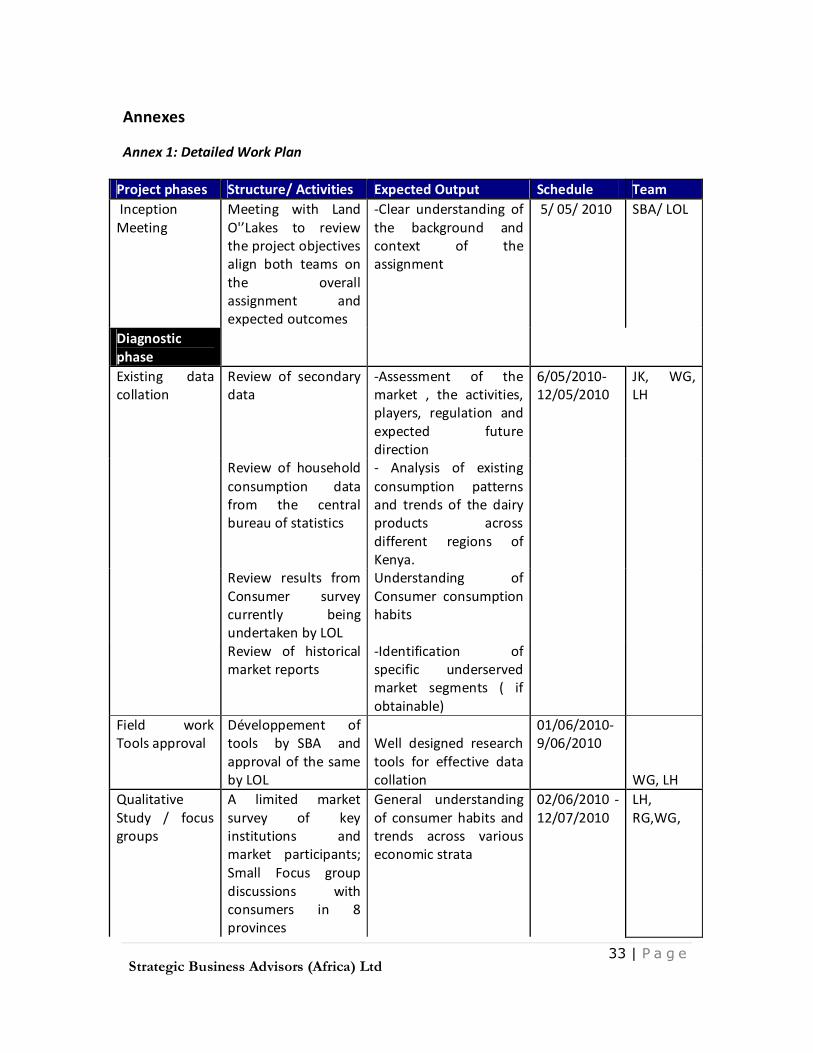
Annexes
Annex 1: Detailed Work Plan
Project phases Structure/ Activities Expected Output Schedule Team Inception Meeting
Meeting with Land O'’Lakes to review the project objectives align both teams on the overall assignment and expected outcomes
-Clear understanding of the background and context of the assignment
5/ 05/ 2010 SBA/ LOL
Diagnostic phase
Existing data collation
Review of secondary data
-Assessment of the market , the activities, players, regulation and expected future direction
6/05/2010- 12/05/2010
JK, WG, LH
Review of household consumption data from the central bureau of statistics
- Analysis of existing consumption patterns and trends of the dairy products across different regions of Kenya.
Review results from Consumer survey currently being undertaken by LOL
Understanding of Consumer consumption habits
Review of historical market reports
-Identification of specific underserved market segments ( if obtainable)
Field work Tools approval
Développement of tools by SBA and approval of the same by LOL
Well designed research tools for effective data collation
01/06/2010-9/06/2010
WG, LH Qualitative Study / focus groups
A limited market survey of key institutions and market participants; Small Focus group discussions with consumers in 8 provinces
General understanding of consumer habits and trends across various economic strata
02/06/2010 - 12/07/2010
LH, RG,WG,
34 | P a g e
Strategic Business Advisors (Africa) Ltd
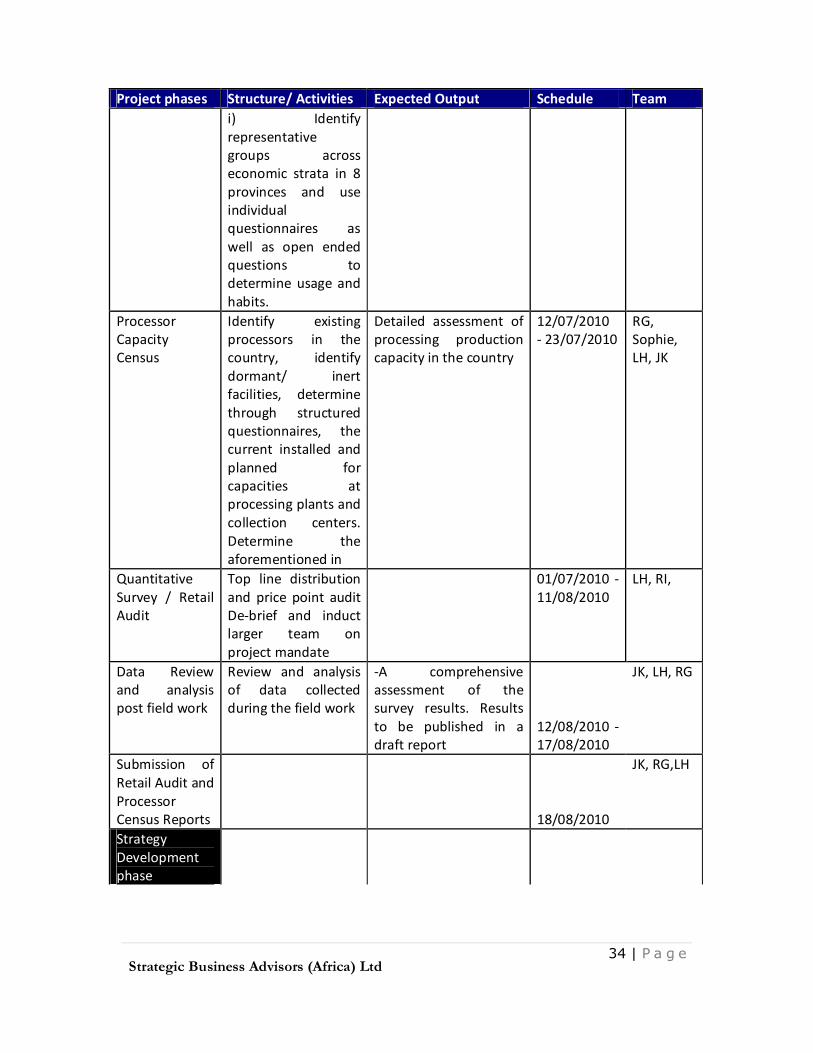
Project phases Structure/ Activities Expected Output Schedule Team i) Identify
representative groups across economic strata in 8 provinces and use individual questionnaires as well as open ended questions to determine usage and habits.
Processor Capacity Census
Identify existing processors in the country, identify dormant/ inert facilities, determine through structured questionnaires, the current installed and planned for capacities at processing plants and collection centers. Determine the aforementioned in
Detailed assessment of processing production capacity in the country
12/07/2010 - 23/07/2010
RG, Sophie, LH, JK
Quantitative Survey / Retail Audit
Top line distribution and price point audit De-brief and induct larger team on project mandate
01/07/2010 - 11/08/2010
LH, RI,
Data Review and analysis post field work
Review and analysis of data collected during the field work
-A comprehensive assessment of the survey results. Results to be published in a draft report
12/08/2010 - 17/08/2010
JK, LH, RG
Submission of Retail Audit and Processor Census Reports
18/08/2010
JK, RG,LH
Strategy Development phase
35 | P a g e
Strategic Business Advisors (Africa) Ltd
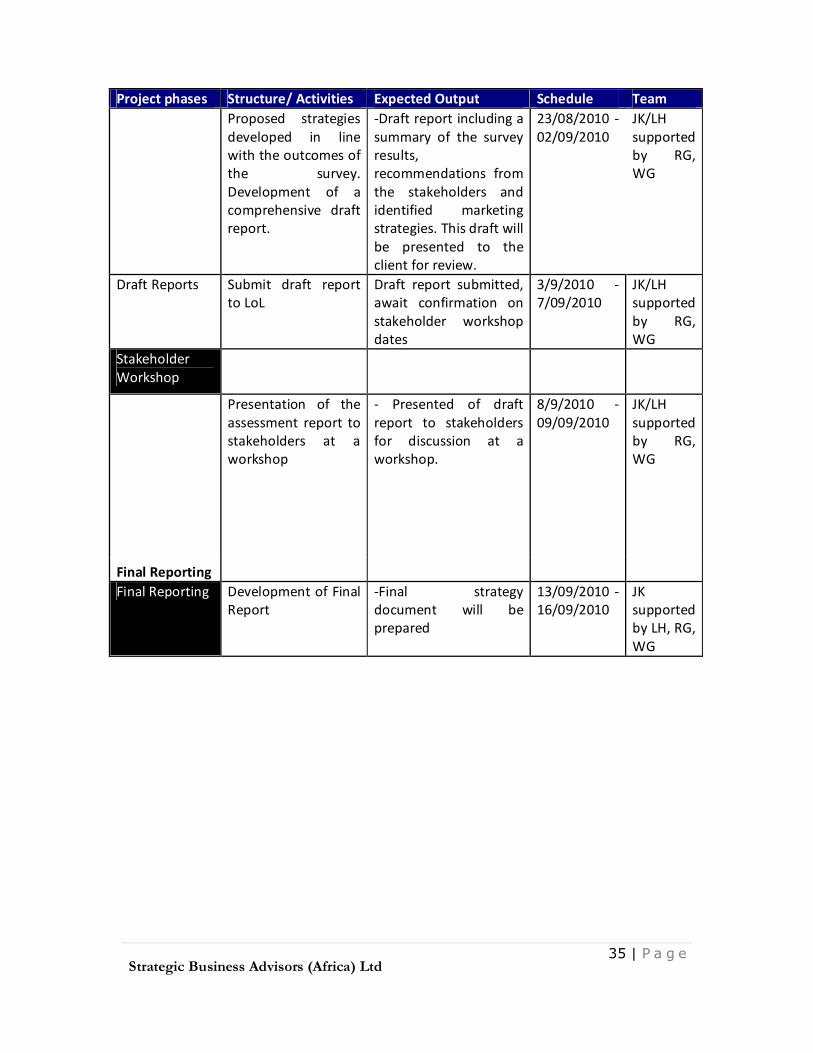
Project phases Structure/ Activities Expected Output Schedule Team Proposed strategies
developed in line with the outcomes of the survey. Development of a comprehensive draft report.
-Draft report including a summary of the survey results, recommendations from the stakeholders and identified marketing strategies. This draft will be presented to the client for review.
23/08/2010 - 02/09/2010
JK/LH supported by RG, WG
Draft Reports Submit draft report to LoL
Draft report submitted, await confirmation on stakeholder workshop dates
3/9/2010 - 7/09/2010
JK/LH supported by RG, WG
Stakeholder Workshop
Presentation of the assessment report to stakeholders at a workshop
- Presented of draft report to stakeholders for discussion at a workshop.
8/9/2010 - 09/09/2010
JK/LH supported by RG, WG
Final Reporting Final Reporting Development of Final