152
Appendix 2 United States Agency for International Development Performance Monitoring and Evaluation TIPS
| Date post: | 14-Jul-2015 |
| Category: |
Health & Medicine |
| Upload: | achint-kumar |
| View: | 220 times |
| Download: | 3 times |

Appendix 2
United States Agency for International Development
Performance Monitoring and Evaluation TIPS

1
ABOUT TIPSThese TIPS provide practical advice and suggestions to USAID managers on issues related to performance monitoring and evaluation. This publication is a supplemental reference to the Automated Directive Service (ADS) Chapter 203.
PERFORMANCE MONITORING & EVALUATION
TIPSCONDUCTING A PARTICIPATORY EVALUATION
NUMBER 1 2011 Printing
USAID is promotingparticipation in all as-
pects of its development work.
This TIPS outlines how to conduct a participa-
toryevaluation.
Participatory evaluation provides for active in-volvement in the evaluation process of those with a stake in the program: providers, part-ners, customers (beneficiaries), and any other interested parties. Participation typically takes place throughout all phases of the evaluation: planning and design; gathering and analyzing the data; identifying the evaluation findings, conclu-sions, and recommendations; disseminating re-sults; and preparing an action plan to improve program performance.
WHAT IS DIRECT OBSERVATION ?
CHARACTERISTICS OFPARTICIPATORY
EVALUATION

2
Participatory evaluations typically share several characteristics that set them apart from trad-tional evaluation approaches. These include:
Participant focus and ownership. Partici-patory evaluations are primarily oriented to the information needs of program stakehold-ers rather than of the donor agency. The donor agency simply helps the participants conduct their own evaluations, thus building their own-ership and commitment to the results and fa-cilitating their follow-up action.
Scope of participation. The range of partici-pants included and the roles they play may vary. For example, some evaluations may target only program providers or beneficiaries, while oth-ers may include the full array of stakeholders.
Participant negotiations. Participating groups meet to communicate and negotiate to reach a consensus on evaluation findings, solve problems, and make plans to improve perfor-mance.
Diversity of views. Views of all participants are sought and recognized. More powerful stake-holders allow participation of the less powerful.
Learning process. The process is a learn-ing experience for participants. Emphasis is on identifying lessons learned that will help partici-pants improve program implementation, as well as on assessing whether targets were achieved.
Flexible design. While some preliminary planning for the evaluation may be necessary, design issues are decided (as much as possible) in the participatory process. Generally, evalua-tion questions and data collection and analysis methods are determined by the participants, not by outside evaluators.
Empirical orientation. Good participatory evaluations are based on empirical data. Typi-
cally, rapid appraisal techniques are used to de-termine what happened and why.
Use of facilitators. Participants actually con-duct the evaluation, not outside evaluators as is traditional. However, one or more outside ex-perts usually serve as facilitator—that is, pro-vide supporting roles as mentor, trainer, group processor, negotiator, and/or methodologist.
WHY CONDUCT A PARTICIPATORYEVALUATION?
Experience has shown that participatory evalu-ations improve program performance. Listening to and learning from program beneficiaries, field staff, and other stakeholders who know why a program is or is not working is critical to mak-ing improvements. Also, the more these insid-ers are involved in identifying evaluation ques-tions and in gathering and analyzing data, the more likely they are to use the information to improve performance. Participatory evaluation empowers program providers and beneficiaries to act on the knowledge gained.
Advantages to participatory evaluations are that they:
• Examine relevant issues by involving keyplayers in evaluation design
• Promote participants’ learning about theprogram and its performance and enhancetheir understanding of other stakeholders’points of view
• Improve participants’ evaluation skills
• Mobilize stakeholders, enhance teamwork,and build shared commitment to act on evalua-
3
tion recommendations
• Increase likelihood that evaluation informa-tion will be used to improve performance
But there may be disadvantages. For example,participatory evaluations may
• Be viewed as less objective because programstaff, customers, and other stakeholderswith possible vested interests participate
• Be less useful in addressing highly technicalaspects
• Require considerable time and resources toidentify and involve a wide array of stakehold-ers
• Take participating staff away from ongoingactivities
• Be dominated and misused by some stake-holders to further their own interests
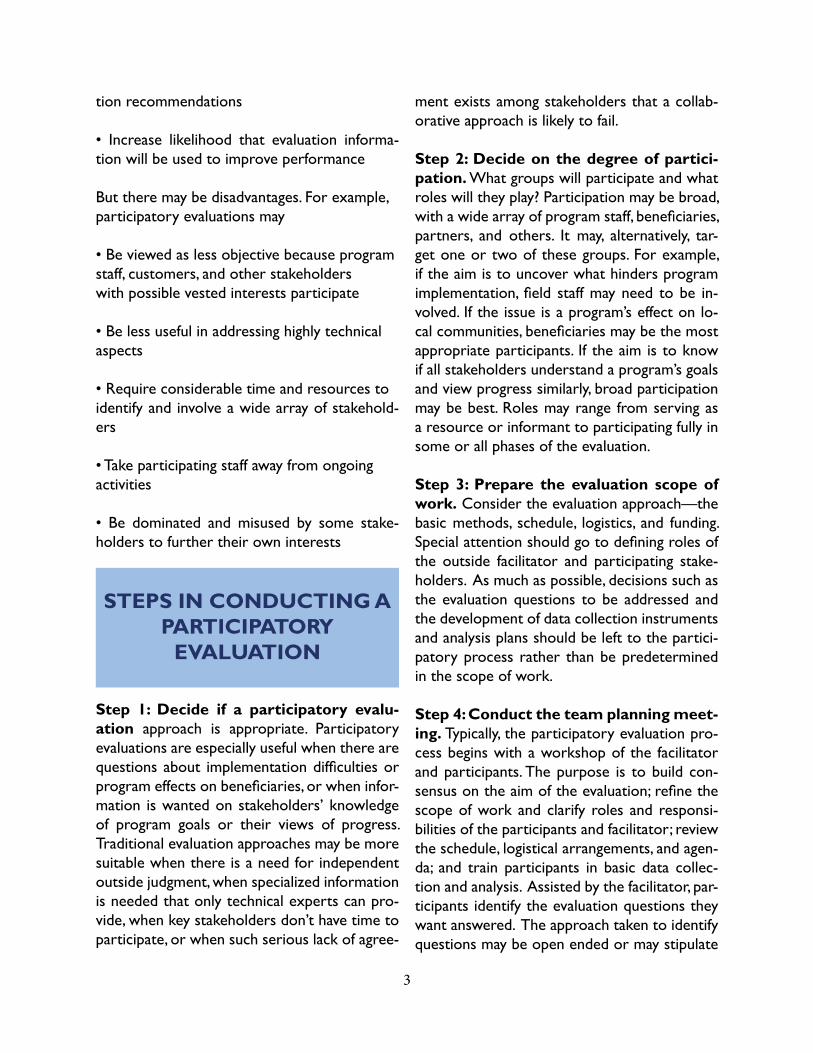
STEPS IN CONDUCTING A PARTICIPATORY
EVALUATION
Step 1: Decide if a participatory evalu-ation approach is appropriate. Participatory evaluations are especially useful when there are questions about implementation difficulties or program effects on beneficiaries, or when infor-mation is wanted on stakeholders’ knowledge of program goals or their views of progress. Traditional evaluation approaches may be more suitable when there is a need for independent outside judgment, when specialized information is needed that only technical experts can pro-vide, when key stakeholders don’t have time to participate, or when such serious lack of agree-
ment exists among stakeholders that a collab-orative approach is likely to fail.
Step 2: Decide on the degree of partici-pation. What groups will participate and what roles will they play? Participation may be broad, with a wide array of program staff, beneficiaries, partners, and others. It may, alternatively, tar-get one or two of these groups. For example, if the aim is to uncover what hinders program implementation, field staff may need to be in-volved. If the issue is a program’s effect on lo-cal communities, beneficiaries may be the most appropriate participants. If the aim is to know if all stakeholders understand a program’s goals and view progress similarly, broad participation may be best. Roles may range from serving as a resource or informant to participating fully in some or all phases of the evaluation.
Step 3: Prepare the evaluation scope of work. Consider the evaluation approach—the basic methods, schedule, logistics, and funding. Special attention should go to defining roles of the outside facilitator and participating stake-holders. As much as possible, decisions such as the evaluation questions to be addressed and the development of data collection instruments and analysis plans should be left to the partici-patory process rather than be predetermined in the scope of work.
Step 4: Conduct the team planning meet-ing. Typically, the participatory evaluation pro-cess begins with a workshop of the facilitator and participants. The purpose is to build con-sensus on the aim of the evaluation; refine the scope of work and clarify roles and responsi-bilities of the participants and facilitator; review the schedule, logistical arrangements, and agen-da; and train participants in basic data collec-tion and analysis. Assisted by the facilitator, par-ticipants identify the evaluation questions they want answered. The approach taken to identify questions may be open ended or may stipulate

4
broad areas of inquiry. Participants then select appropriate methods and develop data-gather-ing instruments and analysis plans needed to answer the questions.
Step 5: Conduct the evaluation. Participa-tory evaluations seek to maximize stakehold-ers’ involvement in conducting the evaluation in order to promote learning. Participants de-fine the questions, consider the data collection skills, methods, and commitment of time and la-bor required. Participatory evaluations usually use rapid appraisal techniques, which are sim-pler, quicker, and less costly than conventional sample surveys. They include methods such as those in the box below. Typically, facilitators are skilled in these methods, and they help train and guide other participants in their use.
Step 6: Analyze the data and build con-sensus on results. Once the data are gath-ered, participatory approaches to analyzing
and interpreting them help participants build a common body of knowledge. Once the analysis is complete, facilitators work with participants to reach consensus on findings, conclusions, and recommendations. Facilitators may need to ne-gotiate among stakeholder groups if disagree-ments emerge. Developing a common under-standing of the results, on the basis of empirical evidence, becomes the cornerstone for group commitment to a plan of action.
Step 7: Prepare an action plan. Facilitators work with participants to prepare an action plan to improve program performance. The knowledge shared by participants about a pro-gram’s strengths and weaknesses is turned into action. Empowered by knowledge, participants become agents of change and apply the lessons they have learned to improve performance.
Participatory Evaluation
• participant focus and ownership of evaluation
• broad range of stakeholders partici-pate
• focus is on learning
• flexibledesign
• rapid appraisal methods
• outsiders are facilitators
Traditional Evaluation
• donor focus and ownership of evalu-ation
• stakeholders often don’t participate
• focus is on accountability
• predetermined design
• formal methods
• outsiders are evaluators
WHAT’S DIFFERENT ABOUT PARTICIPATORY EVALUATIONS?

5
Rapid Appraisal Methods
Key informant interviews. This in-volves interviewing 15 to 35 individuals selected for their knowledge and experi-ence in a topic of interest. Interviews are qualitative, in-depth, and semistructured. They rely on interview guides that list topics or open-ended questions. The in-terviewer subtly probes the informant to elicit information, opinions, and experi-ences.
Focus group interviews. In these, 8 to 12 carefully selected participants freely discuss issues, ideas, and experi-ences among themselves. A modera-tor introduces the subject, keeps the discussion going, and tries to prevent domination of the discussion by a few participants. Focus groups should be homogeneous, with participants of simi-lar backgrounds as much as possible.
Community group interviews. These take place at public meetings open to all community members. The pri-mary interaction is between the partici-pants and the interviewer, who presides over the meeting and asks questions, following a carefully prepared question-naire.
Direct observation. Using a detailed observation form, observers record what they see and hear at a program site. The information may be about physical sur-roundings or about ongoing activities, processes, or discussions.
Minisurveys. These are usually based on a structured questionnaire with a limited number of mostly closeended questions. They are usually adminis-tered to 25 to 50 people. Respondents
may be selected through probability or nonprobability sampling techniques, or through “convenience” sampling (inter-viewing stakeholders at locations where they’re likely to be, such as a clinic for a survey on health care programs). The major advantage of minisurveys is that the datacan be collected and analyzed within a few days. It is the only rapid ap-praisal method that generates quantita-tive data.
Case studies. Case studies record anedotes that illustrate a program’s shortcomings or accomplishments. They tell about incidents or concrete events, often from one person’s experience.
Village imaging. This involves groups of villagers drawing maps or dia-grams to identify and visualize problems and solutions.
Selected Further Reading
Aaker, Jerry and Jennifer Shumaker. 1994. Looking Back and Looking Forward: A Partici-patory Approach to Evaluation. Heifer Project International. P.O. Box 808, Little Rock, AK 72203.
Aubel, Judi. 1994. Participatory Program Evalu-ation: A Manual for Involving Program Stake-holders in the Evaluation Process. Catholic Relief Services. USCC, 1011 First Avenue, New York, NY 10022.
Freeman, Jim. Participatory Evaluations: Making Projects Work, 1994. Dialogue on Develop-ment Technical Paper No. TP94/2. International Centre, The University of Calgary.
Feurstein, Marie-Therese. 1991. Partners in-Evaluation: Evaluating Development and Com-munity Programmes with Participants. TALC,

6
Box 49, St. Albans, Herts AL1 4AX, United Kingdom.
Guba, Egon and Yvonna Lincoln. 1989. Fourth Generation Evaluation. Sage Publications.
Pfohl, Jake. 1986. Participatory Evaluation: A User’s Guide. PACT Publications. 777 United Nations Plaza, New York, NY 10017.
Rugh, Jim. 1986. Self-Evaluation: Ideas for Participatory Evaluation of Rural Community Development Projects. World Neighbors Pub-lication.

1996, Number 2
CONDUCTING KEY INFORMANT INTERVIEWS
TIPSPerformance Monitoring and Evaluation
USAID Center for Development Information and Evaluation
What Are Key Informant Interviews?
They are qualitative, in-depth interviews of 15 to 35 people selectedfor their first-hand knowledge about a topic of interst. The inter-views are loosely structured, relying on a list of issues to be dis-cussed. Key informant interviews resemble a conversation amongacquaintances, allowing a free flow of ideas and information. Inter-viewers frame questions spontaneously, probe for information andtakes notes, which are elaborated on later.
When Are Key Informant Interviews Appropriate?
This method is useful in all phases of development activities—identification, planning, implementation, and evaluation. For ex-ample, it can provide information on the setting for a planned activ-ity that might influence project design. Or, it could reveal whyintended beneficiaries aren’t using services offered by a project.
Specifically, it is useful in the following situations:
1. When qualitative, descriptive information is sufficient for deci-sion-making.
2. When there is a need to understand motivation, behavior, andperspectives of our customers and partners. In-depth interviewsof program planners and managers, service providers, hostgovernment officials, and beneficiaries concerning their attitudesand behaviors about a USAID activity can help explain itssuccesses and shortcomings.
3. When a main purpose is to generate recommendations. Keyinformants can help formulate recommendations that can im-prove a program’s performance.
4. When quantitative data collected through other methods need tobe interpreted. Key informant interviews can provide the howand why of what happened. If, for example, a sample surveyshowed farmers were failing to make loan repayments, keyinformant interviews could uncover the reasons.
USAID reengineeringemphasizes listeningto and consultingwith customers, part-ners and other stake-holders as we under-take developmentactivities.
Rapid appraisal tech-niques offer system-atic ways of gettingsuch informationquickly and at lowcost. This Tips ad-vises how to conductone such method—key informant inter-views.
PN-ABS-541
25. When preliminary information is needed to
design a comprehensive quantitative study.Key informant interviews can help frame theissues before the survey is undertaken.
Advantages and Limitations
Advantages of key informant interviews include:
• they provide information directly fromknowledgeable people
• they provide flexibility to explore new ideasand issues not anticipated during planning
• they are inexpensive and simple to conduct
Some disadvantages:
• they are not appropriate if quantitative data areneeded
• they may be biased if informants are notcarefully selected
• they are susceptible to interviewer biases
• it may be difficult to prove validity offindings
Once the decision has been made to conduct keyinformant interviews, following the step-by-stepadvice outlined below will help ensure high-quality information.
Steps in Conducting the Interviews
Step 1. Formulate study questions.
These relate to specific concerns of the study.Study questions generally should be limited to fiveor fewer.
Step 2. Prepare a short interview guide.
Key informant interviews do not use rigid ques-tionnaires, which inhibit free discussion. However,interviewers must have an idea of what questionsto ask. The guide should list major topics andissues to be covered under each study question.
Because the purpose is to explore a few issues indepth, guides are usually limited to 12 items.Different guides may be necessary for interview-ing different groups of informants.
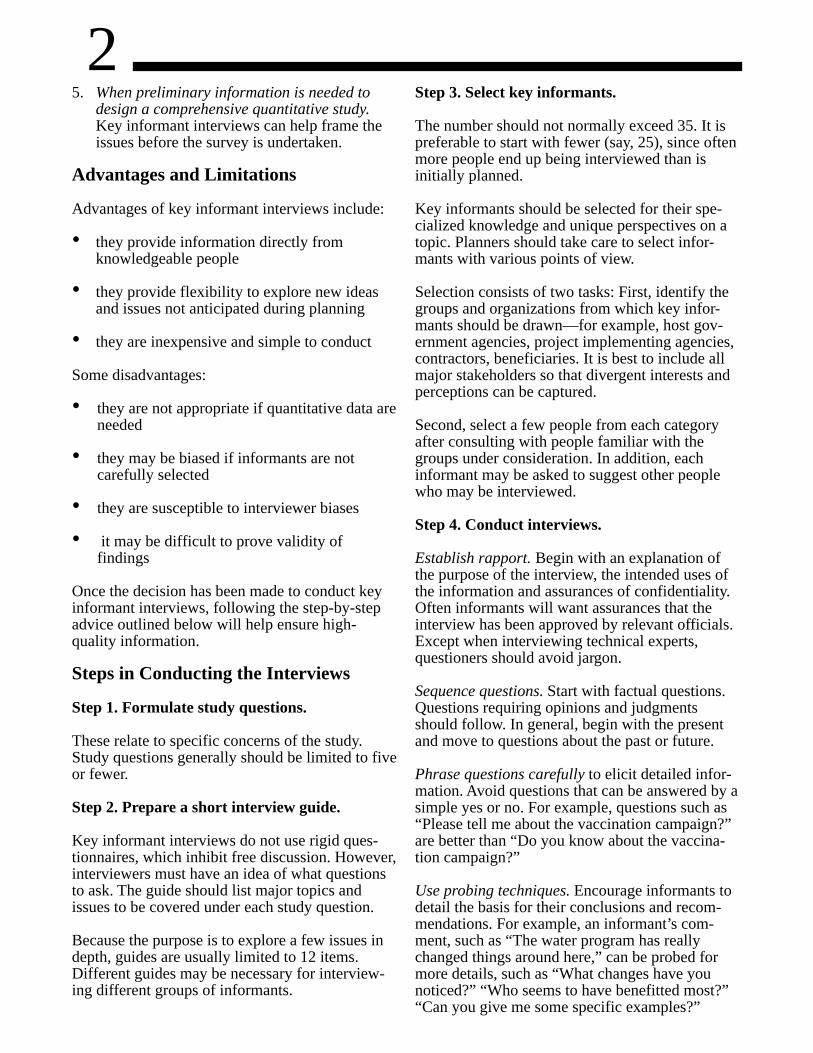
Step 3. Select key informants.
The number should not normally exceed 35. It ispreferable to start with fewer (say, 25), since oftenmore people end up being interviewed than isinitially planned.
Key informants should be selected for their spe-cialized knowledge and unique perspectives on atopic. Planners should take care to select infor-mants with various points of view.
Selection consists of two tasks: First, identify thegroups and organizations from which key infor-mants should be drawn—for example, host gov-ernment agencies, project implementing agencies,contractors, beneficiaries. It is best to include allmajor stakeholders so that divergent interests andperceptions can be captured.
Second, select a few people from each categoryafter consulting with people familiar with thegroups under consideration. In addition, eachinformant may be asked to suggest other peoplewho may be interviewed.
Step 4. Conduct interviews.
Establish rapport. Begin with an explanation ofthe purpose of the interview, the intended uses ofthe information and assurances of confidentiality.Often informants will want assurances that theinterview has been approved by relevant officials.Except when interviewing technical experts,questioners should avoid jargon.
Sequence questions. Start with factual questions.Questions requiring opinions and judgmentsshould follow. In general, begin with the presentand move to questions about the past or future.
Phrase questions carefully to elicit detailed infor-mation. Avoid questions that can be answered by asimple yes or no. For example, questions such as“Please tell me about the vaccination campaign?”are better than “Do you know about the vaccina-tion campaign?”
Use probing techniques. Encourage informants todetail the basis for their conclusions and recom-mendations. For example, an informant’s com-ment, such as “The water program has reallychanged things around here,” can be probed formore details, such as “What changes have younoticed?” “Who seems to have benefitted most?”“Can you give me some specific examples?”

3Maintain a neutral attitude. Interviewers should besympathetic listeners and avoid giving the impres-sion of having strong views on the subject underdiscussion. Neutrality is essential because someinformants, trying to be polite, will say what theythink the interviewer wants to hear.
Minimize translation difficulties. Sometimes it isnecessary to use a translator, which can change thedynamics and add difficulties. For example,differences in status between the translator andinformant may inhibit the conversation. Ofteninformation is lost during translation. Difficultiescan be minimized by using translators who are notknown to the informants, briefing translators onthe purposes of the study to reduce misunderstand-ings, and having translators repeat the informant’scomments verbatim.
Step 5. Take adequate notes.
Interviewers should take notes and develop themin detail immediately after each interview toensure accuracy. Use a set of common subheadingsfor interview texts, selected with an eye to themajor issues being explored. Common subhead-ings ease data analysis.
Step 6. Analyze interview data.
Interview summary sheets. At the end of eachinterview, prepare a 1-2 page interview summarysheet reducing information into manageablethemes, issues, and recommendations. Eachsummary should provide information about thekey informant’s position, reason for inclusion inthe list of informants, main points made, implica-tions of these observations, and any insights orideas the interviewer had during the interview.
Descriptive codes. Coding involves a systematicrecording of data. While numeric codes are notappropriate, descriptive codes can help organizeresponses. These codes may cover key themes,concepts, questions, or ideas, such assustainability, impact on income, and participationof women. A usual practice is to note the codes orcategories on the left-hand margins of the inter-view text. Then a summary lists the page numberswhere each item (code) appears. For example,women’s participation might be given the code“wom–par,” and the summary sheet might indicateit is discussed on pages 7, 13, 21, 46, and 67 of theinterview text.
Categories and subcategories for coding (based onkey study questions, hypotheses, or conceptualframeworks) can be developed before interviewsbegin, or after the interviews are completed.Precoding saves time, but the categories may notbe appropriate. Postcoding helps ensure empiri-cally relevant categories, but is time consuming. Acompromise is to begin developing coding catego-ries after 8 to 10 interviews, as it becomes appar-ent which categories are relevant.
Storage and retrieval. The next step is to develop asimple storage and retrieval system. Access to acomputer program that sorts text is very helpful.Relevant parts of interview text can then be orga-nized according to the codes. The same effect canbe accomplished without computers by preparingfolders for each category, cutting relevant com-ments from the interview and pasting them ontoindex cards according to the coding scheme, thenfiling them in the appropriate folder. Each indexcard should have an identification mark so thecomment can be attributed to its source.
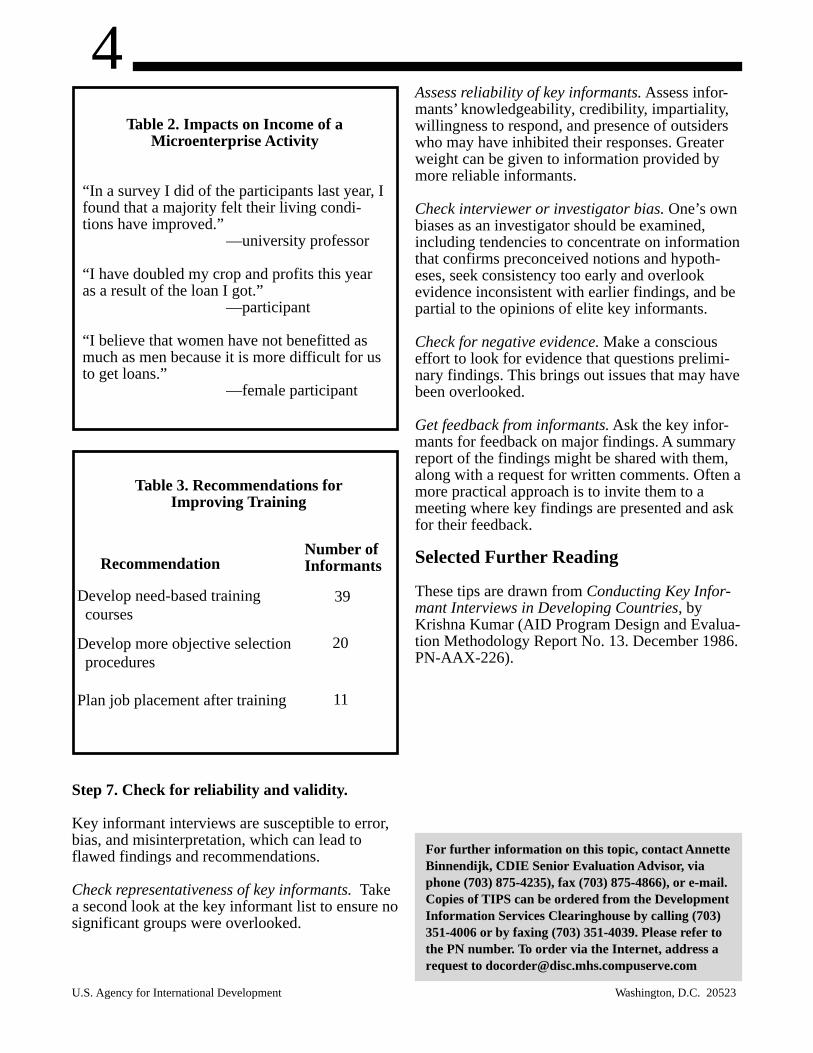
Presentation of data. Visual displays such astables, boxes, and figures can condense informa-tion, present it in a clear format, and highlightunderlying relationships and trends. This helpscommunicate findings to decision-makers moreclearly, quickly, and easily. Three examples belowand on page 4 illustrate how data from key infor-mant interviews might be displayed.
Table 1. Problems Encountered inObtaining Credit
Female Farmers
1. Collateralrequirements
2. Burdensomepaperwork
3. Long delays ingetting loans
4. Land registered undermale's name
5. Difficulty getting tobank location
Male Farmers
1. Collateralrequirements
2. Burdensomepaperwork
3. Long delays ingetting loans
4
Washington, D.C. 20523U.S. Agency for International Development
Step 7. Check for reliability and validity.
Key informant interviews are susceptible to error,bias, and misinterpretation, which can lead toflawed findings and recommendations.
Check representativeness of key informants. Takea second look at the key informant list to ensure nosignificant groups were overlooked.
For further information on this topic, contact AnnetteBinnendijk, CDIE Senior Evaluation Advisor, viaphone (703) 875-4235), fax (703) 875-4866), or e-mail.Copies of TIPS can be ordered from the DevelopmentInformation Services Clearinghouse by calling (703)351-4006 or by faxing (703) 351-4039. Please refer tothe PN number. To order via the Internet, address arequest to [email protected]
Table 3. Recommendations forImproving Training
RecommendationNumber ofInformants
20
Develop need-based training courses
Develop more objective selection procedures
Plan job placement after training
39
11
Table 2. Impacts on Income of aMicroenterprise Activity
“In a survey I did of the participants last year, Ifound that a majority felt their living condi-tions have improved.”
—university professor
“I have doubled my crop and profits this yearas a result of the loan I got.”
—participant
“I believe that women have not benefitted asmuch as men because it is more difficult for usto get loans.”
—female participant
Assess reliability of key informants. Assess infor-mants’ knowledgeability, credibility, impartiality,willingness to respond, and presence of outsiderswho may have inhibited their responses. Greaterweight can be given to information provided bymore reliable informants.
Check interviewer or investigator bias. One’s ownbiases as an investigator should be examined,including tendencies to concentrate on informationthat confirms preconceived notions and hypoth-eses, seek consistency too early and overlookevidence inconsistent with earlier findings, and bepartial to the opinions of elite key informants.
Check for negative evidence. Make a consciouseffort to look for evidence that questions prelimi-nary findings. This brings out issues that may havebeen overlooked.
Get feedback from informants. Ask the key infor-mants for feedback on major findings. A summaryreport of the findings might be shared with them,along with a request for written comments. Often amore practical approach is to invite them to ameeting where key findings are presented and askfor their feedback.
Selected Further Reading
These tips are drawn from Conducting Key Infor-mant Interviews in Developing Countries, byKrishna Kumar (AID Program Design and Evalua-tion Methodology Report No. 13. December 1986.PN-AAX-226).

1
PERFORMANCE MONITORING & EVALUATION
TIPS PREPARING AN EVALUATION STATEMENT OF WORK
ABOUT TIPS These TIPS provide practical advice and suggestions to USAID managers on issues related to
performance management and evaluation. This publication is a supplemental reference to the
Automated Directive System (ADS) Chapter 203.
PARTICIPATION IS KEY
Use a participatory process to ensure
resulting information will be relevant
and useful. Include a range of staff
and partners that have an interest in
the evaluation to:
Participate in planning meetings
and review the SOW;
Elicit input on potential evaluation
questions; and
Prioritize and narrow the list of
questions as a group.
WHAT IS AN
EVALUATION
STATEMENT OF
WORK (SOW)?
The statement of work (SOW) is
viewed as the single most critical
document in the development of
a good evaluation. The SOW
states (1) the purpose of an
evaluation, (2) the questions that
must be answered, (3) the
expected quality of the evaluation
results, (4) the expertise needed
to do the job and (5) the time
frame and budget available to
support the task.
WHY IS THE SOW IMPORTANT?
The SOW is important because it
is a basic road map of all the
elements of a well-crafted
evaluation. It is the substance of
a contract with external
evaluators, as well as the
framework for guiding an internal
evaluation team. It contains the
information that anyone who
implements the evaluation needs
to know about the purpose of the
evaluation, the background and
history of the program being
evaluated, and the
issues/questions that must be
addressed. Writing a SOW is
about managing the first phase of
the evaluation process. Ideally,
the writer of the SOW will also
exercise management oversight
of the evaluation process.
PREPARATION – KEY
ISSUES
BALANCING FOUR
DIMENSIONS
A well drafted SOW is a critical
first step in ensuring the
credibility and utility of the final
evaluation report. Four key
dimensions of the SOW are
NUMBER 3
2ND EDITION, 2010

2
interrelated and should be
balanced against one another
(see Figure 1):
The number and complexity of
the evaluation questions that
need to be addressed;
Adequacy of the time allotted
to obtain the answers;
Availability of funding (budget)
to support the level of
evaluation design and rigor
required; and
Availability of the expertise
needed to complete the job.
The development of the SOW is
an iterative process in which the
writer has to revisit, and
sometimes adjust, each of these
dimensions. Finding the
appropriate balance is the main
challenge faced in developing any
SOW.
ADVANCE PLANNING
It is a truism that good planning
is a necessary – but not the only –
condition for success in any
enterprise. The SOW preparation
process is itself an exercise in
careful and thorough planning.
The writer must consider several
principles when beginning the
process.
As USAID and other donors
place more emphasis on
rigorous impact evaluation, it is
essential that evaluation
planning form an integral part
of the initial program or project
design. This includes factoring
in baseline data collection,
possible comparison or „control‟
site selection, and the
preliminary design of data
collection protocols and
instruments. Decisions about
evaluation design must be
reflected in implementation
planning and in the budget.
There will always be un-
anticipated problems and
opportunities that emerge
during an evaluation. It is
helpful to build-in ways to
accommodate necessary
changes.
The writer of the SOW is, in
essence, the architect of the
evaluation. It is important to
commit adequate time and
energy to the task.
Adequate time is required to
gather information and to build
productive relationships with
stakeholders (such as program
sponsors, participants, or
partners) as well as the
evaluation team, once selected.
The sooner that information can
be made available to the
evaluation team, the more
efficient they can be in
providing credible answers to
the important questions
outlined in the SOW.
The quality of the evaluation is
dependent on providing quality
guidance in the SOW.
WHO SHOULD BE INVOLVED?
Participation in all or some part of
the evaluation is an important
decision for the development of
the SOW. USAID and evaluation
experts strongly recommend that
evaluations maximize stakeholder
participation, especially in the
initial planning process.
Stakeholders may encompass a
wide array of persons and
institutions, including policy
makers, program managers,
implementing partners, host
country organizations, and
beneficiaries. In some cases,
stakeholders may also be
involved throughout the
evaluation and with the
dissemination of results. The
benefits of stakeholder
participation include the
following:
Learning across a broader
group of decision-makers, thus
increasing the likelihood that
the evaluation findings will be
used to improve development
effectiveness;
Acceptance of the purpose and
process of evaluation by those
concerned;
A more inclusive and better
focused list of questions to be
answered;
Increased acceptance and
ownership of the process,
findings and conclusions; and
Increased possibility that the
evaluation will be used by
decision makers and other
stakeholders.
USAID operates in an increasingly
complex implementation world
3
with many players, including
other USG agencies such as the
Departments of State, Defense,
Justice and others. If the activity
engages other players, it is
important to include them in the
process.
Within USAID, there are useful
synergies that can emerge when
the SOW development process is
inclusive. For example, a SOW
that focuses on civil society
advocacy might benefit from
input by those who are experts in
rule of law.
Participation by host government
and local organizational leaders
and beneficiaries is less common
among USAID supported
evaluations. It requires sensitivity
and careful management;
however, the benefits to
development practitioners can be
substantial.
Participation of USAID managers
in evaluations is an increasingly
common practice and produces
many benefits. To ensure against
bias or conflict of interest, the
USAID manager‟s role can be
limited to participating in the fact
finding phase and contributing to
the analysis. However, the final
responsibility for analysis,
conclusions and
recommendations will rest with
the independent members and
team leader.
THE ELEMENTS OF A
GOOD EVALUATION
SOW
1. DESCRIBE THE ACTIVITY,
PROGRAM, OR PROCESS TO BE
EVALUATED
Be as specific and complete as
possible in describing what is to
be evaluated. The more
information provided at the
outset, the more time the
evaluation team will have to
develop the data needed to
answer the SOW questions.
If the USAID manager does not
have the time and resources to
bring together all the relevant
information needed to inform the
evaluation in advance, the SOW
might require the evaluation
team to submit a document
review as a first deliverable. This
will, of course, add to the amount
of time and budget needed in the
evaluation contract.
2. PROVIDE A BRIEF
BACKGROUND
Give a brief description of the
context, history and current status
of the activities or programs,
names of implementing agencies
and organizations involved, and
other information to help the
evaluation team understand
background and context. In
addition, this section should state
the development hypothesis(es)
and clearly describe the program
(or project) theory that underlies
the program‟s design. USAID
activities, programs and
strategies, as well as most
policies, are based on a set of “if-
then” propositions that predict
how a set of interventions will
produce intended results. A
development hypothesis is
generally represented in a results
framework (or sometimes a
logical framework at the project
level) and identifies the causal
relationships among various
objectives sought by the program
(see TIPS 13: Building a Results
Framework). That is, if one or
more objectives are achieved,
then the next higher order
objective will be achieved.
Whether the development
hypothesis is the correct one, or
whether it remains valid at the
time of the evaluation, is an
important question for most
evaluation SOWs to consider.
3. STATE THE PURPOSE AND
USE OF THE EVALUATION
Why is an evaluation needed?
The clearer the purpose, the more
likely it is that the evaluation will
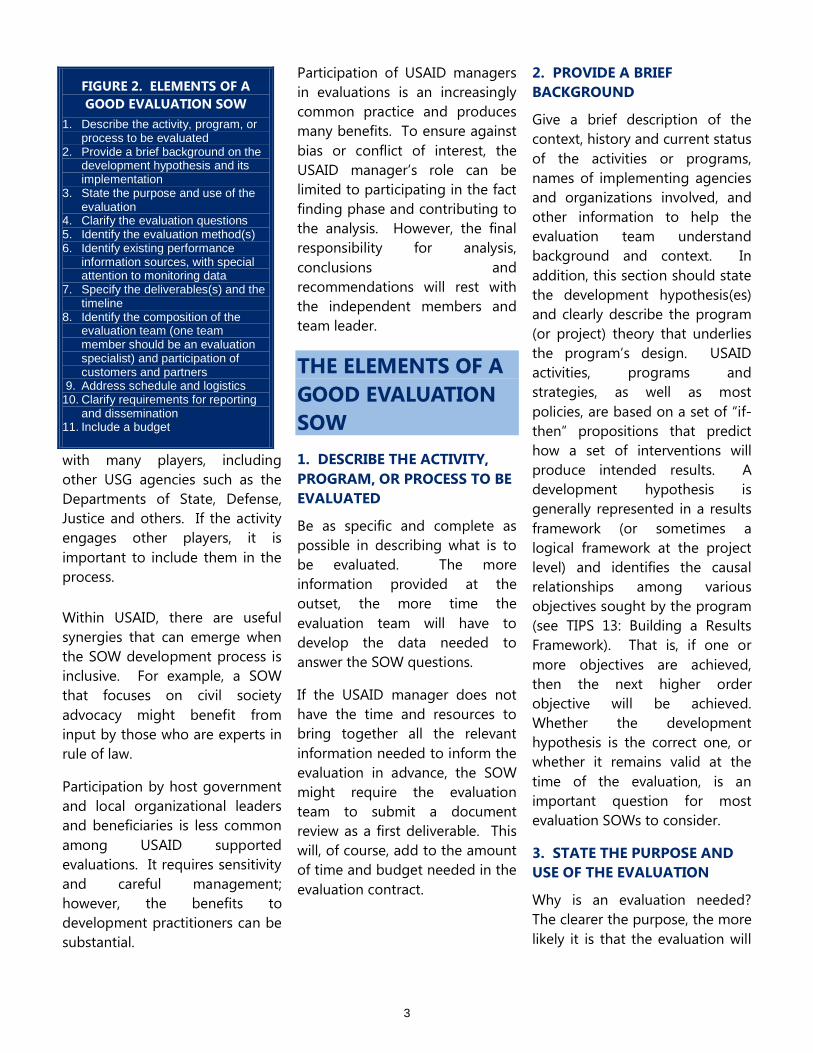
FIGURE 2. ELEMENTS OF A
GOOD EVALUATION SOW
1. Describe the activity, program, or process to be evaluated
2. Provide a brief background on the development hypothesis and its implementation
3. State the purpose and use of the evaluation
4. Clarify the evaluation questions 5. Identify the evaluation method(s) 6. Identify existing performance
information sources, with special attention to monitoring data
7. Specify the deliverables(s) and the timeline
8. Identify the composition of the evaluation team (one team member should be an evaluation specialist) and participation of customers and partners
9. Address schedule and logistics 10. Clarify requirements for reporting
and dissemination 11. Include a budget
4
produce credible and useful
findings, conclusions and
recommendations. In defining
the purpose, several questions
should be considered.
Who wants the information?
Will higher level decision
makers be part of the intended
audience?
What do they want to know?
For what purpose will the
information be used?
When will it be needed?
How accurate must it be?
ADS 203.3.6.1 identifies a number
of triggers that may inform the
purpose and use of an evaluation,
as follows:
A key management decision is
required for which there is
inadequate information;
Performance information
indicates an unexpected result
(positive or negative) that
should be explained (such as
gender differential results);
Customer, partner, or other
informed feedback suggests
that there are implementation
problems, unmet needs, or
unintended consequences or
impacts;
Issues of impact, sustainability,
cost-effectiveness, or relevance
arise;
The validity of the development
hypotheses or critical
assumptions is questioned, for
example, due to unanticipated
changes in the host country
environment; and
Periodic portfolio reviews have
identified key questions that
need to be answered or require
consensus.
4. CLARIFY THE EVALUATION
QUESTIONS
The core element of an
evaluation SOW is the list of
questions posed for the
evaluation. One of the most
common problems with
evaluation SOWs is that they
contain a long list of poorly
defined or “difficult to answer”
questions given the time, budget
and resources provided. While a
participatory process ensures
wide ranging input into the initial
list of questions, it is equally
important to reduce this list to a
manageable number of key
questions. Keeping in mind the
relationship between budget,
time, and expertise needed, every
potential question should be
thoughtfully examined by asking
a number of questions.
Is this question of essential
importance to the purpose and
the users of the evaluation?
Is this question clear, precise
and „researchable‟?
What level of reliability and
validity is expected in answering
the question?
Does determining an answer to
the question require a certain
kind of experience and
expertise?
Are we prepared to provide the
management commitment,
time and budget to secure a
credible answer to this
question?
If these questions can be
answered yes, then the team
probably has a good list of
questions that will inform the
evaluation team and drive the
evaluation process to a successful
result.
5. IDENTIFY EVALUATION
METHODS
The SOW manager has to decide
whether the evaluation design
and methodology should be
specified in the SOW.1 This
depends on whether the writer
has expertise, or has internal
access to evaluation research
knowledge and experience. If so,
and the writer is confident of the
„on the ground‟ conditions that
will allow for different evaluation
designs, then it is appropriate to
include specific requirements in
the SOW.
If the USAID SOW manager does
not have the kind of evaluation
experience needed, especially for
more formal and rigorous
evaluations, it is good practice to:
1) require that the team (or
bidders, if it is contracted out)
include a description of (or
approach for developing) the
proposed research design and
methodology, or 2) require a
detailed design and evaluation
plan to be submitted as a first
deliverable. In this way, the SOW
manager benefits from external
evaluation expertise. In either
case, the design and
methodology should not be
finalized until the team has an
opportunity to gather detailed
1 See USAID ADS 203.3.6.4 on
Evaluation Methodologies;

5
information and discuss final
issues with USAID.
The selection of the design and
data collection methods must be
a function of the type of
evaluation and the level of
statistical and quantitative data
confidence needed. If the project
is selected for a rigorous impact
evaluation, then the design and
methods used will be more
sophisticated and technically
complex. If external assistance is
necessary, the evaluation SOW
will be issued as part of the initial
RFP/RFA (Request for Proposal or
Request for Application)
solicitation process. All methods
and evaluation designs should be
as rigorous as reasonably
possible. In some cases, a rapid
appraisal is sufficient and
appropriate (see TIPS 5: Using
Rapid Appraisal Methods). At the
other extreme, planning for a
sophisticated and complex
evaluation process requires
greater up-front investment in
baselines, outcome monitoring
processes, and carefully
constructed experimental or
quasi-experimental designs.
6. IDENTIFY EXISTING
PERFORMANCE INFORMATION
Identify the existence and
availability of relevant
performance information sources,
such as performance monitoring
systems and/or previous
evaluation reports. Including a
summary of the types of data
available, the timeframe, and an
indication of their quality and
reliability will help the evaluation
team to build on what is already
available.
7. SPECIFY DELIVERABLES
AND TIMELINE
The SOW must specify the
products, the time frame, and the
content of each deliverable that is
required to complete the
evaluation contract. Some SOWs
simply require delivery of a draft
evaluation report by a certain
date. In other cases, a contract
may require several deliverables,
such as a detailed evaluation
design, a work plan, a document
review, and the evaluation report.
The most important deliverable is
the final evaluation report. TIPS
17: Constructing an Evaluation
Report provides a suggested
outline of an evaluation report
that may be adapted and
incorporated directly into this
section.
The evaluation report should
differentiate between findings,
conclusions, and
recommendations, as outlined in
Figure 3. As evaluators move
beyond the facts, greater
interpretation is required. By
ensuring that the final report is
organized in this manner,
decision makers can clearly
understand the facts on which the
evaluation is based. In addition,
it facilitates greater
understanding of where there
might be disagreements
concerning the interpretation of
those facts. While individuals
may disagree on
recommendations, they should
not disagree on the basic facts.
Another consideration is whether
a section on “lessons learned”
should be included in the final
report. A good evaluation will
produce knowledge about best
practices, point out what works,
what does not, and contribute to
the more general fund of tested
experience on which other
program designers and
implementers can draw.
Because unforeseen obstacles
may emerge, it is helpful to be as
realistic as possible about what
can be accomplished within a
given time frame. Also, include
some wording that allows USAID
and the evaluation team to adjust
schedules in consultation with the
USAID manager should this be
necessary.
8. DISCUSS THE COMPOSITION
OF THE EVALUATION TEAM
USAID evaluation guidance for
team selection strongly
recommends that at least one
team member have credentials

6
and experience in evaluation
design and methods. The team
leader must have strong team
management skills, and sufficient
experience with evaluation
standards and practices to ensure
a credible product. The
appropriate team leader is a
person with whom the SOW
manager can develop a working
partnership as the team moves
through the evaluation research
design and planning process.
He/she must also be a person
who can deal effectively with
senior U.S. and host country
officials and other leaders.
Experience with USAID is often an
important factor, particularly for
management focused
evaluations, and in formative
evaluations designed to establish
the basis for a future USAID
program or the redesign of an
existing program. If the
evaluation entails a high level of
complexity, survey research and
other sophisticated methods, it
may be useful to add a data
collection and analysis expert to
the team.
Generally, evaluation skills will be
supplemented with additional
subject matter experts. As the
level of research competence
increases in many countries
where USAID has programs, it
makes good sense to include
local collaborators, whether
survey research firms or
independents, to be full members
of the evaluation team.
9. ADDRESS SCHEDULING,
LOGISTICS AND OTHER
SUPPORT
Good scheduling and effective
local support contributes greatly
to the efficiency of the evaluation
team. This section defines the
time frame and the support
structure needed to answer the
evaluation questions at the
required level of validity. For
evaluations involving complex
designs and sophisticated survey
research data collection methods,
the schedule must allow enough
time, for example, to develop
sample frames, prepare and
pretest survey instruments,
training interviewers, and analyze
data. New data collection and
analysis technologies can
accelerate this process, but need
to be provided for in the budget.
In some cases, an advance trip to
the field by the team leader
and/or methodology expert may
be justified where extensive
pretesting and revision of
instruments is required or when
preparing for an evaluation in
difficult or complex operational
environments.
Adequate logistical and
administrative support is also
essential. USAID often works in
countries with poor infrastructure,
frequently in conflict/post-conflict
environments where security is an
issue. If the SOW requires the
team to make site visits to distant
or difficult locations, such
planning must be incorporated
into the SOW.
Particularly overseas, teams often
rely on local sources for
administrative support, including
scheduling of appointments,
finding translators and
interpreters, and arranging
transportation. In many countries
where foreign assistance experts
have been active, local consulting
firms have developed this kind of
expertise. Good interpreters are
in high demand, and are essential
to any evaluation team‟s success,
especially when using qualitative
data collection methods.
10. CLARIFY REQUIREMENTS
FOR REPORTING AND
DISSEMINATION
Most evaluations involve several
phases of work, especially for
more complex designs. The
SOW can set up the relationship
between the evaluation team, the
USAID manager and other
stakeholders. If a working group
was established to help define
the SOW questions, continue to
use the group as a forum for
interim reports and briefings
provided by the evaluation team.
The SOW should specify the
timing and details for each
briefing session. Examples of
what might be specified include:
Due dates for draft and final
reports;
Dates for oral briefings (such as
a mid-term and final briefing);
Number of copies needed;
Language requirements, where
applicable;

7
Formats and page limits;
Requirements for datasets, if
primary data has been
collected;
A requirement to submit all
evaluations to the Development
Experience Clearing house for
archiving - this is the
responsibility of the evaluation
contractor; and
Other needs for
communicating, marketing and
disseminating results that are
the responsibility of the
evaluation team.
The SOW should specify when
working drafts are to be
submitted for review, the time
frame allowed for USAID review
and comment, and the time
frame to revise and submit the
final report.
11. INCLUDE A BUDGET
With the budget section, the
SOW comes full circle. As stated,
budget considerations have to be
part of the decision making
process from the beginning.
The budget is a product of the
questions asked, human
resources needed, logistical and
administrative support required,
and the time needed to produce
a high quality, rigorous and
useful evaluation report in the
most efficient and timely manner.
It is essential for contractors to
understand the quality, validity
and rigor required so they can
develop a responsive budget that
will meet the standards set forth
in the SOW.
For more information:
TIPS publications are available online at [insert website].
Acknowledgements:
Our thanks to those whose experience and insights helped shape this publication including USAID‟s
Office of Management Policy, Budget and Performance (MPBP). This publication was written by Richard
Blue, Ph.D. of Management Systems International.
Comments regarding this publication can be directed to:
Gerald Britan, Ph.D.
Tel: (202) 712-1158
Contracted under RAN-M-00-04-00049-A-FY0S-84
Integrated Managing for Results II
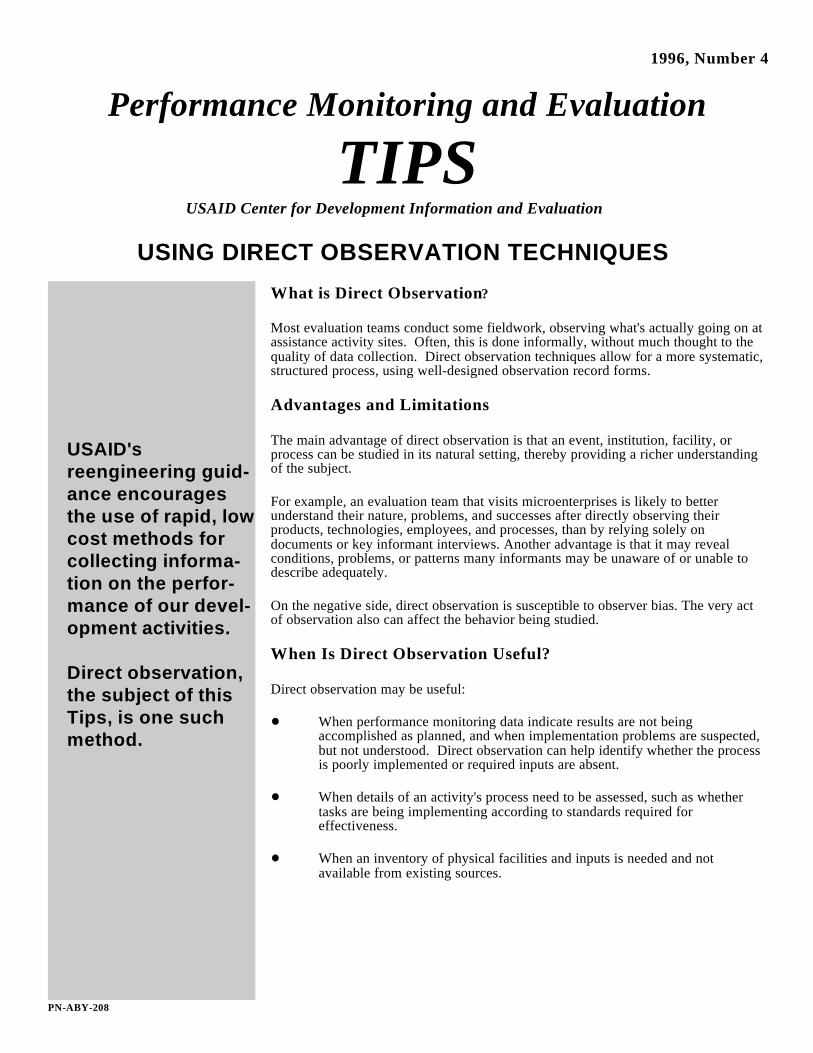
USAID'sreengineering guid-ance encouragesthe use of rapid, lowcost methods forcollecting informa-tion on the perfor-mance of our devel-opment activities.
Direct observation,the subject of thisTips, is one suchmethod.
PN-ABY-208
1996, Number 4
Performance Monitoring and Evaluation
TIPSUSAID Center for Development Information and Evaluation
USING DIRECT OBSERVATION TECHNIQUES
What is Direct Observation ?
Most evaluation teams conduct some fieldwork, observing what's actually going on atassistance activity sites. Often, this is done informally, without much thought to thequality of data collection. Direct observation techniques allow for a more systematic,structured process, using well-designed observation record forms.
Advantages and Limitations
The main advantage of direct observation is that an event, institution, facility, orprocess can be studied in its natural setting, thereby providing a richer understandingof the subject.
For example, an evaluation team that visits microenterprises is likely to betterunderstand their nature, problems, and successes after directly observing theirproducts, technologies, employees, and processes, than by relying solely ondocuments or key informant interviews. Another advantage is that it may revealconditions, problems, or patterns many informants may be unaware of or unable todescribe adequately.
On the negative side, direct observation is susceptible to observer bias. The very actof observation also can affect the behavior being studied.
When Is Direct Observation Useful?
Direct observation may be useful:
When performance monitoring data indicate results are not beingaccomplished as planned, and when implementation problems are suspected,but not understood. Direct observation can help identify whether the processis poorly implemented or required inputs are absent.
When details of an activity's process need to be assessed, such as whethertasks are being implementing according to standards required foreffectiveness.
When an inventory of physical facilities and inputs is needed and notavailable from existing sources.
2
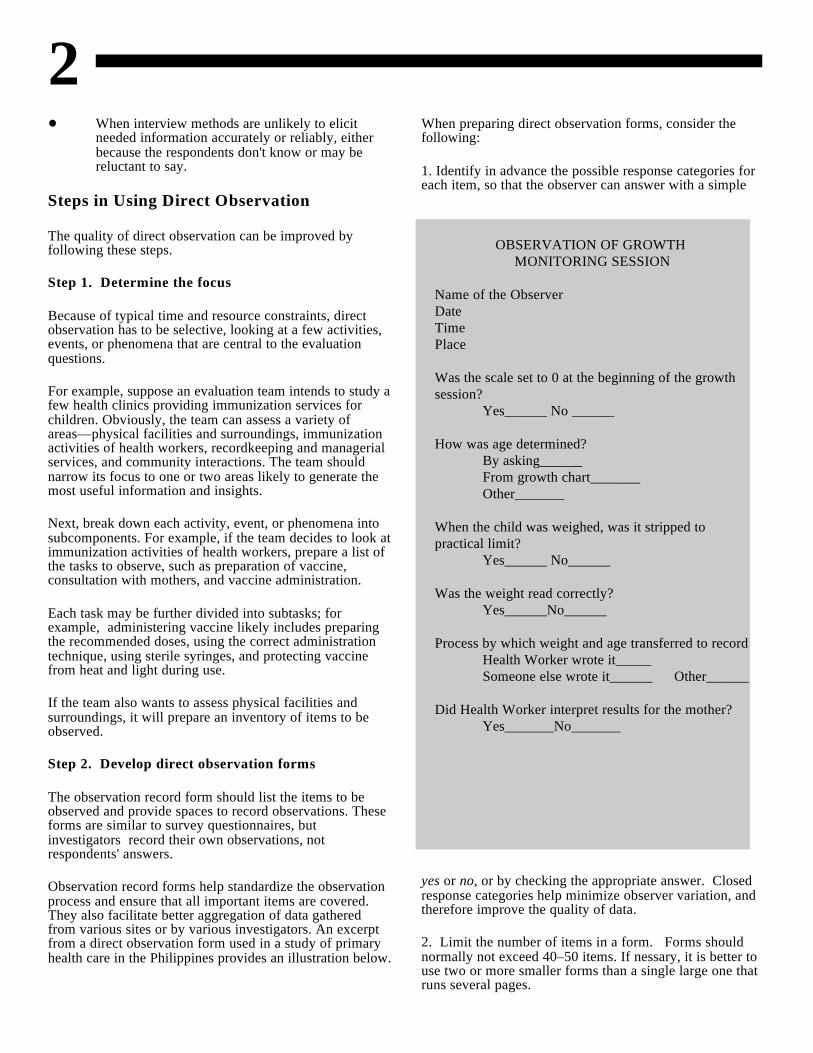
OBSERVATION OF GROWTH MONITORING SESSION
Name of the ObserverDate Time Place
Was the scale set to 0 at the beginning of the growthsession?
Yes______ No ______
How was age determined?By asking______ From growth chart_______Other_______
When the child was weighed, was it stripped topractical limit?
Yes______ No______
Was the weight read correctly?Yes______No______
Process by which weight and age transferred to recordHealth Worker wrote it_____ Someone else wrote it______ Other______
Did Health Worker interpret results for the mother?Yes_______No_______
When interview methods are unlikely to elicit When preparing direct observation forms, consider theneeded information accurately or reliably, either following:because the respondents don't know or may bereluctant to say.
Steps in Using Direct Observation
The quality of direct observation can be improved byfollowing these steps.
Step 1. Determine the focus
Because of typical time and resource constraints, directobservation has to be selective, looking at a few activities,events, or phenomena that are central to the evaluationquestions.
For example, suppose an evaluation team intends to study afew health clinics providing immunization services forchildren. Obviously, the team can assess a variety ofareas—physical facilities and surroundings, immunizationactivities of health workers, recordkeeping and managerialservices, and community interactions. The team shouldnarrow its focus to one or two areas likely to generate themost useful information and insights.
Next, break down each activity, event, or phenomena intosubcomponents. For example, if the team decides to look atimmunization activities of health workers, prepare a list ofthe tasks to observe, such as preparation of vaccine,consultation with mothers, and vaccine administration.
Each task may be further divided into subtasks; forexample, administering vaccine likely includes preparingthe recommended doses, using the correct administrationtechnique, using sterile syringes, and protecting vaccinefrom heat and light during use.
If the team also wants to assess physical facilities andsurroundings, it will prepare an inventory of items to beobserved.
Step 2. Develop direct observation forms
The observation record form should list the items to beobserved and provide spaces to record observations. Theseforms are similar to survey questionnaires, butinvestigators record their own observations, notrespondents' answers.
Observation record forms help standardize the observationprocess and ensure that all important items are covered.They also facilitate better aggregation of data gatheredfrom various sites or by various investigators. An excerptfrom a direct observation form used in a study of primaryhealth care in the Philippines provides an illustration below.
1. Identify in advance the possible response categories foreach item, so that the observer can answer with a simple
yes or no, or by checking the appropriate answer. Closedresponse categories help minimize observer variation, andtherefore improve the quality of data.
2. Limit the number of items in a form. Forms shouldnormally not exceed 40–50 items. If nessary, it is better touse two or more smaller forms than a single large one thatruns several pages.
33. Provide adequate space to record additional observations People and organizations follow daily routines associatedfor which response categories were not determined. with set times. For example, credit institutions may accept
4. Use of computer software designed to create forms canbe very helpful. It facilitates a neat, unconfusing form thatcan be easily completed.
Step 3. Select the sites
Once the forms are ready, the next step is to decide wherethe observations will be carried out and whether it will bebased on one or more sites.
A single site observation may be justified if a site can betreated as a typical case or if it is unique. Consider asituation in which all five agricultural extension centersestablished by an assistance activity have not beenperforming well. Here, observation at a single site may bejustified as a typical case. A single site observation mayalso be justified when the case is unique; for example, ifonly one of five centers had been having major problems,and the purpose of the evaluation is trying to discover why. Allow sufficient time for direct observation. Brief visits canHowever, single site observations should be avoided be deceptive partly because people tend to behavegenerally, because cases the team assumes to be typical or differently in the presence of observers. It is notunique may not be. As a rule, several sites are necessary to uncommon, for example, for health workers to becomeobtain a reasonable understanding of a situation. more caring or for extension workers to be more
In most cases, teams select sites based on experts' advice.The investigator develops criteria for selecting sites, thenrelies on the judgment of knowledgeable people. Forexample, if a team evaluating a family planning projectdecides to observe three clinics—one highly successful,one moderately successful, and one struggling clinic—it Use a team approach. If possible, two observers shouldmay request USAID staff, local experts, or other observe together. A team can develop moreinformants to suggest a few clinics for each category. The comprehensive, higher quality data, and avoid individualteam will then choose three after examining their bias.recommendations. Using more than one expert reducesindividual bias in selection.
Alternatively, sites can be selected based on data from observation forms are clear, straightforward, and mostlyperformance monitoring. For example, activity sites closed-ended.(clinics, schools, credit institutions) can be ranked frombest to worst based on performance measures, and then asample drawn from them.
Step 4. Decide on the best timing
Timing is critical in direct observation, especially when conscious or disturb the situation. In these cases, recordingevents are to be observed as they occur. Wrong timing can should take place as soon as possible after observation.distort findings. For example, rural credit
organizations receive most loan applications during theplanting season, when farmers wish to purchaseagricultural inputs. If credit institutions are observed duringthe nonplanting season, an inaccurate picture of loanprocessing may result.
loan applications in the morning; farmers in tropicalclimates may go to their fields early in the morning andreturn home by noon. Observation periods should reflectwork rhythms.
Step 5. Conduct the field observation
Establish rapport. Before embarking on direct observation,a certain level of rapport should be established with thepeople, community, or organization to be studied. Thepresence of outside observers, especially if officials orexperts, may generate some anxiety among those beingobserved. Often informal, friendly conversations canreduce anxiety levels.
Also, let them know the purpose of the observation is not toreport on individuals' performance, but to find out whatkind of problems in general are being encountered.
persuasive when being watched. However, if observersstay for relatively longer periods, people become less self-conscious and gradually start behaving naturally. It isessential to stay at least two or three days on a site togather valid, reliable data.
Train observers. If many sites are to be observed,nonexperts can be trained as observers, especially if
Step 6. Complete forms
Take notes as inconspicuously as possible. The best timefor recording is during observation. However, this is notalways feasible because it may make some people self-
Step 7. Analyze the data
Data from close-ended questions from the observationform can be analyzed using basic procedures such asfrequency counts and cross-tabulations. Statistical softwarepackages such as SAS or SPSS facilitate such statisticalanalysis and data display.

4
Direct Observation of Primary Health Care Services in the Philippines
An example of structured direct observation was aneffort to identify deficiencies in the primary healthcare system in the Philippines. It was part of alarger, multicountry research project, the PrimaryHealth Care Operations Research Project (PRICOR). The evaluators prepared direct observation formscovering the activities, tasks, and subtasks healthworkers must carry out in health clinics toaccomplish clinical objectives. These forms wereclosed-ended and in most cases observations couldsimply be checked to save time. The team looked at18 health units from a "typical" province, includingsamples of units that were high, medium and lowperformers in terms of key child survival outcomeindicators.
The evaluation team identified and quantified manyproblems that required immediate governmentattention. For example, in 40 percent of the caseswhere followup treatment was required at home,health workers failed to tell mothers the timing andamount of medication required. In 90 percent ofcases, health workers failed to explain to mothers theresults of child weighing and growth plotting, thusmissing the opportunity to involve mothers in thenutritional care of their child. Moreover, numerouserrors were made in weighing and plotting.
This case illustrates that use of closed-endedobservation instruments promotes the reliability andconsistency of data. The findings are thus morecredible and likely to influence program managers tomake needed improvements.
CDIE's Tips series provide advice and suggestions toUSAID managers on how to plan and conductperformance monitoring and evaluation activities. They are supplemental references to the reengineering automated directives system (ADS), chapter 203. Forfurther information, contact Annette Binnendijk, CDIESenior Evaluation Advisor, phone (703) 875–4235, fax(703) 875–4866, or e-mail. Tips can be ordered fromthe Development Information Services Clearinghouseby calling (703) 351-4006 or by faxing (703) 351–4039. Please refer to the PN number. To order via Internet,address requests [email protected]
Analysis of any open-ended interview questions can also sites selected; using closed-ended, unambiguous responseprovide extra richness of understanding and insights. Here, categories on the observation forms, recording observationsuse of database management software with text storage promptly, and using teams of observers at each site.capabilities, such as dBase, can be useful.
Step 8. Check for reliability and validity.
Direct observation techniques are susceptible to error andbias that can affect reliability and validity. These can beminimized by following some of the procedures suggested,such as checking the representativeness of the sample of
Selected Further Reading
Information in this Tips is based on "Rapid Data CollectionMethods for Field Assessments" by Krishna Kumar, inTeam Planning Notebook for Field-Based ProgramAssessments (USAID PPC/CDIE, 1991).
For more on direct observation techniques applied to thePhilippines health care system, see Stewart N. Blumenfeld,Manuel Roxas, and Maricor de los Santos, "SystematicObservation in the Analysis of Primary Health CareServices," in Rapid Appraisal Methods, edited by KrishnaKumar (The World Bank:1993)

PERFORMANCE MONITORING & EVALUATION
TIPS USING RAPID APPRAISAL METHODS
ABOUT TIPS These TIPS provide practical advice and suggestions to USAID managers on issues related to performance monitoring and evaluation. This publication is a supplemental reference to the Automated Directive System (ADS) Chapter 203.
WHAT IS RAPID APPRAISAL? Rapid Appraisal (RA) is an approach that draws on multiple evaluation methods and techniques to quickly, yet systematically, collect data when time in the field is limited. RA practices are also useful when there are budget constraints or limited availability of reliable secondary data. For example, time and budget limitations may preclude the option of using representative sample surveys.
BENEFITS – WHEN TO USE RAPID APPRAISAL METHODS Rapid appraisals are quick and can be done at relatively low cost. Rapid appraisal methods can help gather, analyze, and report relevant information for decision-makers within days or weeks. This is not possible with sample surveys. RAs can be used in the following cases:
• for formative evaluations, to make mid-course corrections in project design or implementation when customer or partner feedback indicates a problem (See ADS 203.3.6.1);
• when a key management decision is required and there is inadequate information;
• for performance monitoring, when data are collected and the techniques are repeated over time for measurement purposes;
• to better understand the issues behind performance monitoring data; and
• for project pre-design assessment.
LIMITATIONS – WHEN RAPID APPRAISALS ARE NOT APPROPRIATE Findings from rapid appraisals may have limited reliability and validity, and cannot be generalized to the larger population. Accordingly,
rapid appraisal should not be the sole basis for summative or impact evaluations. Data can be biased and inaccurate unless multiple methods are used to strengthen the validity of findings and careful preparation is undertaken prior to beginning field work.
WHEN ARE RAPID APPRAISAL METHODS APPROPRIATE? Choosing between rapid appraisal methods for an assessment or more time-consuming methods, such as sample surveys, should depend on balancing several factors, listed below.
• Purpose of the study. The importance and nature of the decision depending on it.
• Confidence in results. The accuracy, reliability, and validity of
NUMBER 5
2ND EDITION, 2010
1

findings needed for management decisions.
2
• Time frame. When a decision must be made.
• Resource constraints (budget).
• Evaluation questions to be answered. (see TIPS 3: Preparing an Evaluation Statement of Work)
USE IN TYPES OF EVALUATION Rapid appraisal methods are often used in formative evaluations. Findings are strengthened when evaluators use triangulation (employing more than one data collection method) as a check on the validity of findings from any one method.
Rapid appraisal methods are also used in the context of summative evaluations. The data from rapid appraisal methods and techniques complement the use of quantitative methods such as surveys based on representative sampling. For example, a randomized survey of small holder farmers may tell you that farmers have a difficult time selling their goods at market, but may not have provide you with the details of why this is occurring. A researcher could then use interviews with farmers to determine the details necessary to construct a more complete theory of why it is difficult for small holder farmers to sell their goods.
KEY PRINCIPLES FOR ENSURING USEFUL RAPID APPRAISAL DATA COLLECTION No set of rules dictates which methods and techniques should be used in a given field situation; however, a number of key principles
can be followed to ensure the collection of useful data in a rapid appraisal.
• Preparation is key. As in any evaluation, the evaluation design and selection of methods must begin with a thorough understanding of the evaluation questions and the client’s needs for evaluative information. The client’s intended uses of data must guide the evaluation design and the types of methods that are used.
• Triangulation increases the validity of findings. To lessen bias and strengthen the validity of findings from rapid appraisal methods and techniques, it is imperative to use multiple methods. In this way, data collected using one method can be compared to that collected using other methods, thus giving a researcher the ability to generate valid and reliable findings. If, for example, data collected using Key Informant Interviews reveal the same findings as data collected from Direct Observation and Focus Group Interviews, there is less chance that the findings from the first method were due to researcher bias or due to the findings being outliers. Table 1 summarizes common rapid appraisal methods and suggests how findings from any one method can be strengthened by the use of other methods.
COMMON RAPID APPRAISAL METHODS INTERVIEWS This method involves one-on-one interviews with individuals or key informants selected for their knowledge or diverse views. Interviews are qualitative, in-depth and semi-structured. Interview guides are usually used and
questions may be further framed during the interview, using subtle probing techniques. Individual interviews may be used to gain information on a general topic but cannot provide the in-depth inside knowledge on evaluation topics that
s
key informants may provide.
quickly.
MINISURVEYS A minisurvey consists of interviews with between five to fifty individuals, usually selected using non-probability sampling (sampling in which respondents are chosen based on their understanding of issues related to a purpose or specific questions, usually used when sample sizes are small and time or access to areas is limited). Structured questionnaires are used with a limited number of close-ended questions. Minisurveys generate quantitative data that can often becollected and analyzed
FOCUS GROUPS The focus group is a gathering of a homogeneous body of five to twelve participants to discuss issues and experiences among themselves. These are used to test an idea or to get a reaction on specific topics. A moderator introduces the topic, timulates and focuses the
EVALUATION METHODS COMMONLY USED IN RAPID APPRAISAL
• Interviews
• Community Discussions
• Exit Polling
• Transect Walks (see p. 3)
• Focus Groups
• Minisurveys
• Community Mapping
• Secondary Data Collection
• Group Discussions
• Customer Service Surveys
• Direct Observation
COMMUNITY DISCUSSIONS
3
documents the conversation.
respond directly to the moderator. community discussions. The
discussion, and prevents domination of discussion by a few, while another evaluator
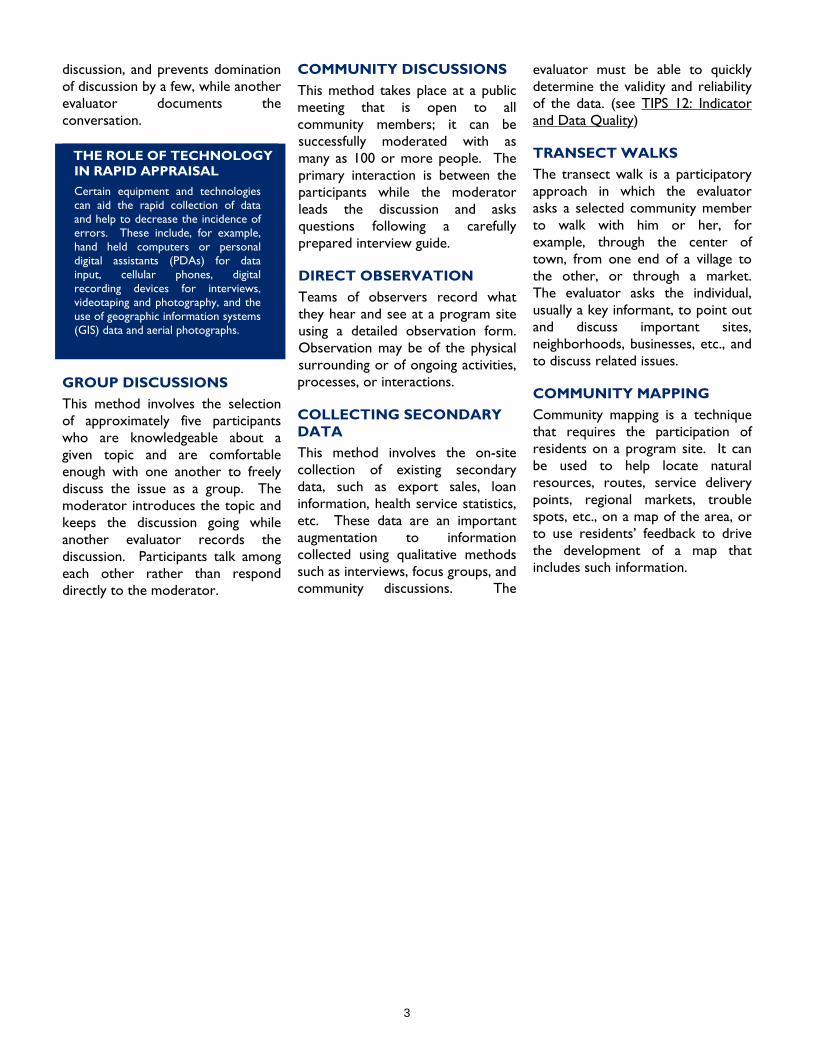
This method takes place at a public meeting that is open to all community members; it can be successfully moderated with as many as 100 or more people. The primary interaction is between the participants while the moderator leads the discussion and asks questions following a carefully prepared interview guide.
GROUP DISCUSSIONS This method involves the selection of approximately five participants who are knowledgeable about a given topic and are comfortable enough with one another to freely discuss the issue as a group. The moderator introduces the topic and keeps the discussion going while another evaluator records the discussion. Participants talk among each other rather than
DIRECT OBSERVATION Teams of observers record what they hear and see at a program site using a detailed observation form. Observation may be of the physical surrounding or of ongoing activities, processes, or interactions.
COLLECTING SECONDARY DATA This method involves the on-site collection of existing secondary data, such as export sales, loan information, health service statistics, etc. These data are an important augmentation to information collected using qualitative methods such as interviews, focus groups, and
evaluator must be able to quickly determine the validity and reliability of the data. (see TIPS 12: Indicator and Data Quality)
TRANSECT WALKS rticipatory
COMMUNITY MAPPING nique
LOGY THE ROLE OF TECHNOIN RAPID APPRAISAL Certain equipment and technologies can aid the rapid collection of data and help to decrease the incidence of errors. These include, for example, hand held computers or personal digital assistants (PDAs) for data input, cellular phones, digital recording devices for interviews, videotaping and photography, and the use of geographic information syste
The transect walk is a paapproach in which the evaluator asks a selected community member to walk with him or her, for example, through the center of town, from one end of a village to the other, or through a market. The evaluator asks the individual, usually a key informant, to point out and discuss important sites, neighborhoods, businesses, etc., and to discuss related issues.
ms (GIS) data and aerial photographs.
Community mapping is a techthat requires the participation of residents on a program site. It can be used to help locate natural resources, routes, service delivery points, regional markets, trouble spots, etc., on a map of the area, or to use residents’ feedback to drive the development of a map that includes such information.
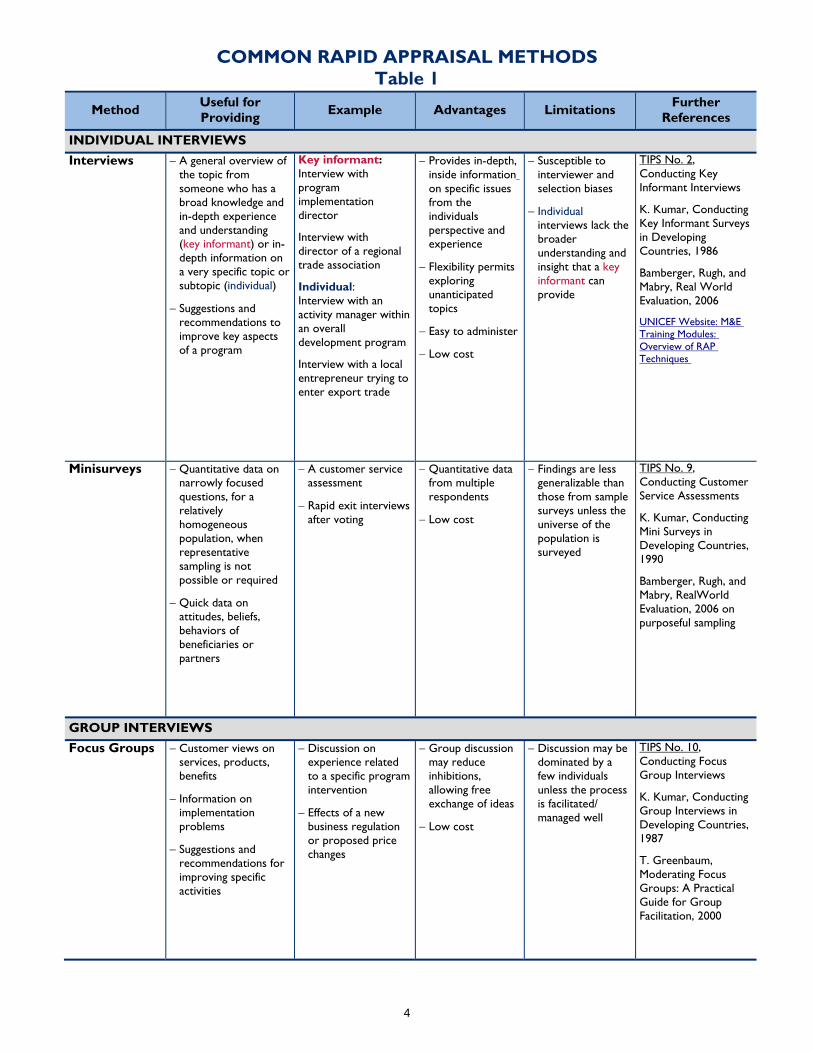
COMMON RAPID APPRAISAL METHODS Table 1
Method Useful for Providing Example Advantages Limitations Further
References
INDIVIDUAL INTERVIEWS Interviews − A general overview of
the topic from someone who has a broad knowledge and in-depth experience and understanding (key informant) or in-depth information on a very specific topic or subtopic (individual)
− Suggestions and recommendations to improve key aspects of a program
Key informant: Interview with program implementation director
Interview with director of a regional trade association
Individual: Interview with an activity manager within an overall development program
Interview with a local entrepreneur trying to enter export trade
− Provides in-depth, inside information on specific issues from the individuals perspective and experience
− Flexibility permits exploring unanticipated topics
− Easy to administer
− Low cost
− Susceptible to interviewer and selection biases
− Individual interviews lack the broader understanding and insight that a key informant can provide
TIPS No. 2, Conducting Key Informant Interviews
K. Kumar, Conducting Key Informant Surveys in Developing Countries, 1986
Bamberger, Rugh, and Mabry, Real World Evaluation, 2006
UNICEF Website: M&E Training Modules: Overview of RAP Techniques
Minisurveys − Quantitative data on narrowly focused questions, for a relatively homogeneous population, when representative sampling is not possible or required
− Quick data on attitudes, beliefs, behaviors of beneficiaries or partners
− A customer service assessment
− Rapid exit interviews after voting
− Quantitative data from multiple respondents
− Low cost
− Findings are less generalizable than those from sample surveys unless the universe of the population is surveyed
TIPS No. 9, Conducting Customer Service Assessments
K. Kumar, Conducting Mini Surveys in Developing Countries, 1990
Bamberger, Rugh, and Mabry, RealWorld Evaluation, 2006 on purposeful sampling
GROUP INTERVIEWS Focus Groups − Customer views on
services, products, benefits
− Information on implementation problems
− Suggestions and recommendations for improving specific activities
− Discussion on experience related to a specific program intervention
− Effects of a new business regulation or proposed price changes
− Group discussion may reduce inhibitions, allowing free exchange of ideas
− Low cost
− Discussion may be dominated by a few individuals unless the process is facilitated/ managed well
TIPS No. 10, Conducting Focus Group Interviews
K. Kumar, Conducting Group Interviews in Developing Countries, 1987
T. Greenbaum, Moderating Focus Groups: A Practical Guide for Group Facilitation, 2000
4

Group Discussions
− Understanding of issues from different perspectives and experiences of participants from a specific subpopulation
− Discussion with young women on access to prenatal and infant care
− Discussion with entrepreneurs about export regulations
− Small group size allows full participation
− Allows good understanding of specific topics
− Low cost
− Findings cannot be generalized to a larger population
Bamberger, Rugh, and Mabry, RealWorld Evaluation, 2006
UNICEF Website: M&E Training Modules: Community Meetings
Community Discussions
− Understanding of an issue or topic from a wide range of participants from key evaluation sites within a village, town, city, or city neighborhood
− A Town Hall meeting
− Yields a wide range of opinions on issues important to participants
− A great deal of information can be obtained at one point of time
− Findings cannot be generalized to larger population or to subpopulations of concern
− Larger groups difficult to moderate
Bamberger, Rugh, and Mabry, RealWorld Evaluation, 2006
UNICEF Website: M&E Training Modules: Community Meetings
ADDITIONAL COMMONLY USED TECHNIQUES Direct Observation
− Visual data on physical infrastructure, supplies, conditions
− Information about an agency’s or business’s delivery systems, services
− Insights into behaviors or events
− Market place to observe goods being bought and sold, who is involved, sales interactions
− Confirms data from interviews
− Low cost
− Observer bias unless two to three evaluators observe same place or activity
TIPS No. 4, Using Direct Observation Techniques
WFP Website: Monitoring & Evaluation Guidelines: What Is Direct Observation and When Should It Be Used?
Collecting Secondary Data
− Validity to findings gathered from interviews and group discussions
− Microenterprise bank loan info.
− Value and volume of exports
− Number of people served by a health clinic, social service provider
− Quick, low cost way of obtaining important quantitative data
− Must be able to determine reliability and validity of data
TIPS No. 12, Guidelines for Indicator and Data Quality
PARTICIPATORY TECHNIQUES Transect Walks
− Important visual and locational information and a deeper understanding of situations and issues
− Walk with key informant from one end of a village or urban neighborhood to another, through a market place, etc.
− Insiders viewpoint − Quick way to find
out location of places of interest to the evaluator
− Low cost
− Susceptible to interviewer and selection biases
Bamberger, Rugh, and Mabry, Real World Evaluation, 2006
UNICEF Website: M&E Training Modules: Overview of RAP Techniques
Community Mapping
− Info. on locations important for data collection that could be difficult to find
− Quick comprehension on spatial location of services/resources in a region which can give insight to access issues
− Map of village and surrounding area with locations of markets, water and fuel sources, conflict areas, etc.
− Important locational data when there are no detailed maps of the program site
− Rough locational information
Bamberger, Rugh, and Mabry, Real World Evaluation, 2006
UNICEF Website: M&E Training Modules: Overview of RAP Techniques
5

References Cited
M. Bamberger, J. Rugh, and L. Mabry, Real World Evaluation. Working Under Budget, Time, Data, and Political Constraints. Sage Publications, Thousand Oaks, CA, 2006.
T. Greenbaum, Moderating Focus Groups: A Practical Guide for Group Facilitation. Sage Publications, Thousand Oaks, CA, 2000.
K. Kumar, “Conducting Mini Surveys in Developing Countries,” USAID Program Design and Evaluation Methodology Report No. 15, 1990 (revised 2006).
K. Kumar, “Conducting Group Interviews in Developing Countries,” USAID Program Design and Evaluation Methodology Report No. 8, 1987.
K. Kumar, “Conducting Key Informant Interviews in Developing Countries,” USAID Program Design and Evaluation Methodology Report No. 13, 1989.
For more information: TIPS publications are available online at [insert website].
Acknowledgements: Our thanks to those whose experience and insights helped shape this publication including USAID’s Office of Management Policy, Budget and Performance (MPBP). This publication was authored by Patricia Vondal, PhD., of Management Systems International. Comments regarding this publication can be directed to: Gerald Britan, Ph.D. Tel: (202) 712-1158 [email protected]
Contracted under RAN-M-00-04-00049-A-FY0S-84 Integrated Managing for Results II
6
1
PERFORMANCE MONITORI NG & EVALUATION
TIPS SELECTING PERFORMANCE INDICATORS
ABOUT TIPS These TIPS provide practical advice and suggestions to USAID managers on issues related to
performance monitoring and evaluation. This publication is a supplemental reference to the
Automated Directive System (ADS) Chapter 203.
WHAT ARE
PERFORMANCE
INDICATORS?
Performance indicators define a
measure of change for the
results identified in a Results
Framework (RF). When well-
chosen, they convey whether
key objectives are achieved in a
meaningful way for
performance management.
While a result (such as an
Assistance Objective or an
Intermediate Result) identifies
what we hope to accomplish,
indicators tell us by what
standard that result will be
measured. Targets define
whether there will be an
expected increase or decrease,
and by what magnitude.1
Indicators may be quantitative
or qualitative in nature.
Quantitative indicators are
numerical: an example is a
person’s height or weight. On
the other hand, qualitative
indicators require subjective
evaluation. Qualitative data are
sometimes reported in
numerical form, but those
numbers do not have arithmetic
meaning on their own. Some
examples are a score on an
institutional capacity index or
progress along a milestone
scale. When developing
quantitative or qualitative
indicators, the important point
is that the indicator be 1 For further information, see TIPS 13:
Building a Results Framework and TIPS
8: Baselines and Targets.
constructed in a way that
permits consistent
measurement over time.
USAID has developed many
performance indicators over the
years. Some examples include
the dollar value of non-
traditional exports, private
investment as a percentage of
gross domestic product,
contraceptive prevalence rates,
child mortality rates, and
progress on a legislative reform
index.
Selecting an optimal set of indicators
to track progress against key results
lies at the heart of an effective
performance management system.
This TIPS provides guidance on how to
select effective performance
indicators.
NUMBER 6
2ND EDITION, 2010

2
WHY ARE
PERFORMANCE
INDICATORS
IMPORTANT?
Performance indicators provide
objective evidence that an
intended change is occurring.
Performance indicators lie at
the heart of developing an
effective performance
management system – they
define the data to be collected
and enable actual results
achieved to be compared with
planned results over time.
Hence, they are an
indispensable management tool
for making evidence-based
decisions about program
strategies and activities.
Performance indicators can also
be used:
To assist managers in
focusing on the
achievement of
development results.
To provide objective
evidence that results are
being achieved.
To orient and motivate staff
and partners toward
achieving results.
To communicate USAID
achievements to host
country counterparts, other
partners, and customers.
To more effectively report
results achieved to USAID's
stakeholders, including the
U.S. Congress, Office of
Management and Budget,
and citizens.
FOR WHAT RESULTS
ARE PERFORMANCE
INDICATORS
REQUIRED?
THE PROGRAM LEVEL
USAID’s ADS requires that at
least one indicator be chosen
for each result in the Results
Framework in order to measure
progress (see ADS 203.3.3.1)2.
This includes the Assistance
Objective (the highest-level
objective in the Results
Framework) as well as
supporting Intermediate Results
(IRs)3. These indicators should
be included in the Mission or
Office Performance
Management Plan (PMP) (see
TIPS 8: Preparing a PMP).
PROJECT LEVEL
AO teams are required to
collect data regularly for
projects and activities, including
inputs, outputs, and processes,
to ensure they are progressing
as expected and are
contributing to relevant IRs and
AOs. These indicators should
be included in a project-level
monitoring and evaluation 2 For further discussion of AOs and IRs
(which are also termed impact and
outcomes respectively in other
systems) refer to TIPS 13: Building a
Results Framework. 3 Note that some results frameworks
incorporate IRs from other partners if
those results are important for USAID
to achieve the AO. This is discussed in
further detail in TIPS 13: Building a
Results Framework. If these IRs are
included, then it is recommended that
they be monitored, although less
rigorous standards apply.
(M&E) plan. The M&E plan
should be integrated in project
management and reporting
systems (e.g., quarterly, semi-
annual, or annual reports).
TYPES OF
INDICATORS IN
USAID SYSTEMS
Several different types of
indicators are used in USAID
systems. It is important to
understand the different roles
and functions of these
indicators so that managers can
construct a performance
management system that
effectively meets internal
management and Agency
reporting needs.
CUSTOM INDICATORS
Custom Indicators are
performance indicators that
reflect progress within each
unique country or program
context. While they are useful
for managers on the ground,
they often cannot be
aggregated across a number of
programs like standard
indicators.
Example: Progress on a
milestone scale reflecting
legal reform and
implementation to ensure
credible elections, as follows:
Draft law is developed in
consultation with non-
governmental
organizations (NGOs) and
political parties.
Public input is elicited.

3
Draft law is modified based
on feedback.
The secretariat presents
the draft to the Assembly.
The law is passed by the
Assembly.
The appropriate
government body
completes internal policies
or regulations to
implement the law.
The example above would differ
for each country depending on
its unique process for legal
reform.
STANDARD INDICATORS
Standard indicators are used
primarily for Agency reporting
purposes. Standard indicators
produce data that can be
aggregated across many
programs. Optimally, standard
indicators meet both Agency
reporting and on-the-ground
management needs. However,
in many cases, standard
indicators do not substitute for
performance (or custom
indicators) because they are
designed to meet different
needs. There is often a tension
between measuring a standard
across many programs and
selecting indicators that best
reflect true program results and
that can be used for internal
management purposes.
Example: Number of Laws or
Amendments to Ensure
Credible Elections Adopted
with USG Technical
Assistance.
In comparing the standard
indicator above with the
previous example of a custom
indicator, it becomes clear that
the custom indictor is more
likely to be useful as a
management tool, because it
provides greater specificity and
is more sensitive to change.
Standard indicators also tend to
measure change at the output
level, because they are precisely
the types of measures that are,
at face value, more easily
aggregated across many
programs, as the following
example demonstrates.
Example: The number of
people trained in policy and
regulatory practices.
CONTEXTUAL INDICATORS
Contextual indicators are used
to understand the broader
environment in which a
program operates, to track
assumptions, or to examine
externalities that may affect
success, failure, or progress.
They do not represent program
performance, because the
indicator measures very high-
level change.
Example: Score on the
Freedom House Index or
Gross Domestic Product
(GDP).
This sort of indicator may be
important to track to
understand the context for
USAID programming (e.g. a
severe drop in GDP is likely to
affect economic growth
programming), but represents a
level of change that is outside
the manageable interest of
program managers. In most
cases, it would be difficult to
say that USAID programming
has affected the overall level of
freedom within a country or
GDP (given the size of most
USAID programs in comparison
to the host country economy,
for example).
PARTICIPATION IS ESSENTIAL
Experience suggests that
participatory approaches are an
essential aspect of developing and
maintaining effective performance
management systems. Collaboration
with development partners
(including host country institutions,
civil society organizations (CSOs),
and implementing partners) as well
as customers has important benefits.
It allows you to draw on the
experience of others, obtains buy-in
to achieving results and meeting
targets, and provides an opportunity
to ensure that systems are as
streamlined and practical as possible.
INDICATORS AND DATA—SO
WHAT’S THE DIFFERENCE?
Indicators define the particular
characteristic or dimension that will
be used to measure change. Height
is an example of an indicator.
The data are the actual
measurements or factual information
that result from the indicator. Five
feet seven inches is an example of
data.

4
WHAT ARE USAID’S
CRITERIA FOR
SELECTING
INDICATORS?
USAID policies (ADS 203.3.4.2)
identify seven key criteria to
guide the selection of
performance indicators:
Direct
Objective
Useful for Management
Attributable
Practical
Adequate
Disaggregated, as necessary
These criteria are designed to
assist managers in selecting
optimal indicators. The extent
to which performance
indicators meet each of the
criteria must be consistent with
the requirements of good
management. As managers
consider these criteria, they
should use a healthy measure
of common sense and
reasonableness. While we
always want the ―best‖
indicators, there are inevitably
trade-offs among various
criteria. For example, data for
the most direct or objective
indicators of a given result
might be very expensive to
collect or might be available
too infrequently. Table 1
includes a summary checklist
that can be used during the
selection process to assess
these trade-offs.
Two overarching factors
determine the extent to which
performance indicators function
as useful tools for managers
and decision-makers:
The degree to which
performance indicators
accurately reflect the
process or phenomenon
they are being used to
measure.
The level of comparability of
performance indicators over
time: that is, can we
measure results in a
consistent and comparable
manner over time?
1. DIRECT
An indicator is direct to the
extent that it clearly measures
the intended result. This
criterion is, in many ways, the
most important. While this may
appear to be a simple concept,
it is one of the more common
problems with indicators.
Indicators should either be
widely accepted for use by
specialists in a subject area,
exhibit readily understandable
face validity (i.e., be intuitively
understandable), or be
supported by research.
Managers should place greater
confidence in indicators that are
direct. Consider the following
example:
Result: Increased
Transparency of Key Public
Sector Institutions
Indirect Indicator: Passage
of the Freedom of
Information Act (FOIA)
Direct Indicator: Progress
on a milestone scale
demonstrating enactment
and enforcement of policies
that require open hearings
The passage of FOIA, while an
important step, does not
actually measure whether a
target institution is more
transparent. The better
example outlined above is a
more direct measure.
Level
Another dimension of whether
an indicator is direct relates to
whether it measures the right
level of the objective. A
common problem is that there
is often a mismatch between
the stated result and the
indicator. The indicator should
not measure a higher or lower
level than the result.
For example, if a program
measures improved
management practices through
the real value of agricultural
production, the indicator is
measuring a higher-level effect
than is stated (see Figure 1).
Understanding levels is rooted
in understanding the
development hypothesis
inherent in the Results
Framework (see TIPS 13:
Building a Results Framework).
Tracking indicators at each level
facilitates better understanding
and analysis of whether the

5
development hypothesis is
working. For example, if
farmers are aware of how to
implement a new technology,
but the number or percent that
actually use the technology is
not increasing, there may be
other issues that need to be
addressed. Perhaps the
technology is not readily
available in the community, or
there is not enough access to
credit. This flags the issue for
managers and provides an
opportunity to make
programmatic adjustments.
Proxy Indicators
Proxy indicators are linked to
the result by one or more
assumptions. They are often
used when the most direct
indicator is not practical (e.g.,
data collection is too costly or
the program is being
implemented in a conflict zone).
When proxies are used, the
relationship between the
indicator and the result should
be well-understood and clearly
articulated. The more
assumptions the indicator is
based upon, the weaker the
indicator. Consider the
following examples:
Result: Increased Household
Income
Proxy Indicator: Dollar
value of household
expenditures
The proxy indicator above
makes the assumption that an
increase in income will result in
increased household
expenditures; this assumption is
well-grounded in research.
Result: Increased Access to
Justice
Proxy Indicator: Number of
new courts opened
The indicator above is based on
the assumption that physical
access to new courts is the
fundamental development
problem—as opposed to
corruption, the costs associated
with using the court system, or
lack of knowledge of how to
obtain legal assistance and/or
use court systems. Proxies can
be used when assumptions are
clear and when there is research
to support that assumption.
2. OBJECTIVE
An indicator is objective if it is
unambiguous about 1) what is
being measured and 2) what
data are being collected. In
other words, two people should
be able to collect performance
information for the same
indicator and come to the same
conclusion. Objectivity is
critical to collecting comparable
data over time, yet it is one of
the most common problems
noted in audits. As a result,
pay particular attention to the
definition of the indicator to
ensure that each term is clearly
defined, as the following
examples demonstrate:
Poor Indicator: Number of
successful firms
Objective Indicator:
Number of firms with an
annual increase in revenues
of at least 5%
The better example outlines the
exact criteria for how
―successful‖ is defined and
ensures that changes in the
data are not attributable to
differences in what is being
counted.
Objectivity can be particularly
challenging when constructing
qualitative indicators. Good
qualitative indicators permit
regular, systematic judgment
about progress and reduce
subjectivity (to the extent
possible). This means that
there must be clear criteria or
protocols for data collection.
3. USEFUL FOR
MANAGEMENT
An indicator is useful to the
extent that it provides a
RESULT
INDICATOR
Increased
Production
Real value of
agricultural
production.
Improved
Management
Practices
Number and
percent of
farmers using a
new technology.
Improved
Knowledge
and
Awareness
Number and
percent of
farmers who can
identify five out
of eight steps
for
implementing a
new technology.
Figure 1. Levels

6
meaningful measure of change
over time for management
decision-making. One aspect of
usefulness is to ensure that the
indicator is measuring the ―right
change‖ in order to achieve
development results. For
example, the number of
meetings between Civil Society
Organizations (CSOs) and
government is something that
can be counted but does not
necessarily reflect meaningful
change. By selecting indicators,
managers are defining program
success in concrete ways.
Managers will focus on
achieving targets for those
indicators, so it is important to
consider the intended and
unintended incentives that
performance indicators create.
As a result, the system may
need to be fine-tuned to ensure
that incentives are focused on
achieving true results.
A second dimension is whether
the indictor measures a rate of
change that is useful for
management purposes. This
means that the indicator is
constructed so that change can
be monitored at a rate that
facilitates management actions
(such as corrections and
improvements). Consider the
following examples:
Result: Targeted legal
reform to promote
investment
Less Useful for
Management: Number of
laws passed to promote
direct investment.
More Useful for
Management: Progress
toward targeted legal reform
based on the following
stages:
Stage 1. Interested groups
propose that legislation is
needed on issue.
Stage 2. Issue is introduced
in the relevant legislative
committee/executive
ministry.
Stage 3. Legislation is
drafted by relevant
committee or executive
ministry.
Stage 4. Legislation is
debated by the legislature.
Stage 5. Legislation is
passed by full approval
process needed in legislature.
Stage 6. Legislation is
approved by the executive
branch (where necessary).
Stage 7. Implementing
actions are taken.
Stage 8. No immediate need
identified for amendments to
the law.
The less useful example may be
useful for reporting; however, it
is so general that it does not
provide a good way to track
progress for performance
management. The process of
passing or implementing laws is
a long-term one, so that over
the course of a year or two the
AO team may only be able to
report that one or two such
laws have passed when, in
reality, a high degree of effort is
invested in the process. In this
case, the more useful example
better articulates the important
steps that must occur for a law
to be passed and implemented
and facilitates management
decision-making. If there is a
problem in meeting interim
milestones, then corrections
can be made along the way.
4. ATTRIBUTABLE
An indicator is attributable if it
can be plausibly associated with
USAID interventions. The
concept of ―plausible
association‖ has been used in
USAID for some time. It does
not mean that X input equals Y
output. Rather, it is based on
the idea that a case can be
made to other development
practitioners that the program
has materially affected
identified change. It is
important to consider the logic
behind what is proposed to
ensure attribution. If a Mission
is piloting a project in three
schools, but claims national
level impact in school
completion, this would not pass
the common sense test.
Consider the following
examples:
Result: Improved Budgeting
Capacity
Less Attributable: Budget
allocation for the Ministry of
Justice (MOJ)
More Attributable: The
extent to which the budget
produced by the MOJ meets

7
established criteria for good
budgeting
If the program works with the
Ministry of Justice to improve
budgeting capacity (by
providing technical assistance
on budget analysis), the quality
of the budget submitted by the
MOJ may improve. However, it
is often difficult to attribute
changes in the overall budget
allocation to USAID
interventions, because there are
a number of externalities that
affect a country’s final budget –
much like in the U.S. For
example, in tough economic
times, the budget for all
government institutions may
decrease. A crisis may emerge
that requires the host country
to reallocate resources. The
better example above is more
attributable (and directly linked)
to USAID’s intervention.
5. PRACTICAL
A practical indicator is one for
which data can be collected on a
timely basis and at a reasonable
cost. There are two dimensions
that determine whether an
indicator is practical. The first is
time and the second is cost.
Time
Consider whether resulting data
are available with enough
frequency for management
purposes (i.e., timely enough to
correspond to USAID
performance management and
reporting purposes). Second,
examine whether data are
current when available. If
reliable data are available each
year, but the data are a year
old, then it may be problematic.
Cost
Performance indicators should
provide data to managers at a
cost that is reasonable and
appropriate as compared with
the management utility of the
data. As a very general rule of
thumb, it is suggested that
between 5% and 10% of
program or project resources
be allocated for monitoring and
evaluation (M&E) purposes.
However, it is also important to
consider priorities and program
context. A program would
likely be willing to invest more
resources in measuring changes
that are central to decision-
making and less resources in
measuring more tangential
results. A more mature
program may have to invest
more in demonstrating higher-
level changes or impacts as
compared to a new program.
6. ADEQUATE
Taken as a group, the indicator
(or set of indicators) should be
sufficient to measure the stated
result. In other words, they
should be the minimum
number necessary and cost-
effective for performance
management. The number of
indicators required to
adequately measure a result
depends on 1) the complexity
of the result being measured, 2)
the amount of information
needed to make reasonably
confident decisions, and 3) the
level of resources available.
Too many indicators create
information overload and
become overly burdensome to
maintain. Too few indicators
are also problematic, because
the data may only provide a
partial or misleading picture of
performance. The following
demonstrates how one
indicator can be adequate to
measure the stated objective:
Result: Increased Traditional
Exports in Targeted Sectors
Adequate Indicator: Value
of traditional exports in
targeted sectors
In contrast, an objective
focusing on improved maternal
health may require two or three
indicators to be adequate. A
general rule of thumb is to
select between two and three
performance indicators per
result. If many more indicators
are needed to adequately cover
the result, then it may signify
that the objective is not
properly focused.
7. DISAGGREGATED, AS
NECESSARY
The disaggregation of data by
gender, age, location, or some
other dimension is often
important from both a
management and reporting
point of view. Development
programs often affect
population cohorts or
institutions in different ways.
For example, it might be
important to know to what
extent youth (up to age 25) or
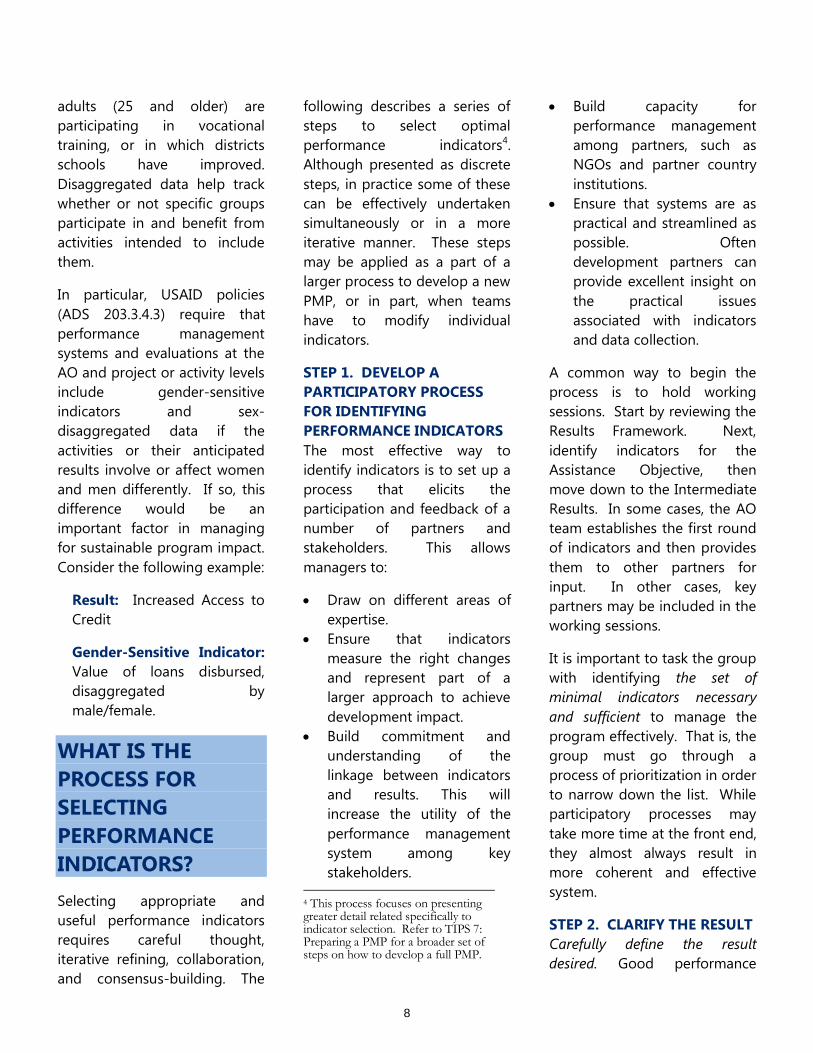
8
adults (25 and older) are
participating in vocational
training, or in which districts
schools have improved.
Disaggregated data help track
whether or not specific groups
participate in and benefit from
activities intended to include
them.
In particular, USAID policies
(ADS 203.3.4.3) require that
performance management
systems and evaluations at the
AO and project or activity levels
include gender-sensitive
indicators and sex-
disaggregated data if the
activities or their anticipated
results involve or affect women
and men differently. If so, this
difference would be an
important factor in managing
for sustainable program impact.
Consider the following example:
Result: Increased Access to
Credit
Gender-Sensitive Indicator:
Value of loans disbursed,
disaggregated by
male/female.
WHAT IS THE
PROCESS FOR
SELECTING
PERFORMANCE
INDICATORS?
Selecting appropriate and
useful performance indicators
requires careful thought,
iterative refining, collaboration,
and consensus-building. The
following describes a series of
steps to select optimal
performance indicators4.
Although presented as discrete
steps, in practice some of these
can be effectively undertaken
simultaneously or in a more
iterative manner. These steps
may be applied as a part of a
larger process to develop a new
PMP, or in part, when teams
have to modify individual
indicators.
STEP 1. DEVELOP A
PARTICIPATORY PROCESS
FOR IDENTIFYING
PERFORMANCE INDICATORS
The most effective way to
identify indicators is to set up a
process that elicits the
participation and feedback of a
number of partners and
stakeholders. This allows
managers to:
Draw on different areas of
expertise.
Ensure that indicators
measure the right changes
and represent part of a
larger approach to achieve
development impact.
Build commitment and
understanding of the
linkage between indicators
and results. This will
increase the utility of the
performance management
system among key
stakeholders. 4 This process focuses on presenting greater detail related specifically to indicator selection. Refer to TIPS 7: Preparing a PMP for a broader set of steps on how to develop a full PMP.
Build capacity for
performance management
among partners, such as
NGOs and partner country
institutions.
Ensure that systems are as
practical and streamlined as
possible. Often
development partners can
provide excellent insight on
the practical issues
associated with indicators
and data collection.
A common way to begin the
process is to hold working
sessions. Start by reviewing the
Results Framework. Next,
identify indicators for the
Assistance Objective, then
move down to the Intermediate
Results. In some cases, the AO
team establishes the first round
of indicators and then provides
them to other partners for
input. In other cases, key
partners may be included in the
working sessions.
It is important to task the group
with identifying the set of
minimal indicators necessary
and sufficient to manage the
program effectively. That is, the
group must go through a
process of prioritization in order
to narrow down the list. While
participatory processes may
take more time at the front end,
they almost always result in
more coherent and effective
system.
STEP 2. CLARIFY THE RESULT
Carefully define the result
desired. Good performance

9
indicators are based on clearly
articulated and focused
objectives. Review the precise
wording and intention of the
objective. Determine what
exactly is meant by the result.
For example, if the result is
―improved business
environment,‖ what does that
mean? What specific aspects of
the business environment will
be improved? Optimally, the
result should be stated with as
much specificity as possible. If
the result is broad (and the
team doesn’t have the latitude
to change the objective), then
the team might further define
its meaning.
Example: One AO team
further defined their IR,
―Improved Business
Environment,‖ as follows:
Making it easier to do
business in terms of resolving
disputes, obtaining licenses
from the government, and
promoting investment.
An identified set of key
policies are in place to
support investment. Key
policies include laws,
regulations, and policies
related to the simplification of
investment procedures,
bankruptcy, and starting a
business.
As the team gains greater
clarity and consensus on what
results are sought, ideas for
potential indicators begin to
emerge.
Be clear about what type of
change is implied. What is
expected to change—a
situation, a condition, the level
of knowledge, an attitude, or a
behavior? For example,
changing a country's voting
law(s) is very different from
changing citizens' awareness of
their right to vote (which is
different from voting). Each
type of change is measured by
different types of performance
indicators.
Identify more precisely the
specific targets for change. Who
or what are the specific targets
for the change? For example, if
individuals, which individuals?
For an economic growth
program designed to increase
exports, does the program
target all exporters or only
exporters of non-traditional
agricultural products? This is
known as identifying the ―unit
of analysis‖ for the performance
indicator.
STEP 3: IDENTIFY POSSIBLE
INDICATORS
Usually there are many possible
indicators for a particular result,
but some are more appropriate
and useful than others. In
selecting indicators, don’t settle
too quickly on the first ideas
that come most conveniently or
obviously to mind. Create an
initial list of possible indicators,
using the following approaches:
Conduct a brainstorming
session with colleagues to
draw upon the expertise of
the full Assistance Objective
Team. Ask, ―how will we
know if the result is
achieved?‖
Consider other resources.
Many organizations have
databases or indicator lists
for various sectors available
on the internet.
Consult with technical
experts.
Review the PMPs and
indicators of previous
programs or similar
programs in other Missions.
STEP 4. ASSESS THE BEST
CANDIDATE INDICATORS,
USING THE INDICATOR
CRITERIA
Next, from the initial list, select
the best candidates as
indicators. The seven basic
criteria that can be used to
judge an indicator’s
appropriateness and utility
described in the previous
section are summarized in
Table 1. When assessing and
comparing possible indicators,
it is helpful to use this type of
checklist to guide the
assessment process.
Remember that there will be
trade-offs between the criteria.
For example, the optimal
indicator may not be the most
cost-effective to select.
STEP 5. SELECT THE “BEST”
PERFORMANCE INDICATORS
Select the best indicators to
incorporate in the performance
management system. They

10
should be the optimum set of
measures that are useful to
management and can be
obtained at reasonable cost.
Be Strategic and Streamline
Where Possible. In recent years,
there has been a substantial
increase in the number of
indicators used to monitor and
track programs. It is important
to remember that there are
costs, in terms of time and
money, to collect data for each
indicator. AO teams should:
Select indicators based on
strategic thinking about
what must truly be achieved
for program success.
Review indicators to
determine whether any final
narrowing can be done. Are
some indicators not useful?
If so, discard them.
Use participatory
approaches in order to
discuss and establish
priorities that help
managers focus on key
indicators that are necessary
and sufficient.
Ensure that the rationale for
indicator selection is recorded in
the PMP. There are rarely
perfect indicators in the
development environment—it
is more often a case of
weighing different criteria and
making the optimal choices for
a particular program. It is
important to ensure that the
rationale behind these choices
is recorded in the PMP so that
new staff, implementers, or
auditors understand why each
indicator was selected.
STEP 6. FINE TUNE WHEN
NECESSARY
Indicators are part of a larger
system that is ultimately
designed to assist managers in
achieving development impact.
On the one hand, indicators
must remain comparable over
time but, on the other hand,
some refinements will invariably
be needed to ensure the system
is as effective as possible. (Of
course, there is no value in
continuing to collect bad data,
for example.) As a result, these
two issues need to be balanced.
Remember that indicator issues
are often flags for other
underlying problems. If a large
number of indicators are
frequently changed, this may
signify a problem with program
management or focus. At the
other end of the continuum, if
no indicators were to change
over a long period of time, it is
possible that a program is not
adapting and evolving as
necessary. In our experience,
some refinements are inevitable
as data are collected and
lessons learned. After some
rounds of data collection are
completed, it is often useful to
discuss indicator issues and
refinements among AO team
members and/or with partners
and implementers. In
particular, the period following
portfolio reviews is a good time
to refine PMPs if necessary.
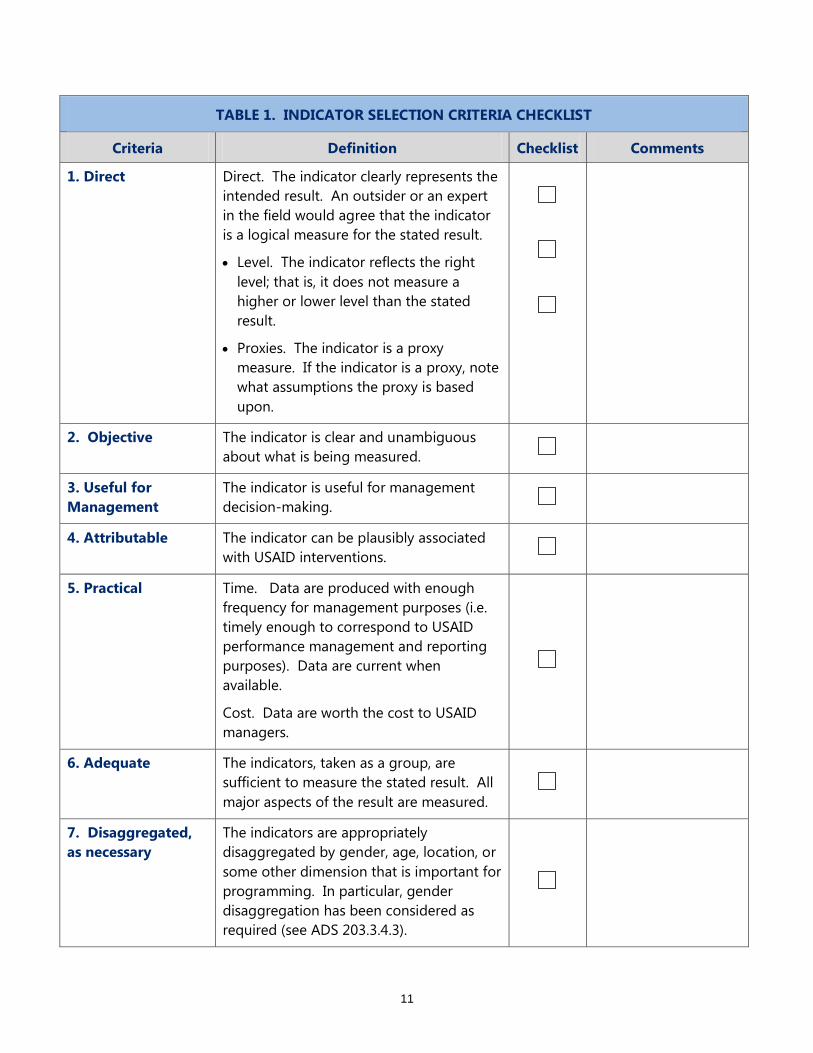
11
TABLE 1. INDICATOR SELECTION CRITERIA CHECKLIST
Criteria Definition Checklist Comments
1. Direct Direct. The indicator clearly represents the
intended result. An outsider or an expert
in the field would agree that the indicator
is a logical measure for the stated result.
Level. The indicator reflects the right
level; that is, it does not measure a
higher or lower level than the stated
result.
Proxies. The indicator is a proxy
measure. If the indicator is a proxy, note
what assumptions the proxy is based
upon.
2. Objective The indicator is clear and unambiguous
about what is being measured.
3. Useful for
Management
The indicator is useful for management
decision-making.
4. Attributable The indicator can be plausibly associated
with USAID interventions.
5. Practical Time. Data are produced with enough
frequency for management purposes (i.e.
timely enough to correspond to USAID
performance management and reporting
purposes). Data are current when
available.
Cost. Data are worth the cost to USAID
managers.
6. Adequate The indicators, taken as a group, are
sufficient to measure the stated result. All
major aspects of the result are measured.
7. Disaggregated,
as necessary
The indicators are appropriately
disaggregated by gender, age, location, or
some other dimension that is important for
programming. In particular, gender
disaggregation has been considered as
required (see ADS 203.3.4.3).

12
For more information:
TIPS publications are available online at [insert website].
Acknowledgements:
Our thanks to those whose experience and insights helped shape this publication, including Gerry Britan
and Subhi Mehdi of USAID’s Office of Management Policy, Budget and Performance (MPBP). This
publication was updated by Michelle Adams-Matson of Management Systems International.
Comments can be directed to:
Gerald Britan, Ph.D.
Tel: (202) 712-1158
Contracted under RAN-M-00-04-00049-A-FY0S-84
Integrated Managing for Results II

USAID'sreengineeringguidance requires operating unitsto prepare a PerformanceMonitoring Planfor the systematic andtimely collectionof performancedata.
This Tips offersadvice for preparing such aplan.
PN-ABY-215
1996, Number 7
Performance Monitoring and Evaluation
TIPSUSAID Center for Development Information and Evaluation
PREPARING A PERFORMANCE MONITORING PLAN
What Is a Performance Monitoring Plan?
A performance monitoring plan (PMP) is a tool USAID operating units use toplan and manage the collection of performance data. Sometimes the plan alsoincludes plans for data analysis, reporting, and use.
Reengineering guidance requires operating units to prepare PMPs once theirstrategic plans are approved. At a minimum, PMPs should include:
a detailed definition of each performance indicatorthe source, method, frequency and schedule of data collection, andthe office, team, or individual responsible for ensuring data areavailable on schedule
As part of the PMP process, it is also advisable (but not mandated) foroperating units to plan for:
how the performance data will be analyzed, and how it will be reported, reviewed, and used to inform decisions
While PMPs are required, they are for the operating unit's own use. Review bycentral or regional bureaus is not mandated, although some bureaus encouragesharing PMPs. PMPs should be updated as needed to ensure plans, schedules,and assignments remain current.
Why Are PMPs Important?
A performance monitoring plan is a critical tool for planning, managing, anddocumenting data collection. It contributes to the effectiveness of theperformance monitoring system by assuring that comparable data will becollected on a regular and timely basis. These are essential to the operation of acredible and useful performance-based management approach.
PMPs promote the collection of comparable data by sufficiently documentingindicator definitions, sources, and methods of data collection. This enablesoperating units to collect comparable data over time even when key personnelchange.
PMPs support timely collection of data by documenting the frequency andschedule of data collection as well as by assigning responsibilities. Operatingunits should also consider developing plans for data analysis, reporting, andreview efforts as part of the PMP process. It makes sense to
2Use a Participatory Approach
The Agency's reengineering directives require that operating units involve USAID's partners, customers, andstakeholders in planning approaches to monitoring performance. Experience indicates the value of collaboratingwith relevant host government officials, implementing agency staff, contractors and grantees, other donors, andcustomer groups, when preparing PMPs. They typically have the most familiarity with the quality, availability,
think through data collection, analysis, reporting, andreview as an integrated process. This will help keep theperformance monitoring system on track and ensureperformance data informs decision-making. While thereare strong arguments for including such integrated plansin the PMP document, this is not mandated in thereengineering guidance. Some operating units may wishto prepare these plans separately.
Elements of a PMP
The following elements should be considered forinclusion in a performance monitoring plan. Elements 1- 5 are required in the reengineering guidance, whereas6 -9 are suggested as useful practices.
I. Plans for Data Collection (Required)
In its strategic plan, an operating unit will have identifieda few preliminary performance indicators for each of itsstrategic objectives, strategic support objectives, andspecial objectives (referred to below simply as SOs), andUSAID-supported intermediate results (IRs). In mostcases, preliminary baselines and targets will also havebeen provided in the strategic plan. The PMP builds onthis initial information, verifying or modifying theperformance indicators, baselines and targets, anddocumenting decisions.
PMPs are required to include information outlined below(elements 1-5) on each performance indicator that hasbeen identified in the Strategic Plan for SOs and IRs.
Plans should also address how critical assumptions andresults supported by partners (such as the hostgovernment, other donors, NGOs) will be monitored,although the same standards and requirements fordeveloping indicators and collecting data do not apply. Furthermore, it is useful to include in the PMP lower-level indicators of inputs, outputs, and processes at theactivity level, and how they will be monitored andlinked to IRs and SOs.
1. Performance Indicators and Their Definitions
Each performance indicator needs a detailed definition.Be precise about all technical elements of the indicatorstatement. As an illustration, consider the indicator,number of small enterprises receiving loans from theprivate banking system. How are small enterprisesdefined -- all enterprises with 20 or fewer employees, or50 or 100? What types of institutions are considered partof the private banking sector -- credit unions, government-private sector joint-venture financialinstitutions?
Include in the definition the unit of measurement. Forexample, an indicator on the value of exports might beotherwise well defined, but it is also important to knowwhether the value will be measured in current or constantterms and in U.S. dollars or local currency.
The definition should be detailed enough to ensure thatdifferent people at different times, given the task ofcollecting data for a given indicator, would collectidentical types of data.
2. Data Source
Identify the data source for each performance indicator. The source is the entity from which the data are obtained,usually the organization that conducts the data collectioneffort. Data sources may include governmentdepartments, international organizations, other donors,NGOs, private firms, USAID offices, contractors, oractivity implementing agencies.
Be as specific about the source as possible, so the samesource can be used routinely. Switching data sources forthe same indicator over time can lead to inconsistenciesand misinterpretations and should be avoided. Forexample, switching from estimates of infant mortalityrates based on national sample surveys to estimates basedon hospital registration statistics can lead to falseimpressions of change.

3Plans may refer to needs and means for strengthening thecapacity of a particular data source to collect needed dataon a regular basis, or for building special data collectionefforts into USAID activities.
3. Method of Data Collection
Specify the method or approach to data collection foreach indicator. Note whether it is primary data collectionor is based on existing secondary data.
For primary data collection, consider:
the unit of analysis (individuals, families,communities, clinics, wells)data disaggregation needs (by gender, age, ethnicgroups, location)sampling techniques for selecting cases (randomsampling, purposive sampling); andtechniques or instruments for acquiring data onthese selected cases (structured questionnaires,direct observation forms, scales to weigh infants)
For indicators based on secondary data, give the methodof calculating the specific indicator data point and thesources of data.
Note issues of data quality and reliability. For example,using secondary data from existing sources cuts costs andefforts, but its quality may not be as reliable.
Provide sufficient detail on the data collection orcalculation method to enable it to be replicated.
4. Frequency and Schedule of Data Collection
Performance monitoring systems must gathercomparable data periodically to measure progress. Butdepending on the performance indicator, it may makesense to collect data on a quarterly, annual, or lessfrequent basis. For example, because of the expense andbecause changes are slow, fertility rate data from samplesurveys may only be collected every few years whereasdata on contraceptive distributions and sales from clinics' record systems may be gathered quarterly. PMPs canalso usefully provide the schedules (dates) for datacollection efforts.
When planning the frequency and scheduling of datacollection, an important factor to consider ismanagement's needs for timely information for decision-making.
5. Responsibilities for Acquiring Data
For each performance indicator, the responsibility theoperating unit for the timely acquisition of data fromtheir source should be clearly assigned to a particularoffice, team, or individual.
II. Plans for Data Analysis, Reporting,Review, and Use
An effective performance monitoring system needs toplan not only for the collection of data, but also for dataanalysis, reporting, review, and use. It may not bepossible to include everything in one document at onetime, but units should take the time early on for carefulplanning of all these aspects in an integrated fashion.
6. Data Analysis Plans
To the extent possible, plan in advance how performancedata for individual indicators or groups of relatedindicators will be analyzed. Identify data analysistechniques and data presentation formats to be used.Consider if and how the following aspects of dataanalysis will be undertaken:
Comparing disaggregated data. For indicators withdisaggregated data, plan how it will be compared,displayed, and analyzed.
Comparing current performance against multiplecriteria. For each indicator, plan how actual performancedata will be compared with a) past performance, b)planned or targeted performance or c) other relevant benchmarks.
Analyzing relationships among performance indicators.Plan how internal analyses of the performance data willexamine interrelationships. For example
How will a set of indicators (if there are morethan one) for a particular SO or IR be analyzedto reveal progress? What if only some of theindicators reveal progress?How will cause-effect relationships among SOsand IRs within a results framework be analyzed? How will USAID activities be linked toachieving IRs and SOs?
Analyzing cost-effectiveness. When practical andfeasible, plan for using performance data to comparesystematically alternative program approaches in termsof costs as well as results. The Government Performanceand Results Act (GPRA) encourages this.
4
CDIE's Tips series provides advice andsuggestions to USAID managers on how toplan and conduct performance monitoringand evaluation activities effectively. Theyare supplemental references to thereengineering automated directives system(ADS), chapter 203. For further informa-tion, contact Annette Binnendijk, CDIESenior Evaluation Advisor, via phone(703) 875-4235, fax (703) 875-4866, or e-mail. Copies of TIPS can be ordered fromthe Development Information ServicesClearinghouse by calling (703) 351-4006 orby faxing (703) 351-4039. Please refer tothe PN number. To order via Internet,address requests [email protected]
7. Plans for Complementary Evaluations
Reengineering stresses that evaluations should beconducted only if there is a clear management need. Itmay not always be possible or desirable to predict yearsin advance when or why they will be needed.
Nevertheless, operating units may find it useful to planon a regular basis what evaluation efforts are needed tocomplement information from the performancemonitoring system. The operating unit's internalperformance reviews, to be held periodically during the Estimate roughly the costs to the operating unit ofyear, may be a good time for such evaluation planning. collecting, analyzing, and reporting performance data forFor example, if the reviews reveal that certain a specific indicator (or set of related indicators). Identifyperformance targets are not being met, and if the reasons the source of funds.why are unclear, then planning evaluations to investigatewhy would be in order.
8. Plans for Communicating and Using PerformanceInformation
Planning how performance information will be reported,reviewed, and used is critical for effective managing forresults. For example, plan, schedule, and assignresponsibilities for internal and external reviews,briefings, and reports. Clarify what, how and whenmanagement decisions will consider performance Reengineering guidance gives a range of 3 to 10 percentinformation. Specifically, plan for the following: of the total budget for an SO as a reasonable level to
Operating unit performance reviews. Reengineeringguidance requires operating units to conduct internalreviews of performance information at regular intervalsduring the year to assess progress toward achieving SOsand IRs. In addition, activity-level reviews should beplanned regularly by SO teams to assess if activities'inputs, outputs, and processes are supportingachievement of IRs and SOs.
USAID/Washington reviews and the R4 Report. Reengineering requires operating units to prepare andsubmit to USAID/Washington an annual Results Reviewand Resource Request (R4) report, which is the basis fora joint review with USAID/W of performance andresource requirements. Help plan R4 preparation byscheduling tasks and making assignments.
External reviews, reports, and briefings. Plan forreporting and disseminating performance information tokey external audiences, such as host governmentcounterparts, collaborating NGOs, other partners, donors,customer groups, and stakeholders. Communicationtechniques may include reports, oral briefings,videotapes, memos, newspaper articles.
Influencing management decisions. The ultimate aim ofperformance monitoring systems is to promote
performance-based decision-making. To the extentpossible, plan in advance what management decision-making processes should be influenced by performanceinformation. For example, budget discussions,programming decisions, evaluation designs/scopes ofwork, office retreats, management contracts, andpersonnel appraisals often benefit from the considerationof performance information.
9. Budget
If adequate data are already available from secondarysources, costs may be minimal. If primary data must becollected at the operating unit's expense, costs can varydepending on scope, method, and frequency of datacollection. Sample surveys may cost more than$100,000, whereas rapid appraisal methods can beconducted for much less. However, often these low-costmethods do not provide quantitative data that aresufficiently reliable or representative.
spend on performance monitoring and evaluation.

NUMBER 8
2ND EDITION, 2010
PERFORMANCE MONITORING & EVALUATION
TIPS BASELINES AND TARGETS
ABOUT TIPS These TIPS provide practical advice and suggestions to USAID managers on issues related to performance monitoring and evaluation. This publication is a supplemental reference to the Automated Directive System (ADS) Chapter 203.
INTRODUCTION The achievement of planned results is at the heart of USAID’s performance management system. In order to understand where we, as project managers, are going, we need to understand where we have been. Establishing quality baselines and setting ambitious, yet achievable, targets are essential for the successful management of foreign assistance programs.
WHAT ARE BASELINES AND TARGETS? A baseline is the value of a performance indicator before the implementation of projects or activities, while a target is the specific, planned level of result to be achieved within an explicit timeframe (see ADS 203.3.4.5).
Targets are set for indicators at the Assistance Objective (AO), Intermediate Result (IR), and output levels.
WHY ARE BASELINES IMPORTANT? Baselines help managers determine progress in achieving outputs and outcomes. They also help identify the extent to which change has happened at each level of result. USAID ADS 203.3.3 requires a PMP for each AO. Program managers should provide baseline and target values for every indicator in the PMP.
Lack of baseline data not only presents challenges for management decision-making purposes, but also hinders evaluation efforts. For example, it is generally not possible to conduct a rigorous impact
evaluation without solid baseline data (see TIPS 19: Rigorous Impact Evaluation).
ESTABLISHING THE BASELINE Four common scenarios provide the context for establishing baseline data:
1. BASELINE IS ESTABLISHED
If baseline data exist prior to the start of a project or activity, additional data collected over the life of the project must be collected in a consistent manner in order to facilitate comparisons. For example, consider the drop-out rate for girls 16 and under. If baseline data are obtained from the Ministry of Education, the project should continue to collect these data from this same source, ensuring that the
1

data collection methodology remains the same.
2
Data may also be obtained from a prior implementing partner’s project, provided that the data collection protocols, instruments, and scoring procedures can be replicated. For example, a policy index might be used to measure progress of legislation (see TIPS 14: Monitoring the Policy Reform Process). If these activities become a part of a new project, program managers should consider the benefit of using the same instrument.
In cases where baseline data exist from primary or secondary sources, it is important that the data meet USAID’s data quality standards for validity, reliability, precision, integrity, and timeliness (see TIPS 12: Data Quality Standards).
2. BASELINES MUST BE COLLECTED
In cases where there are no existing data with which to establish a baseline, USAID and/or its implementing partners will have to collect it if the required data are not already being collected by, for example, a host-country government, an international organization, or another donor. Primary data collection can be expensive, particularly if data are collected through a formal survey or
a new index. Program managers should consider this cost and incorporate it into program or project planning.
Ideally, data should be collected prior to the initiation of the program. If this is not feasible, baselines should be collected as soon as possible. For example, an implementing partner may collect perception data on the level of corruption in targeted municipalities for USAID’s PMP sixty days after approval of a project’s work plan; in another case, a score on an advocacy capacity index may not be collected until Community Service Organizations (CSOs) are awarded grants. If baseline data cannot be collected until later in the course of implementing an activity, the AO Team should document when and how the baseline data will be collected (ADS 203.3.4.5).
3. BASELINES ARE ESTABLISHED ON A ROLLING BASIS
In some cases, it is possible to collect baseline data on a rolling basis as implementation proceeds. For example, imagine that a health project is being rolled out sequentially across three provinces over a three-year period. Data collected in the first province will serve as baseline for Year One; data collected in the second province will serve as baseline for the second province in Year Two; and data collected in the third province will serve as baseline for that province in Year Three.
4. BASELINE IS ZERO
For some indicators, baselines will be zero. For example, if a new program focuses on building the teaching skills of teachers, the baseline for the indicator “the number of teachers trained” is zero. Similarly, if an output of a new
program is the number of grants awarded, the baseline is zero.
The achievement of results requires the joint action of many stakeholders. Manageable interest means we, as program managers, have sufficient reason to believe that the achievement of our planned results can be significantly influenced by interventions of USAID’s program and staff resources. When setting targets, take into account the achievement of how other actors will affect outcomes and what it means for USAID to achieve success.
WHY ARE TARGETS IMPORTANT? Beyond meeting USAID requirements, performance targets are important for several reasons. They help justify a program by describing in concrete terms what USAID’s investment will produce.
Targets orient stakeholders to the tasks to be accomplished and motivate individuals involved in a program to do their best to ensure the targets are met. Targets also help to establish clear expectations for USAID staff, implementing partners, and key stakeholders. Once a program is underway, they serve as the guideposts for monitoring whether progress is being made on schedule and at the levels originally envisioned. Lastly, targets promote transparency and accountability by making available information on whether results have been achieved or not over time.
Participation of key stakeholders in setting targets helps establish a common understanding about what the project will accomplish and when. USAID staff, implementing partners, host country governments, other donors, and civil society partners, among others, should attend working sessions at the outset of program implementation to review baseline data and other information to set interim and final targets.
A natural tension exists between the need to set realistic targets and the value, from a motivational perspective, of setting targets ambitious enough to ensure that staff and stakeholders will stretch to meet them; when motivated, people can often achieve more than they
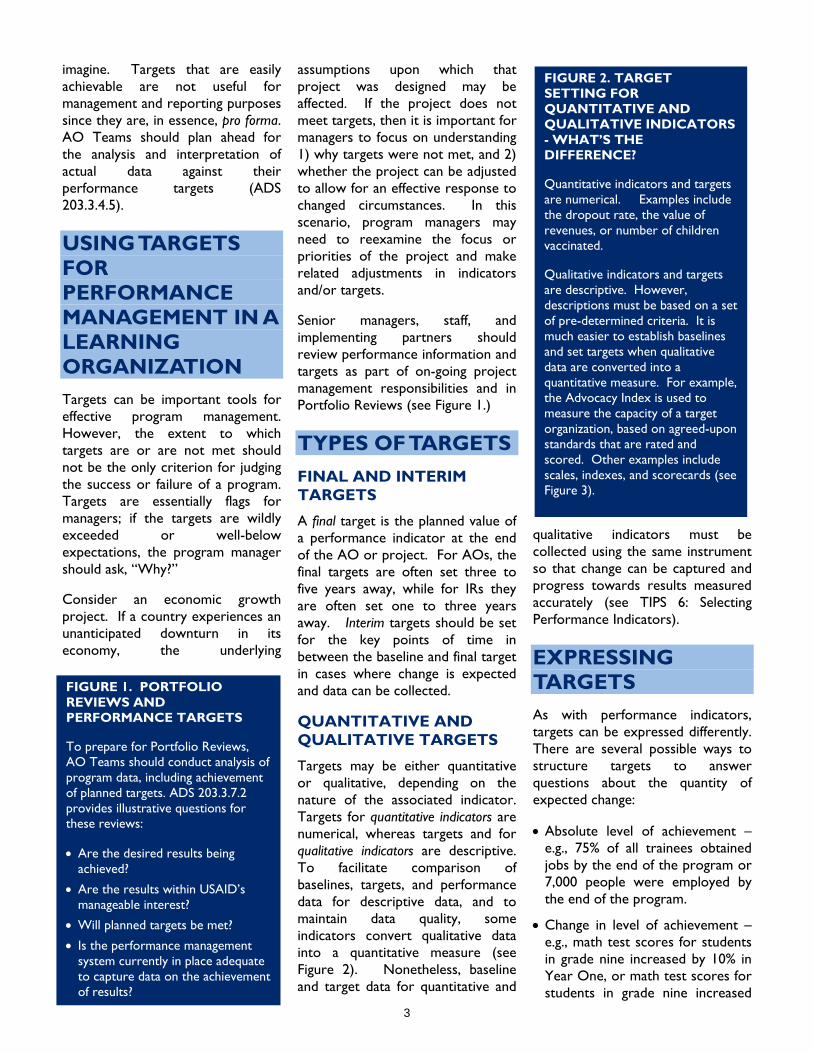
imagine. Targets that are easily achievable are not useful for management and reporting purposes since they are, in essence, pro forma. AO Teams should plan ahead for the analysis and interpretation of actual data against their performance targets (ADS 203.3.4.5).
3
FIGURE 2. TARGET SETTING FOR QUANTITATIVE AND QUALITATIVE INDICATORS - WHAT’S THE DIFFERENCE?
Quantitative indicators and targets are numerical. Examples include the dropout rate, the value of revenues, or number of children vaccinated.
Qualitative indicators and targets are descriptive. However, descriptions must be based on a set of pre-determined criteria. It is much easier to establish baselines and set targets when qualitative data are converted into a quantitative measure. For example, the Advocacy Index is used to measure the capacity of a target organization, based on agreed-upon standards that are rated and scored. Other examples include scales, indexes, and scorecards (see Figure 3).
USING TARGETS FOR PERFORMANCE MANAGEMENT IN A LEARNING ORGANIZATION Targets can be important tools for effective program management. However, the extent to which targets are or are not met should not be the only criterion for judging the success or failure of a program. Targets are essentially flags for managers; if the targets are wildly exceeded or well-below expectations, the program manager should ask, “Why?”
Consider an economic growth project. If a country experiences an unanticipated downturn in its economy, the underlying
assumptions upon which that project was designed may be affected. If the project does not meet targets, then it is important for managers to focus on understanding 1) why targets were not met, and 2) whether the project can be adjusted to allow for an effective response to changed circumstances. In this scenario, program managers may need to reexamine the focus or priorities of the project and make related adjustments in indicators and/or targets.
Senior managers, staff, and implementing partners should review performance information and targets as part of on-going project management responsibilities and in Portfolio Reviews (see Figure 1.)
TYPES OF TARGETS FINAL AND INTERIM TARGETS
A final target is the planned value of a performance indicator at the end of the AO or project. For AOs, the final targets are often set three to five years away, while for IRs they are often set one to three years away. Interim targets should be set for the key points of time in between the baseline and final target in cases where change is expected and data can be collected.
QUANTITATIVE AND QUALITATIVE TARGETS
Targets may be either quantitative or qualitative, depending on the nature of the associated indicator. Targets for quantitative indicators are numerical, whereas targets and for qualitative indicators are descriptive. To facilitate comparison of baselines, targets, and performance data for descriptive data, and to maintain data quality, some indicators convert qualitative data into a quantitative measure (see Figure 2). Nonetheless, baseline and target data for quantitative and
qualitative indicators must be collected using the same instrument so that change can be captured and progress towards results measured accurately (see TIPS 6: Selecting Performance Indicators).
EXPRESSING TARGETS FIGURE 1. PORTFOLIO
REVIEWS AND PERFORMANCE TARGETS
To prepare for Portfolio Reviews, AO Teams should conduct analysis of program data, including achievement of planned targets. ADS 203.3.7.2 provides illustrative questions for these reviews:
• Are the desired results being achieved?
• Are the results within USAID’s manageable interest?
• Will planned targets be met?
• Is the performance management system currently in place adequate to capture data on the achievement of results?
As with performance indicators, targets can be expressed differently. There are several possible ways to structure targets to answer questions about the quantity of expected change:
• Absolute level of achievement – e.g., 75% of all trainees obtained jobs by the end of the program or 7,000 people were employed by the end of the program.
• Change in level of achievement – e.g., math test scores for students in grade nine increased by 10% in Year One, or math test scores for students in grade nine increased
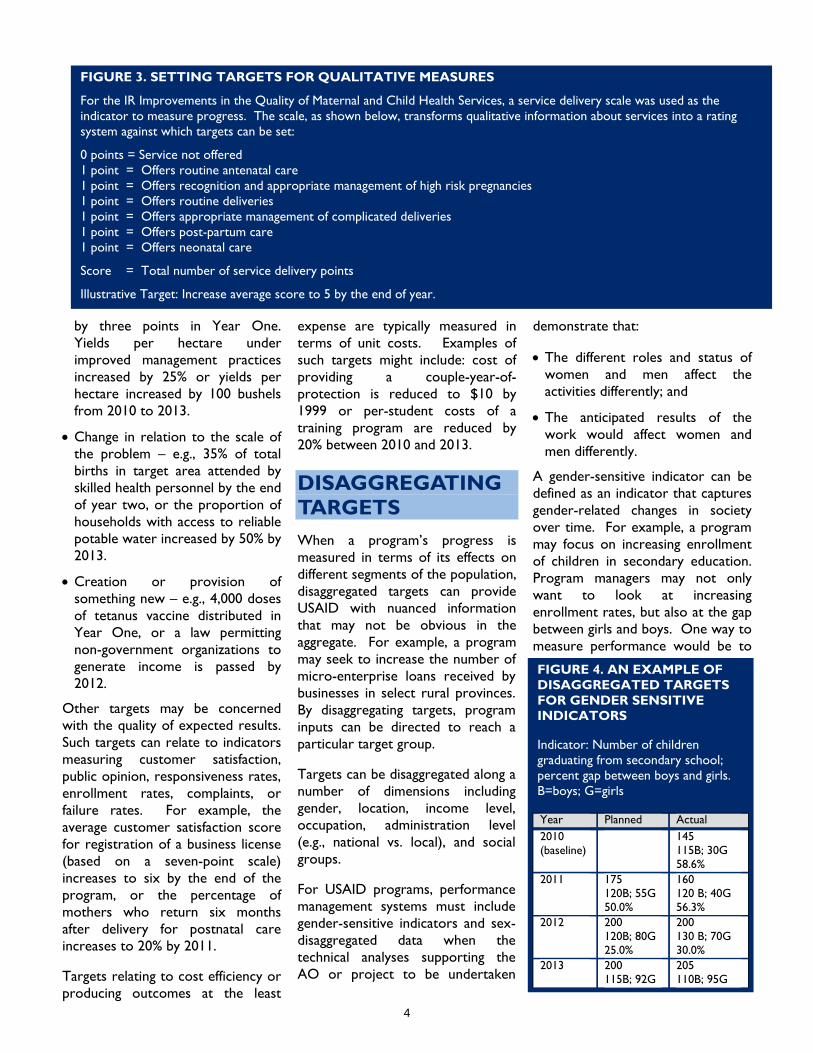
FIGURE 3. SETTING TARGETS FOR QUALITATIVE MEASURES
For the IR Improvements in the Quality of Maternal and Child Health Services, a service delivery scale was used as the indicator to measure progress. The scale, as shown below, transforms qualitative information about services into a rating system against which targets can be set:
0 points = Service not offered 1 point = Offers routine antenatal care 1 point = Offers recognition and appropriate management of high risk pregnancies 1 point = Offers routine deliveries 1 point = Offers appropriate management of complicated deliveries 1 point = Offers post-partum care 1 point = Offers neonatal care
Score = Total number of service delivery points
Illustrative Target: Increase average score to 5 by the end of year.
by three points in Year One. Yields per hectare under improved management practices increased by 25% or yields per hectare increased by 100 bushels from 2010 to 2013.
• Change in relation to the scale of the problem – e.g., 35% of total births in target area attended by skilled health personnel by the end of year two, or the proportion of households with access to reliable potable water increased by 50% by 2013.
4
• Creation or provision of something new – e.g., 4,000 doses of tetanus vaccine distributed in Year One, or a law permitting non-government organizations to generate income is passed by 2012.
Other targets may be concerned with the quality of expected results. Such targets can relate to indicators measuring customer satisfaction, public opinion, responsiveness rates, enrollment rates, complaints, or failure rates. For example, the average customer satisfaction score for registration of a business license (based on a seven-point scale) increases to six by the end of the program, or the percentage of mothers who return six months after delivery for postnatal care increases to 20% by 2011.
Targets relating to cost efficiency or producing outcomes at the least
expense are typically measured in terms of unit costs. Examples of such targets might include: cost of providing a couple-year-of- protection is reduced to $10 by 1999 or per-student costs of a training program are reduced by 20% between 2010 and 2013.
DISAGGREGATING TARGETS When a program’s progress is measured in terms of its effects on different segments of the population, disaggregated targets can provide USAID with nuanced information that may not be obvious in the aggregate. For example, a program may seek to increase the number of micro-enterprise loans received by businesses in select rural provinces. By disaggregating targets, program inputs can be directed to reach a particular target group.
Targets can be disaggregated along a number of dimensions including gender, location, income level, occupation, administration level (e.g., national vs. local), and social groups.
For USAID programs, performance management systems must include gender-sensitive indicators and sex-disaggregated data when the technical analyses supporting the AO or project to be undertaken
demonstrate that:
• The different roles and status of women and men affect the activities differently; and
• The anticipated results of the work would affect women and men differently.
A gender-sensitive indicator can be defined as an indicator that captures gender-related changes in society over time. For example, a program may focus on increasing enrollment of children in secondary education. Program managers may not only want to look at increasing enrollment rates, but also at the gap between girls and boys. One way to measure performance would be to
FIGURE 4. AN EXAMPLE OF DISAGGREGATED TARGETS FOR GENDER SENSITIVE INDICATORS
Indicator: Number of children graduating from secondary school; percent gap between boys and girls. B=boys; G=girls
Year Planned Actual 2010 (baseline)
145 115B; 30G 58.6%
2011 175 120B; 55G 50.0%
160 120 B; 40G 56.3%
2012 200 120B; 80G 25.0%
200 130 B; 70G 30.0%
2013 200 115B; 92G
205 110B; 95G

disaggregate the total number of girls and boys attending school at the beginning and at the end of the school year (see Figure 4). Another indicator might look at the quality of the participation levels of girls vs. boys with a target of increasing the amount of time girls engage in classroom discussions by two hours per week.
Gender-sensitive indicators can use qualitative or quantitative methodologies to assess impact directly on beneficiaries. They can also be used to assess the differential impacts of policies, programs, or practices supported by USAID on women and men (ADS 201.3.4.3).
Program managers should think carefully about disaggregates prior to collecting baseline data and setting targets. Expanding the number of disaggregates can increase the time and costs associated with data collection and analysis.
5
FIGURE 5. PROGRESS IS NOT ALWAYS A STRAIGHT LINE
While it is easy to establish annual targets by picking an acceptable final performance level and dividing expected progress evenly in the years between, such straight-line thinking about progress is often inconsistent with the way development programs really work. More often than not, no real progress – in terms of measureable impacts or results – is evident during the start-up period. Then, in the first stage of implementation, which may take the form of a pilot test, some but not much progress is made, while the program team adjusts its approaches. During the final two or three years of the program, all of this early work comes to fruition. Progress leaps upward, and then rides a steady path at the end of the program period. If plotted on a graph, it would look like “stair steps,” not a straight line
SETTING TARGETS Targets should be realistic, evidence-based, and ambitious. Setting meaningful targets provides staff, implementing partners, and stakeholders with benchmarks to document progress toward achieving results. Targets need to take into account program resources, the implementation period, and the development
hypothesis implicit in the results framework.
PROGRAM RESOURCES
The level of funding, human resources, material goods, and institutional capacity contribute to determining project outputs and affecting change at different levels of results and the AO. Increases or decreases in planned program resources should be considered when setting targets.
ASSISTANCE OBJECTIVES AND RESULTS FRAMEWORKS
Performance targets represent commitments that USAID AO Teams make about the level and timing of results to be achieved by a program. Determining targets is easier when objectives and indicators are within USAID’s manageable interest. Where a result sits in the causal chain, critical assumptions, and other contributors to achievement of the AO will affect targets.
Other key considerations include:
1. Historical Trends: Perhaps even more important than examining a single baseline value, is understanding the underlying historical trend in the indicator value over time. What pattern of change has been evident in the past five to ten years on the performance indicator? Is there a trend, upward
or downward, that can be drawn from existing reports, records, or statistics? Trends are not always a straight line; there may be a period during which a program plateaus before improvements are seen (see Figure 5).
2. Expert Judgments: Another option is to solicit expert opinions as to what is possible or feasible with respect to a particular indicator and country setting. Experts should be knowledgeable about the program area as well as local conditions. Experts will be familiar with what is and what is not possible from a technical and practical standpoint – an important input for any target-setting exercise.
3. Research Findings: Similarly, reviewing development literature, especially research and evaluation findings, may help in choosing realistic targets. In some program areas, such as population and health, extensive research findings on development trends are already widely available and what is possible to achieve may be well-known. In other areas, such as democracy, research on performance indicators and trends may be scarce.
4. Stakeholder Expectations: While targets should be defined on the basis of an objective assessment of what can be accomplished given certain conditions and resources, it is useful to get input from stakeholders regarding what they want, need, and expect from USAID activities. What are the expectations of progress? Soliciting expectations may involve formal interviews, rapid appraisals, or informal conversations. Not only end users should be surveyed; intermediate actors (e.g., implementing agency staff) can be especially useful in developing realistic targets.
5. Achievement of Similar Programs: Benchmarking is the

3. Setting annual performance targets. Similar to the previous approach, judgments are made about what can be achieved each year, instead of starting with a final performance level and working backwards. In both cases, consider variations in performance, e.g., seasons and timing of activities and expected results.
1. Projecting a future trend, then adding the “valued added” by USAID activities. Probably the most rigorous and credible approach, this involves estimating the future trend without USAID’s program, and then adding whatever gains can be expected as a result of USAID’s efforts. This is no simple task, as projecting the future can be very tricky. The task is made somewhat easier if historical data are available and can be used to establish a trend line.
FIGURE 6. BENCHMARKING
One increasingly popular way of setting targets and comparing performance is to look at the achievement of another program or process by one or a collection of high-performing organizations. USAID is contributing to the development of benchmarks for programs such as water governance (http://www.rewab.net), financial management (www.fdirisk.com) and health care systems (www.healthsystems2020.org) Targets may be set to reflect this “best in the business” experience, provided of course that consideration is given to the comparability of country conditions, resource availability, and other factors likely to influence the performance levels that can be achieved.
DOCUMENT AND FILE
6
process of comparing or checking the progress of other similar programs. It may be useful to analyze progress of other USAID Missions or offices, or other development agencies and partners, to understand the rate of change that can be expected in similar circumstances.
2. Establishing a final performance target for the end of the planning period, and then planning the progress from the baseline level. This approach involves deciding on the program’s performance target for the final year, and then defining a path of progress for the years in between. Final targets may be judged on benchmarking techniques or on judgments of experts, program staff, customers, or partners about the expectations of what can be reasonably achieved within the planning period. When setting interim targets, remember that progress is not always a straight line. All targets, both final and interim, should be based on a careful analysis of what is realistic to achieve, given the stage of program implementation, resource availability, country conditions, technical constraints, etc.
Typically, USAID project, baselines, targets, and actual data are kept in a data table for analysis either in the PMP, as a separate document, or electronically.
Furthermore, it is important to document in the PMP how targets were selected and why target values were chosen. Documentation serves as a future reference for:
• Explaining a target-setting methodology.
• Analyzing actual performance data.
• Setting targets in later years.
APPROACHES FOR TARGET SETTING
Responding to inquiries or audits
There is no single best approach to use when setting targets; the process is an art and a science. Although much depends on available information, the experience and knowledge of AO Team members will add to the thinking behind performance target. Alternative approaches include the following:

For more information: TIPS publications are available online at [insert website].
Acknowledgements: Our thanks to those whose experience and insights helped shape this publication, including Gerry Britan and Subhi Mehdi of USAID’s Office of Management Policy, Budget and Performance (MPBP). This publication was updated by Jill Tirnauer of Management Systems International. Comments can be directed to: Gerald Britan, Ph.D. Tel: (202) 712-1158 [email protected]
Contracted under RAN-M-00-04-00049-A-FY0S-84 Integrated Managing for Results II
7

1
ABOUT TIPSThese TIPS provide practical advice and suggestions to USAID managers on issues related to performance monitoring and evaluation. This publication is a supplemental reference to the Automated Directive Service (ADS) Chapter 203.
PERFORMANCE MONITORING & EVALUATION
TIPSCONDUCTING CUSTOMER SERVICE ASSESSMENTS
Under USAID’s new opera-tions system, Agency oper-ating units are required to
routinely and systematically assess customer needs for,
perceptions of, and reactions to USAID programs.
This TIPS gives practical ad-vice about customer service assessments— for example,
when they should be con-ducted, what methods may be used, and what informa-
tion can be usefully included.
A customer service assessment is a manage-ment tool for understanding USAID’s programs from the customer’s perspective. Most often these assessments seek feedback from custom-ers about a program’s service delivery per-formance. The Agency seeks views from both ultimate customers (the end-users, or beneficia-ries, of USAID activities—usually disadvantaged groups) and intermediate customers (persons or organizations using USAID resources, ser-vices, or products to serve the needs of the ultimate customers).
Customer service assessments may also be used to elicit opinions from customers or potential customers about USAID’s strategic plans, de-velopment objectives, or other planning issues.
WHAT IS A CUSTOMER SERVICE ASSESSMENT?
NUMBER 9 2011 Printing

2
For example, the operating unit may seek their views on development needs and priorities to help identify new, relevant activities.
USAID’s reengineered operating system calls for regularly conducting customer service as-sessments for all program activities. Experi-ence indicates that effective customer feedback on service delivery improves performance, achieves better results, and creates a more par-ticipatory working environment for programs, and thus increases sustainability.
These assessments provide USAID staff with the information they need for making construc-tive changes in the design and execution of de-velopment programs. This information may also be shared with partners and customers as an element in a collaborative, ongoing relationship. In addition, customer service assessments pro-vide input for reporting on results, allocating resources, and presenting the operating unit’s development programs to external audiences.
Customer service assessments are relevant not only to program-funded activities directed to customers external to USAID. They can also be very useful in assessing services provided to internal USAID customers.
Moreover, customer service assessments are federally mandated. The Government Perfor-mance and Results Act of 1993 and Executive Order 12862 of 1993 direct federal agencies to reorient their programs toward achievement of measurable results that reflect customers’ needs and to systematically assess those needs. Agencies must report annually to the Adminis-tration on customer service performance.
WHY CONDUCT CUSTOMER SERVICE
ASSESSMENTS?
WHO DOES CUSTOMER SERVICE ASSESSMENTS?
USAID guidance specifies that all operating units should develop a customer service plan. The plan should include information about cus-tomers’ needs, preferences, and reactions as an element in a unit’s planning, achieving, perfor-
Box 1. The Customer Service Plan
The customer service plan presents the operating unit’s vision for including custom-ers and partners to achieve its objectives. It explains how customer feedback will be incorporated to determine customer needs and perceptionsof services provided, and how this feedback will be regularly incorporated into the unit’s operations. The customer service plan is a management tool for the operating unit and does not require USAID/W approval.Specifically, the plan
• Identifies the ultimate and intermedi-ate customers for service delivery and segments customer groups for different programs, products, or services
• Describes and regularly schedules ap-propriate means for assessing service delivery, performance, and customer satisfaction
• Establishes service principles and speci-fies measurable service performance standards indicates staff responsibilities for managing customer service activi-ties—including assessments
• Specifies the resources required for cus-tomer service activities and assessments.
3
mance monitoring and evaluation functions (see Box 1). Depending on the scope of its program operations, an operating unit may find it needs to plan several customer service assessments. The various assessments might be tailored to different strategic objectives, program activities and services, or customer groups (differentiat-ed, for example, by gender, ethnicity, or income). Responsibility for designing and managing these assessments typically is assigned to the relevant development objective.
HOW DO CUSTOMER SERVICE ASSESSMENTS COMPLEMENT PERFOR-MANCE MONITORING
AND EVALUATION?
Performance monitoring and evaluation broad-ly addresses the results or outcomes of a pro-gram. These results reflect objectives chosen by the operating unit (in consultation with part-ners and customer representatives) and may encompass several types of results.
Often they are medium- to longer-term devel-opmental changes or impacts. Examples: reduc-tions in fertility rates, increases in income, im-provements in agricultural yields, reductions in forest land destroyed.
Another type of result often included in perfor-mance monitoring and evaluation involves cus-tomer perceptions and responses to goods or services delivered by a program— for example, the percentage of women satisfied with the ma-ternity care they receive, or the proportion of farmers who have tried a new seed variety and intend to use it again. Customer service assess-ments look at this type of result—customer satisfaction, perceptions, preferences, and re-lated opinions about the operating unit’s per-
formance in delivering the program’s products and services.
Unless the service or product delivery is sat-isfactory (i.e., timely, relevant, accessible, good quality) from the perspective of the customers, it is unlikely that the program will achieve its substantive development results, which, after all, ultimately depend on customers’ participation and use of the service or product. For example, a family planning program is unlikely to achieve reduced fertility rates unless customers are sat-isfied with the contraceptive productsit offers and the delivery mechanism it uses to provide them. If not sufficiently satisfied, cus-tomers will simply not use them.
Customer service assessments thus comple-ment broader performance monitoring and evaluation systems by monitoring a specific type of result: service delivery performance from the customer’s perspective. By providing managers with information on whether cus-tomers are satisfied with and using a program’s products and services, these assessments are especially useful for giving early indications of whether longer term substantive development results are likely to be met.
Both customer service assessments and perfor-mance monitoring and evaluation use the same array of standard social science investigation techniques—surveys, rapid and participatory appraisal, document reviews, and the like. In some cases, the same survey or rapid appraisal may even be used to gather both types of infor-mation. For example, a survey of customers of an irrigation program might ask questions about service delivery aspects (e.g., access, timeliness, quality, use of irrigation water) and questions concerning longer term development results (e.g., yields, income).
4
STEPS IN CONDUCTING A CUSTOMER SERVICE
ASSESSMENT
Step 1. Decide when the assessment should be done.
Customer service assessments should be con-ducted whenever the operating unit requires customer information for its management pur-poses. The general timing and frequency of cus-tomer service assessments is typically outlined in the unit’s customer service plan.
Customer service assessments are likely to be most effective if they are planned to coor-dinate with critical points in cycles associated with the program being assessed (crop cycles, local school year cycles, host country fiscal year cycles, etc.) as well as with the Agency’s own annual reporting and funding cycles.
Customer service assessments will be most valuable as management and reporting tools if they are carried out some months in advance of the operating unit’s annual planning and report-ing process. For example, if a unit’s results re-view and resources request (R4) report is to be completed by February, the customer service assessment might be conducted in November.
However, the precise scheduling and execution of assessments is a task appropriate for those responsible for results in a program sector—members of the strategic objective or results package team.
Step 2. Design the assessment.
Depending on the scale of the effort, an operat-ing unit may wish to develop a scope of work for a customer service assessment. At a minimum,
planning the assessment should 1) identify the purpose and intended uses of the information, 2) clarify the program products or services be-ing assessed, 3) identify the customer groups involved, and 4) define the issues the study will address. Moreover, the scope of work typical-ly discusses data collection methods, analysis techniques, reporting and dissemination plans, and a budget and time schedule.
Specific issues to be assessed will vary with the development objective, program activities un-der way, socioeconomic conditions, and other factors. However, customer service assess-ments generally aim at understanding
• Customer views regarding the importance of various USAID-provided services (e.g., training, information, commodities, techni-cal assistance) to their own needs and pri-orities
• Customer judgments, based on measurable service standards, on how well USAID is performing service delivery
• Customer comparisons of USAID service delivery with that of other providers.
Open-ended inquiry is especially well suited for addressing the first issue. The other two may be measured and analyzed quantitatively or quali-tatively by consulting with ultimate or interme-diate customers with respect to a number of service delivery attributes or criteria important
Box 2.Illustrative Criteria For Assessing
Service Delivery
Convenience. Ease of working with the operating unit, simple processes, minimal red tape, easy physical access to contacts

5
Responsiveness. Follow up promptly, meet changing needs, solve problems, answer ques-tions, return calls
Reliability. On-time delivery that is thor-ough, accurate, complete
Quality of products and services. Per-form as intended; flexible in meeting local needs; professionally qualified personnel
Breadth of choice. Sufficient choices to meet customer needs and preferences
Contact personnel. Professional, knowl-edgable, understand local culture, language skills
to customer satisfaction (see Box 2).
In more formal surveys, for example, customers may be asked to rate services and products on, say, a 1-to-5 scale indicating their level of satis-faction with specific service characteristics or attributes they consider important (e.g., quality, reliability, responsiveness). In addition to rating the actual services, customers may be asked what they would consider “excellent” service, referring to the same service attributes and us-ing the same 5-point scale. Analysis of the gap between what customers expect as an ideal standard and what they perceive they actually receive indicates the areas of service delivery needing improvement.
In more qualitative approaches, such as focus groups, customers discuss these issues among themselves while researchers listen carefully to their perspectives. Operating units and teams should design their customer assessments to collect customer feedback on service delivery issues and attributes they believe are most im-portant to achieving sustainable results toward a clearly defined strategic objective. These is-sues will vary with the nature of the objective
and program activity.
Step 3. Conduct the assessment.
With its objective clearly in mind, and the infor-mation to be collected carefully specified, the operating unit may decide in-house resources, external assistance consultants, or a combina-tion of the two, to conduct the assessment.
Select from a broad range of methods. A custom-er service assessment is not just a survey. It may use a broad repertory of inquiry tools designed to elicit information about the needs, prefer-ences, or reactions of customers regarding a USAID activity, product or service. Methods may include the following:
• Formal customer surveys
• rapid appraisal methods (e.g., focus groups, town meetings, interviews with key infor-mants)
• Participatory appraisal techniques, in which customers plan analyze, self-monitor, evalu-ate or set priorities for activities
• Document reviews, including systematic use of social science research conducted by others.
Use systematic research methods. A hastily pre-pared and executed effort does not provide quality customer service assessment informa-tion. Sound social science methods are essen-tial.
Practice triangulation. To the extent resources and time permit, it is preferable to gather in-formation from several sources and methods, rather than relying on just one. Such triangula-tion will build confidence in findings and pro-vide adequate depth of information for good decision-making and program management. In

6
particular, quantitative surveys and qualitative studies often complement each other. Whereas a quantitative survey can produce statistical measurements of customer satisfaction (e.g., with quality, timeliness, or other aspects of a program operation) that can be generalized to a whole population, qualitative studies can provide an in-depth understanding and insight into customer perceptions and expectations on these issues.
Conduct assessments routinely. Customer service assessments are designed to be consciously iterative. In other words, they are undertaken periodically to enable the operating unit to build a foundation of findings over time to in-form management of changing customer needs and perceptions. Maintaining an outreach orien-tation will help the program adapt to changing circumstances as reflected in customer views.
Step 4. Broadly disseminate and use assessment findings to improve perfor-mance.
Customer service assessments gain value when broadly disseminated within the operating unit, to other operating units active in similar pro-gram sectors, to partners, and more widely within USAID. Sharing this information is also important to maintaining open, transparent re-lations with customers themselves.
Assessment findings provide operating unit managers with insight on what is important to customers and how well the unit is delivering its programs. They also can help identify opera-tions that need quality improvement, provide early detection of problems, and direct atten-tion to areas where remedial action may be taken to improve delivery of services.Customer assessments form the basis for re-view of and recommitment to service prin-ciples. They enable measurement of service delivery performance against service standards
and encourage closer rapport with custom-ers and partners. Moreover, they encourage a more collaborative, participatory, and effective approach to achievement of objectives.
Selected Further Reading
Resource Manual for Customer Surveys. Statistical Policy Office, Office of Management and Bud-get. October 1993.
H. S. Plunkett and Elizabeth Baltimore, Customer Focus Cookbook, USAID/M/ROR, August 1996.
Zeithaml, Valarie A; A. Parasuraman; and Leon-ard L.Berry. Delivering Quality Service. New York: Free Press

1
ABOUT TIPSThese TIPS provide practical advice and suggestions to USAID managers on issues related to peroformance monitoring and evaluation. This publication is a supplemental reference to the Automated Directive Service (ADS) Chapter 203.
PERFORMANCE MONITORING & EVALUATION
TIPSCONDUCTING FOCUS GROUP INTERVIEWS
USAID’s guidelines en-courage use of rapid, low-
cost methods to collect information on the
performance of development assistance
activities.
Focus group interviews, the subject of this TIPS,
is one such method.
WHAT IS A FOCUS GROUP INTERVIEW?
A focus group interview is an inexpensive, rapid appraisal technique that can provide manag-ers with a wealth of qualitative information on performance of development activities, servic-es, and products, or other issues. A facilitator guides 7 to 11 people in a discussion of their experiences, feelings, and preferences about a topic. The facilitator raises issues identified in a discussion guide and uses probing techniques to solicit views, ideas, and other information. Sessions typically last one to two hours.
ADVANTAGES AND LIMITATIONS
NUMBER 10 2011 Printing

2
This technique has several advantages. It is low cost and provides speedy results. Its flexible for-mat allows the facilitator to explore unantici-pated issues and encourages interaction among participants. In a group setting participants pro-vide checks and balances, thus minimizing false or extreme views.
Focus groups have some limitations, however. The flexible format makes it susceptible to fa-cilitator bias, which can undermine the validity and reliability of findings. Discussions can be sidetracked or dominated by a few vocal individ-uals. Focus group interviews generate relevant qualitative information, but no quantitative data from which generalizations can be made for a whole population. Moreover, the information can be difficult to analyze; comments should be interpreted in the context of the group setting.
WHEN ARE FOCUS GROUP INTERVIEWS USEFUL?
Focus group interviews can be useful in all phas-es of development activities— planning, imple-mentation, monitoring, and evaluation. They can be used to solicit views, insights, and recom-mendations of program staff, customers, stake-holders, technical experts, or other groups.
They are especially appropriate when:
• program activities are being planned and it is important for managers to understand customers’ and other stakeholders’ atti-tudes, preferences or needs
• specific services or outreach approaches have to take into account customers’ pref-erences
• major program implementation problems
cannot be explained recommendations and suggestions are needed from customers, partners, experts, or other stakeholders
For example, focus groups were used to un-cover problems in a Nepal family planning pro-gram where facilities were underutilized, and to obtain suggestions for improvements from customers. The focus groups revealed that rural women considered family planning important. However, they did not use the clinics because of caste system barriers and the demeaning man-ner of clinic staff. Focus group participants sug-gested appointing staff of the same social status to ensure that rural women were treated with respect. They also suggested that rural women disseminate information to their neighbors about the health clinic.
Before deciding whether to use focus group in-terviews as a source of information, the study purpose needs to be clarified. This requires identifying who will use the information, deter-mining what information is needed, and under-standing why the information is needed. Once this is done, an appropriate methodology can be selected. (See Tips 5 Using Rapid Appraisal Methods for additional information on selecting appraisal techniques.)
STEPS IN CONDUCTING FOCUS GROUP
INTERVIEWS
Follow this step-by-step advice to help ensure high-quality results.
Step 1. Select the team
Conducting a focus group interview requires a small team, with at least a facilitator to guide the discussion and a rapporteur to record it. The facilitator should be a native speaker who

3
Excerpt from a Discussion Guide on Curative
Health Services
(20-30 minutes)
Q. Who treats/cures your children when they get sick? Why?
Note: Look for opinions about
• outcomes and results • provider-user relations • costs (consultations, transporta-
tion, medicine) • waiting time• physical aspects (privacy, cleanli-
ness)• availability of drugs, lab services• access (distance, availability of
transportation)• follow-up at home
can put people at ease. The team should have substantive knowledge of the topic under dis-cussion.
Skills and experience in conducting focus groups are also important. If the interviews are to be conducted by members of a broader evaluation team without previous experience in focus group techniques, training is suggested. This training can take the form of role playing, formalized instruction on topic sequencing and probing for generating and managing group dis-cussions, as well as pre-testing discussion guides in pilot groups.
Step 2. Select the participants
First, identify the types of groups and institu-tions that should be represented (such as pro-gram managers, customers, partners, techni-cal experts, government officials) in the focus groups. This will be determined by the inform-tion needs of the study. Often separate focus groups are held for each type of group. Second, identify the most suitable people in each group. One of the best approaches is to consult key informants who know about local conditions. It is prudent to consult several informants to minimize the biases of individual preferences.
Each focus group should be 7 to 11 people to allow the smooth flow of conversation.
Participants should be homogenous, from simi-lar socioeconomic and cultural backgrounds. They should share common traits related to the discussion topic. For example, in a discussion on contraceptive use, older and younger wom-en should participate in separate focus groups. Younger women may be reluctant to discuss sexual behavior among their elders, especially if it deviates from tradition. Ideally, people should not know each other. Anonymity lowers inhibi-tion and prevents formation of cliques.
Step 3. Decide on timing and location
Discussions last one to two hours and should be conducted in a convenient location with some degree of privacy. Focus groups in a small village arouse curiosity and can result in unin-vited participants. Open places are not good spots for discussions.
Step 4. Prepare the discussion guide
The discussion guide is an outline, prepared in advance, that covers the topics and issues to be discussed. It should contain few items, allowing some time and flexibility to pursue unanticipat-ed but relevant issues.

4
The guide provides the framework for the fa-cilitator to explore, probe, and ask questions. Initiating each topic with a carefully crafted question will help keep the discussion focused. Using a guide also increases the comprehen-siveness of the data and makes data collection more efficient. Its flexibility, however can mean that different focus groups are asked different questions, reducing the credibility of the find-ings. An excerpt from a discussion guide used in Bolivia to assess child survival services pro-vides an illustration. (See box on page 3)
Step 5. Conduct the interview
Establish rapport. Often participants do not know what to expect from focus group discus-sions. It is helpful for the facilitator to outline the purpose and format of the discussion at the beginning of the session, and set the group at ease. Participants should be told that the dis-cussion is informal, everyone is expected to participate, and divergent views are welcome.
Phrase questions carefully. Certain types of ques-tions impede group discussions. For example, yes-or-no questions are one dimensional and do not stimulate discussion. “Why” questions put people on the defensive and cause them to take “politically correct” sides on controversial issues.
Open-ended questions are more useful be-cause they allow participants to tell their story in their own words and add details that can re-sult in unanticipated findings. For example:
• What do you think about the criminal jus-tice system?
• How do you feel about the upcoming na-tional elections?
If the discussion is too broad the facilitator can narrow responses by asking such questions as:
• What do you think about corruption in the criminal justice system?
• How do you feel about the three parties running in upcoming national elections?
Use probing techniques. When participants give incomplete or irrelevant answers, the facilitator can probe for fuller, clearer responses. A few suggested techniques:
Repeat the question—repetition gives more time to think
Adopt sophisticated naivete” posture—conveylimited understanding of the issue and ask for specific details
Pause for the answer—a thoughtful nod or ex-pectant look can convey that you want a fuller answer
Repeat the reply—hearing it again sometimes stimulates conversation. Ask when, what, where, which, and how questions—they pro-voke more detailed information
Use neutral comments— Anything else?” Why do you feel this way?”
Control the discussion. In most groups a few indi-viduals dominate the discussion. To balance out participation:
• Address questions to individuals who are reluctant to talk
• Give nonverbal cues (look in another direc-tion or stop taking notes when an individual talks for an extended period)
• Intervene, politely summarize the point, then refocus the discussion
5
• Take advantage of a pause and say, “Thank you for that interesting idea, perhaps we can discuss it in a separate session. Meanwhile with your consent, I would like to move on to another item.”
Minimize group pressure. When an idea is being adopted without any general discussion or dis-agreement, more than likely group pressure is occurring. To minimize group pressure the fa-cilitator can probe for alternate views. For ex-ample, the facilitator can raise another issue, or say, “We had an interesting discussion but let’s explore other alter natives.”
Step 6. Record the discussion
A rapporteur should perform this function. Tape recordings in conjunction with written notes are useful. Notes should be extensive and reflect the content of the discussion as well as nonverbal behavior (facial expressions, hand movements).
Shortly after each group interview, the team should summarize the information, the team’s impressions, and implications of the informa-tion for the study.
Discussion should be reported in participants’ language, retaining their phrases and grammati-cal use. Summarizing or paraphrasing responses can be misleading. For instance, a verbatim reply “Yes, indeed! I am positive,” loses its intensity when recorded as “Yes.”
Step 7. Analyze results
After each session, the team should assemble the interview notes (transcripts of each focus group interview), the summaries, and any other relevant data to analyze trends and patterns. The following method can be used.
Read summaries all at one time. Note potential
trends andpatterns, strongly held or frequently aired opinions.
Read each transcript. Highlight sections that cor-respond to the discussion guide questions and mark comments that could be used in the final report.
Analyze each question separately. After reviewing all the responses to a question or topic, write a summary statement that describes the discus-sion. In analyzing the results, the team should consider:
• Words. Weigh the meaning of words par-ticipants used. Can a variety of words and phrases categorize similar responses?
• Framework. Consider the circumstances in which a comment was made (context of previous discussions, tone and intensity of the comment).
• Internal agreement. Figure out whether shifts in opinions during the discussion were caused by group pressure.
• Precision of responses. Decide which respons-es were based on personal experience and give them greater weight than those based on vague impersonal impressions.
• The big picture. Pinpoint major ideas. Allo-cate time to step back and reflect on major findings.
• Purpose of the report. Consider the ob-jectives of the study and the information needed for decisionmaking. The type and scope of reporting will guide the analytical process. For example, focus group reports typically are: (1) brief oral reports that high-light key findings; (2) descriptive reports that summarize the discussion; and (3) ana-lytical reports that provide trends, patterns,

6
or findings and include selected comments.
Focus Group Interviews of Navarongo CommunityHealth and Family Planning Project in Ghana
The Ghanaian Ministry of Health launched a small pilot project in three villages in 1994 to assess community reaction to family planning and elicit community advice on program design and management. A new model of service delivery-was introduced: community health nurses were retrained as community health officers living in the communities and providing village-based clinical services.Focus group discussions were used to identify constraints to introducing fam-ily planning services and clarify ways to design operations that villagers value.
Discussions revealed that many women want more control over their ability to reproduce, but believe their preferences are irrelevant to decisions made in the male dominated lineage system. This indicated that outreach programs aimed primarily at women are insufficient. Social groups must be included to legitimize and support individuals’ family-planning decisions. Focus group dis-cussions also revealed women’s concerns about the confidentiality of informa-tion and services. These findings preclude development of a conventional com-munitybased distribution program, since villagers clearly prefer outside service delivery workers to those who are community members.
Selected Further ReadingKrishna Kumar, Conducting Group Interviews in Developing Countries, A.I.D. Program Design and Evaluation Methodology Report No. 8, 1987 (PN-AAL-088)
Richard A. Krueger, Focus Groups: A Practical Guide for Applied Research, Sage Publications, 1988

1
PERFORMANCE MONITORING & EVALUATION
TIPS DATA QUALITY STANDARDS
ABOUT TIPS These TIPS provide practical advice and suggestions to USAID managers on issues related to
performance monitoring and evaluation. This publication is a supplemental reference to the
Automated Directive System (ADS) Chapter 203.
WHY IS DATA
QUALITY
IMPORTANT?
Results-focused development
programming requires
managers to design and
implement programs based
on evidence. Since data play a
central role in establishing
effective performance
management systems, it is
essential to ensure good data
quality (see Figure 1).
Without this, decision makers
do not know whether to have
confidence in the data, or
worse, could make decisions
based on misleading data.
Attention to data quality
assists in:
Ensuring that limited
development resources are
used as effectively as
possible
Ensuring that Agency
program and budget
decisions in Washington
and the field are as well
2009, NUMBER 12
2ND EDITION
Data
Quality
Figure 1. Data Quality Plays a Central Role in Developing
Effective Performance Management Systems
Cycle: Plan: Identify or Refine Key Program ObjectivesDesign: Develop or Refine the Performance Management PlanAnalyze Data Use Data: Use Findings from Data Analysis to Improve Program Effectiveness

2
The Five Data Quality
Standards
1. Validity
2. Reliability
3. Precision
4. Integrity
5. Timeliness
informed as practically
possible
Meeting the requirements
of the Government
Performance and Results
Act (GPRA)
Reporting the impact of
USAID programs to external
stakeholders, including
senior management, OMB,
the Congress, and the
public with confidence
DATA QUALITY
STANDARDS
Data quality is one element of
a larger interrelated
performance management
system. Data quality flows
from a well designed and
logical strategic plan where
Assistance Objectives (AOs)
and Intermediate Results (IRs)
are clearly identified. If a
result is poorly defined, it is
difficult to identify quality
indicators, and further,
without quality indicators, the
resulting data will often have
data quality problems.
One key challenge is to
determine what level of data
quality is acceptable (or “good
enough”) for management
purposes. It is important to
understand that we rarely
require the same degree of
rigor as needed in research or
for laboratory experiments.
Standards for data quality
must be keyed to our
intended use of the data. That
is, the level of accuracy,
currency, precision, and
reliability of performance
information should be
consistent with the
requirements of good
management. Determining
appropriate or adequate
thresholds of indicator and
data quality is not an exact
science. This task is made
even more difficult by the
complicated and often data-
poor development settings in
which USAID operates.
As with performance
indicators, we sometimes have
to consider trade-offs, or
make informed judgments,
when applying the standards
for data quality. This is
especially true if, as is often
the case, USAID relies on
others to provide data for
indicators. For example, if our
only existing source of data
for a critical economic growth
indicator is the Ministry of
Finance, and we know that the
Ministry’s data collection
methods are less than perfect,
we may have to weigh the
alternatives of relying on less-
than-ideal data, having no
data at all, or conducting a
potentially costly USAID-
funded primary data
collection effort. In this case,
a decision must be made as to
whether the Ministry’s data
would allow the Assistance
Objective team to have
confidence when assessing
program performance or
whether they are so flawed as
to be useless, or perhaps
misleading, in reporting and
managing for results. The
main point is that managers
should not let the ideal drive
out the good.
1. VALIDITY
Validity refers to the extent to
which a measure actually
represents what we intend to
measure.1
Though simple in principle,
validity can be difficult to
assess in practice, particularly
when measuring social
phenomena. For example,
how can we measure political
power or sustainability? Is the
poverty gap a good measure
of the extent of a country’s
poverty? However, even valid
indicators have little value, if
the data collected do not
correctly measure the variable
or characteristic encompassed
by the indicator. It is quite
possible, in other words, to
identify valid indicators but to
then collect inaccurate,
unrepresentative, or
incomplete data. In such
cases, the quality of the
indicator is moot. It would be
equally undesirable to collect
1 This criterion is closely related
to “directness” criteria for
indicators.

3
good data for an invalid
indicator.
There are a number of ways to
organize or present concepts
related to data validity. In the
USAID context, we focus on
three key dimensions of
validity that are most often
relevant to development
programming, including: face
validity, attribution, and
measurement error.
FACE VALIDITY
Face validity means that an
outsider or an expert in the
field would agree that the
data is a true measure of the
result. For data to have high
face validity, the data must be
true representations of the
indicator, and the indicator
must be a valid measure of
the result. For example:
Result: Increased
household income in a
target district
Indicator: Value of
median household income
in the target district
In this case, the indicator has a
high degree of face validity
when compared to the result.
That is, an external observer is
likely to agree that the data
measure the intended
objective. On the other hand,
consider the following
example:
Result: Increased
household income in a
target district
Indicator: Number of
houses in the target
community with tin roofs
This example does not appear
to have a high degree of face
validity as a measure of
increased income, because it
is not immediately clear how
tin roofs are related to
increased income. The
indicator above is a proxy
indicator for increased
income. Proxy indicators
measure results indirectly, and
their validity hinges on the
assumptions made to relate
the indicator to the result. If
we assume that 1) household
income data are too costly to
obtain and 2) research shows
that when the poor have
increased income, they are
likely to spend it on tin roofs,
then this indicator could be an
appropriate proxy for
increased income.
ATTRIBUTION
Attribution focuses on the
extent to which a change in
the data is related to USAID
interventions. The concept of
attribution is discussed in
detail as a criterion for
indicator selection, but
reemerges when assessing
validity. Attribution means
that changes in the data can
be plausibly associated with
USAID interventions. For
example, an indicator that
measures changes at the
national level is not usually
appropriate for a program
targeting a few areas or a
particular segment of the
population. Consider the
following:
Result: Increased
revenues in targeted
municipalities.
Indicator: Number of
municipalities where tax
revenues have increased
by 5%.
In this case, assume that
increased revenues are
measured among all
municipalities nationwide,
while the program only
focuses on a targeted group
of municipalities. This means
that the data would not be a
valid measure of performance
because the overall result is
not reasonably attributable to
program activities.
MEASUREMENT ERROR
Measurement error results
primarily from the poor
design or management of
data collection processes.
Examples include leading
questions, unrepresentative
sampling, or inadequate
training of data collectors.
Even if data have high face
validity, they still might be an
inaccurate measure of our
result due to bias or error in
the measurement process.
Judgments about acceptable
measurement error should
reflect technical assessments
about what level of reductions
in measurement error are
possible and practical. This
can be assessed on the basis
of cost as well as management
judgments about what level of
4
accuracy is needed for
decisions.
Some degree of measurement
error is inevitable, particularly
when dealing with social and
economic changes, but the
level of measurement error
associated with all
performance data collected or
used by operating units
should not be so large as to 1)
call into question either the
direction or degree of change
reflected by the data or 2)
overwhelm the amount of
anticipated change in an
indicator (making it
impossible for managers to
determine whether progress.
reflected in the data is a result
of actual change or of
measurement error). The two
main sources of measurement
error are sampling and non-
sampling error.
Sampling Error (or
representativeness)
Data are said to be
representative if they
accurately reflect the
population they are intended
to describe. The
representativeness of data is a
function of the process used
to select a sample of the
population from which data
will be collected.
It is often not possible, or
even desirable, to collect data
from every individual,
household, or community
involved in a program due to
resource or practical
constraints. In these cases,
data are collected from a
sample to infer the status of
the population as a whole. If
we are interested in describing
the characteristics of a
country’s primary schools, for
example, we would not need
to examine every school in the
country. Depending on our
focus, a sample of a hundred
schools might be enough.
However, when the sample
used to collect data are not
representative of the
population as a whole,
significant bias can be
introduced into the data. For
example, if we only use data
from 100 schools in the capital
area of the country, our data
will not likely be
representative of all primary
schools in the country.
Drawing a sample that will
allow managers to confidently
generalize data/findings to
the population requires that
two basic criteria are met: 1)
that all units of a population
(e.g., households, schools,
enterprises) have an equal
chance of being selected for
the sample and 2) that the
sample is of adequate size.
The sample size necessary to
ensure that resulting data are
representative to any specified
degree can vary substantially,
depending on the unit of
analysis, the size of the
population, the variance of the
characteristics being tracked,
and the number of
characteristics that we need to
analyze. Moreover, during
data collection it is rarely
possible to obtain data for
every member of an initially
chosen sample. Rather, there
are established techniques for
determining acceptable levels
of non-response or for
substituting new respondents.
If a sample is necessary, it is
important for managers to
consider the sample size and
method relative to the data
needs. While data validity
should always be a concern,
there may be situations where
accuracy is a particular
priority. In these cases, it may
be useful to consult a
sampling expert to ensure the
data are representative.
Non-Sampling Error
Non-sampling error includes
poor design of the data
collection instrument, poorly
trained or partisan
enumerators, or the use of
questions (often related to
sensitive subjects) that elicit
incomplete or untruthful
answers from respondents.
Consider the earlier example:
Result: Increased
household income in a
target district
Indicator: Value of
median household
income in the target
district
While these data appear to
have high face validity, there is
the potential for significant
measurement error through
reporting bias. If households
are asked about their income,
they might be tempted to
under-report income to
demonstrate the need for
5
additional assistance (or over-
report to demonstrate
success). A similar type of
reporting bias may occur
when data is collected in
groups or with observers, as
respondents may modify their
responses to match group or
observer norms. This can be a
particular source of bias when
collecting data on vulnerable
groups. Likewise, survey or
interview questions and
sequencing should be
developed in a way that
minimizes the potential for
the leading of respondents to
predetermined responses. In
order to minimize non-
sampling measurement error,
managers should carefully
plan and vet the data
collection process with a
careful eye towards potential
sources of bias.
Minimizing Measurement
Error
Keep in mind that USAID is
primarily concerned with
learning, with reasonable
confidence, that anticipated
improvements have occurred,
not with reducing error below
some arbitrary level. 2 Since it
is impossible to completely
eliminate measurement error,
and reducing error tends to
become increasingly
expensive or difficult, it is
important to consider what an
2 For additional information, refer
to Common Problems/Issues with
Using Secondary Data in the CDIE
Resource Book on Strategic
Planning and Performance
Monitoring, April 1997.
acceptable level of error
would be. Unfortunately,
there is no simple standard
that can be applied across all
of the data collected for
USAID’s varied programs and
results. As performance
management plans (PMPs) are
developed, teams should:
Identify the existing or
potential sources of error
for each indicator and
document this in the PMP.
Assess how this error
compares with the
magnitude of expected
change. If the anticipated
change is less than the
measurement error, then
the data are not valid.
Decide whether alternative
data sources (or indicators)
need to be explored as
better alternatives or to
complement the data to
improve data validity.
2. RELIABILITY
Data should reflect stable and
consistent data collection
processes and analysis
methods over time.
Reliability is important so that
changes in data can be
recognized as true changes
rather than reflections of poor
or changed data collection
methods. For example, if we
use a thermometer to
measure a child’s temperature
repeatedly and the results
vary from 95 to 105 degrees,
even though we know the
child’s temperature hasn’t
changed, the thermometer is
not a reliable instrument for
measuring fever. In other
words, if a data collection
process is unreliable due to
changes in the data collection
instrument, different
implementation across data
collectors, or poor question
choice, it will be difficult for
managers to determine if
changes in data over the life
of the project reflect true
changes or random error in
the data collection process.
Consider the following
examples:
Indicator: Percent
increase in income
among target
beneficiaries.
The first year, the project
reports increased total
income, including income as a
result of off-farm resources.
The second year a new
manager is responsible for
data collection, and only farm
based income is reported.
The third year, questions arise
as to how “farm based
income” is defined. In this
case, the reliability of the data
comes into question because
managers are not sure
whether changes in the data
are due to real change or
changes in definitions. The
following is another example:
Indicator: Increased
volume of agricultural
commodities sold by
farmers.
A scale is used to measure
volume of agricultural
commodities sold in the

6
What’s the Difference Between Validity and Reliability?
Validity refers to the extent to which a measure actually represents what we intend to measure. Reliability refers to the stability of the measurement process. That is, assuming there is no real change in the variable being measured, would the same measurement process provide the same result if the process were repeated over and over?
market. The scale is jostled
around in the back of the
truck. As a result, it is no
longer properly calibrated at
each stop. Because of this,
the scale yields unreliable
data, and it is difficult for
managers to determine
whether changes in the data
truly reflect changes in
volume sold.
3. PRECISION
Precise data have a sufficient
level of detail to present a fair
picture of performance and
enable management decision-
making.
The level of precision or detail
reflected in the data should be
smaller (or finer) than the
margin of error, or the tool of
measurement is considered
too imprecise. For some
indicators, for which the
magnitude of expected
change is large, even relatively
large measurement errors may
be perfectly tolerable; for
other indicators, small
amounts of change will be
important and even moderate
levels of measurement error
will be unacceptable.
Example: The number of
politically active non-
governmental organizations
(NGOs) is 900. Preliminary
data shows that after a few
years this had grown to
30,000 NGOs. In this case, a
10 percent measurement error
(+/- 3,000 NGOs) would be
essentially irrelevant.
Similarly, it is not important to
know precisely whether there
are 29,999 or 30,001 NGOs. A
less precise level of detail is
still sufficient to be confident
in the magnitude of change.
Consider an alternative
scenario. If the second data
point is 1,000, a 10 percent
measurement error (+/- 100)
would be completely
unacceptable because it
would represent all of the
apparent change in the data.
4. INTEGRITY
Integrity focuses on whether
there is improper manipulation
of data.
Data that are collected,
analyzed and reported should
have established mechanisms
in place to reduce
manipulation. There are
generally two types of issues
that affect data integrity. The
first is transcription error. The
second, and somewhat more
complex issue, is whether
there is any incentive on the
part of the data source to
manipulate the data for
political or personal reasons.
Transcription Error
Transcription error refers to
simple data entry errors made
when transcribing data from
one document (electronic or
paper) or database to another.
Transcription error is
avoidable, and Missions
should seek to eliminate any
such error when producing
internal or external reports
and other documents. When
the data presented in a
document produced by an
operating unit are different
from the data (for the same
indicator and time frame)
presented in the original
source simply because of data
entry or copying mistakes, a
transcription error has
occurred. Such differences
(unless due to rounding) can
be easily avoided by careful
cross-checking of data against
the original source. Rounding
may result in a slight
difference from the source
data but may be readily
justified when the underlying
data do not support such
specificity, or when the use of
the data does not benefit
materially from the originally
reported level of detail. (For
example, when making cost or
budget projections, we
typically round numbers.
When we make payments to
vendors, we do not round the
amount paid in the
accounting ledger. Different
purposes can accept different
levels of specificity.)

7
Technology can help to
reduce transcription error.
Systems can be designed so
that the data source can enter
data directly into a database—
reducing the need to send in a
paper report that is then
entered into the system.
However, this requires access
to computers and reliable
internet services. Additionally,
databases can be developed
with internal consistency or
range checks to minimize
transcription errors.
The use of preliminary or
partial data should not be
confused with transcription
error. There are times, where
it makes sense to use partial
data (clearly identified as
preliminary or partial) to
inform management decisions
or to report on performance
because these are the best
data currently available. When
preliminary or partial data are
updated by the original
source, USAID should quickly
follow suit, and note that it
has done so. Any discrepancy
between preliminary data
included in a dated USAID
document and data that were
subsequently updated in an
original source does not
constitute transcription error.
Manipulation
A somewhat more complex
issue is whether data is
manipulated. Manipulation
should be considered 1) if
there may be incentive on the
part of those that report data
to skew the data to benefit
the project or program and
managers suspect that this
may be a problem, 2) if
managers believe that
numbers appear to be
unusually favorable, or 3) if
the data are of high value and
managers want to ensure the
integrity of the data.
There are a number of ways in
which managers can address
manipulation. First, simply
understand the data collection
process. A well organized and
structured process is less likely
to be subject to manipulation
because each step in the
process is clearly documented
and handled in a standard
way. Second, be aware of
potential issues. If managers
have reason to believe that
data are manipulated, then
they should further explore
the issues. Managers can do
this by periodically spot
checking or verifying the data.
This establishes a principle
that the quality of the data is
important and helps to
determine whether
manipulation is indeed a
problem. If there is
substantial concern about this
issue, managers might
conduct a Data Quality
Assessment (DQA) for the AO,
IR, or specific data in question.
Example: A project assists
the Ministry of Water to
reduce water loss for
agricultural use. The Ministry
reports key statistics on water
loss to the project. These
statistics are critical for the
Ministry, the project and
USAID to understand program
performance. Because of the
importance of the data, a
study is commissioned to
examine data quality and
more specifically whether
there is any tendency for the
data to be inflated. The study
finds that there is a very slight
tendency to inflate the data,
but it is within an acceptable
range.
5. TIMELINESS
Data should be available and
up to date enough to meet
management needs.
There are two key aspects of
timeliness. First, data must be
available frequently enough
to influence management
decision making. For
performance indicators for
which annual data collection is
not practical, operating units
will collect data regularly, but
at longer time intervals.
Second, data should be
current or, in other words,
sufficiently up to date to be
useful in decision-making. As
a general guideline, data
should lag no more than three
years. Certainly, decision-
making should be informed
by the most current data that
are practically available.
Frequently, though, data
obtained from a secondary
source, and at times even
USAID-funded primary data
collection, will reflect
substantial time lags between
initial data collection and final
analysis and publication. Many
of these time lags are
unavoidable, even if
considerable additional

8
resources were to be
expended. Sometimes
preliminary estimates may be
obtainable, but they should be
clearly flagged as such and
replaced as soon as possible
as the final data become
available from the source.
The following example
demonstrates issues related to
timeliness:
Result: Primary school
attrition in a targeted
region reduced.
Indicator: Rate of
student attrition at
targeted schools.
In August 2009, the Ministry
of Education published full
enrollment analysis for the
2007 school year.
In this case, currency is a
problem because there is a 2
year time lag for these data.
While it is optimal to collect
and report data based on the
U.S. Government fiscal year,
there are often a number of
practical challenges in doing
so. We recognize that data
may come from preceding
calendar or fiscal years.
Moreover, data often measure
results for the specific point in
time that the data were
collected, not from September
to September, or December to
December.
Often the realities of the
recipient country context will
dictate the appropriate timing
of the data collection effort,
rather than the U.S. fiscal year.
For example, if agricultural
yields are at their peak in July,
then data collection efforts to
measure yields should be
conducted in July of each
year. Moreover, to the extent
that USAID relies on
secondary data sources and
partners for data collection,
we may not be able to dictate
exact timing
ASSESSING DATA
QUALITY
Approaches and steps for how
to assess data quality are
discussed in more detail in
TIPS 18: Conducting Data
Quality Assessments. USAID
policy requires managers to
understand the strengths and
weaknesses of the data they
use on an on-going basis. In
addition, a Data Quality
Assessment (DQA) must be
conducted at least once every
3 years for those data
reported to Washington (ADS
203.3.5.2).
For more information:
TIPS publications are available online at [insert website]
Acknowledgements:
Our thanks to those whose experience and insights helped shape this publication including Gerry Britan
and Subhi Mehdi of USAID’s Office of Management Policy, Budget and Performance (MPBP). This
publication was updated by Michelle Adams-Matson of Management Systems International (MSI).
Comments regarding this publication can be directed to:
Gerald Britan, Ph.D.
Tel: (202) 712-1158
Contracted under RAN-M-00-04-00049-A-FY0S-84
Integrated Managing for Results II

1
PERFORMANCE MONITORING & EVALUATION
TIPS BUILDING A RESULTS FRAMEWORK
ABOUT TIPS These TIPS provide practical advice and suggestions to USAID managers on issues related to
performance monitoring and evaluation. This publication is a supplemental reference to the
Automated Directive System (ADS) Chapter 203.
WHAT IS A RESULTS
FRAMEWORK?
The Results Framework (RF) is a
graphic representation of a
strategy to achieve a specific
objective that is grounded in
cause-and-effect logic. The RF
includes the Assistance Objective
(AO) and Intermediate Results
(IRs), whether funded by USAID
or partners, necessary to achieve
the objective (see Figure 1 for an
example). The RF also includes
the critical assumptions that must
hold true for the strategy to
remain valid.
The Results Framework
represents
a development hypothesis or a
theory about how intended
change will occur. The RF shows
how the achievement of lower
level objectives (IRs) leads to the
achievement of the next higher
order of objectives, ultimately
resulting in the AO.
In short, a person looking at a
Results Framework should be
able to understand the basic
theory for how key program
objectives will be achieved. The
Results Framework is an
important tool because it helps
managers identify and focus on
key objectives within a complex
development environment.
WHY IS THE RESULTS
FRAMEWORK
IMPORTANT?
The development of a Results
Framework represents an
important first step in forming
the actual strategy. It facilitates
analytic thinking and helps
A RESULTS FRAMEWORK
INCLUDES:
An Assistance Objective (AO)
Intermediate Results (IR)
Hypothesized cause and
effect linkages
Critical Assumptions
NUMBER 13
2ND EDITION, 2010 DRAFT
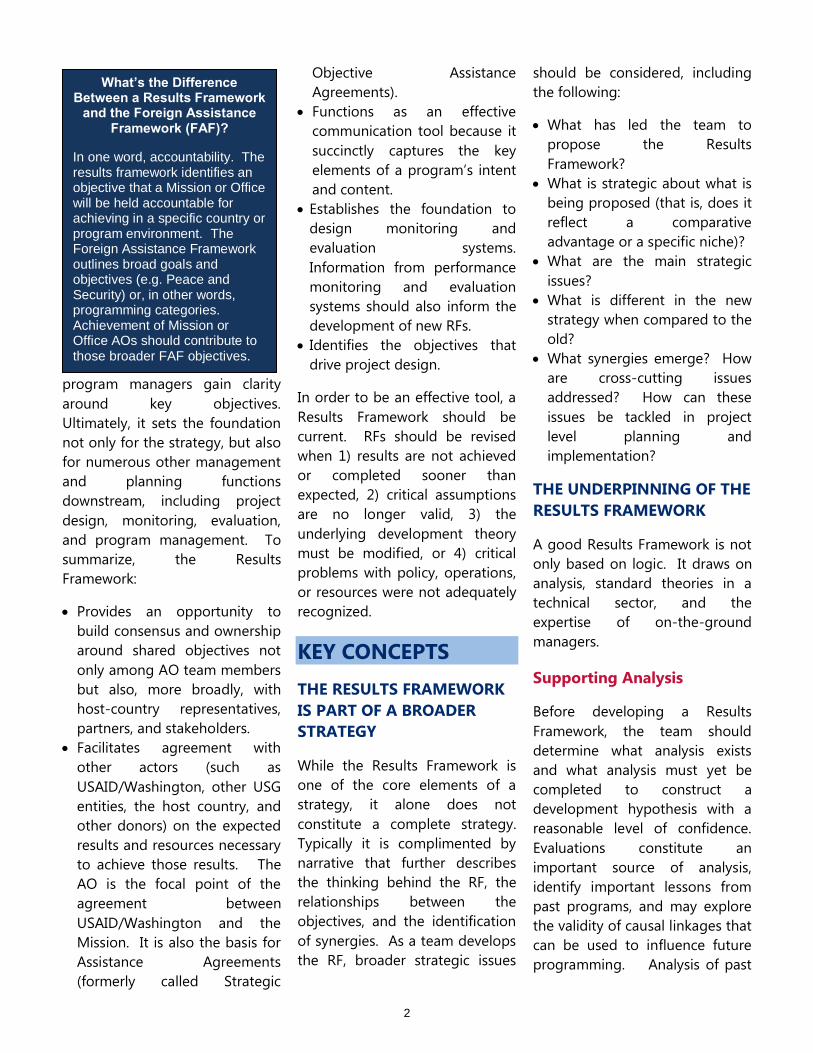
2
What’s the Difference Between a Results Framework
and the Foreign Assistance Framework (FAF)?
In one word, accountability. The results framework identifies an objective that a Mission or Office will be held accountable for achieving in a specific country or program environment. The Foreign Assistance Framework outlines broad goals and objectives (e.g. Peace and Security) or, in other words, programming categories. Achievement of Mission or Office AOs should contribute to those broader FAF objectives.
program managers gain clarity
around key objectives.
Ultimately, it sets the foundation
not only for the strategy, but also
for numerous other management
and planning functions
downstream, including project
design, monitoring, evaluation,
and program management. To
summarize, the Results
Framework:
Provides an opportunity to
build consensus and ownership
around shared objectives not
only among AO team members
but also, more broadly, with
host-country representatives,
partners, and stakeholders.
Facilitates agreement with
other actors (such as
USAID/Washington, other USG
entities, the host country, and
other donors) on the expected
results and resources necessary
to achieve those results. The
AO is the focal point of the
agreement between
USAID/Washington and the
Mission. It is also the basis for
Assistance Agreements
(formerly called Strategic
Objective Assistance
Agreements).
Functions as an effective
communication tool because it
succinctly captures the key
elements of a program’s intent
and content.
Establishes the foundation to
design monitoring and
evaluation systems.
Information from performance
monitoring and evaluation
systems should also inform the
development of new RFs.
Identifies the objectives that
drive project design.
In order to be an effective tool, a
Results Framework should be
current. RFs should be revised
when 1) results are not achieved
or completed sooner than
expected, 2) critical assumptions
are no longer valid, 3) the
underlying development theory
must be modified, or 4) critical
problems with policy, operations,
or resources were not adequately
recognized.
KEY CONCEPTS
THE RESULTS FRAMEWORK
IS PART OF A BROADER
STRATEGY
While the Results Framework is
one of the core elements of a
strategy, it alone does not
constitute a complete strategy.
Typically it is complimented by
narrative that further describes
the thinking behind the RF, the
relationships between the
objectives, and the identification
of synergies. As a team develops
the RF, broader strategic issues
should be considered, including
the following:
What has led the team to
propose the Results
Framework?
What is strategic about what is
being proposed (that is, does it
reflect a comparative
advantage or a specific niche)?
What are the main strategic
issues?
What is different in the new
strategy when compared to the
old?
What synergies emerge? How
are cross-cutting issues
addressed? How can these
issues be tackled in project
level planning and
implementation?
THE UNDERPINNING OF THE
RESULTS FRAMEWORK
A good Results Framework is not
only based on logic. It draws on
analysis, standard theories in a
technical sector, and the
expertise of on-the-ground
managers.
Supporting Analysis
Before developing a Results
Framework, the team should
determine what analysis exists
and what analysis must yet be
completed to construct a
development hypothesis with a
reasonable level of confidence.
Evaluations constitute an
important source of analysis,
identify important lessons from
past programs, and may explore
the validity of causal linkages that
can be used to influence future
programming. Analysis of past

3
External Forces
(Host Country
Strategy)
USAID Mission/
Vision
The
―Fit‖
Internal
Capacity
FIGURE 2. SETTING THE CONTEXT
FOR PARTICIPATION
performance monitoring data is
also an important source of
information.
Standard Sector Theories
Sectors, particularly those that
USAID has worked in for some
time, often identify a set of
common elements that constitute
theories for how to accomplish
certain objectives. These
common elements form a basic
―template‖ of sorts to consider in
developing an RF. For example,
democracy and governance
experts often refer to addressing
supply and demand. Supply
represents the ability of
government to play its role
effectively or provide effective
services. Demand represents the
ability of civil society to demand
or advocate for change.
Education generally requires
improved quality in teaching and
curriculum, community
engagement, and adequate
facilities. Health often requires
improved quality of services, as
well as access to -- and greater
awareness of – those services.
An understanding of these
common strategic elements is
useful because they lay out a
standard set of components that
a team must consider in
developing a good RF. Although,
not all of these elements will
apply to all countries in the same
way, they form a starting point to
inform the team’s thinking. As
the team makes decisions about
what (or what not) to address,
this becomes a part of the logic
that is presented in the narrative.
Technical experts can assist teams
in understanding standard sector
theories. In addition, a number
of USAID publications outline
broader sector strategies or
provide guidance on how to
develop strategies in particular
technical areas1.
On-the-Ground Knowledge
and Experience
Program managers are an
important source of knowledge
on the unique program or in-
country factors that should be
considered in the development of
the Results Framework. They are
best able to examine different
types of information, including
1 Examples include: Hansen,
Gary. 1996. Constituencies for
Reform: Strategic Approaches for
Donor-Supported Civic Advocacy
Groups or USAID. 2008. Securing
the Future: A Strategy for
Economic Growth.
analyses and standard sector
theories, and tailor a strategy for
a specific country or program
environment.
PARTICIPATION AND
OWNERSHIP
Development of a Results
Framework presents an important
opportunity for USAID to engage
its own teams, the host country,
civil society, other donors, and
other partners in defining
program objectives. Experience
has shown that a Results
Framework built out of a
participatory process results in a
more effective strategy.
Recent donor commitments to
the Paris Declaration and the
Accra Agenda for Action reinforce
these points. USAID has agreed
to increase ownership, align
systems with country-led
strategies, use partner systems,
harmonize aid efforts, manage for
development results, and
establish mutual accountability.

4
Common questions include,
―how do we manage
participation?‖ or ―how do we
avoid raising expectations that
we cannot meet?‖ One
approach for setting the context
for effective participation is to
simply set expectations with
participants before engaging in
strategic discussions. In essence,
USAID is looking for the
―strategic fit‖ (see Figure 2). That
is, USAID seeks the intersection
between what the host country
wants, what USAID is capable of
delivering, and the vision for the
program.
WHOLE-OF- GOVERNMENT
APPROACHES
Efforts are underway to institute
planning processes that take into
account the U.S. Government’s
overall approach in a particular
country. A whole-of-
government approach may
identify larger goals or objectives
to which many USG entities
contribute. Essentially, those
objectives would be at a higher
level or above the level of
accountability of any one USG
agency alone. USAID Assistance
Objectives should clearly
contribute to those larger goals,
but also reflect what the USAID
Mission can be held accountable
for within a specified timeframe
and within budget parameters.
The whole-of-government
approach may be reflected at a
lower level in the Results
Framework as well. The RF
provides flexibility to include the
objectives of other
actors (whether other USG
entities, donors, the host country,
or other partners) where the
achievement of those objectives
are essential for USAID to achieve
its AO. For example, if a
program achieves a specific
objective that contributes to
USAID’s AO, it should be
reflected as an IR. This can
facilitate greater coordination of
efforts.
THE LINKAGE TO PROJECTS
The RF should form the
foundation for project planning.
Project teams may continue to
flesh out the Results Framework
in further detail or may use the
Logical Framework2. Either way,
all projects and activities should
be designed to accomplish the
AO and some combination of one
or more IRs.
2 The Logical Framework (or
logframe for short) is a project
design tool that complements the
Results Framework. It is also
based on cause-and-effect
linkages. For further information
reference ADS 201.3.11.8.
GUIDELINES FOR CONSTRUCTING AOs AND IRs
AOs and IRs should be:
Results Statements. AOs and IRs should express an outcome. In other words,
the results of actions, not the actions or processes themselves. For example,
the statement ―increased economic growth in targets sectors‖ is a result, while
the statement ―increased promotion of market-oriented policies‖ is more
process oriented.
Clear and Measurable. AOs and IRs should be stated clearly and precisely, and
in a way that can be objectively measured. For example, the statement
―increased ability of entrepreneurs to respond to an improved policy, legal,
and regulatory environment‖ is both ambiguous and subjective. How one
defines or measures ―ability to respond‖ to a changing policy environment is
unclear and open to different interpretations. A more precise and measurable
results statement in this case is ―increased level of investment.‖ It is true that
USAID often seeks results that are not easily quantified. In these cases, it is
critical to define what exactly is meant by key terms. For example, what is
meant by ―improved business environment‖? As this is discussed, appropriate
measures begin to emerge.
Unidimensional. AOs or IRs ideally consist of one clear overarching objective.
The Results Framework is intended to represent a discrete hypothesis with
cause-and-effect linkages. When too many dimensions are included, that
function is lost because lower level results do not really ―add up‖ to higher
level results. Unidimensional objectives permit a more straightforward
assessment of performance. For example, the statement ―healthier, better
educated, higher-income families‖ is an unacceptable multidimensional result
because it includes diverse components that may not be well-defined and
may be difficult to manage and measure. There are limited exceptions. It may
be appropriate for a result to contain more than one dimension when the
result is 1) achievable by a common set of mutually-reinforcing Intermediate
Results or 2) implemented in an integrated manner (ADS 201.3.8).

5
―It is critical to stress the importance
of not rushing to finalize a results
framework. It is necessary to take
time for the process to mature and to
be truly participative.‖
—USAID staff member in Africa
THE PROCESS FOR
DEVELOPING A
RESULTS
FRAMEWORK
SETTING UP THE PROCESS
Missions may use a variety of
approaches to develop their
respective results frameworks. In
setting up the process, consider
the following three questions.
When should the results
frameworks be developed? It is
often helpful to think about a
point in time at which the team
will have enough analysis and
information to confidently
construct a results framework.
Who is going to participate
(and at what points in the
process)? It is important to
develop a schedule and plan out
the process for engaging partners
and stakeholders. There are a
number of options (or a
combination) that might be
considered:
Invite key partners or
stakeholders to results
framework development
sessions. If this is done, it may
be useful to incorporate some
training on the results
framework methodology in
advance. Figure 3 outlines the
basic building blocks and
defines terms used in strategic
planning across different
organizations.
The AO team may develop a
preliminary results framework
and hold sessions with key
counterparts to present the
draft strategy and obtain
feedback.
Conduct a strategy workshop
for AO teams to present out
RFs and discuss strategic issues.
Although these options require
some time and effort, the results
framework will be more complete
and representative.
What process and approach
will be used to develop the
results frameworks? We
strongly recommend that the AO
team hold group sessions to
construct the results framework.
It is often helpful to have one
person (preferably with
experience in strategic planning
and facilitation) to lead these
sessions. This person should
focus on drawing out the ideas of
the group and translating them
into the results framework.
STEP 1. IDENTIFY THE
ASSISTANCE OBJECTIVE
The Assistance Objective (AO) is
the center point for any results
framework and is defined as:
The most ambitious result
(intended measurable change)
that a USAID Mission/Office,
along with its partners, can
materially affect, and for which
it is willing to be held
accountable (ADS 201.3.8).
Defining an AO at an appropriate
level of impact is one of the most
critical and difficult tasks a team
faces. The AO forms the
standard by which the Mission or
Office is willing to be judged in
terms of its performance. The
concept of ―managing for results‖
(a USAID value also reflected in
the Paris Declaration) is premised
on this idea.
The task can be challenging,
because an AO should reflect a
balance of two conflicting
considerations—ambition and
accountability. On the one hand,
every team wants to deliver
significant impact for a given
investment. On the other hand,
there are a number of factors
outside the control of the team.
In fact, as one moves up the
Results Framework toward the
AO, USAID is more dependent on
other development partners to
achieve the result.
Identifying an appropriate level
of ambition for an AO depends
on a number of factors and will
be different for each country
context. For example, in one
country it may be appropriate for
the AO to be ―increased use of
family planning methods‖ while
in another, ―decreased total
fertility‖ (a higher level objective)
would be more suitable. Where
to set the objective is influenced
by the following factors:

6
Figure 3. Results Framework Logic
So What?
How?
Necessary
and
Sufficient
Programming history.
There are different
expectations for more
mature programs, where
higher level impacts and
greater sustainability are
expected.
The magnitude of the
development problem.
The timeframe for the
strategy.
The range of resources
available or expected.
The AO should represent the
team’s best assessment of what
can realistically be achieved. In
other words, the AO team should
be able to make a plausible case
that the appropriate analysis has
been done and the likelihood of
success is great enough to
warrant investing resources in the
AO.
STEP 2. IDENTIFY
INTERMEDIATE RESULTS
After agreeing on the AO, the
team must identify the set of
―lower level‖ Intermediate Results
necessary to achieve the AO. An
Intermediate Result is defined as:
An important result that is
seen as an essential step to
achieving a final result or
outcome. IRs are
measurable results that may
capture a number of
discrete and more specific
results (ADS 201.3.8.4).
As the team moves down from
the AO to IRs, it is useful to ask
―how‖ can the AO be achieved?
By answering this question, the
team begins to formulate the IRs
(see Figure 3). The team should
assess relevant country and
sector conditions and draw on
development experience in other
countries to better understand
the changes that must occur if
the AO is to be attained.
The Results Framework
methodology is sufficiently
flexible to allow the AO team to
include Intermediate Results that
are supported by other actors
when they are relevant and
critical to achieving the AO. For
example, if another donor is
building schools that are
essential for USAID to
accomplish an education AO
(e.g. increased primary
school completion), then
that should be reflected as
an IR because it is a
necessary ingredient for
success.
Initially, the AO team might
identify a large number of
possible results relevant to
the AO. However, it is
important to eventually settle on
the critical set of Intermediate
Results. There is no set number
for how many IRs (or levels of IRs)
are appropriate. The number of
Intermediate Results will vary
with the scope and complexity of
the AO. Eventually, the team
should arrive at a final set of IRs
that members believe are
reasonable. It is customary for
USAID Missions to submit a
Results Framework with one or
two levels of IRs to
USAID/Washington for review.
The key point is that there should
be enough information to
adequately convey the
development hypothesis.

7
So What is Causal Logic Anyway?
Causal logic is based on the concept of cause-and-effect. That is, the accomplishment of lower-level
objectives ―cause‖ the next higher-level objective (or the effect) to occur. In the following example, the
hypothesis is that if IR 1, 2, and 3 occur, it will lead to the AO.
AO: Increased
Completion of
Primary School
IR 1: Improved
Quality of
Teaching
IR 2: Improved
Curriculum
IR 3: Increased
Parental
Commitment to
Education
STEP 3. CLARIFY THE
RESULTS FRAMEWORK
LOGIC
Through the process of
identifying Intermediate Results,
the team begins to construct the
cause-and-effect logic that is
central to the Results Framework.
Once the team has identified the
Intermediate Results that support
an objective, it must review and
confirm this logic.
The accomplishment of lower
level results, taken as a group,
should result in the achievement
of the next higher objective. As
the team moves up the Results
Framework, they should ask, ―so
what?‖ If we accomplish these
lower level objectives, is
something of significance
achieved at the next higher level?
The higher-order result
establishes the ―lens‖ through
which lower-level results are
viewed. For example, if one IR is
―Increased Opportunities for Out-
of-School Youth to Acquire Life
Skills,‖ then, by definition, all
lower level IRs would focus on
the target population established
(out-of-school youth).
As the team looks across the
Results Framework, it should ask
whether the Intermediate Results
are necessary and sufficient to
achieve the AO.
Results Framework logic is not
always linear. There may be
relationships across results or
even with other AOs. This can
sometimes be demonstrated on
the graphic (e.g., through the use
of arrows or dotted boxes with
some explanation) or simply in
the narrative. In some cases,
teams find a number of causal
connections in an RF. However,
teams have to find a balance
between the two extremes- on
the one hand, where logic is too
simple and linear and, on the
other, a situation where all
objectives are related to all
others.
STEP 4. IDENTIFY CRITICAL
ASSUMPTIONS
The next step is to identify the set
of critical assumptions that are
relevant to the achievement of
the AO. A critical assumption is
defined as:
―….a general condition under
which the development
hypothesis will hold true.
Critical assumptions are
outside the control or
influence of USAID and its
partners (in other words, they
are not results), but they
reflect conditions that are
likely to affect the achievement
of results in the Results
Framework. Critical
assumptions may also be
expressed as risks or
vulnerabilities…‖ (ADS
201.3.8.3)
Identifying critical assumptions,
assessing associated risks, and
determining how they should be
addressed is a part of the
strategic planning process.
Assessing risk is a matter of
balancing the likelihood that the
critical assumption will hold true
with the ability of the team to
address the issue. For example,
consider the critical assumption
―adequate rainfall.‖ If this
assumption has held true for the

8
What is NOT Causal Logic?
Categorical Logic. Lower level results are simply sub-categories rather than cause and effect, as
demonstrated in the example below.
Definitional Logic. Lower-level results are a restatement (or further definition) of a higher-level objective.
The use of definitional logic results in a problem later when identifying performance indicators because it is
difficult to differentiate indicators at each level.
AO: Increased
Completion of
Primary School
IR 1: Improved
Pre-Primary
School
IR 2: Improved
Primary
Education
IR 3: Improved
Secondary
Education
IR: Strengthened
Institution
IR: Institutional
Capacity to Deliver
Goods & Services
target region only two of the past
six years, the risk associated with
this assumption is so great that it
poses a risk to the strategy.
In cases like this, the AO team
should attempt to identify ways
to actively address the problem.
For example, the team might
include efforts to improve water
storage or irrigation methods, or
increase use of drought-resistant
seeds or farming techniques.
This would then become an IR (a
specific objective to be
accomplished by the program)
rather than a critical assumption.
Another option for the team is to
develop contingency plans for
the years when a drought may
occur.
STEP 5. COMPLETE THE
RESULTS FRAMEWORK
As a final step, the AO team
should step back from the Results
Framework and review it as a
whole. The RF should be
straightforward and
understandable. Check that the
results contained in the RF are
measurable and feasible with
anticipated USAID and partner
resource levels. This is also a
good point at which to identify
synergies between objectives and
across AOs.
STEP 6. IDENTIFY
PRELIMINARY
PERFORMANCE MEASURES
Agency policies (ADS 201.3.8.6)
require that the AO team present
proposed indicators for the AO
with baseline data and targets.
The AO, along with indicators and
targets, represents the specific
results that will be achieved vis-a-
vis the investment. To the extent
possible, indicators for IRs with
baseline and targets should be
included as well.

9
Figure 1. Illustrative Results Framework
AO:
Increased
Production by
Farmers in the
Upper River Zone
IR:
Farmers’ Access to
Commercial
Capital Increased
IR:
Farmers’ Transport
Costs Decreased
IR:
Farmers’
Knowledge About
Effective
Production
Methods
Increased
IR: Farmers’
Capacity to
Develop Bank
Loan Applications
Increased
(4 years)
IR: Banks’ Loan
Policies Become
More Favorable
for the Rural
Sector
(3 years)
IR: Additional
Local Wholesale
Market Facilities
Constructed (with
the World Bank)
IR: Village
Associations
Capacity to
Negotiate
Contracts
Increased (4 years)
(
(4
IR: New
Technologies
Available
(World Bank)
IR: Farmers’
Exposure to On-
Farm Experiences
of Peers Increased
Key USAID
Responsible
Partner(s)
Responsible
USAID +
Partner(s)
Responsible
Critical Assumptions
1. Market prices for farmers’ products remain stable
or increase.
2. Prices of agricultural inputs remain stable or
decrease.
3. Roads needed to get produce to market are
maintained.
4. Rainfall and other critical weather conditions
remain stable.
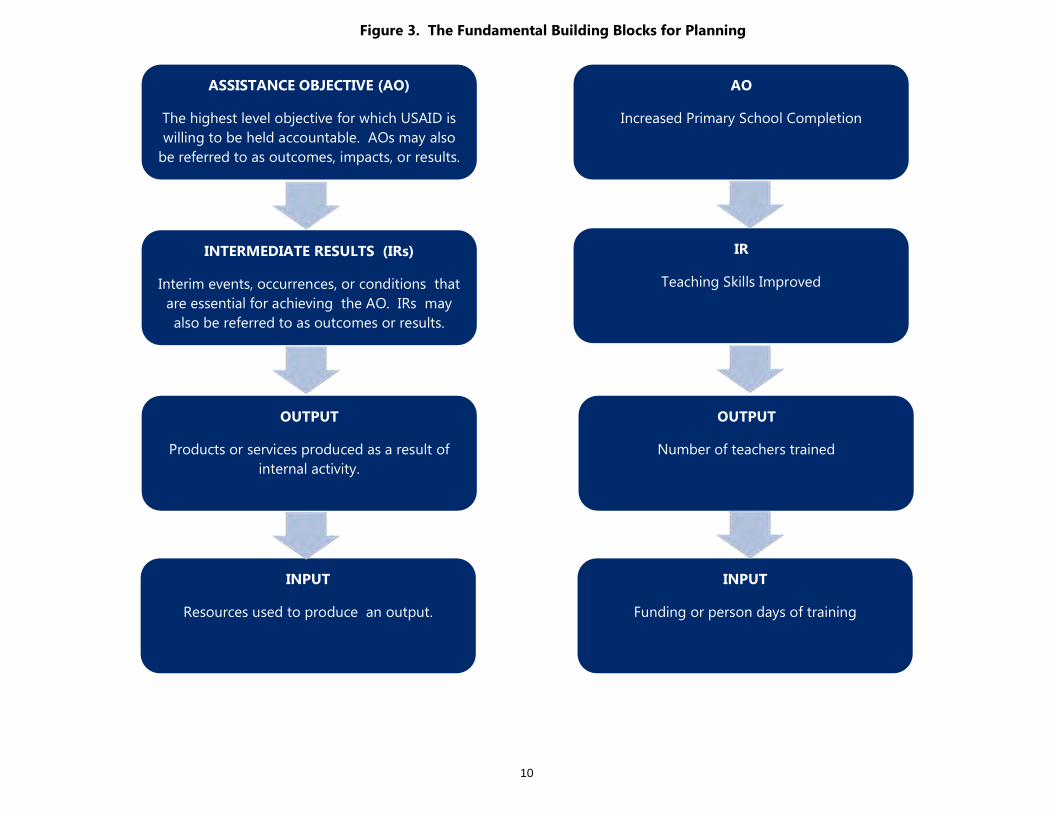
10
ASSISTANCE OBJECTIVE (AO)
The highest level objective for which USAID is
willing to be held accountable. AOs may also
be referred to as outcomes, impacts, or results.
INTERMEDIATE RESULTS (IRs)
Interim events, occurrences, or conditions that
are essential for achieving the AO. IRs may
also be referred to as outcomes or results.
OUTPUT
Products or services produced as a result of
internal activity.
INPUT
Resources used to produce an output.
AO
Increased Primary School Completion
IR
Teaching Skills Improved
OUTPUT
Number of teachers trained
INPUT
Funding or person days of training
Figure 3. The Fundamental Building Blocks for Planning
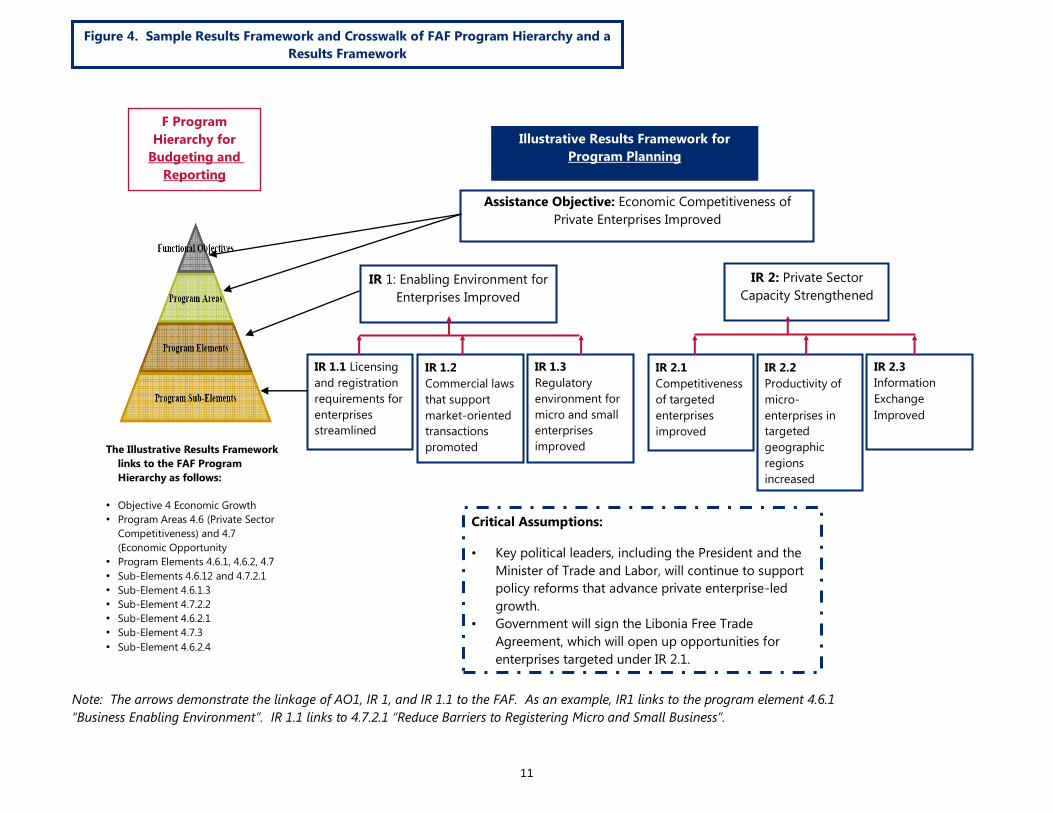
11
IR 1: Enabling Environment for
Enterprises Improved
Figure 4. Sample Results Framework and Crosswalk of FAF Program Hierarchy and a
Results Framework
F Program
Hierarchy for
Budgeting and
Reporting
Assistance Objective: Economic Competitiveness of
Private Enterprises Improved
IR 2: Private Sector
Capacity Strengthened
IR 1.1 Licensing
and registration
requirements for
enterprises
streamlined
IR 1.2
Commercial laws
that support
market-oriented
transactions
promoted
IR 1.3
Regulatory
environment for
micro and small
enterprises
improved
Illustrative Results Framework for
Program Planning
Critical Assumptions:
• Key political leaders, including the President and the
Minister of Trade and Labor, will continue to support
policy reforms that advance private enterprise-led
growth.
• Government will sign the Libonia Free Trade
Agreement, which will open up opportunities for
enterprises targeted under IR 2.1.
IR 2.1
Competitiveness
of targeted
enterprises
improved
IR 2.2
Productivity of
micro-
enterprises in
targeted
geographic
regions
increased
IR 2.3
Information
Exchange
Improved
The Illustrative Results Framework
links to the FAF Program
Hierarchy as follows:
• Objective 4 Economic Growth
• Program Areas 4.6 (Private Sector
Competitiveness) and 4.7
(Economic Opportunity
• Program Elements 4.6.1, 4.6.2, 4.7
• Sub-Elements 4.6.12 and 4.7.2.1
• Sub-Element 4.6.1.3
• Sub-Element 4.7.2.2
• Sub-Element 4.6.2.1
• Sub-Element 4.7.3
• Sub-Element 4.6.2.4
Note: The arrows demonstrate the linkage of AO1, IR 1, and IR 1.1 to the FAF. As an example, IR1 links to the program element 4.6.1
“Business Enabling Environment”. IR 1.1 links to 4.7.2.1 “Reduce Barriers to Registering Micro and Small Business”.

12
For more information:
TIPS publications are available online at [insert website].
Acknowledgements:
Our thanks to those whose experience and insights helped shape this publication including Gerry Britan
and Subhi Mehdi of USAID’s Office of Management Policy, Budget and Performance (MPBP). This
publication was updated by Michelle Adams-Matson, of Management Systems International.
Comments can be directed to:
Gerald Britan, Ph.D.
Tel: (202) 712-1158
Contracted under RAN-M-00-04-00049-A-FY0S-84
Integrated Managing for Results II

1
PERFORMANCE MONITORING & EVALUATION
TIPSMEASURING INSTITUTIONAL CAPACITY
ABOUT TIPSThese TIPS provide practical advice and suggestions to USAID managers on issues related to peroformance monitoring and evaluation. This publication is a supplemental reference to the Automated Directive Service (ADS) Chapter 203.
INTRODUCTION
This PME Tips gives USAID managers informa-tion on measuring institutional capacity,* includ-ing some tools that measure the capacity of an entire organization as well as others that look at individual components or functions of an or-ganization. The discussion concentrates on the internal capacities of individual organizations, rather than on the entire institutional context in which organizations function. This Tips is not about how to actually strengthen an institu-tion, nor is it about how to assess the eventual impact of an organization’s work. Rather, it is limited to a specific topic: how to measure an institution’s capacities.
It addresses the following questions:
Which measurement approaches are most useful for particular types of capacity building?
What are the strengths and limitations of each approach with regard to internal bias, quanti-fication, or comparability over time or across organizations?
How will the data be collected and how partici-patory can and should the measurement pro-cess be?
Measuring institutional capacity might be one important aspect of a broader program in in-stitutional strengthening; it may help managers make strategic, operational, or funding decisions; or it may help explain institutional strengthen-ing activities and related performance.
Whatever the reason for assessing institutional capacity, this Tips presents managers with sev-eral tools for identifying institutional strengths and weaknesses.
The paper will define and discuss capacity as-sessment in general and present several ap-
NUMBER 15 2011 Printing

2
proaches for measuring institutional capacity. We assess the measurement features of each approach to help USAID managers select the tool that best fits their diverse management and reporting needs. The paper is organized as follows:
1. Background: Institutional Capacity Building and USAID
2. How to Measure Institutional Capac-ity
3. Measurement Issues
4. Institutional Assessment Tools
5. Measuring Individual Organizational Components
6. Developing Indicators
7. Practical Tips for a Busy USAID Man-ager
BACKGROUND: INSTITUTIONAL CAPACITY
BUILDING AND USAID
USAID operating units must work closely with partner and customer organizations to meet program objectives across all Agency goal ar-eas, among them Peace and Security, Governing Justly and Democratically, Economic Growth, Investing in People, and Humanitarian Assis-tance. In the course of planning, implementing, and measuring their programs, USAID manag-ers often find that a partner or customer or-ganization’s lack of capacity stands in the way of achieving results. Increasing the capacity of partner and customer organizations helps them carry out their mandate effectively and function more efficiently. Strong organizations are more
able to accomplish their mission and provide for their own needs in the long run. USAID operating units build capacity with a broad spectrum of partner and customer organizations. These include but are not limited to:
• American private voluntary organizations (PVOs)
• Local and international nongovernmental organizations (NGOs) and other civil soci-ety organizations (CSOs)
• Community-based membership coopera-tives, such as a water users group
• Networks and associations of organiza-tions
• Political parties
• Government entities (ministries, depart-ments, agencies, subunits, policy analysis units, health clinics, schools)
• Private sector organizations (financial in-stitutions, companies, small businesses and other forprofit organizations)
• Regional institutions
The Agency uses a variety of techniques to build organizational capacity. The most com-mon involve providing technical assistance, ad-visory services, and long-term consultants to organizations, to help them build the skills and experience necessary to contribute success-fully to sustainable development. Other tech-niques include providing direct inputs, such as financial, human, and technological resources. Finally, USAID helps establish mentoring rela-tionships; provides opportunities for formal study in-country, in the United States or in third countries; and it sets up internships or

3
HOW TO MEASURE INSTITUTIONAL CAPACITY
An organization can be thought of as a system of related components that work together to achieve an agreed-upon mission. The follow-
apprenticeships with other organizations. The goal of strengthening an institution is usually to improve the organization’s overall performance and viability by improving administrative and management functions, increasing the effective-ness of service provision, enhancing the orga-nization’s structure and culture, and further-ing its sustainability. Institutional strengthening programs may address one or more of these components.
In most cases, USAID managers are concerned with institutional strengthening because they are interested in the eventual program-level re-sults (and the sustainability of these results) that these stronger organizations can help achieve. While recognizing the need to address even-tual results, this Tips looks primarily at ways to measure institutional capacity. Understanding and measuring institutional capacity are critical and often more complex than measuring the services and products an organization delivers.
Measuring organizational capacity is important because it both guides USAID interventions and allows managers to demonstrate and re-port on progress. The data that emerge from measuring institutional capacity are commonly used in a number of valuable ways. These data establish baselines and provide the basis for setting targets for improvements. They help ex-plain where or why something is going wrong; they identify changes to specific program in-terventions and activities that address areas of poor performance; they inform managers of the impact of an intervention or the effectiveness of an intervention strategy; and they identify lessons learned. They are also useful for report-ing to Washington and to partners.
It is important to note the difference between assessing capacity for contracting and grant-making decisions versus for a “capacity build-ing” relationship with partner/customer organi-zations. A USAID manager may want to assess
the capacity of an organization to help make decisions about awarding grants or holding grantees accountable for results. In this case, the assessment is more of an external over-sight/audit of an organization hired to carry out Agency programs. Or, the manager may have a programmatic commitment to strengthen the abilities of customer and partner organizations. Different tools and methods are available for both situations. This paper deals primarily with programs that fit the latter description.
Within USAID, the former Office of Private and Voluntary Cooperation (PVC) took the lead on building the capacity of nongovernmental orga-nization (NGO) and private voluntary organiza-tion (PVO) partners. PVC has defined develop-ment objectives and intermediate results aimed specifically at improving the internal capacity of U.S. PVOs. PVC has studied different ap-proaches to institutional capacity building and has begun to develop a comprehensive capac-ity assessment tool called discussion-oriented organizational self-assessment, described in ex-ample 1 in this paper. In addition to DOSA, PVC has developed several indicators for measuring institutional capacity development.
PVC specifically targets NGOs and PVOs and is particularly concerned with enhanc-ing partnerships. USAID missions, by contrast, work with a broader range of organizations on activities aimed at increasing institutional capacity. Such programs usually view insti-tutional capacity as a means to achieve high-er level program results, rather than as anend in itself.

4
ing list of organizational components is not all-inclusive, nor does it apply universally to all organizations. Rather, the components are representative of most organizations involved in development work and will vary according to the type of organization and the context in which it functions.
Administrative and Support Functions
• Administrative procedures and manage-ment systems
• Financial management (budgeting, account-ing, fundraising, sustainability)
• Human resource management (staff re-cruitment, placement, support)
• Management of other resources (informa-tion, equipment, infrastructure)
Technical/Program Functions
• Service delivery system
• Program planning
• Program monitoring and evaluation
• Use and management of technical knowl-edge and skills
Structure and Culture
• Organizational identity and culture
• Vision and purpose
• Leadership capacity and style
• Organizational values
• Governance approach
MANAGEMENT ISSUES
This TIPS presents capacity-assessment tools and other measurement approaches that, while similar in some ways, vary in both their empha-sis and their method for evaluating an organiza-tion’s capacity. Some use scoring systems and others don’t; some use questionnaires while others employ focus groups; some use exter-nal evaluators , and others use selfassessments; some emphasize problem solving, while oth-ers concentrate on appreciating organzational strengths. Some tools can be used to measure the same standard across many organizations, while others are organization specific. Many of the tools are designed so that the measurement process is just as important as, if not more im-portant than, the resulting information. They may involve group discussions, workshops, or exercises, and may explicitly attempt to be par-ticipatory. Such tools try to create a learning opportunity for the organization’s members, so that the assessment itself becomes an integral part of the capacity-building effort.
Because of each user’s different needs, it would be difficult to use this TIPS as a screen to prede-termine the best capacity-assessment tool for each situation. Rather, managers are encour-aged to adopt the approaches most appropriate to their program and to adapt the tools best suited for local needs. To assist managers in identifying the most useful tools and approach-
• External relations
Resources
• Human
• Financial
• Other
5
es, we consider the following issues for each of the tools presented:
• Type of organization measured. Many of the instruments developed to measure institutional capacity are designed specifi-cally for measuring NGOs and PVOs. Most of these can be adapted easily for use with other types of organizations, including gov-ernment entities.
• Comparability across organizations. To measure multiple organizations, to com-pare them with each other, or to aggregate the results of activities aimed at strength-ening more than one organization, the tool used should measure the same capacity areas for all the organizations and use the same scoring criteria and measurement processes. Note, however, that a standard tool, applied to diverse organizations, is less able to respond to specific organiza-tional or environmental circumstances. This is less of a problem if a group of organiza-tions, using the same standard tool, has designed its diagnostic instrument together (see the following discussion of PROSE).
• Comparability over time. In many cas-es, the value of measuring institutional ca-pacity lies in the ability to track changes in one organization over time. That requires consistency in method and approach. A measurement instrument, once selected and adapted to the needs of a particular organization, must be applied the same way each time it is used. Otherwise, any shifts that are noted may reflect a change in the measurement technique rather than an actual change in the organization.
• Data collection. Data can be collected in a variety of ways: questionnaires, focus groups, interviews, document searches, and observation, to name only some. Some
methods are hands-on and highly participa-tory, involving a wide range of customers, partners, and stakeholders, while others are more exclusive, relying on the opinion of one or two specialists. In most cases, it is best to use more than one data collec-tion method.
• Objectivity. By their nature, measures of institutional capacity are subjective. They rely heavily on individual perception, judg-ment, and interpretation. Some tools are better than others at limiting this subjec-tivity. For instance, they balance percep-tions with more empirical observations, or they clearly define the capacity area being measured and the criteria against which it is being judged. Nevertheless, users of these tools should be aware of the limita-tions to the findings.
• Quantification. Using numbers to rep-resent capacity can be helpful when they are recognized as relative and not absolute measures. Many tools for measuring in-stitutional capacity rely on ordinal scales. Ordinal scales are scales in which values can be ranked from high to low or more to less in relation to each other. They are useful in ordering by rank along a con-tinuum, but they can also be misleading. Despite the use of scoring criteria and guidelines, one person’s “3” may be some-one else’s “4.” In addition, ordinal scales do not indicate how far apart one score is from another. (For example, is the distance between “agree” and “strongly agree” the same as the distance between “disagree” and “strongly disagree”?) Qualitative descriptions of an organization’s capacity level are a good complement to ordinal scales.
• Internal versus external assessments. Some tools require the use of external

6
facilitators or assessors; others offer a process that the organization itself can follow. Both methods can produce useful data, and neither is automatically better than the other. Internal assessments can facilitate increased management use and better understanding of an assessment’s findings, since the members of the orga-nization themselves are carrying out the assessment. By contrast, the risk of bias and subjectivity is higher in internal assess-ments. External assessments may be more objective. They are less likely to introduce internal bias and can make use of external expertise. The downside is that external assessors may be less likely to u cover what is really going on inside an organiza-tion.
• Practicality. The best measurement systems are designed to be as simple as possible-- not too time consuming, not un-reasonably costly, yet able to provide man-agers with good information often enough to meet their management needs. Manag-ers should take practicality into account when selecting a measurement tool. They should consider the level of effort and resources required to develop the instru-ment and collect and analyze the data, and think about how often and at what point during the management cycle the data will be available to managers.
INSTITUTIONAL ASSESMENT TOOLS
This section describes capacity measurement tools that USAID and other development orga-nizations use. You can find complete references and Web sites in the resources section at the end of the paper. For each tool, we follow the
same format.
• Background of the methodology/tool
• Process (how the methodology/tool is used in the field)
• Product (the types of outputs expected)
• Assessment (a discussion of the uses and relative strengths of each methodology/tool)
• An example of what the methodology/tool looks like
PARTICIPATORY, RESULTS-ORIENTEDSELF-EVALUATION
Background
The participatory, results-oriented self-evalua-tion (PROSE) method was developed by Evan Bloom of Pact and Beryl Levinger of the Edu-cation Development Center. It has the dual purpose of both assessing and enhancing orga-nizational capacities. The PROSE method pro-duces an assessment tool customized to the organizations being measured. It is designed to compare capacities across a set of peer orga-nizations, called a cohort group, which allows for benchmarking and networking among the organizations. PROSE tools measure and profile organizational capacities and assess, over time, how strengthening activities affect organiza-tional capacity. In addition, through a facilitated workshop, PROSE tools are designed to allow organizations to build staff capacity; create con-sensus around future organizational capacity-building activities; and select, implement, and track organizational change and development strategies.
One example of an instrument developed using the PROSE method is the discussion-oriented

7
Participatory, Results-Oriented Self-Evaluation
Type of Organization MeasuredNGOs/PVOs; adaptable to other types of organiza-tions
Features• Cross-organizational comparisons can be
made
• Measures change in one organization or a cohort of organizations over time
• Measures well-defined capacity areas against well-defined criteria
• Assessment based primarily upon per-ceived capacities
• Produces numeric score on capacity areas
• Assessment should be done with the help of an outside facilitator or trained insider
• Data collected through group discussion and individual questionnaires given to a cross-section of the organization’s staff
organizational self-assessment. DOSA was de-veloped in 1997 for the Office of Private and Voluntary Cooperation and was designed spe-cifically for a cohort of USAID PVO grantees.
Process
Developers of the PROSE method recommend that organizations participate in DOSA or de-velop a customized DOSA-like tool to better fit their organization’s specific circumstances. The general PROSE process for developing such a tool is as follows: After a cohort group of orga-nizations is defined, the organizations meet in a workshop setting to design the assessment tool. With the help of a facilitator, they begin by pointing to the critical organizational capacities they want to measure and enhance. The cohort group then develops two sets of questions: dis-cussion questions and individual questionnaire items. The discussion questions are designed to get the group thinking about key issues. Further, these structured discussion questions minimize bias by pointing assessment team members to-ward a common set of events, policies, or con-ditions. The questionnaire items then capture group members’ assessments of those issues on an ordinal scale. During the workshop, both sets of questions are revised until the cohort group is satisfied. Near the end of the process, tools or standards from similar organizations can be introduced to check the cohort group’s work against an external example. If the tool is expected to compare several organizations within the same cohort group, the tool must be implemented by facilitators trained to admin-ister it effectively and consistently across the organizations.
Once the instrument is designed, it is applied to each of the organizations in the cohort. In the case of DOSA, the facilitator leads a team of the organization’s members through a series of group discussions interspersed with individ-ual responses to 100 questionnaire items. The
team meets for four to six hours and should represent a cross-functional, crosshierarchical sample from the organization. Participants re-spond anonymously to a questionnaire, select-ing the best response to statements about the organization’s practices (1=strongly disagree, 2=disagree, 3=neutral, 4=agree, 5=strongly agree) in six capacity areas:
• External Relations(constituency development, fund-raisingand communications)

8
Example 1. Excerpt From DOSA, a PROSE Tool
The DOSA questionnaire can be found in annex 1a
The following is a brief example drawn from the Human Resource Management section of the DOSA questionnaire:
Discussion Questionsa. When was our most recent staff training?b. How often over the last 12 months have we held staff training events?
Questionnaire items for individual responseStrongly Disagree
Disagress Neutral Agree Strongly Agree
1. We routinely offer staff training.
1 2 3 4 5
Discussion Questionsa. What are three primary, ongoing functions (e.g., monitoring and evaluation, proposal writ-ing, resource mobilization) that we carry out to achieve our mission?b. To what extent does staff, as a group, have the requisite skills to carry out these functions?c. To what extent is the number of employees carrying out these functions commensurate with work demands?
Questionnaire items for individual responseStrongly Disagree
Disagress Neutral Agree Strongly Agree
2. We have the ap-propriate staff skills to achieve our mis-sion
1 2 3 4 5
3. We have the ap-propriate staff num-bers to achieve our mission
1 2 3 4 5
*The annexes for this paper are available separately and can be obtained through the USAID Development Experience Clearinghouse at http://dec.usaid.gov/index.cfm
• Financial Resource Management(budgeting, forecasting, and cash management)
• Human Resource Management(staff training, supervision, and personnelpractices)

9
• Organizational Learning(teamwork and information sharing)
• Strategic Management(planning, governance, mission, and partnering)
• Service Delivery(field-based program practices and sustainabil-ity issues)
Although the analysis is statistically complex, questionnaires can be scored and graphics pro-duced using instructions provided on the DOSA Web site. In the case of DOSA, the DOSA team in Washington processes the results and posts them on the Internet. The assessment tool can be readministered annually to monitor organi-zational changes.
Product
PROSE instruments produce two types of scores and accompanying graphics. The first is a capacity score, which indicates how an organi-zation perceives its strengths and weaknesses in each of the capacity and subcapacity areas. The second is a consensus score, which shows the degree to which the assessment team members agree on their evaluation of the organization’s capacity.
Assessment
Unless the existing DOSA questions are used, developing a PROSE instrument from scratch can be time consuming and generally requires facilitators to guide the process of develop-ing and using the instrument. PROSE, like most other such instruments, is based on perceived capacities and does not currently include a method for measuring externally observable performance in various capacity areas (although this is under consideration). It is unique among the instruments in this paper in its use of a consensus score. The consensus score acts as a
check on the perceived capacities reported by individual organizational members. It also helps identify capacity areas that all members agree need immediate attention.Because the cohort organizations develop the specifics of the instrument together and share a common understanding and application of the approach, PROSE is relatively good at compar-ing organizations with each other or rolling up results to report on a group of organizations together. However, the discussions could influ-ence the scoring if facilitators are not consis-tent in their administration of the tool.
INSTITUTIONAL DEVELOPMENT FRAME-WORK
Background
The institutional development framework (IDF) is a tool kit developed by Mark Renzi of Man-agement Systems International. It has been used in USAID/Namibia’s Living in a Finite Environ-ment project as well as several other USAID programs. Designed specifically to help non-profit organizations improve efficiency and be-come more effective, the IDF is best suited for the assessment of a single organization, rather than a cohort group (as opposed to PROSE). The kit contains three tools (Institutional De-velopment Framework, Institutional Develop-ment Profile, and Institutional Development Calculation Sheet), which help an organization determine where it stands on a variety of or-ganizational components, identify priority areas of improvement, set targets, and measure prog-ress over time. While it can be adapted for any organization, the IDF was originally formulated for environmental NGOs.
Process
An organization can use the IDF tools either with or without the help of a facilitator. The IDF identifies five organizational capacity areas,

10
Institutional Development Framework
Type of Organization MeasuredNGOs/PVOs; adaptable to other types of organizations
Features• Can be used, with limitations, to compare across organizations
• Measures change in the same organization over time
• Measureswell-definedcapacityareasagainstwell-definedcriteria
• Assessment based primarily upon perceived capacities
• Produces numeric score on capacity areas
• Produces qualitative description of an organization’s capacity in terms of de-velopmental stages
• Assessment can be done internally or with help of an outside facilitator•• Data collected through group discussion with as many staff as feasible
called resource characteristics. Each capacity area is further broken down into key compo-nents, including:
• Oversight/Vision(board, mission, autonomy)
• Management Resources(leadership style, participatory managment, management systems, planning, community participation, monitoring, evaluation)
• Human Resources(staff skills, staff development, organizational diversity)
• Financial Resources(financial management, financial vulnerability, financial solvency)
• External Resources
(public relations, ability to work with localcommunities, ability to work with governmentbodies, ability to work with other NGOs)Each key component within a capacity area is rated at one of four stages along an organiza-tional development continuum (1= start up, 2= development, 3= expansion/consolidation, and 4= sustainability). IDF offers criteria describing each stage of development for each of the key components (see example 2 below).
Different processes can be used depending on the organization’s size and the desired out-come. Small organizations usually involve as many staff as possible; larger organizations may work in small groups or use a few key infor-mants. Members of the organization can modify the Institutional Development Framework to fit their organization. Nonapplicable areas can be ignored and new areas can be added, although the creator of the tool warns against complete-

11
ly rewriting the criteria. Through discussion, theparticipating members then use the criteria to determine where along the development con-tinuum their organization is situated for each component. The resulting graphic, the Institu-tional Development Profile (IDP), uses bars or “x”s to show where the organization ranks on each key component. Through a facilitated meet-ing or group discussion, organization members then determine which areas of organizational capacity are most important to the organization and which need priority attention for improve-ment. Using the IDP, they can visually mark their
targets for the future.
The IDF also provides numeric ratings. Each keycomponent can be rated on a scale of 1 to 4, and all components can be averaged together to provide a summary score for each capac-ity area. This allows numeric targets to be set and monitored. The Institutional Development Calculation Sheet is a simple table that permits the organization to track progress over time by recording the score of each component along the development continuum.
ResourceCharacteristic
KeyComponent
Criteria for Each Progressive Stage (the Development Continuum)
FinancialManagement
Start Up
1
Development
2
Expansion and Consolidation
3
Sustainability
4Budget asManagementTools
Budgets are not used asmanagementtools.
Budgets are developed forproject ac-tivities, but are often over- or underspent by more than 20%.
Total expendi-ture is usually within 20% of budget, but actual activity often diverge from budget predictions.
Budgets areintegral part of project manage-mentand are ad-justed as project implementation warrants.
CashControls
No clearprocedures ex-ist for handlingpayables andreceivables.
Financial controls exist but lack a sys-tematic office procedure.
Improvedfinancial controlsystems exist.
Excellent cashcontrols forpayables andreceivables andestablishedbudget proce-dures.
FinancialSecurity
Financingcomes from only one source.
Financingcomes frommultiple sources, but 90% or more from onesource.
No singlesource of fund-ing provides more than 60% of funding.
No single sourceprovides morethan 40% offunding.
Example 2. Excerpt From the IDF Tool
The following is an excerpt from the Financial Management section of the Institutional Devel-opment Framework. The entire framework appears in annex 2.

12
Product
The IDF produces a graphic that shows the component parts of an organization and the or-ganization’s ratings for each component at dif-ferent points in time. It also provides a numeric score/rating of capacity in each key component and capacity area.
Assessment
The IDF is an example of a tool that not only helps assess and measure an organization’s ca-pacity but also sets priorities for future change and improvements. Compared with some of the other tools, IDF is relatively good at tracking one organization’s change over time because of the consistent criteria used for each progres-sive stage of development. It is probably not as well suited for making cross-organizational comparisons, because it allows for adjustment to fit the needs of each individual organization.
ORGANIZATIONAL CAPACITY ASSESMENT TOOL
Background
Pact developed the organizational capacity as-sessment tool (OCAT) in response to a need to examine the impact of NGO capacity-build-ing activities. Like the Institutional Develop-ment Framework, OCAT is better suited for measuring one organization over time. The OCAT differs substantially from the IDF in its data collection technique. It is designed to identify an organization’s relative strengths and weaknesses and provides the baseline informa-tion needed to develop strengthening interven-tions. It can also be used to monitor progress. The OCAT is well known; other development organizations have widely adapted it. Designed to be modified for each measurement situation, the OCAT can also be standardized and usedacross organizations.
Process
The OCAT is intended to be a participatory self-assessment but may be modified to be an external evaluation. An assessment team, com-posed of organizational members (represent-ing different functions of the organization) plus some external helpers, modifies the OCAT as-sessment sheet to meet its needs (annex 3). Theassessment sheet consists of a series of state-ments under seven capacity areas (with sub-elements). The assessment team then identifies sources of information, assigns tasks, and uses a variety of techniques (individual interviews, fo-cus groups, among others) to collect the infor-mation they will later record on the assessmentsheet. The assessment team assigns a score to each capacity area statement (1=needs urgent attention and improvement; 2=needs attention; 3=needs improvement; 4=needs improvement in limited aspects; but not major or urgent; 5=room for some improvement; 6=no need forimmediate improvement). The assessment team would have to develop precise criteria for what rates as a “1” or a “2,” etc.
The capacity areas and sub-elements are:
• Governance(board, mission/goal, constituency, leadership,legal status)
• Management Practices(organizational structure, informationmanagement, administration procedures,personnel, planning, program development,program reporting)
• Human Resources(human resources development, staff roles,work organization, diversity issues, supervisorypractices, salary and benefits)
• Financial Resources(accounting, budgeting, financial/inventory

13
Example 3. Excerpt From an Adaptation of the OCAT
USAID/Madagascar developed a capacity assessment tool based on the OCAT, but tailored it to its own need to measure 21 partner institutions implementing reproductive health programs, including the Ministry of Health. The mission tried to measure different types of organizations and compare them by creating a standardized instrument to use with all the organizations.
Combining the OCAT results with additional information from facilitated discussions, the mis-sion was able to summarize how different types of organizations perceived different aspects of their capacity and recommend future strengthening programs.
Some of the difficulties that USAID/Madagascar encountered when using the tool included having to translate questions from French to Malagasy, possibly losing some of their meaning; finding that some respondents were unable to answer some questions because they had no experience with the part of the organization to which the questions referred; discovering that some respondents had difficulty separating the subject area of the questionnaire (family plan-ning) from their work in other health areas; and having difficulty scheduling meetings because of the organizations’ heavy workload. Moreover, the mission noted that the instrument is based on perceptions and is self-scored, with the resulting potential for bias.a
Below is an excerpt from the “communications/extension to customers” component of the OCAT used by USAID/Madagascar. The entire questionnaire is in annex 4.
ClassificationScale
0 Nonexistent or out of order1 Requires urgent attention and upgrading2 Requires overall attention and upgrading3 Requires upgrading in certain areas, but neither major nor urgent4 Operating, but could benefit from certain improvements5 Operating well in all regards
Communications/Extension to Customers
a. The institution has in each clinic a staff trained and competent in counseling all customers.
b. The institution is able to identify and develop key messages for exten-sion among potential customers, and it can produce or obtain materials for communicating such messages.
c. A well-organized community extension is practiced by the clinic’s staff or other workers affiliated with the institution, whether they are salaried or volunteers. A system exists for supervising extension work-ers and monitoring their effectiveness.
1 2 3 4 5
1 2 3 4 5
1 2 3 4 5
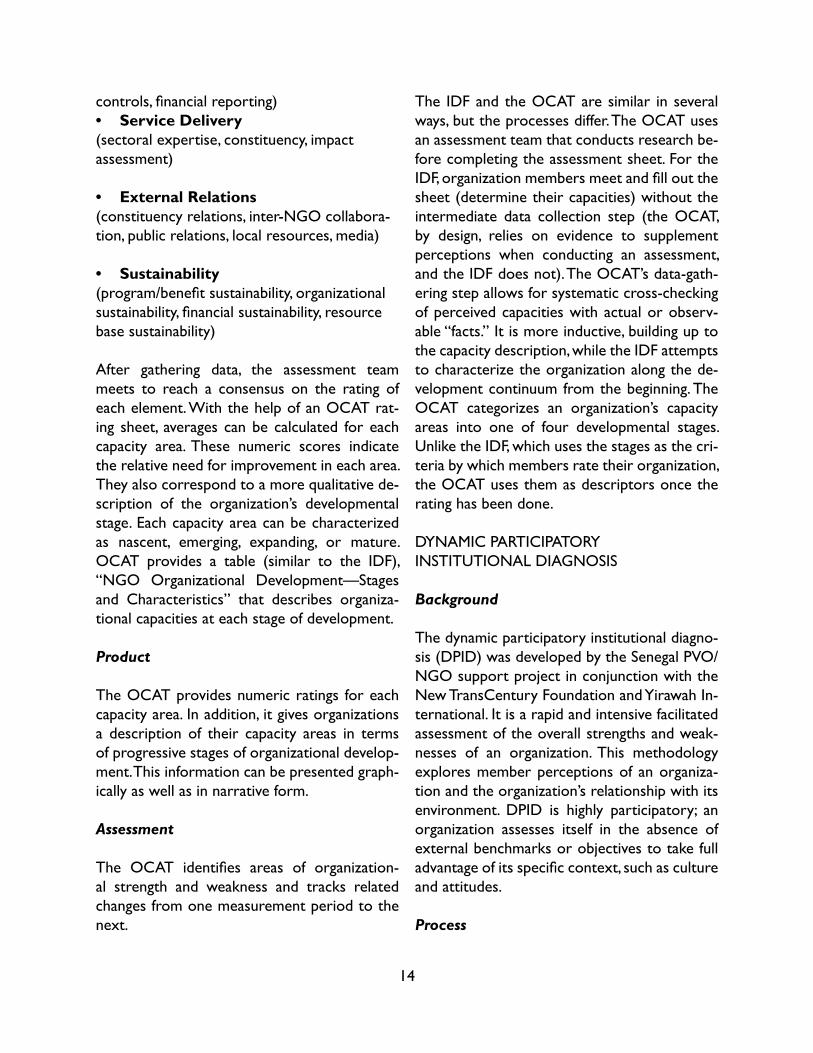
14
controls, financial reporting)• Service Delivery(sectoral expertise, constituency, impactassessment)
• External Relations(constituency relations, inter-NGO collabora-tion, public relations, local resources, media)
• Sustainability(program/benefit sustainability, organizationalsustainability, financial sustainability, resourcebase sustainability)
After gathering data, the assessment team meets to reach a consensus on the rating of each element. With the help of an OCAT rat-ing sheet, averages can be calculated for each capacity area. These numeric scores indicate the relative need for improvement in each area. They also correspond to a more qualitative de-scription of the organization’s developmental stage. Each capacity area can be characterized as nascent, emerging, expanding, or mature. OCAT provides a table (similar to the IDF), “NGO Organizational Development—Stages and Characteristics” that describes organiza-tional capacities at each stage of development.
Product
The OCAT provides numeric ratings for each capacity area. In addition, it gives organizations a description of their capacity areas in terms of progressive stages of organizational develop-ment. This information can be presented graph-ically as well as in narrative form.
Assessment
The OCAT identifies areas of organization-al strength and weakness and tracks related changes from one measurement period to the next.
The IDF and the OCAT are similar in several ways, but the processes differ. The OCAT uses an assessment team that conducts research be-fore completing the assessment sheet. For the IDF, organization members meet and fill out the sheet (determine their capacities) without the intermediate data collection step (the OCAT, by design, relies on evidence to supplement perceptions when conducting an assessment, and the IDF does not). The OCAT’s data-gath-ering step allows for systematic cross-checking of perceived capacities with actual or observ-able “facts.” It is more inductive, building up to the capacity description, while the IDF attempts to characterize the organization along the de-velopment continuum from the beginning. The OCAT categorizes an organization’s capacity areas into one of four developmental stages. Unlike the IDF, which uses the stages as the cri-teria by which members rate their organization, the OCAT uses them as descriptors once the rating has been done.
DYNAMIC PARTICIPATORYINSTITUTIONAL DIAGNOSIS
Background
The dynamic participatory institutional diagno-sis (DPID) was developed by the Senegal PVO/NGO support project in conjunction with the New TransCentury Foundation and Yirawah In-ternational. It is a rapid and intensive facilitated assessment of the overall strengths and weak-nesses of an organization. This methodology explores member perceptions of an organiza-tion and the organization’s relationship with its environment. DPID is highly participatory; an organization assesses itself in the absence of external benchmarks or objectives to take full advantage of its specific context, such as cultureand attitudes.
Process

15
Example 4. An Application of DPID
Since the DPID is such an individualized and flexible tool, every application will be different. The DPID does not lend itself easily to an example as do the other tools in this Tips. Below is an anecdote about one West African organization’s use of the DPID as reported by the Senegal DPIPVO/NGO support project.
A Federation of Farmers’ Cooperatives with about 15,000 members in the Sahel was look-ing for a unique and efficient approach to redress some of the organization’s problems. The federation suffered from internal strife and a tarnished reputation, impeding its ability to raise funds. Through DPID, the federation conducted a critical in-depth analysis of its operational and management systems, resulting in the adoption of “10 emergency measures” addressing leadership weaknesses, management systems, and operational procedures. Subsequently, the organization underwent internal restructuring, including an overhaul of financial and adminis-trative systems. One specific result of the DPID analysis was that federation members gained more influence over the operations of the federation.
An outside facilitator conducts the DPID over 5 to 10 days. It takes place during a series of working sessions in which the facilitator leads an organization’s members through several stages: discussion of the services; operations and results of the organization; exploration of the issues affecting the organization; and sum-marization of the “state of the organization.” During the discussions, members analyze the following features of the organization:
• Identity
• Mission
• Means and Resources
• Environment
• Management
• Internal Operations
• Service Provided and Results
They examine each element with reference to institutional behavior, human behavior, manage-ment, administration, know-how, philosophy and values, and sensitive points.
Product
A written description of the state of the organi-zation can result from the working sessions. The analysis is qualitative without numeric scoring.
Assessment
Unlike the previously described tools, the DPID does not use ranking, scoring, or questionnaires, nor does it assess the organization along a con-tinuum of developmental stages. Assessment is based purely on group reflection. The DPID requires a facilitator experienced in leading a group through this type of analysis.
The DPID is open ended but somewhat sys-tematic in covering a predefined set of organi-zational functions. Because of its flexibility, the DPID is organization specific and should not

16
Dynamic Participatory Institutional Diagnosis
Type of Organization MeasuredNGOs/PVOs; adaptable to other types of organiza-tions
Features• Difficult to compare across organiza-
tions
• Difficult to compare the same organiza-tion over time
• Capacity areas and criteria for measure-ment are loosely defined
• Assessment based primarily upon per-ceived capacities
• Produces qualitative description of an organization’s capacity
• Assessment done with the help of an outside facilitator
• Data collected through group discussion with the organization’s staff
be used to compare organiza tions. Nor is it a rigorous means of monitoring an organization’s change over time. Since the DPID does not use external standards to assess institutional ca-pacities, it should not be used to track account-ability. Collecting information from the DPID, as well as using it, should offer organizations a process to assess their needs, improve commu-nications, and solve problems around a range of organizational issues at a given moment.
ORGANIZATIONAL CAPACITY INDICATOR
Background
From 1994 through 1997, the Christian Re-formed World Relief Committee (CRWRC) conducted research on organizational capacity-building with the Weatherhead School of Man-agement at Case Western Reserve University and more than 100 local NGOs around the world. The results of this research led them to replace their earlier system, the Skill Rating Sys-tem, with an approach to capacity building andassessment based on “appreciative inquiry.” Ap-preciative inquiry is a methodology that empha-sizes an organization’s strengths and potential more than its problems. It highlights those qual-ities that give life to an organization and sus-tain its ongoing capacity. Rather than providing a standardized tool, the organizational capacity indicator assumes that capacity monitoring is unique to each organization and in the orga-nization’s own self-interest. The organizational capacity indicator (OCI) builds ownership be-cause each organization creates its own capacity assessment tool. Capacity areas are self-defined and vary from organization to organization.
Process
Although organizations create their own tool under the OCI, they all follow a similar pro-cess in doing so. As they involve all partners and stakeholders as much as possible, the par-ticipants “appreciate” the organization’s history and culture. Together they explore peak experi-ences, best practices, and future hopes for the organization. Next, the participants identify the forces and factors that have made the organiza-tion’s positive experiences possible. These be-come the capacity areas that the organization tries to monitor and improve.
Next, the participants develop a list of “provoca-

17
tive propositions” for each capacity area. These propositions, visions of what each capacity area should ideally look like in the future, contribute to the overall objective: that each organization will be able to measure itself against its own vision for the future, not some external stan-dard. Each capacity area is defined by the most ambitious vision of what the organization can become in that area. Specific indicators or be-haviors are then identified to show the capacity area in practice. Next, the organization designs a process for assessing itself and sharing experi-
Example 5. Excerpt From an OCI Tool
The following is an excerpt of one section from the capacity assessment tool developed by CRWRC’s partners in Asia, using the OCI method. (The entire tool can be found in annex 5.) It offers a menu of capacity areas and indicators from which an organization can choose and then modify for its own use. It identifies nine capacity areas, and under each area is a “provoc-ative proposition” or vision of where the organization wants to be in that area. It provides an extensive list of indicators for each capacity area, and it describes the process for developing and using the tool. Staff and partners meet regularly to determine their capacity on the cho-sen indicators. Capacity level can be indicated pictorially, for example by the stages of growth of a tree or degrees of happy faces.
ences related to each capacity component. Theorganization should monitor itself by this pro-cess twice a year. The results of the assessment should be used to encourage future develop-ment, plans, and aspirations.
Product
Each time a different organization uses the methodology, a different product specific to that organization is developed. Thus, each tool will contain a unique set of capacity areas, an
Capacity AreaA clear vision, mission, strategy, and set of shared values
PropositionOur vision expresses our purpose for existing: our dreams, aspirations, and concerns for thepoor. Our mission expresses how we reach our vision. Our strategy expresses the approachwe use to accomplish our goals. The shared values that we hold create a common under-standing and inspire us to work together to achieve our goal.
Selected Indicators• Every person can state the mission and vision in his or her own words• There is a yearly or a six-month plan, checked monthly• Operations/activities are within the vision, mission, and goal of the organization• Staff know why they do what they’re doing• Every staff member has a clear workplan for meeting the strategy• Regular meetings review and affirm the strategy
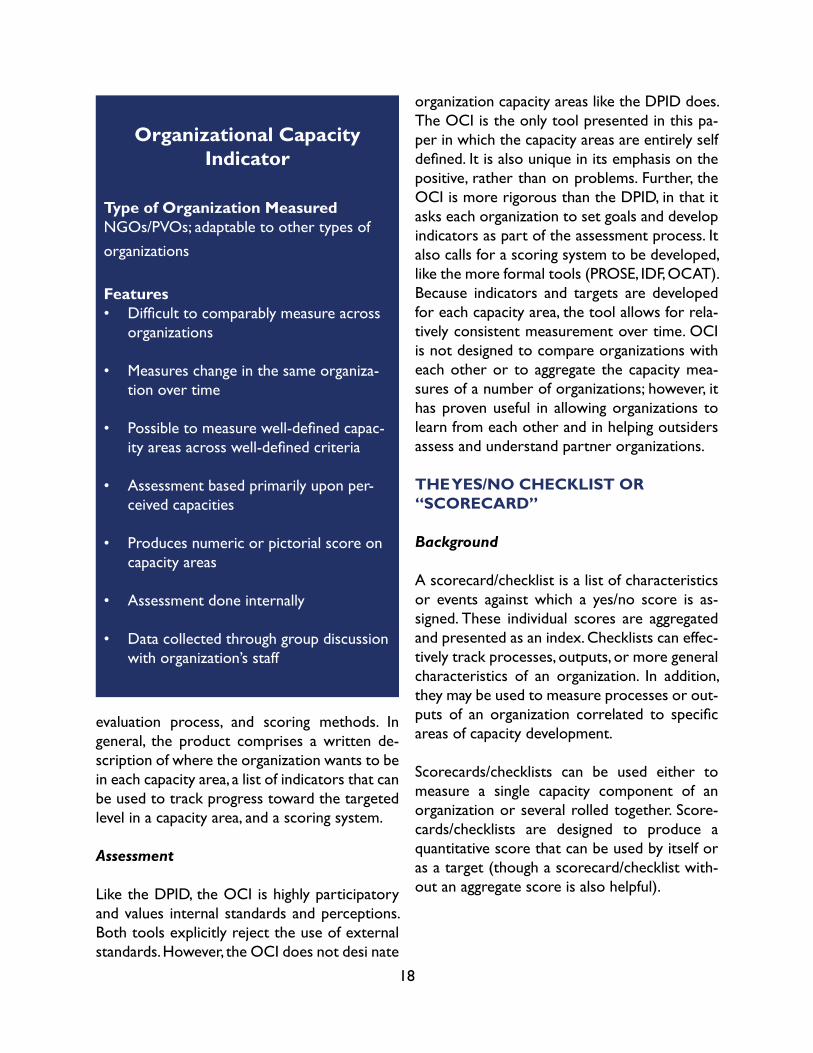
18
evaluation process, and scoring methods. In general, the product comprises a written de-scription of where the organization wants to be in each capacity area, a list of indicators that can be used to track progress toward the targeted level in a capacity area, and a scoring system.
Assessment
Like the DPID, the OCI is highly participatory and values internal standards and perceptions. Both tools explicitly reject the use of external standards. However, the OCI does not desi nate
organization capacity areas like the DPID does. The OCI is the only tool presented in this pa-per in which the capacity areas are entirely self defined. It is also unique in its emphasis on the positive, rather than on problems. Further, the OCI is more rigorous than the DPID, in that it asks each organization to set goals and develop indicators as part of the assessment process. It also calls for a scoring system to be developed, like the more formal tools (PROSE, IDF, OCAT). Because indicators and targets are developed for each capacity area, the tool allows for rela-tively consistent measurement over time. OCI is not designed to compare organizations with each other or to aggregate the capacity mea-sures of a number of organizations; however, it has proven useful in allowing organizations to learn from each other and in helping outsiders assess and understand partner organizations.
THE YES/NO CHECKLIST OR “SCORECARD”
Background
A scorecard/checklist is a list of characteristics or events against which a yes/no score is as-signed. These individual scores are aggregated and presented as an index. Checklists can effec-tively track processes, outputs, or more general characteristics of an organization. In addition, they may be used to measure processes or out-puts of an organization correlated to specific areas of capacity development.
Scorecards/checklists can be used either to measure a single capacity component of an organization or several rolled together. Score-cards/checklists are designed to produce a quantitative score that can be used by itself or as a target (though a scorecard/checklist with-out an aggregate score is also helpful).
Organizational Capacity Indicator
Type of Organization MeasuredNGOs/PVOs; adaptable to other types of organizations
Features• Difficult to comparably measure across
organizations
• Measures change in the same organiza-tion over time
• Possible to measure well-defined capac-ity areas across well-defined criteria
• Assessment based primarily upon per-ceived capacities
• Produces numeric or pictorial score on capacity areas
• Assessment done internally
• Data collected through group discussion with organization’s staff
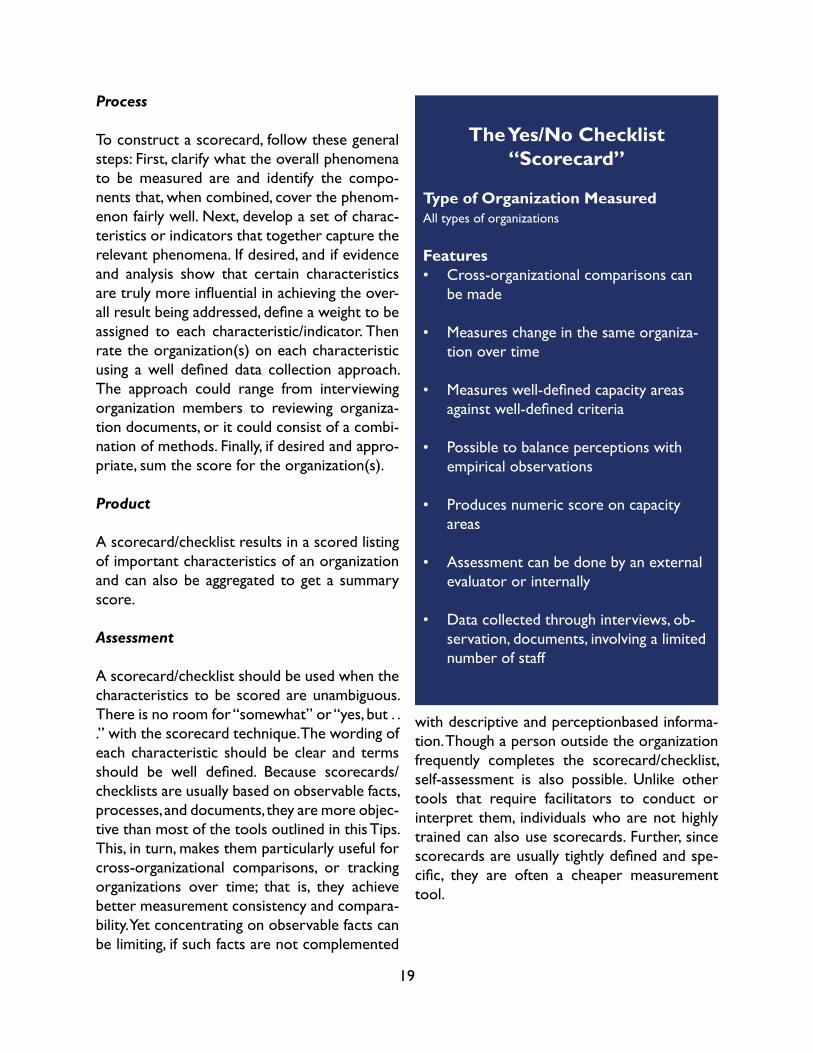
19
Process
To construct a scorecard, follow these general steps: First, clarify what the overall phenomena to be measured are and identify the compo-nents that, when combined, cover the phenom-enon fairly well. Next, develop a set of charac-teristics or indicators that together capture the relevant phenomena. If desired, and if evidence and analysis show that certain characteristics are truly more influential in achieving the over-all result being addressed, define a weight to beassigned to each characteristic/indicator. Then rate the organization(s) on each characteristic using a well defined data collection approach. The approach could range from interviewing organization members to reviewing organiza-tion documents, or it could consist of a combi-nation of methods. Finally, if desired and appro-priate, sum the score for the organization(s).
Product
A scorecard/checklist results in a scored listing of important characteristics of an organization and can also be aggregated to get a summary score.
Assessment
A scorecard/checklist should be used when thecharacteristics to be scored are unambiguous. There is no room for “somewhat” or “yes, but . . .” with the scorecard technique. The wording of each characteristic should be clear and terms should be well defined. Because scorecards/checklists are usually based on observable facts, processes, and documents, they are more objec-tive than most of the tools outlined in this Tips. This, in turn, makes them particularly useful for cross-organizational comparisons, or tracking organizations over time; that is, they achieve better measurement consistency and compara-bility. Yet concentrating on observable facts can be limiting, if such facts are not complemented
The Yes/No Checklist “Scorecard”
Type of Organization MeasuredAll types of organizations
Features• Cross-organizational comparisons can
be made
• Measures change in the same organiza-tion over time
• Measures well-defined capacity areas against well-defined criteria
• Possible to balance perceptions with empirical observations
• Produces numeric score on capacity areas
• Assessment can be done by an external evaluator or internally
• Data collected through interviews, ob-servation, documents, involving a limited number of staff
with descriptive and perceptionbased informa-tion. Though a person outside the organization frequently completes the scorecard/checklist, self-assessment is also possible. Unlike other tools that require facilitators to conduct or interpret them, individuals who are not highly trained can also use scorecards. Further, since scorecards are usually tightly defined and spe-cific, they are often a cheaper measurement tool.

20
Example 6. A Scorecard
USAID/Mozambique developed the following scorecard to measure various aspects of insti-tutional capacity in partner civil society organizations. The following example measures demo-cratic governance.
Increased Democratic Governance Within Civil Society OrganizationsCharacteristics Score Multiplied
ByWeight Weighted
Score1. Leaders (board member or equivalent) of the CSO electedby secret ballot. No=0 pts. Yes=1 pt.
X 3
2. General assembly meetings are adequately announced at least two weeks in advance to all members (1 pt.) and held at least twice a year (1 pt.). Otherwise=0 pt.
X 2
3. Annual budget presented for member approv-al. No=0 pts.Yes=1 pt.
X 2
4. Elected leaders separate from paid employees. No=0 pts. Yes=1 pt.
X 2
5. Board meetings open to ordinary members (nonboard members). No=0 pts. Yes=1 pt.
X 1
Total
In some cases, USAID is not trying to strength-en the whole organization, but rather specific parts of it that need special intervention. In many cases, the best way of measuring more specific organizational changes is to use portions of the instruments described. For instance, the IDF has a comparatively well-developed section on management resources (leadership style, participatory management, planning, monitor-ing and evaluation, and management systems). Similarly, the OCAT has some good sections on
MEASURING INDIVIDUALORGANIZATIONAL
COMPONENTS
external relations and internal governance.Organizational development professionals also use other tools to measure specific capacity areas. Some drawbacks of these tools are that they require specialized technical expertise and they can be costly to use on a regular basis. Other tools may require some initial training but can be much more easily institutionalized. Below we have identified some tools for mea-suring selected organizational components. (You will find complete reference information for these tools in the resources section of this Tips.)
STRUCTURE AND CULTURE
The Preferred Organizational Structure instru-ment is designed to assess many aspects of or-

21
DEVELOPING INDICATORS
Indicators permit managers to track and un-derstand activity/program performance at both the operational (inputs, outputs, processes) and strategic (development objectives and in-termediate results) levels. To managers familiar with the development and use of indicators, it may seem straightforward to derive indicators from the instruments presented in the preced-ing pages. However, several critical points will ensure that the indicators developed within the context of these instruments are useful to man-agers.
ganizational structure, such as formality of rules, communication lines, and decision-making. This tool requires organizational development skills, both to conduct the assessment and to inter-pret the results.
HUMAN RESOURCES AND THEIR MANAGEMENT
Many personnel assessments exist, including the Job Description Index and the Job Diagnostic Survey, both of which measure different aspects of job satisfaction, skills, and task significance. However, skilled human resource practitioners must administer them. Other assessments, such as the Alexander Team Effectiveness Critique, have been used to examine the state and func-tioning of work teams and can easily be applied in the field.
SERVICE DELIVERY
Often, a customer survey is one of the best ways to measure the efficiency and effective-ness of a service delivery system. A specific customer survey would need to be designed relative to each situation. Example 7 shows a sample customer service assessment.
First, the development of indicators should be driven by the informational needs of managers, from both USAID and the given relevant orga-nizations-- to inform strategic and operational decisions and to assist in reporting and com-municating to partners and other stakeholders. At times, there is a tendency to identify or de-sign a data collection instrument without giving too much thought to exactly what information will be needed for management and reporting. In these situations, indicators tend to be devel-oped on the basis of the data that have been collected, rather than on what managers need. More to the point, the development of indica-tors should follow a thorough assessment of informational needs and precede the identifi-cation of a data collection instrument. Manag-ers should first determine their informational needs; from these needs, they should articulate and define indicators; and only then, with this information in hand, they would identify or develop an instrument to collect the required data. This means that, in most cases, indicators should not be derived, post facto, from a data collection tool. Rather, the data collection tool should be designed with the given indicators in mind. Second, indicators should be developed for management decisions at all levels (input in-dicators, output indicators, process indicators, and outcome/impact indicators). With USAID’s increased emphasis on results, managers some-times may concentrate primarily on strategic indicators (for development objectives and intermediate results). While an emphasis on results is appropriate, particularly for USAID managers, tracking operational-level informa-tion for the organizations supported through a given Agency program is critical if managers are to understand if, to what degree, and how the organizations are increasing their capaci-ties. The instruments outlined in this paper can provide data for indicators defined at various management levels.
Finally, indicators should meet the criteria out-

22
1. In the past 12 months, have you ever contacted a municipal office to complain about something such as poor city services or a rude city official, or any other reason?________No ________Yes
If YES:
1a. How many different problems or complaints did you contact the municipality about in the last 12 months?________One ________Two ________Three to five ________More than five
1b. Please describe briefly the nature of the complaint starting with the one you feel was most important.1._______________________________________________2._______________________________________________3._______________________________________________
2. Which department or officials did you contact initially regarding these complaints?____Mayor’s office____Council member____Police____Sanitation____Public works____Roads____Housing____Health____Other________________________________________
2a. Were you generally satisfied with the city’s response? (IF DISSATISFIED, ASK: What were the majorreasons for your dissatisfaction?)_____Response not yet completed_____Satisfied_____Dissatisfied, never responded or corrected condition_____Dissatisfied, poor quality or incorrect response was provided_____Dissatisfied, took too long to complete response, had to keep pressuring for results, red tape, etc._____Dissatisfied, personnel were discourteous, negative, etc._____Dissatisfied, other_____________________________
3. Overall, are you satisfied with the usefulness, courtesy and effectiveness of the municipal department orofficial that you contacted?_____Definitely yes_____Generally yes_____Generally no (explain)_______________________________Definitely no (explain)__________________________Survey adapted from Hatry, Blair, and others, 1992.
Example 7. A Customer Service Assessment
23
lined in USAID’s Automated Directives System and related pieces of Agency guidance such as CDIE’s Performance Monitoring and Evalua-tion Tips #6, “Selecting Performance Indica-tors,” and Tips #12, “Guidelines for Indicator and Data Quality.” That is, indicators should be direct, objective, practical, and adequate. Once an indicator has been decided upon, it is impor-tant to document the relevant technical details: a precise definition of the indicator; a detailed description of the data source; and a thorough explanation of the data collection method. (Re-fer to Tips #7, “Preparing a Performance Moni-toring Plan.”)
RESULTS-LEVEL INDICATORS
USAID managers spend substantial time and energy developing indicators for development objectives and intermediate results related to institutional capacity. The range of the Agency’s institutional strengthening programs is broad, as is the range of the indicators that track the programs’ results. Some results reflect multiple organizations and others relate to a single or-ganization. Additionally, of those results that re-late to multiple organizations, some may refer to organizations from only one sector while others may capture organizations from a num-ber of sectors. Results related to institutional strengthening also vary relative to the level of change they indicate-- such as an increase in in-stitutional capacity versus the eventual impact generated by such an i crease-- and with re-gard to whether they reflect strengthening of the whole organization(s) or just one or several elements. It is relatively easy to develop indica-tors for all types of results and to use the instru-ments outlined in this Tips to collect the nec-essary data. For example, when a result refers to strengthening a single organization, across all elements, an aggregate index or “score” of institutional strength may be an appropriate in-dicator (an instrument based on the IDF or the scorecard model might be used to collect such
data). If a result refers to multiple organizations, it might be useful to frame an indicator in terms of the number or percent of the organizations that meet or exceed a given threshold score or development stage, on the basis of an aggregate index or the score of a single element for each organization. The key is to ensure that the indi-cator reflects the result and to then identify themost appropriate and useful measurement in-strument.
Example 8 includes real indicators used by US-AID missions in 1998 to report on strategic ob-jectives and intermediate results in institutional capacity strengthening.
PRACTICAL TIPS FOR A BUSY USAID MANAGER
This TIPS introduces critical issues related to measuring institutional capacity. It presents a number of approaches that managers of devel-opment programs and activities currently use in the field. In this section we summarize the preceding discussion by offering several quick tips that USAID managers should find useful as they design, modify, and implement their own approaches for measuring institutional capacity.
1. Carefully review the informational needs of the relevant managers and the characteris-tics of the organization to be measured to facilitate development of indicators. Identify your information needs and develop indicators before you choose an instrument.
2. To assist you in selecting an appropriate measurement tool, ask yourself the following questions as they pertain to your institutional capacity measurement situation. Equipped with the answers to these questions, you
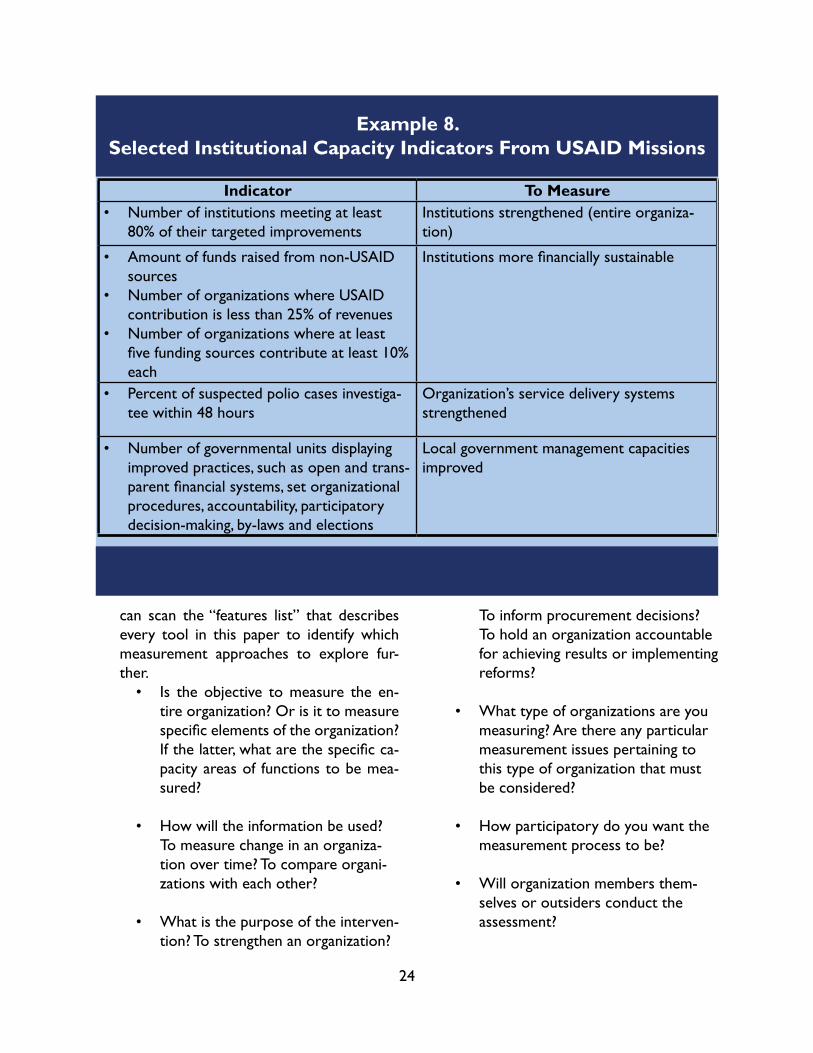
24
Example 8. Selected Institutional Capacity Indicators From USAID Missions
Indicator To Measure• Number of institutions meeting at least
80% of their targeted improvements Institutions strengthened (entire organiza-tion)
• Amount of funds raised from non-USAID sources
• Number of organizations where USAID contribution is less than 25% of revenues
• Number of organizations where at least five funding sources contribute at least 10% each
Institutions more financially sustainable
• Percent of suspected polio cases investiga-tee within 48 hours
Organization’s service delivery systemsstrengthened
• Number of governmental units displaying improved practices, such as open and trans-parent financial systems, set organizational procedures, accountability, participatory decision-making, by-laws and elections
Local government management capacitiesimproved
can scan the “features list” that describes every tool in this paper to identify which measurement approaches to explore fur-ther.
• Is the objective to measure the en-tire organization? Or is it to measure specific elements of the organization? If the latter, what are the specific ca-pacity areas of functions to be mea-sured?
• How will the information be used? To measure change in an organiza-tion over time? To compare organi-zations with each other?
• What is the purpose of the interven-tion? To strengthen an organization?
To inform procurement decisions? To hold an organization accountable for achieving results or implementing reforms?
• What type of organizations are you measuring? Are there any particular measurement issues pertaining to this type of organization that must be considered?
• How participatory do you want the measurement process to be?
• Will organization members them-selves or outsiders conduct the assessment?

25
3. If you are concerned about data reliability, ap-ply measurement instruments consistently over time and across organizations to ensure data reliability. You can adapt and adjust tools as needed, but once you develop the instru-ment, use it consistently.
4. When interpreting and drawing conclusions from collected data, remember the limits of the relevant measurement tool. Most methods for measuring institutional capacity are subjec-tive, as they are based on the perceptions of those participating in the assessment,
This TIPS was prepared for CDIE by Alan Lessik and Victoria Michener of Management Systems International.
and involve some form of ordinal scaling/scoring. When reviewing data, managers should therefore zero in on the direction and general degree of change. Do not be overly concerned about small changes; avoid false precision.
5. Cost matters-- and so does the frequency and timing of data collection. Data need to be available frequently enough, and at the right point in the program cycle, to inform operational and strategic management deci-sions. Additionally, the management benefits of data should exceed the costs associated with their collection.
6. The process of measuring institutional capacity can contribute substantially to increasing an or-ganization’s strength. A number of measure-ment approaches are explicitly designed as learning opportunities for organizations; that is, to identify problems and suggest re-lated solutions, to improve communication, or to facilitate a consensus around future priorities
RESOURCESBibliography
Booth, W.; and R. Morin. 1996. Assessing Organizational Capacity Through Participatory Monitoring and Evaluation Handbook. Prepared for the Pact Ethiopian NGO Sector Enhancement Initiative. Washington: USAID.
Center for Democracy and Governance. 1998. Handbook of Democracy and Governance
• What product do you want the mea-surement tool to generate?
• Do you want the measurement pro-cess to be an institution-strengthen-ing exercise in itself?i. Do you need an instrument that measures one organization? Several organizations againstindividual criteria? Or sev-eral organizations against standard criteria?

26
Program Indicators.Washington: U.S. Agency for International Development.
Christian Reformed World Relief Committee. 1997. Partnering to Build and Measure Organizational Capacity. Grand Rapids, Mich.
Cooper, S.; and R. O’Connor. 1993. “Standards for Organizational Consultation: Assessment and Evaluation Instruments.” Journal of Counseling and Development 71: 651-9. Counterpart International. N.d. “CAP Monitoring and Evaluation Questionnaire.”
—N.d. “Manual for the Workshop on Development of a Training and Technical Assistance Plan (TTAP).”
—N.d. “Institutional Assessment Indicators.”
Drucker, P.; and C. Roseum. 1993. How to Assess Your Nonprofit Organization with Peter Drucker’s Five Important Questions: User Guide for Boards, Staff, Volunteers and Facilitators. Jossey--Bass .
Eade, D. 1997. Capacity-Building: An Approach to People-Centred Development. Oxford: Oxfam.
Fowler, A.; L. Goold; and R. James. 1995. Participatory Self Assessment of NGO Capacity. INTRAC Occasional Papers Series No. 10. Oxford.
Hatry, H.; L. Blair; D. Fisk; J. Grenier; J. Hall; and P. Schaenman. 1992. How Effective Are Your Community Services? Procedures for Measuring Their Quality. Washington: The Urban Institute.
International Working Group on Capacity Building of Southern NGOs. 1998. “Southern NGO Capacity Building: Issues and Priorities.” New Delhi: Society for Participatory Research in Asia.
International Working Group on Capacity Building for NGOs. 1998. “Strengthening Southern NGOs: The Donor Perspective.” Washington: USAID and The World Bank.
Kelleher, D. and K. McLaren with R. Bisson. 1996. “Grabbing the Tiger by the Tail: NGOs Learning forOrganizational Change.” Canadian Council for International Cooperation.
Lent, D. October 1996. “What is Institutional Capacity?” On Track: The Reengineering Digest. 2 (7): 3. Washington: U.S. Agency for International Development.
Levinger, B. and E. Bloom. 1997. Introduction to DOSA: An Outline Presentation. http://www.edc.org/int/capdev/dosafile/dosintr.htm.
Lusthaus, C., G. Anderson, and E. Murphy. 1995. “Institutional Assessment: A Framework for Strengthening Organizational Capacity for IDRC’s Research Partners.” IDRC.

27
Mentz, J.C.N. 1997. “Personal and Institutional Factors in Capacity Building and Institutional Development.” European Centre for Development Policy Management Working Paper No. 14.
Morgan, P.; and A. Qualman. 1996. “Institutional and Capacity Development, Results-Based Management and Organisational Performance.” Canadian International Development Agency.
New TransCentury Foundation. 1996. Practical Approaches to PVO/NGO Capacity Building: Lessons from the Field (five monographs). Washington: U.S.Agency for International Development.
Pact. N.d. “What is Prose?”
—1998. “Pact Organizational Capacity Assessment Training of Trainers.” 7-8 January.
Renzi, M. 1996. “An Integrated Tool Kit for Institutional Development.”Public Administration and Development 16: 469-83.
—N.d. “The Institutional Framework: Frequently Asked Questions.” Unpublished paper. Management Systems International.
Sahley, C. 1995. “Strengthening the Capacity of NGOs: Cases of Small Enterprise Development Agencies in Africa.” INTRAC NGO Management and Policy Series. Oxford.
Save the Children. N.d. Institutional Strengthening Indicators: Self Assessment for NGOs. UNDP. 1997. Capacity Assessment and Development. Technical Advisory Paper No. 3, Management Development and Governance Division. New York.
Bureau for Policy and Program Coordination. 1995. USAID-U.S. PVO Partnership. Policy Guidance. Washington: U.S. Agency for International Development.
Office of Private and Voluntary Cooperation. 1998. USAID Support for NGO Capacity-Building: Approaches, Examples, Mechanisms. Washington: U.S. Agency for International Development.
—1998. Results Review Fiscal Year 1997. Washington: U.S. Agency for International Development.
NPI Learning Team. 1997. New Partnerships Initiative: A Strategic Approach to Development Partnering. Washington: U.S. Agency for International Development. 23
USAID/Brazil. 1998. Fiscal Year 2000 Results Review and Resource Request.
USAID/Guatemala. 1998. Fiscal Year 2000 Results Review and Resource Request.
28
USAID/Indonesia. 1998. Fiscal Year 2000 Results Review and Resource Request.
USAID/Madagascar. 1998. Fiscal Year 2000 Results Review and Resource Request.
—1997. Institutional Capacity Needs Assessment.
USAID/Mexico. 1998. The FY 1999--FY 2003 Country Strategy for USAID in Mexico.
USAID/Mozambique. 1998. Fiscal Year 2000 Results Review and Resource Request.
USAID/West Bank--Gaza. 1998. Fiscal Year 2000 Results Review and Resource Request.
Whorton, J.; and D. Morgan. 1975. Measuring Community Performance: A Handbook of Indicators, University of Oklahoma.
World Bank. 1996. Partnership for Capacity Building in Africa: Strategy and Program of Action. Washington.
World Learning. 1998. Institutional Analysis Instrument: An NGO Development Tool.
Sources of Information on Institutional Capacity Measurement Tools
Discussion-Oriented Organizational Self-Assessment: http://www.edc.org/int/capdev/dosafile/dosintr.htm.
Institutional Development Framework: Management Systems International. Washington.
Organizational Capacity Assessment Tool: http://www.pactworld.org/ocat.html Pact.Washington.
Dynamic Participatory Institutional Diagnostic: New TransCentury Foundation. Arlington, Va. Organizational Capacity Indicator: Christian Reformed World Relief Committee. Grand Rapids, Mich.
Smith, P.; L. Kendall; and C. Hulin. 1969. The Measurement of Satisfaction in Work and Retirement. Rand McNally.
Hackman, J.R.; and G.R. Oldham. 1975. “Job Diagnostic Survey: Development of the Job Diagnostic Survey”
Journal of Applied Psychology 60: 159-70.
Goodstein, L.D.; and J.W. Pfeiffer, eds. 1985. Alexander Team Effectiveness Critique: The 1995 Annual: Developing Human Resources. Pfeiffer & Co.

29
Bourgeois, L.J.; D.W. McAllister; and T.R. Mitchell. 1978. “Preferred Organizational Structure: The Effects of Different Organizational Environments Upon Decisions About Organizational Structure.” Academy of Management Journal 21: 508-14.
Kraut, A. 1996. Customer and Employee Surveys: Organizational Surveys: Tools for Assessment and Change. Jossey-Bass Publishers. 24

1
PERFORMANCE MONITORING & EVALUATION
TIPS CONDUCTING MIXED-METHOD EVALUATIONS
ABOUT TIPS These TIPS provide practical advice and suggestions to USAID managers on issues related to
performance monitoring and evaluation. This publication is a supplemental reference to the
Automated Directive System (ADS) Chapter 203.
INTRODUCTION
This TIPS provides guidance on
using a mixed-methods approach
for evaluation research.
Frequently, evaluation statements
of work specify that a mix of
methods be used to answer
evaluation questions. This TIPS
includes the rationale for using a
mixed-method evaluation design,
guidance for selecting among
methods (with an example from
an evaluation of a training
program) and examples of
techniques for analyzing data
collected with several different
methods (including ―parallel
analysis‖).
MIXED-METHOD
EVALUATIONS
DEFINED
A mixed-method evaluation is
one that uses two or more
techniques or methods to collect
the data needed to answer one or
more evaluation questions. Some
of the different data collection
methods that might be combined
in an evaluation include
structured observations, key
informant interviews, pre- and
post-test surveys, and reviews of
government statistics. This could
involve the collection and use of
both quantitative and qualitative
data to analyze and identify
findings and to develop
conclusions in response to the
evaluation questions.
RATIONALE FOR
USING A MIXED-
METHOD
EVALUATION DESIGN
There are several possible cases
in which it would be highly
beneficial to employ mixed-
methods in an evaluation design:
When a mix of different
methods is used to collect data
from different sources to
provide independent estimates
of key indicators—and those
estimates complement one
another—it increases the
validity of conclusions related
to an evaluation question. This
is referred to as triangulation.
(See TIPS 5: Rapid Appraisal,
and Bamberger, Rugh and
NUMBER 16
1ST EDITION 2010

2
Mabry [2006] for further
explanation and descriptions of
triangulation strategies used in
evaluations.)
When reliance on one method
alone may not be sufficient to
answer all aspects of each
evaluation question.
When the data collected from
one method can help interpret
findings from the analysis of
data collected from another
method. For example,
qualitative data from in-depth
interviews or focus groups can
help interpret statistical
patterns from quantitative data
collected through a random-
sample survey. This yields a
richer analysis and can also
provide a better understanding
of the context in which a
program operates.
There are a number of additional
benefits derived from using a mix
of methods in any given
evaluation.
Using mixed-methods can
more readily yield examples of
unanticipated changes or
responses.
Mixed-method evaluations
have the potential of surfacing
other key issues and providing
a deeper understanding of
program context that should
be considered when analyzing
data and developing findings
and conclusions.
Mixed-method evaluations
often yield a wider range of
points of view that might
otherwise be missed.
DETERMINING
WHICH METHODS TO
USE
In a mixed-method evaluation,
the evaluator may use a
combination of methods, such as
a survey using comparison
groups in a quasi-experimental or
experimental design, a review of
key documents, a reanalysis of
government statistics, in-depth
interviews with key informants,
focus groups, and structured
observations. The selection of
methods, or mix, depends on the
Key Steps in Developing a Mixed-Method Evaluation Design and Analysis
Strategy
1. In order to determine the methods that will be employed, carefully review the purpose of the evaluation and the
primary evaluation questions. Then select the methods that will be the most useful and cost-effective to answer
each question in the time period allotted for the evaluation. Sometimes it is apparent that there is one method
that can be used to answer most, but not all, aspects of the evaluation question.
2. Select complementary methods to cover different aspects of the evaluation question (for example, the how and
why issues) that the first method selected cannot alone answer, and/or to enrich and strengthen data analysis
and interpretation of findings.
3. In situations when the strength of findings and conclusions for a key question is absolutely essential, employ a
triangulation strategy. What additional data sources and methods can be used to obtain information to answer
the same question in order to increase the validity of findings from the first method selected?
4. Re-examine the purpose of the evaluation and the methods initially selected to ensure that all aspects of the
primary evaluation questions are covered thoroughly. This is the basis of the evaluation design. Develop data
collection instruments accordingly.
5. Design a data analysis strategy to analyze the data that will be generated from the selection of methods chosen
for the evaluation.
6. Ensure that the evaluation team composition includes members that are well-versed and experienced in applying
each type of data collection method and subsequent analysis.
7. Ensure that there is sufficient time in the evaluation statement of work for evaluators to fully analyze data
generated from each method employed and to realize the benefits of conducting a mixed method evaluation.
3
nature of the evaluation purpose
and the key questions to be
addressed.
SELECTION OF DATA
COLLECTION
METHODS – AN
EXAMPLE
The selection of which methods
to use in an evaluation is
driven by the key evaluation
questions to be addressed.
Frequently, one primary
evaluation method is apparent.
For example, suppose an
organization wants to know
about the effectiveness of a pilot
training program conducted for
100 individuals to set up their
own small businesses after the
completion of the training.
The evaluator should ask what
methods are most useful and
cost-effective to assess the
question of the effectiveness of
that training program within the
given time frame allotted for the
evaluation. The answer to this
question must be based on the
stated outcome expected from
the training program. In this
example, let us say that the
organization’s expectations were
that, within one year, 70 percent
of the 100 individuals that were
trained will have used their new
skills and knowledge to start a
small business.
What is the best method to
determine whether this outcome
has been achieved? The most
cost- effective means of
answering this question is to
survey 100 percent of the
individuals who graduated from
the training program using a
close-ended questionnaire. It
follows that a survey instrument
should be designed to determine
if these individuals have actually
succeeded in starting up a new
business.
While this sounds relatively
straightforward, organizations are
often interested in related issues.
If less than 70 percent of the
individuals started a new business
one year after completion of the
training, the organization
generally wants to know why
some graduates from the
program were successful while
others were not. Did the training
these individuals received actually
help them start up a small
business? Were there topics that
should have been covered to
more thoroughly prepare them
for the realities of setting up a
business? Were there other
topics that should have been
addressed? In summary, this
organization wants to learn not
only whether at least 70 percent
of the individuals trained have
started up a business, but also
how effectively the training
equipped them to do so. It also
wants to know both the strengths
and the shortcomings of the
training so that it can improve
future training programs.
The organization may also want
to know if there were factors
outside the actual intervention
that had a bearing on the
training’s success or failure. For
example, did some individuals
find employment instead? Was
access to finance a problem? Did
they conduct an adequate market
analysis? Did some individuals
start with prior business skills?
Are there factors in the local
economy, such as local business
regulations, that either promote
or discourage small business
start-ups? There are numerous
factors which could have
influenced this outcome.
The selection of additional
methods to be employed is,
again, based on the nature of
each aspect of the issue or set
of related questions that the
organization wants to probe.
To continue with this example,
the evaluator might expand the
number of survey questions to
address issues related to the
effectiveness of the training and
external factors such as access to
finance. These additional
questions can be designed to
yield additional quantitative data
and to probe for information
such as the level of satisfaction
with the training program, the
usefulness of the training
program in establishing a
business, whether the training
graduate received a small
business start-up loan, if the size
of the loan the graduate received
was sufficient, and whether
graduates are still in the process
of starting up their businesses or
instead have found employment.
Intake data from the training
program on characteristics of
each trainee can also be
examined to see if there are any
particular characteristics, such as
sex or ethnic background, that
can be correlated with the survey
findings.
4
It is important to draw on
additional methods to help
explain the statistical findings
from the survey, probe the
strengths and shortcomings of
the training program, further
understand issues related to
access to finance, and identify
external factors affecting success
in starting a business. In this
case, the evaluation design could
focus on a sub-set of the 100
individuals to obtain additional
qualitative information. A
selected group of 25 people
could be asked to answer an
additional series of open-ended
questions during the same
interview session, expanding it
from 30 minutes to 60 minutes.
Whereas asking 100 people
open-ended questions would be
better than just 25 people, costs
prohibit interviewing the entire
group.
Using the same example,
suppose the organization has
learned through informal
feedback that access to finance is
likely a key factor in determining
success in business start-up in
addition to the training program
itself. Depending on the
evaluation findings, the
organization may want to design
a finance program that increases
access to loans for small business
start-ups. To determine the
validity of this assumption, the
evaluation design relies on a
triangulation approach to assess
whether and how access to
finance for business start-ups
provides further explanations
regarding success or failure
outcomes. The design includes a
plan to collect data from two
other sources using a separate
data collection method for each
source. The first data source
includes the quantitative data
from the survey of the 100
training graduates. The
evaluation designers determine
that the second data source will
be the managers of local banks
and credit unions that survey
respondents reported having
approached for start-up loans.
In-depth interviews will be
conducted to record and
understand policies for lending to
entrepreneurs trying to establish
small businesses, the application
of those policies, and other
business practices with respect to
prospective clients. The third
data source is comprised of bank
loan statistics for entrepreneurs
who have applied to start up
small businesses. Now there are
three independent data sources
using different data collection
methods to assess whether
access to finance is an additional
key factor in determining small
business start-up success.
In this example, the total mix of
methods the evaluator would use
includes the following: the survey
of all 100 training graduates, data
from open-ended questions from
a subset of graduates selected for
longer interviews, analysis of
training intake data on trainee
characteristics, in-depth
interviews with managers of
lending institutions, and an
examination of loan data. The
use of mixed-methods was
necessary because the client
organization in this case not only
wanted to know how effective the
pilot training course was based
on its own measure of program
success, but also whether access
to finance contributed to either
success or failure in starting up a
new business. The analysis of the
data will be used to strengthen
the training design and content
employed in the pilot training
course, and as previously stated,
perhaps to design a microfinance
program.
The last step in the process of
designing a mixed-method
evaluation is to determine how
the data derived from using
mixed-methods will be analyzed
to produce findings and to
determine the key conclusions.
ANALYZING DATA
FROM A MIXED-
METHOD
EVALUATION –
DESIGNING A DATA
ANALYSIS STRATEGY
It is important to design the data
analysis strategy before the
actual data collection begins.
Having done so, the evaluator
can begin thinking about trends
in findings from different sets of
data to see if findings converge
or diverge. Analyzing data
collected from a mixture of
methods is admittedly more
complicated than analyzing the
data derived from one method.
This entails a process in which
quantitative and qualitative data
analysis strategies are eventually
connected to determine and
understand key findings. Several
different techniques can be used

5
to analyze data from mixed-
methods approaches, including
parallel analysis, conversion
analysis, sequential analysis,
multilevel analysis, and data
synthesis. The choice of analytical
techniques should be matched
with the purpose of the
evaluation using mixed-methods.
Table 1 briefly describes the
different analysis techniques and
the situations in which each
method is best applied. In
complex evaluations with
multiple issues to address, skilled
evaluators may use more than
one of these techniques to
analyze the data.
EXAMPLE OF
APPLICATION
Here we present an example of
parallel mixed-data analysis,
because it is the most widely
used analytical technique in
mixed-method evaluations. This
is followed by examples of how
to resolve situations where
divergent findings arise from the
analysis of data collected through
a triangulation process.
PARALLEL MIXED-DATA
ANALYSIS
Parallel mixed-data analysis is
comprised of two major steps:
Step 1: This involves two or
more analytical processes. The
data collected from each method
employed must be analyzed
separately. For example, a
statistical analysis of quantitative
data derived from a survey, a set
of height/weight measures, or a
set of government statistics is
conducted. Then, a separate and
independent analysis is
conducted of qualitative data
derived from, for example, in-
depth interviews, case studies,
focus groups, or structured
observations to determine
emergent themes, broad
patterns, and contextual factors.
The main point is that the
analysis of data collected from
each method must be
conducted independently.
Step 2: Once the analysis of the
data generated by each data
collection method is completed,
the evaluator focuses on how the
analysis and findings from each
data set can inform, explain,
and/or strengthen findings from
the other data set. There are two
possible primary analytical
methods for doing this – and
sometimes both methods are
used in the same evaluation.
Again, the method used depends
on the purpose of the evaluation.
In cases where more than one
method is used specifically to
strengthen and validate
findings for the same question
through a triangulation design,
the evaluator compares the
findings from the independent
analysis on each data set to
determine if there is a
convergence of findings. This
method is used when it is
critical to produce defensible
conclusions that can be used to
inform major program
decisions (e.g., end or extend a
program).
To interpret or explain findings
from quantitative analysis,
evaluators use findings from
the analysis of qualitative data.
This method can provide a
richer analysis and set of
explanations affecting program
outcomes that enhance the
utility of the evaluation for
program managers.
Conversely, patterns and
associations arising from the
analysis of quantitative data
can inform additional patterns
to look for in analyzing
qualitative data. The analysis
of qualitative data can also
enhance the understanding of
important program context
data. This method is often used
when program managers want
to know not only whether or
not a program is achieving its
intended results, but also, why
or why not.
WHEN FINDINGS DO NOT
CONVERGE
In cases where mixed-method
evaluations employ triangulation,
it is not unusual that findings
from the separate analysis of
each data set do not
automatically converge. If this
occurs, the evaluator must try to
resolve the conflict among
divergent findings. This is not a
disaster. Often this kind of
situation can present an
opportunity to generate more
nuanced explanations and
important additional findings that
are of great value.
One method evaluators use when
findings from different methods
diverge is to carefully re-examine
the raw qualitative data through
a second and more in-depth
content analysis. This is done to

6
determine if there were any
factors or issues that were missed
when these data were first being
organized for analysis. The
results of this third layer of
analysis can produce a deeper
understanding of the data, and
can then be used to generate
new interpretations. In some
cases, other factors external to
the program might be discovered
through contextual analysis of
economic, social or political
conditions or an analysis of
operations and interventions
across program sites.
Another approach is to reanalyze
all the disaggregated data in
each data set separately, by
characteristics of the respondents
as appropriate to the study, such
as age, gender, educational
background, economic strata,
etc., and/or by geography/locale
of respondents.
The results of this analysis may
yield other information that can
help to resolve the divergence of
findings. In this case, the
evaluator should attempt to rank
order these factors in terms of
frequency of occurrence. This
further analysis will provide
additional explanations for the
variances in findings. While most
professionals build this type of
disaggregation into the analysis
of the data during the design
phase of the evaluation, it is
worth reexamining patterns from
disaggregated data.
Evaluators should also check for
data quality issues, such as the
validity of secondary data sources
or possible errors in survey data
from incomplete recording or
incorrect coding of responses.
(See TIPS 12: Data Quality
Standards.) If the evaluators are
still at the program site, it is
possible to resolve data quality
issues with limited follow-up data
collection by, for example,
conducting in-depth interviews
with key informants (if time and
budget permit).
In cases where an overall
summative program conclusion is
required, another analytical tool
that is used to resolve divergent
findings is the data synthesis
method. (See Table 2.) This
method rates the strength of
findings generated from the
analysis of each data set based
on the intensity of the impact
(e.g., on a scale from very high
positive to very high negative)
and the quality and validity of the
data. An overall rating is assigned
for each data set, but different
weights can then be assigned to
different data sets if the evaluator
knows that certain data sources
or methods for collecting data
are stronger than others.
Ultimately, an index is created
based on the average of those
ratings to synthesize an overall
program effect on the outcome.
See McConney, Rudd and Ayres
(2002) to learn more about this
method.
REPORTING ON
MIXED-METHOD
EVALUATIONS
Mixed-method evaluations
generate a great deal of data,
and, to profit from the use of
those methods, evaluators must
use and analyze all of the data
sets. Through the use of mixed-
method evaluations, findings and
conclusions can be enriched and
strengthened. Yet there is a
tendency to underuse, or even
not to use, all the data collected
for the evaluation. Evaluators can
rely too heavily on one particular
data source if it generates easily
digestible and understandable
information for a program
manager. For example, in many
cases data generated from
qualitative methods are
insufficiently analyzed. In some
cases only findings from one
source are reported.
One way to prevent
underutilization of findings is to
write a statement of work that
provides the evaluator sufficient
time to analyze the data sets
from each method employed,
and hence to develop valid
findings, explanations, and strong
conclusions that a program
manager can use with
confidence. Additionally,
statements of work for evaluation
should require evidence of, and
reporting on, the analysis of data
sets from each method that was
used to collect data, or
methodological justification for
having discarded any data sets.
7
REFERENCES
Bamberger, Michael, Jim Rugh and Linda Mabry. Real World Evaluation: Working Under Budget,
Time, Data and Political Constraints, Chapter 13, ―Mixed-Method Evaluation,‖ pp. 303-322, Sage
Publications Inc., Thousand Oaks, CA, 2006.
Greene, Jennifer C. and Valerie J. Caracelli. ―Defining and Describing the Paradigm Issue in Mixed-
methods Evaluation,” in Advances in Mixed-Method Evaluation: The Challenges and Benefits of
Integrating Diverse Paradigms, Green and Caracelli eds. New Directions for Evaluation. Josey-Bass
Publishers, No. 74, Summer 1997, pp 5-17.
Mark, Melvin M., Irwin Feller and Scott B. Button. ―Integrating Qualitative Methods in a
Predominantly Quantitative Evaluation: A Case Study and Some Reflections,‖ in Advances in
Mixed-Method Evaluation: The Challenges and Benefits of Integrating Diverse Paradigms, Green
and Caracelli eds. New Directions for Evaluation. Josey-Bass Publishers, No. 74, Summer 1997, pp
47-59.
McConney, Andrew, Andy Rudd, and Robert Ayres. ―Getting to the Bottom Line: A Method for
Synthesizing Findings Within Mixed-method Program Evaluations,‖ in American Journal of
Evaluation, Vol. 3, No. 2, 2002, pp. 121-140.
Teddlie, Charles and Abbas Tashakkori, Foundations of Mixed-methods Research: Integrating
Quantitative and Qualitative Approaches in the Behavioral Science, Sage Publications, Inc., Los
Angeles, 2009.

8
TABLE 1 – METHODS FOR ANALYZING MIXED-METHODS DATA1
Analytical Method
Brief Description Best for…
Parallel Two or more data sets collected using a mix of
methods (quantitative and qualitative) are analyzed
independently. The findings are then combined or
integrated.
Triangulation designs to look for
convergence of findings when the strength
of the findings and conclusions is critical,
or to use analysis of qualitative data to
yield deeper explanations of findings from
quantitative data analysis.
Conversion Two types of data are generated from one data source
beginning with the form (quantitative or qualitative) of
the original data source that was collected. Then the
data are converted into either numerical or narrative
data. A common example is the transformation of
qualitative narrative data into numerical data for
statistical analysis (e.g., on the simplest level,
frequency counts of certain responses).
Extending the findings of one data set, say,
quantitative, to generate additional
findings and/or to compare and potentially
strengthen the findings generated from a
complimentary set of, say, qualitative data.
Sequential A chronological analysis of two or more data sets
(quantitative and qualitative) where the results of the
analysis from the first data set are used to inform the
analysis of the second data set. The type of analysis
conducted on the second data set is dependent on the
outcome of the first data set.
Testing hypotheses generated from the
analysis of the first data set.
Multilevel Qualitative and quantitative techniques are used at
different levels of aggregation within a study from at
least two data sources to answer interrelated evaluation
questions. One type of analysis (qualitative) is used at
one level (e.g., patient) and another type of analysis
(quantitative) is used in at least one other level (e.g.,
nurse).
Evaluations where organizational units for
study are nested (e.g., patient, nurse,
doctor, hospital, hospital administrator in
an evaluation to understand the quality of
patient treatment).
Data Synthesis
A multi-step analytical process in which: 1) a rating of
program effectiveness using the analysis of each data
set is conducted (e.g., large positive effect, small
positive effect, no discernable effect, small negative
effect, large negative effect; 2) quality of evidence
assessments are conducted for each data set using
“criteria of worth” to rate the quality and validity of each
data set gathered; 3) using the ratings collected under
the first two steps, develop an aggregated equation for
each outcome under consideration to assess the overall
strength and validity of each finding; and 4) average
outcome-wise effectiveness estimates to produce one
overall program-wise effectiveness index.
Providing a bottom-line measure in cases
where the evaluation purpose is to provide
a summative program-wise conclusion
when findings from mixed-method
evaluations using a triangulation strategy
do not converge and appear to be
irresolvable, yet a defensible conclusion is
needed to make a firm program decision.
Note: there may still be some divergence in
the evaluation findings from mixed data
sets that the evaluator can still attempt to
resolve and/or explore to further enrich the
analysis and findings.
1 See Teddlie and Tashakkori (2009) and Mark, Feller and Button (1997) for examples and further explanations of parallel data analysis.
See Teddlie and Tashakkori (2009) on conversion, sequential, multilevel, and fully integrated mixed-methods data analysis; and McConney, Rudd, and Ayers (2002), for a further explanation of data synthesis analysis.

9
For more information:
TIPS publications are available online at [insert website].
Acknowledgements:
Our thanks to those whose experience and insights helped shape this publication including USAID’s
Office of Management Policy, Budget and Performance (MPBP). This publication was written by Dr.
Patricia Vondal of Management Systems International.
Comments regarding this publication can be directed to:
Gerald Britan, Ph.D.
Tel: (202) 712-1158
Contracted under RAN-M-00-04-00049-A-FY0S-84
Integrated Managing for Results II
1
PERFORMANCE MONITORING & EVALUATION
TIPS CONSTRUCTING AN EVALUATION
REPORT
ABOUT TIPS These TIPS provide practical advice and suggestions to USAID managers on issues related to performance monitoring and evaluation. This publication is a supplemental reference to the Automated Directive System (ADS) Chapter 203.
INTRODUCTION
This TIPS has three purposes. First, it provides guidance for evaluators on the structure, content, and style of evaluation reports. Second, it offers USAID officials, who commission evaluations, ideas on how to define the main deliverable. Third, it provides USAID officials with guidance on reviewing and approving evaluation reports.
The main theme is a simple one: how to make an evaluation report useful to its readers. Readers typically include a variety of development stakeholders and professionals; yet, the most important are the policymakers and managers who need credible information for program or project decision-making. Part of the primary purpose of an evaluation usually entails informing this audience.
To be useful, an evaluation report should address the evaluation questions and issues with accurate and data-driven findings, justifiable conclusions, and practical recommendations. It should reflect the use of sound evaluation methodology and data collection, and report the limitations of each. Finally, an evaluation should be written with a structure and style that promote learning and action.
Five common problems emerge in relation to evaluation reports. These problems are as follows:
• An unclear description of the program strategy and the specific results it is designed to achieve.
• Inadequate description of the evaluation’s purpose, intended uses, and the specific evaluation questions to be addressed.
• Imprecise analysis and reporting of quantitative and qualitative data collected during the evaluation.
• A lack of clear distinctions between findings and conclusions.
• Conclusions that are not grounded in the facts and recommendations that do not flow logically from conclusions.
This guidance offers tips that apply to an evaluation report for any type of evaluation — be it formative, summative (or impact), a rapid appraisal evaluation, or one using more rigorous methods.
A PROPOSED REPORT OUTLINE Table 1 presents a suggested outline and approximate page lengths for a typical evaluation report. The evaluation team can, of course, modify this outline as needed. As
Evaluation reports should be readily understood and should identify key points clearly, distinctly, and succinctly. (ADS 203.3.6.6)
NUMBER 17
1ST EDITION, 2010

2
indicated in the table, however, some elements are essential parts of any report.
This outline can also help USAID managers define the key deliverable in an Evaluation Statement of Work (SOW) (see TIPS 3: Preparing an Evaluation SOW).
We will focus particular attention on the section of the report that covers findings, conclusions, and recommendations. This section represents the core element of the evaluation report.
BEFORE THE WRITING BEGINS
Before the report writing begins, the evaluation team must complete two critical tasks: 1) establish clear and defensible findings, conclusions, and recommendations that clearly address the evaluation questions; and 2) decide how to organize the report in a way that conveys these elements most effectively.
FINDINGS, CONCLUSIONS, AND RECOMMENDATIONS
One of the most important tasks in constructing an evaluation report is to organize the report into three main elements: findings, conclusions, and recommendations (see Figure 1). This structure brings rigor to the evaluation and ensures that each element can ultimately be traced back to the basic facts. It is this structure that sets evaluation apart from other types of analysis.
Once the research stage of an evaluation is complete, the team has typically collected a great deal of data in order to answer the evaluation questions. Depending on
the methods used, these data can include observations, responses to survey questions, opinions and facts from key informants, secondary data from a ministry, and so on. The team’s first task is to turn these raw data into findings.
Suppose, for example, that USAID has charged an evaluation team with answering the following evaluation question (among others):
“How adequate are the prenatal services provided by the Ministry of Health’s rural clinics in Northeastern District?”
To answer this question, their research in the district included site visits to a random sample of rural clinics, discussions with knowledgeable health professionals, and a survey of women who have used clinic prenatal services during the past year. The team analyzed the raw, qualitative data and identified the following findings:
• Of the 20 randomly-sampled rural clinics visited, four clinics met all six established standards of care,
while the other 16 (80 percent) failed to meet at least two standards. The most commonly unmet standard (13 clinics) was “maintenance of minimum staff-patient ratios.”
• In 14 of the 16 clinics failing to meet two or more standards, not one of the directors was able to state the minimum staff-patient ratios for nurse practitioners, nurses, and prenatal educators.
TYPICAL PROBLEMS WITH FINDINGS
Findings that:
1. Are not organized to address the evaluation questions — the reader must figure out where they fit.
2. Lack precision and/or context —the reader cannot interpret their relative strength.
Incorrect: “Some respondents said ’x,’ a few said ’y,’ and others said ’z.’”
Correct: “Twelve of the 20 respondents (60 percent) said ’x,’ five (25 percent) said ’y,’ and three (15 percent) said ’z.’ ”
3. Mix findings and conclusions.
Incorrect: “The fact that 82 percent of the target group was aware of the media campaign indicates its effectiveness.”
Correct: Finding: “Eighty-two percent of the target group was aware of the media campaign.” Conclusion: “The media campaign was effective.”
FIGURE 1. ORGANIZING KEY ELEMENTS
OF THE EVALUATION REPORT
Recommendations
Proposed actions for management
Conclusions
Interpretations and judgments based on the findings
Findings
Empirical facts collected during the evaluation
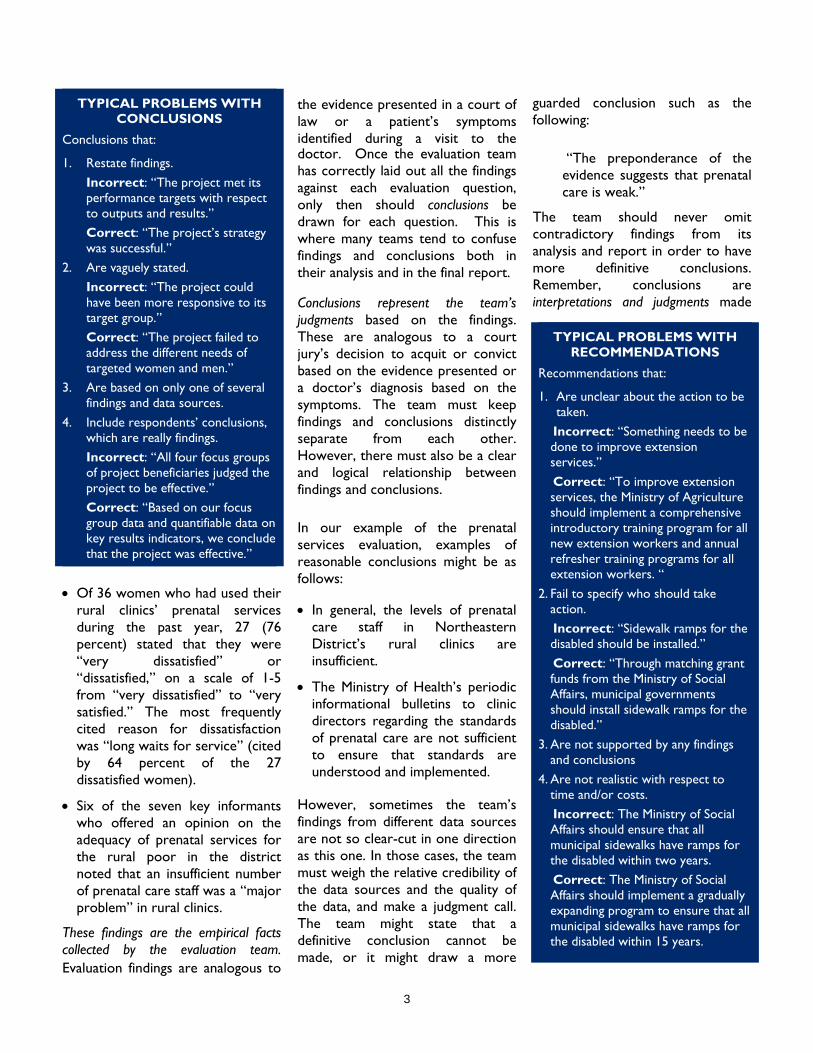
3
• Of 36 women who had used their rural clinics’ prenatal services during the past year, 27 (76 percent) stated that they were “very dissatisfied” or “dissatisfied,” on a scale of 1-5 from “very dissatisfied” to “very satisfied.” The most frequently cited reason for dissatisfaction was “long waits for service” (cited by 64 percent of the 27 dissatisfied women).
• Six of the seven key informants who offered an opinion on the adequacy of prenatal services for the rural poor in the district noted that an insufficient number of prenatal care staff was a “major problem” in rural clinics.
These findings are the empirical facts collected by the evaluation team. Evaluation findings are analogous to
the evidence presented in a court of law or a patient’s symptoms identified during a visit to the doctor. Once the evaluation team has correctly laid out all the findings against each evaluation question, only then should conclusions be drawn for each question. This is where many teams tend to confuse findings and conclusions both in their analysis and in the final report.
Conclusions represent the team’s judgments based on the findings. These are analogous to a court jury’s decision to acquit or convict based on the evidence presented or a doctor’s diagnosis based on the symptoms. The team must keep findings and conclusions distinctly separate from each other. However, there must also be a clear and logical relationship between findings and conclusions.
In our example of the prenatal services evaluation, examples of reasonable conclusions might be as follows:
• In general, the levels of prenatal care staff in Northeastern District’s rural clinics are insufficient.
• The Ministry of Health’s periodic informational bulletins to clinic directors regarding the standards of prenatal care are not sufficient to ensure that standards are understood and implemented.
However, sometimes the team’s findings from different data sources are not so clear-cut in one direction as this one. In those cases, the team must weigh the relative credibility of the data sources and the quality of the data, and make a judgment call. The team might state that a definitive conclusion cannot be made, or it might draw a more
guarded conclusion such as the following:
“The preponderance of the evidence suggests that prenatal care is weak.”
The team should never omit contradictory findings from its analysis and report in order to have more definitive conclusions. Remember, conclusions are interpretations and judgments made
TYPICAL PROBLEMS WITH CONCLUSIONS
Conclusions that:
1. Restate findings. Incorrect: “The project met its performance targets with respect to outputs and results.” Correct: “The project’s strategy was successful.”
2. Are vaguely stated. Incorrect: “The project could have been more responsive to its target group.” Correct: “The project failed to address the different needs of targeted women and men.”
3. Are based on only one of several findings and data sources.
4. Include respondents’ conclusions, which are really findings. Incorrect: “All four focus groups of project beneficiaries judged the project to be effective.” Correct: “Based on our focus group data and quantifiable data on key results indicators, we conclude that the project was effective.”
TYPICAL PROBLEMS WITH RECOMMENDATIONS
Recommendations that:
1. Are unclear about the action to be taken.
Incorrect: “Something needs to be done to improve extension services.”
Correct: “To improve extension services, the Ministry of Agriculture should implement a comprehensive introductory training program for all new extension workers and annual refresher training programs for all extension workers. “
2. Fail to specify who should take action.
Incorrect: “Sidewalk ramps for the disabled should be installed.”
Correct: “Through matching grant funds from the Ministry of Social Affairs, municipal governments should install sidewalk ramps for the disabled.”
3. Are not supported by any findings and conclusions
4. Are not realistic with respect to time and/or costs.
Incorrect: The Ministry of Social Affairs should ensure that all municipal sidewalks have ramps for the disabled within two years.
Correct: The Ministry of Social Affairs should implement a gradually expanding program to ensure that all municipal sidewalks have ramps for the disabled within 15 years.

4
on the basis of the findings.
Sometimes we see reports that include conclusions derived from preconceived notions or opinions developed through experience gained outside the evaluation, especially by members of the team who have substantive expertise on a particular topic. We do not recommend this, because it can distort the evaluation. That is, the role of the evaluator is to present the findings, conclusions, and recommendations in a logical order. Opinions outside this framework are then, by definition, not substantiated by the facts at hand. If any of these opinions are directly relevant to the evaluation questions and come from conclusions drawn from prior research or secondary sources, then the data upon which they are based should be presented among the evaluation’s findings.
Once conclusions are complete, the team is ready to make its recommendations. Too often recommendations do not flow from the team’s conclusions or, worse, they are not related to the original evaluation purpose and evaluation questions. They may be good ideas, but they do not belong in this section of the report. As an alternative, they could be included in an annex with a note that they are derived from coincidental observations made by the team or from team members’ experiences elsewhere.
Using our example related to rural health clinics, a few possible recommendations could emerge as follows:
• The Ministry of Health’s Northeastern District office should develop and implement an annual prenatal standards-of-care training program for all its rural clinic directors. The program would cover….
• The Northeaster District office should conduct a formal assessment of prenatal care staffing levels in all its rural clinics.
• Based on the assessment, the
Northeastern District office should establish and implement a five-year plan for hiring and placing needed prenatal care staff in its rural clinics on a most-needy-first basis.
Although the basic recommendations should be derived from conclusions and findings, this is where the team can include ideas and options for implementing recommendations that may be based on their substantive expertise and best practices drawn from experience outside the evaluation itself. Usefulness is paramount.
When developing recommendations, consider practicality. Circumstances or resources may limit the extent to which a recommendation can be implemented. If practicality is an issue — as is often the case — the evaluation team may need to ramp down recommendations, present them in terms of incremental steps, or suggest other options. In order to be useful, it is essential that recommendations be actionable or, in other words, feasible in light of the human, technical, and financial resources available.
Weak connections between findings, conclusions, and recommendations
FIGURE 2
Tracking the linkages is one way to help ensure a credible report, with information that will be useful.
Evaluation Question #1:
FINDINGS CONCLUSIONS RECOMMENDATIONS
XXXXXX
XXXXXX
XXXXXX
YYYYYY
YYYYYY
ZZZZZZ
ZZZZZZ
ZZZZZZ
FIGURE 3
OPTIONS FOR REPORTING FINDINGS, CONCLUSIONS, AND RECOMMENDATIONS
OPTION 1
FINDINGS Evaluation Question 1 Evaluation Question 2
CONCLUSIONS Evaluation Question 1 Evaluation Question 2
RECOMMENDATIONS Evaluation Question 1 Evaluation Question 2
OPTION 2
EVALUATION QUESTION 1 Findings Conclusions Recommendations
EVALUATION QUESTION 2 Findings Conclusions Recommendations
OPTION 3 Mix the two approaches. Identify which evaluation questions are distinct and which are interrelated. For distinct questions, use option 1 and for the latter, use option 2.

5
can undermine the user’s confidence in evaluation results. As a result, we encourage teams—or, better yet, a colleague who has not been involved—to review the logic before beginning to write the report. For each evaluation question, present all the findings, conclusions, and recommendations in a format similar to the one outlined in Figure 2.
Starting with the conclusions in the center, track each one back to the findings that support it, and decide whether the findings truly warrant the conclusion being made. If not, revise the conclusion as needed. Then track each recommendation to the conclusion(s) from which it flows, and revise if necessary.
CHOOSE THE BEST APPROACH FOR STRUCTURING THE REPORT
Depending on the nature of the evaluation questions and the findings, conclusions, and recommendations, the team has a few options for structuring this part of the report (see Figure 3). The objective is to present the report in a way that makes it as easy as possible for the reader to digest all of the information. Options are discussed below.
Option 1- Distinct Questions
If all the evaluation questions are distinct from one another and the relevant findings, conclusions, and recommendations do not cut across questions, then one option is to organize the report around each evaluation question. That is, each question will include a section including its relevant findings, conclusions, and recommendations.
Option 2- Interrelated Questions
If, however, the questions are closely interrelated and there are findings, conclusions, and/or recommendations that apply to more than one question, then it may be preferable to put all the findings for all the evaluation questions in one section, all the conclusions in another, and all the recommendations in a third.
Option 3- Mixed
If the situation is mixed—where a few but not all the questions are closely interrelated—then use a mixed approach. Group the interrelated questions and their findings, conclusions, and recommendations into one sub-section, and treat the stand-alone questions and their respective findings, conclusions, and recommendations in separate sub-sections.
The important point is that the team should be sure to keep findings, conclusions, and recommendations separate and distinctly labeled as such.
Finally, some evaluators think it more useful to present the conclusions first, and then follow with the findings supporting them. This helps the reader see the “bottom line” first and then make a judgment as to whether the conclusions are warranted by the findings.
OTHER KEY SECTIONS OF THE REPORT
THE EXECUTIVE SUMMARY
The Executive Summary should stand alone as an abbreviated version of the entire report. Often it is the only thing that busy managers read. The Executive Summary should be a “mirror image” of the full report—it should contain no new information that is not in the main report. This principle also applies to making the Executive Summary and the full report equivalent with respect to presenting positive and negative evaluation results.
Although all sections of the full report are summarized in the Executive Summary, less emphasis is given to an overview of the project and the description of the evaluation purpose and methodology than is given to the findings, conclusions, and recommendations. Decision-makers are generally more interested in the latter.
The Executive Summary should be written after the main report has been drafted. Many people believe that a good Executive Summary should not exceed two pages, but there is no formal rule in USAID on this. Finally, an Executive Summary should be written in a way that will entice interested stakeholders to go on to read the full report.
DESCRIPTION OF THE PROJECT
Many evaluation reports give only cursory attention to the development problem (or opportunity) that motivated the project in the first place, or to the
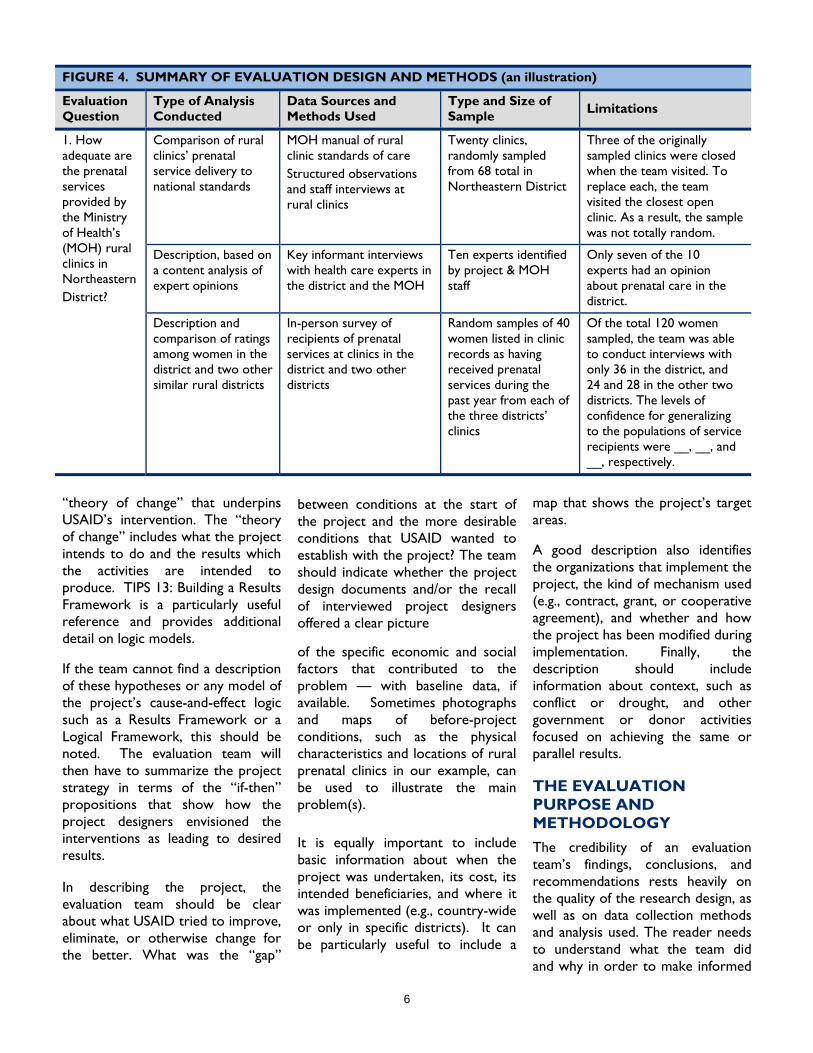
6
“theory of change” that underpins USAID’s intervention. The “theory of change” includes what the project intends to do and the results which the activities are intended to produce. TIPS 13: Building a Results Framework is a particularly useful reference and provides additional detail on logic models.
If the team cannot find a description of these hypotheses or any model of the project’s cause-and-effect logic such as a Results Framework or a Logical Framework, this should be noted. The evaluation team will then have to summarize the project strategy in terms of the “if-then” propositions that show how the project designers envisioned the interventions as leading to desired results.
In describing the project, the evaluation team should be clear about what USAID tried to improve, eliminate, or otherwise change for the better. What was the “gap”
between conditions at the start of the project and the more desirable conditions that USAID wanted to establish with the project? The team should indicate whether the project design documents and/or the recall of interviewed project designers offered a clear picture
of the specific economic and social factors that contributed to the problem — with baseline data, if available. Sometimes photographs and maps of before-project conditions, such as the physical characteristics and locations of rural prenatal clinics in our example, can be used to illustrate the main problem(s).
It is equally important to include basic information about when the project was undertaken, its cost, its intended beneficiaries, and where it was implemented (e.g., country-wide or only in specific districts). It can be particularly useful to include a
map that shows the project’s target areas.
A good description also identifies the organizations that implement the project, the kind of mechanism used (e.g., contract, grant, or cooperative agreement), and whether and how the project has been modified during implementation. Finally, the description should include information about context, such as conflict or drought, and other government or donor activities focused on achieving the same or parallel results.
THE EVALUATION PURPOSE AND METHODOLOGY
The credibility of an evaluation team’s findings, conclusions, and recommendations rests heavily on the quality of the research design, as well as on data collection methods and analysis used. The reader needs to understand what the team did and why in order to make informed
FIGURE 4. SUMMARY OF EVALUATION DESIGN AND METHODS (an illustration)
Evaluation Question
Type of Analysis Conducted
Data Sources and Methods Used
Type and Size of Sample Limitations
1. How adequate are the prenatal services provided by the Ministry of Health’s (MOH) rural clinics in Northeastern District?
Comparison of rural clinics’ prenatal service delivery to national standards
MOH manual of rural clinic standards of care Structured observations and staff interviews at rural clinics
Twenty clinics, randomly sampled from 68 total in Northeastern District
Three of the originally sampled clinics were closed when the team visited. To replace each, the team visited the closest open clinic. As a result, the sample was not totally random.
Description, based on a content analysis of expert opinions
Key informant interviews with health care experts in the district and the MOH
Ten experts identified by project & MOH staff
Only seven of the 10 experts had an opinion about prenatal care in the district.
Description and comparison of ratings among women in the district and two other similar rural districts
In-person survey of recipients of prenatal services at clinics in the district and two other districts
Random samples of 40 women listed in clinic records as having received prenatal services during the past year from each of the three districts’ clinics
Of the total 120 women sampled, the team was able to conduct interviews with only 36 in the district, and 24 and 28 in the other two districts. The levels of confidence for generalizing to the populations of service recipients were __, __, and __, respectively.

7
judgments about credibility. Presentation of the evaluation design and methods is often best done through a short
summary in the text of the report and a more detailed methods annex that includes the evaluation instruments. Figure 4 provides a sample summary of the design and methodology that can be included in the body of the evaluation report.
From a broad point of view, what research design did the team use to answer each evaluation question? Did the team use description (e.g., to document what happened), comparisons (e.g., of baseline data or targets to actual data, of actual practice to standards, among target sub-populations or locations), or cause-effect research (e.g., to determine whether the project made a difference)? To do cause-effect analysis, for example, did the team use one or more quasi-experimental approaches, such as time-series analysis or use of non-project comparison groups (see TIPS 11: The Role of Evaluation)?
More specifically, what data collection methods did the team use to get the evidence needed for each evaluation question? Did the team use key informant interviews, focus groups, surveys, on-site observation methods, analyses of secondary data, and other methods? How many people did they interview or survey, how many sites did they visit, and how did they select their samples?
Most evaluations suffer from one or more constraints that affect the comprehensiveness and validity of findings and conclusions. These may include overall limitations on time and resources, unanticipated problems in reaching all the key informants and survey respondents, unexpected problems with the quality of secondary data from the host-country government, and the like. In the methodology section, the team should address these limitations and their implications for answering the evaluation questions
and developing the findings and conclusions that follow in the report. The reader needs to know these limitations in order to make informed judgments about the evaluation’s credibility and usefulness.
READER-FRIENDLY STYLE When writing its report, the evaluation team must always remember the composition of its audience. The team is writing for policymakers, managers, and takeholders, not for fellow social science researchers or for publication in a professional journal. To that end, the style of writing should make it as easy as possible for the intended audience to understand and digest what the team is presenting. For further suggestions on writing an evaluation in reader-friendly style, see Table 2.

8
TABLE 1. SUGGESTED OUTLINE FOR AN EVALUATION REPORT1
Element Approximate Number of Pages
Description and Tips for the Evaluation Team
Title Page 1 (but no page number)
Essential. Should include the words “U.S. Agency for International Development” with the acronym “USAID,” the USAID logo, and the project/contract number under which the evaluation was conducted. See USAID Branding and Marking Guidelines (http://www.usaid.gov/branding/) for logo and other specifics. Give the title of the evaluation; the name of the USAID office receiving the evaluation; the name(s), title(s), and organizational affiliation(s) of the author(s); and the date of the report.
Contents As needed, and start with Roman numeral ii.
Essential. Should list all the sections that follow, including Annexes. For multi-page chapters, include chapter headings and first- and second-level headings. List (with page numbers) all figures, tables, boxes, and other titled graphics.
Foreword 1 Optional. An introductory note written by someone other than the author(s), if needed. For example, it might mention that this evaluation is one in a series of evaluations or special studies being sponsored by USAID.
Acknowledgements 1 Optional. The authors thank the various people who provided support during the evaluation.
Preface 1 Optional. Introductory or incidental notes by the authors, but not material essential to understanding the text. Acknowledgements could be included here if desired.
Executive Summary 2-3; 5 at most Essential, unless the report is so brief that a summary is not needed. (See discussion on p. 5)
Glossary 1 Optional. Is useful if the report uses technical or project-specific terminology that would be unfamiliar to some readers.
Acronyms and Abbreviations
1 Essential, if they are used in the report. Include only those acronyms that are actually used. See Table 3 for more advice on using acronyms.
I. Introduction 5-10 pages, starting with Arabic numeral 1.
Optional. The two sections listed under Introduction here could be separate, stand-alone chapters. If so, a separate Introduction may not be needed.
Description of the Project
Essential. Describe the context in which the USAID project took place—e.g., relevant history, demography, political situation, etc. Describe the specific development problem that prompted USAID to implement the project, the theory underlying the project, and details of project implementation to date. (See more tips on p. 6.)
The Evaluation Purpose and Methodology
Essential. Describe who commissioned the evaluation, why they commissioned it, what information they want, and how they intend to use the information (and refer to the Annex that includes the Statement of Work). Provide the specific evaluation questions, and briefly describe the evaluation design and the analytical and data collection methods used to answer them. Describe the evaluation team (i.e., names, qualifications, and roles), what the team did (e.g., reviewed relevant documents, analyzed secondary data, interviewed key informants, conducted a survey, conducted site visits), and when and where they did it. Describe the major limitations encountered in data collection and analysis that have implications for reviewing the results of the evaluation. Finally, refer to the Annex that provides a fuller description of all of the above, including a list of documents/data sets reviewed, a list of individuals interviewed, copies of the data collection instruments used, and descriptions of sampling procedures (if any) and data analysis procedures. (See more tips on p. 6.)
II. Findings, Conclusions, and Recommendations
20-30 pages Essential. However, in some cases, the evaluation user does not want recommendations, only findings and conclusions. This material may be

9
TABLE 1. SUGGESTED OUTLINE FOR AN EVALUATION REPORT1
Element Approximate Number of Pages
Description and Tips for the Evaluation Team
organized in different ways and divided into several chapters. (A detailed discussion of developing defensible findings, conclusions, and recommendations and structural options for reporting them is on p 2 and p. 5)
III. Summary of Recommendations
1-2 pages Essential or optional, depending on how findings, conclusions and recommendations are presented in the section above. (See a discussion of options on p. 4.) If all the recommendations related to all the evaluation questions are grouped in one section of the report, this summary is not needed. However, if findings, conclusions, and recommendations are reported together in separate sections for each evaluation question, then a summary of all recommendations, organized under each of the evaluation questions, is essential.
IV. Lessons Learned As needed Required if the SOW calls for it; otherwise optional. Lessons learned and/or best practices gleaned from the evaluation provide other users, both within USAID and outside, with ideas for the design and implementation of related or similar projects in the future.
Annexes
Statement of Work Some are essential and some are optional as noted.
Essential. Lets the reader see exactly what USAID initially expected in the evaluation.
Evaluation Design and Methodology
Essential. Provides a more complete description of the evaluation questions, design, and methods used. Also includes copies of data collection instruments (e.g., interview guides, survey instruments, etc.) and describes the sampling and analysis procedures that were used.
List of Persons Interviewed
Essential. However, specific names of individuals might be withheld in order to protect their safety.
List of Documents Reviewed
Essential. Includes written and electronic documents reviewed, background literature, secondary data sources, citations of websites consulted.
Dissenting Views If needed. Include if a team member or a major stakeholder does not agree with one or more findings, conclusions, or recommendations.
Recommendation Action Checklist
Optional. As a service to the user organization, this chart can help with follow-up to the evaluation. It includes a list of all recommendations organized by evaluation question, a column for decisions to accept or reject each recommendation, a column for the decision maker’s initials, a column for the reason a recommendation is being rejected, and, for each accepted recommendation, columns for the actions to be taken, by when, and by whom.
1The guidance and suggestions in this table were drawn from the writers’ experience and from the “CDIE Publications Style Guide: Guidelines for Project Managers, Authors, & Editors,” compiled by Brian Furness and John Engels, December 2001. The guide, which includes many tips on writing style, editing, referencing citations, and using Word and Excel is available online at http://kambing.ui.ac.id/bebas/v01/DEC-USAID/Other/publications-style-guide.pdf. Other useful guidance: ADS 320 (http://www.usaid.gov/policy/ads/300/320.pdf ; http://www.usaid.gov/branding; and http://www.usaid.gov/branding/Graphic Standards Manual.pdf.

10
TABLE 2. THE QUICK REFERENCE GUIDE FOR A READER-FRIENDLY TECHNICAL STYLE
Writing Style—Keep It Simple and Correct!
Avoid meaningless precision. Decide how much precision is really necessary. Instead of “62.45 percent,” might “62.5 percent” or “62 percent” be sufficient? The same goes for averages and other calculations. Use technical terms and jargon only when necessary. Make sure to define them for the unfamiliar readers. Don’t overuse footnotes. Use them only to provide additional information which, if included in the text, would be distracting and cause a loss of the train of thought.
Use Tables, Charts and Other Graphics to Enhance Understanding
Avoid long, “data-dump”paragraphs filled with numbers and percentages. Use tables, line graphs, bar charts, pie charts, and other visual displays of data, and summarize the main points in the text. In addition to increasing understanding, these displays provide visual relief from long narrative tracts. Be creative—but not too creative. Choose and design tables and charts carefully with the reader in mind. Make every visual display of data a self-contained item. It should have a meaningful title and headings for every column; a graph should have labels on each axis; a pie or bar chart should have labels for every element. Choose shades and colors carefully. Expect that consumers will reproduce the report in black and white and make copies of copies. Make sure that the reader can distinguish clearly among colors or shades among multiple bars and pie-chart segments. Consider using textured fillings (such as hatch marks or dots) rather than colors or shades. Provide “n’s” in all displays which involve data drawn from samples or populations. For example, the total number of cases or survey respondents should be under the title of a table (n = 100). If a table column includes types of responses from some, but not all, survey respondents to a specific question, say, 92 respondents, the column head should include the total number who responded to the question (n = 92). Refer to every visual display of data in the text. Present it after mentioning it in the text and as soon after as practical, without interrupting paragraphs. Number tables and figures separately, and number each consecutively in the body of the report. Consult the CDIE style guide for more detailed recommendations on tables and graphics.
Punctuate the Text with Other Interesting Features
Put representative quotations gleaned during data collection in text boxes. Maintain balance between negative and positive comments to reflect the content of the report. Identify the sources of all quotes. If confidentiality must be maintained, identify sources in general terms, such as “a clinic care giver” or “a key informant.” Provide little “stories” or cases that illustrate findings. For example, a brief anecdotal story in a text box about how a woman used a clinic’s services to ensure a healthy pregnancy can enliven, and humanize, the quantitative findings. Use photos and maps where appropriate. For example, a map of a district with all the rural clinics providing prenatal care and the concentrations of rural residents can effectively demonstrate adequate or inadequate access to care. Don’t overdo it. Strike a reader-friendly balance between the main content and illustrative material. In using illustrative material, select content that supports main points, not distracts from them.
Finally… Remember that the reader’s need to understand, not the writer’s need to impress, is paramount. Be consistent with the chosen format and style throughout the report.
Sources: “CDIE Publications Style Guide: Guidelines for Project Managers, Authors, & Editors,” compiled by Brian Furness and John Engels, December 2001 (http://kambing.ui.ac.id/bebas/v01/DEC-USAID/Other/publications-style-guide.pdf); USAID’s Graphics Standards Manual (http://www.usaid.gov/branding/USAID_Graphic_Standards_Manual.pdf); and the authors extensive experience with good and difficult-to-read evaluation reports.

11
For more information:
TIPS publications are available online at [insert website].
Acknowledgements:
Our thanks to those whose experience and insights helped shape this publication including Gerry Britan and Subhi Mehdi of USAID’s Office of Management Policy, Budget and Performance (MPBP). This publication was written by Larry Beyna of Management Systems International (MSI).
Comments regarding this publication can be directed to:
Gerald Britan, Ph.D. Tel: (202) 712-1158 [email protected]
Contracted under RAN-M-00-04-00049-A-FY0S-84
Integrated Managing for Results II
1
PERFORMANCE MONITORING & EVALUATION
TIPS CONDUCTING DATA QUALITY ASSESSMENTS
ABOUT TIPS These TIPS provide practical advice and suggestions to USAID managers on issues related to performance monitoring and evaluation. This publication is a supplemental reference to the Automated Directive System (ADS) Chapter 203.
THE PURPOSE OF THE DATA QUALITY ASSESSMENT
Data quality assessments (DQAs) help managers to understand how confident they should be in the data used to manage a program and report on its success. USAID’s ADS notes that the purpose of the Data Quality Assessment is to:
“…ensure that the USAID Mission/Office and Assistance Objective (AO) Team are aware of the strengths and weaknesses of the data, as determined by applying the five data quality standards …and are aware of the extent to which the data integrity can be trusted to influence management decisions.” (ADS 203.3.5.2)
This purpose is important to keep in mind when considering how to do a data quality assessment. A data quality assessment is of little use unless front line managers comprehend key data quality issues and are able to improve the performance management system.
THE DATA QUALITY STANDARDS
Five key data quality standards are used to assess quality. These are:
• Validity
• Reliability
• Precision
• Integrity
• Timeliness
A more detailed discussion of each standard is included in TIPS 12: Data Quality Standards.
WHAT IS REQUIRED?
USAID POLICY
While managers are required to understand data quality on an ongoing basis, a data quality assessment must also be conducted at least once every three years for those data reported to Washington. As a matter of good management, program managers may decide to conduct DQAs more frequently or for a broader range of data where potential issues emerge.
The ADS does not prescribe a specific way to conduct a DQA. A variety of approaches can be used. Documentation may be as simple
NUMBER 18
1ST EDITION, 2010

2
as a memo to the files, or it could take the form of a formal report. The most appropriate approach will reflect a number of considerations, such as management need, the type of data collected, the data source, the importance of the data, or suspected data quality issues. The key is to document the findings, whether formal or informal.
A DQA focuses on applying the data quality standards and examining the systems and approaches for collecting data to determine whether they are likely to produce high quality data over time. In other words, if the data quality standards are met and the data collection methodology is well designed, then it is likely that good quality data will result.
This “systematic approach” is valuable because it assesses a broader set of issues that are likely to ensure data quality over time (as opposed to whether one specific number is accurate or not). For example, it is possible to report a number correctly, but that number may not be valid1 as the following example demonstrates.
Example: A program works across a range of municipalities (both urban and rural). It is reported that local governments have increased revenues by 5%. These data may be correct. However, if only major urban areas have been included, these data are not valid. That is, they do not measure the intended result.
1 Refer to TIPS 12: Data Quality Standards for a full discussion of all the data quality standards.
VERIFICATION OF DATA
Verification of data means that the reviewer follows a specific datum to its source, confirming that it has supporting documentation and is accurate—as is often done in audits. The DQA may not necessarily verify that all individual numbers reported are accurate.
The ADS notes that when assessing data from partners, the DQA should focus on “the apparent accuracy and consistency of the data.” As an example, Missions often report data on the number of individuals trained. Rather than verifying each number reported, the DQA might examine each project’s system for collecting and maintaining those data. If there is a good system in place, we know that it is highly likely that the data produced will be of high quality.
“…data used for management purposes have different standards
than data used for research.
Having said this, it is certainly advisable to periodically verify actual data as part of the larger performance management system. Project managers may:
Choose a few indicators to verify periodically throughout the course of the year.
Occasionally spot check data (for example, when visiting the field).
HOW GOOD DO DATA HAVE TO BE?
In development, there are rarely perfect data. Moreover, data used for management purposes have different standards than data used
for research. There is often a direct trade-off between cost and quality. Each manager is responsible for ensuring the highest quality data possible given the resources and the management context. In some cases, simpler, lower-cost approaches may be most appropriate. In other cases, where indicators measure progress in major areas of investment, higher data quality is expected.
OPTIONS AND APPROACHES FOR CONDUCTING DQAS
A data quality assessment is both a process for reviewing data to understand strengths and weaknesses as well as documentation. A DQA can be done in a variety of ways ranging from the more informal to the formal (see Figure 1). In our experience, a combination of informal, on-going and systematic assessments work best, in most cases, to ensure good data quality.
INFORMAL OPTIONS
Informal approaches can be on- going or driven by specific issues as they emerge. These approaches depend more on the front line manager’s in-depth knowledge of the program. Findings are documented by the manager in memos or notes in the Performance Management Plan (PMP).
Example: An implementer reports that civil society organizations (CSOs) have initiated 50 advocacy campaigns. This number seems unusually high. The project manager calls the Implementer to understand why the number is so high in
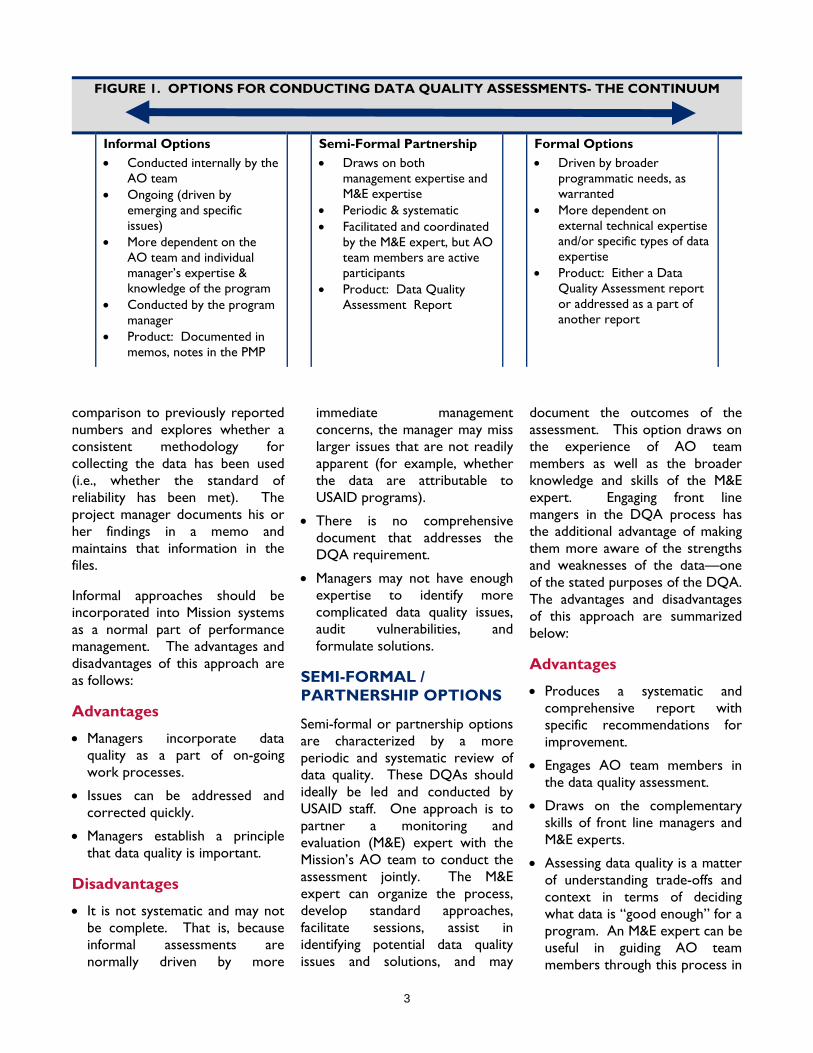
3
FIGURE 1. OPTIONS FOR CONDUCTING DATA QUALITY ASSESSMENTS- THE CONTINUUM
Informal Options • Conducted internally by the
AO team • Ongoing (driven by
emerging and specific issues)
• More dependent on the AO team and individual manager’s expertise & knowledge of the program
• Conducted by the program manager
• Product: Documented in memos, notes in the PMP
Semi-Formal Partnership • Draws on both
management expertise and M&E expertise
• Periodic & systematic • Facilitated and coordinated
by the M&E expert, but AO team members are active participants
• Product: Data Quality Assessment Report
Formal Options • Driven by broader
programmatic needs, as warranted
• More dependent on external technical expertise and/or specific types of data expertise
• Product: Either a Data Quality Assessment report or addressed as a part of another report
comparison to previously reported numbers and explores whether a consistent methodology for collecting the data has been used (i.e., whether the standard of reliability has been met). The project manager documents his or her findings in a memo and maintains that information in the files.
Informal approaches should be incorporated into Mission systems as a normal part of performance management. The advantages and disadvantages of this approach are as follows:
Advantages
• Managers incorporate data quality as a part of on-going work processes.
• Issues can be addressed and corrected quickly.
• Managers establish a principle that data quality is important.
Disadvantages
• It is not systematic and may not be complete. That is, because informal assessments are normally driven by more
immediate management concerns, the manager may miss larger issues that are not readily apparent (for example, whether the data are attributable to USAID programs).
• There is no comprehensive document that addresses the DQA requirement.
• Managers may not have enough expertise to identify more complicated data quality issues, audit vulnerabilities, and formulate solutions.
SEMI-FORMAL / PARTNERSHIP OPTIONS
Semi-formal or partnership options are characterized by a more periodic and systematic review of data quality. These DQAs should ideally be led and conducted by USAID staff. One approach is to partner a monitoring and evaluation (M&E) expert with the Mission’s AO team to conduct the assessment jointly. The M&E expert can organize the process, develop standard approaches, facilitate sessions, assist in identifying potential data quality issues and solutions, and may
document the outcomes of the assessment. This option draws on the experience of AO team members as well as the broader knowledge and skills of the M&E expert. Engaging front line mangers in the DQA process has the additional advantage of making them more aware of the strengths and weaknesses of the data—one of the stated purposes of the DQA. The advantages and disadvantages of this approach are summarized below:
Advantages
• Produces a systematic and comprehensive report with specific recommendations for improvement.
• Engages AO team members in the data quality assessment.
• Draws on the complementary skills of front line managers and M&E experts.
• Assessing data quality is a matter of understanding trade-offs and context in terms of deciding what data is “good enough” for a program. An M&E expert can be useful in guiding AO team members through this process in
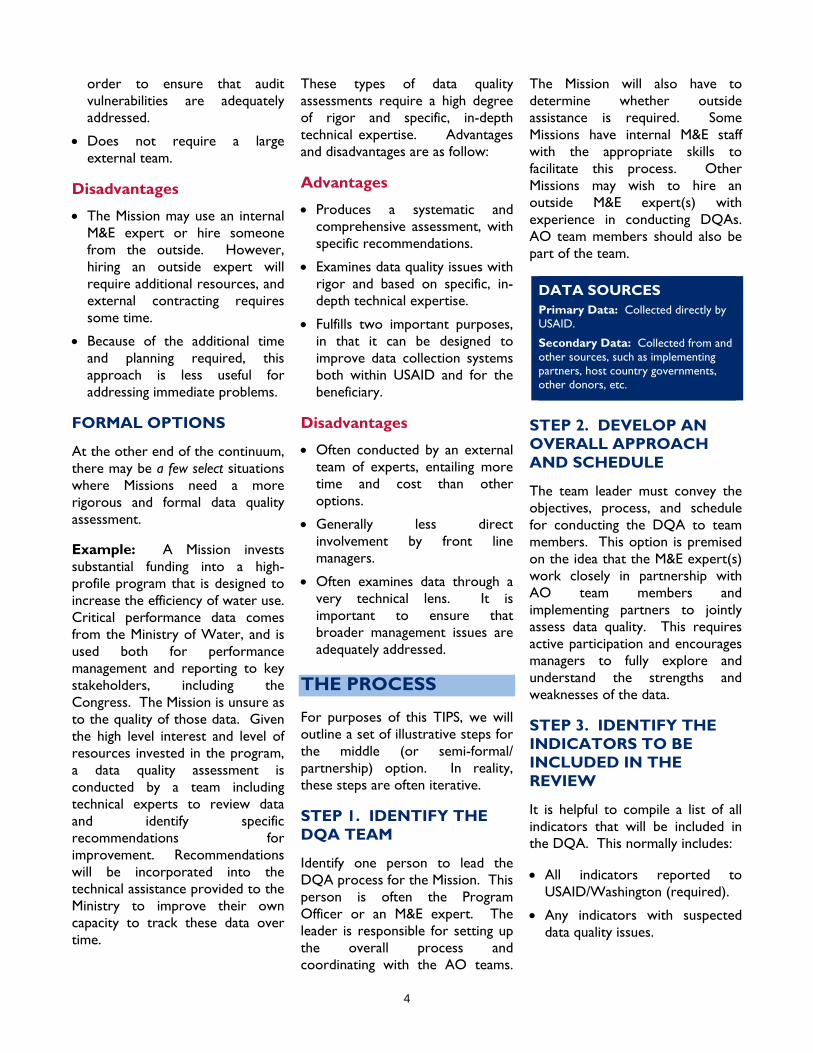
4
order to ensure that audit vulnerabilities are adequately addressed.
• Does not require a large external team.
Disadvantages
• The Mission may use an internal M&E expert or hire someone from the outside. However, hiring an outside expert will require additional resources, and external contracting requires some time.
• Because of the additional time and planning required, this approach is less useful for addressing immediate problems.
FORMAL OPTIONS
At the other end of the continuum, there may be a few select situations where Missions need a more rigorous and formal data quality assessment.
Example: A Mission invests substantial funding into a high-profile program that is designed to increase the efficiency of water use. Critical performance data comes from the Ministry of Water, and is used both for performance management and reporting to key stakeholders, including the Congress. The Mission is unsure as to the quality of those data. Given the high level interest and level of resources invested in the program, a data quality assessment is conducted by a team including technical experts to review data and identify specific recommendations for improvement. Recommendations will be incorporated into the technical assistance provided to the Ministry to improve their own capacity to track these data over time.
These types of data quality assessments require a high degree of rigor and specific, in-depth technical expertise. Advantages and disadvantages are as follow:
Advantages
• Produces a systematic and comprehensive assessment, with specific recommendations.
• Examines data quality issues with rigor and based on specific, in- depth technical expertise.
• Fulfills two important purposes, in that it can be designed to improve data collection systems both within USAID and for the beneficiary.
Disadvantages
• Often conducted by an external team of experts, entailing more time and cost than other options.
• Generally less direct involvement by front line managers.
• Often examines data through a very technical lens. It is important to ensure that broader management issues are adequately addressed.
THE PROCESS
For purposes of this TIPS, we will outline a set of illustrative steps for the middle (or semi-formal/ partnership) option. In reality, these steps are often iterative.
STEP 1. IDENTIFY THE DQA TEAM
Identify one person to lead the DQA process for the Mission. This person is often the Program Officer or an M&E expert. The leader is responsible for setting up the overall process and coordinating with the AO teams.
The Mission will also have to determine whether outside assistance is required. Some Missions have internal M&E staff with the appropriate skills to facilitate this process. Other Missions may wish to hire an outside M&E expert(s) with experience in conducting DQAs. AO team members should also be part of the team.
DATA SOURCES Primary Data: Collected directly by USAID.
Secondary Data: Collected from and other sources, such as implementing partners, host country governments, other donors, etc.
STEP 2. DEVELOP AN OVERALL APPROACH AND SCHEDULE
The team leader must convey the objectives, process, and schedule for conducting the DQA to team members. This option is premised on the idea that the M&E expert(s) work closely in partnership with AO team members and implementing partners to jointly assess data quality. This requires active participation and encourages managers to fully explore and understand the strengths and weaknesses of the data.
STEP 3. IDENTIFY THE INDICATORS TO BE INCLUDED IN THE REVIEW
It is helpful to compile a list of all indicators that will be included in the DQA. This normally includes:
• All indicators reported to USAID/Washington (required).
• Any indicators with suspected data quality issues.

5
• Indicators for program areas that are of high importance.
This list can also function as a central guide as to how each indicator is assessed and to summarize where follow-on action is needed.
STEP 4. CATEGORIZE INDICATORS
With the introduction of standard indicators, the number of indicators that Missions report to USAID/Washington has increased substantially. This means that it is important to develop practical and streamlined approaches for conducting DQAs. One way to do this is to separate indicators into two categories, as follows:
Outcome Level Indicators
Outcome level indicators measure AOs or Intermediate Results (IRs). Figure 2 provides examples of indicators at each level. The standards for good data quality are applied to results level data in order to assess data quality. The data quality assessment worksheet (see Table 1) has been developed as a tool to assess each indicator against each of these standards.
Output Indicators
Many of the data quality standards are not applicable to output indicators in the same way as outcome level indicators. For example, the number of individuals trained by a project is an output indicator. Whether data are valid, timely, or precise is almost never an issue for this type of an indicator. However, it is important to ensure that there are good data collection and data maintenance systems in place. Hence, a simpler and more streamlined approach can be used to focus on the most relevant issues. Table 2 outlines a sample matrix for assessing output indicators. This matrix:
• Identifies the indicator.
• Clearly outlines the data collection method.
• Identifies key data quality issues.
• Notes whether further action is necessary.
• Provides specific information on who was consulted and when.
STEP 5. HOLD WORKING SESSIONS TO REVIEW INDICATORS
Hold working sessions with AO team members. Implementing partners may be included at this
point as well. In order to use time efficiently, the team may decide to focus these sessions on results-level indicators. These working sessions can be used to:
• Explain the purpose and process for conducting the DQA.
• Review data quality standards for each results-level indicator, including the data collection systems and processes.
• Identify issues or concerns that require further review.
STEP 6. HOLD SESSIONS WITH IMPLEMENTING PARTNERS TO REVIEW INDICATORS
If the implementing partner was included in the previous working session, results-level indicators will already have been discussed. This session may then focus on reviewing the remaining output-level indicators with implementers who often maintain the systems to collect the data for these types of indicators. Focus on reviewing the systems and processes to collect and maintain data. This session provides a good opportunity to identify solutions or recommend-dations for improvement.
STEP 7. PREPARE THE DQA DOCUMENT
As information is gathered, the team should record findings on the worksheets provided. It is particularly important to include recommendations for action at the conclusion of each worksheet. Once this is completed, it is often useful to include an introduction to:
• Outline the overall approach and methodology used.

6
• Highlight key data quality issues that are important for senior management.
• Summarize recommendations for improving performance management systems.
AO team members and participating implementers should have an opportunity to review the first draft. Any comments or issues can then be incorporated and the DQA finalized.
STEP 8. FOLLOW UP ON ACTIONS
Finally, it is important to ensure that there is a process to follow-up on recommendations. Some recommendations may be addressed internally by the team handling management needs or audit vulnerabilities. For example, the AO team may need to work with a Ministry to ensure that data can be disaggregated in a way that correlates precisely to the target group. Other issues may need to be addressed during the Mission’s portfolio reviews.
CONSIDER THE SOURCE – PRIMARY VS. SECONDARY DATA
PRIMARY DATA
USAID is able to exercise a higher degree of control over primary data that it collects itself than over secondary data collected by others. As a result, specific standards should be incorporated into the data collection process. Primary data collection requires that:
• Written procedures are in place for data collection.
• Data are collected from year to year using a consistent collection process.
• Data are collected using methods to address and minimize sampling and non-sampling errors.
• Data are collected by qualified personnel and these personnel are properly supervised.
• Duplicate data are detected.
• Safeguards are in place to prevent unauthorized changes to the data.
• Source documents are maintained and readily available.
• If the data collection process is contracted out, these requirements should be incorporated directly into the statement of work.
SECONDARY DATA
Secondary data are collected from other sources, such as host country governments, implementing partners, or from other organizations. The range of control that USAID has over secondary data varies. For example, if USAID uses data from a survey commissioned by another donor, then there is little control over the data collection methodology. On the other hand, USAID does have more influence over data derived from implementing partners. In some cases, specific data quality requirements may be included in the contract. In addition, project performance management plans
(PMPs) are often reviewed or approved by USAID. Some ways in which to address data quality are summarized below.
Data from Implementing Partners
• Spot check data.
• Incorporate specific data quality requirements as part of the SOW, RFP, or RFA.
• Review data quality collection and maintenance procedures.
Data from Other Secondary Sources
Data from other secondary sources includes data from host countries, government, and other donors.
• Understand the methodology. Documentation often includes a description of the methodology used to collect data. It is important to understand this section so that limitations (and what the data can and cannot say) are clearly understood by decision makers.
• Request a briefing on the methodology, including data collection and analysis procedures, potential limitations of the data, and plans for improvement (if possible).
• If data are derived from host country organizations, then it may be appropriate to discuss how assistance can be provided to strengthen the quality of the data. For example, projects may include technical assistance to improve management and/or M&E systems.
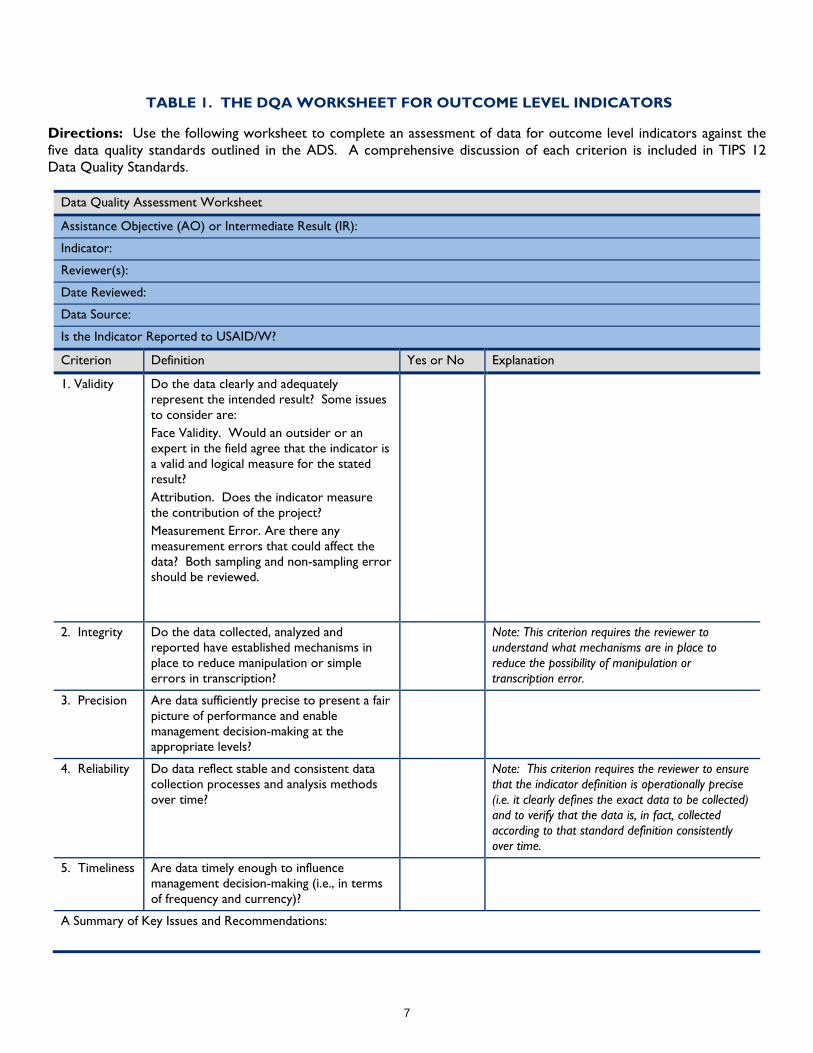
7
TABLE 1. THE DQA WORKSHEET FOR OUTCOME LEVEL INDICATORS
Directions: Use the following worksheet to complete an assessment of data for outcome level indicators against the five data quality standards outlined in the ADS. A comprehensive discussion of each criterion is included in TIPS 12 Data Quality Standards.
Data Quality Assessment Worksheet
Assistance Objective (AO) or Intermediate Result (IR):
Indicator:
Reviewer(s):
Date Reviewed:
Data Source:
Is the Indicator Reported to USAID/W?
Criterion Definition Yes or No Explanation
1. Validity Do the data clearly and adequately represent the intended result? Some issues to consider are: Face Validity. Would an outsider or an expert in the field agree that the indicator is a valid and logical measure for the stated result? Attribution. Does the indicator measure the contribution of the project? Measurement Error. Are there any measurement errors that could affect the data? Both sampling and non-sampling error should be reviewed.
2. Integrity Do the data collected, analyzed and reported have established mechanisms in place to reduce manipulation or simple errors in transcription?
Note: This criterion requires the reviewer to understand what mechanisms are in place to reduce the possibility of manipulation or transcription error.
3. Precision Are data sufficiently precise to present a fair picture of performance and enable management decision-making at the appropriate levels?
4. Reliability Do data reflect stable and consistent data collection processes and analysis methods over time?
Note: This criterion requires the reviewer to ensure that the indicator definition is operationally precise (i.e. it clearly defines the exact data to be collected) and to verify that the data is, in fact, collected according to that standard definition consistently over time.
5. Timeliness Are data timely enough to influence management decision-making (i.e., in terms of frequency and currency)?
A Summary of Key Issues and Recommendations:

8
Table 2. SAMPLE DQA FOR OUTPUT INDICATORS: THE MATRIX APPROACH
Document Source
Data Source
Data Collection Method/ Key Data Quality Issue Further Action
Additional Comments/ Notes
AO or IR
Indicators
1. Number of investment measures made consistent with international investment agreements as a result of USG assistance
Quarterly Report
Project A
A consultant works directly with the committee in charge of simplifying procedures and updates the number of measures regularly on the website (www.mdspdres.com). The implementer has stated that data submitted includes projections for the upcoming fiscal year rather than actual results.
Yes. Ensure that only actual results within specified timeframes are used for reporting.
Meeting with COTR 6/20/10 and 7/6/10.
2. Number of public and private sector standards-setting bodies that have adopted internationally accepted guidelines for standards setting as a result of USG assistance
Semi-Annual Report
Project A
No issues. Project works only with one body (the Industrial Standards-Setting Service) and maintains supporting documentation.
No. Meeting with COTR and COP on 6/20/10.
3. Number of legal, regulatory, or institutional actions taken to improve implementation or compliance with international trade and investment agreements due to support from USG-assisted organizations
Quarterly Report
Project A
Project has reported “number of Regional Investment Centers”. This is not the same as counting “actions”, so this must be corrected.
Yes. Ensure that the correct definition is applied.
Meeting with COTR, COP, and Finance Manager and M&E specialist on 6/20/10. The indicator was clarified and the data collection process will be adjusted accordingly.
4. Number of Trade and Investment Environment diagnostics conducted
Quarterly Report
Projects A and B
No issues. A study on the investment promotion policy was carried out by the project. When the report is presented and validated the project considers it “conducted”.
No. Meeting with CTO and COPs on 6/25/10.

9
For more information: TIPS publications are available online at [insert website].
Acknowledgements: Our thanks to those whose experience and insights helped shape this publication including Gerry Britan and Subhi Mehdi of USAID’s Office of Management Policy, Budget and Performance (MPBP). This publication was written by Michelle Adams-Matson, of Management Systems International. Comments can be directed to: Gerald Britan, Ph.D. Tel: (202) 712-1158 [email protected]
Contracted under RAN-M-00-04-00049-A-FY0S-84 Integrated Managing for Results II
1
PERFORMANCE MONITORING & EVALUATION
TIPS RIGOROUS IMPACT EVALUATION
ABOUT TIPS
These TIPS provide practical advice and suggestions to USAID managers on issues related to
performance monitoring and evaluation. This publication is a supplemental reference to the
Automated Directive System (ADS) Chapter 203.
WHAT IS RIGOROUS
IMPACT
EVALUATION?
Rigorous impact evaluations are
useful for determining the effects
of USAID programs on
outcomes. This type of
evaluation allows managers to
test development hypotheses by
comparing changes in one or
more specific outcomes to
changes that occur in the
absence of the program.
Evaluators term this the
counterfactual. Rigorous impact
evaluations typically use
comparison groups, composed of
individuals or communities that
do not participate in the
program. The comparison group
is examined in relation to the
treatment group to determine
the effects of the USAID program
or project.
Impact evaluations may be
defined in a number of ways (see
Figure 1). For purposes of this
TIPS, rigorous impact evaluation
is defined by the evaluation
design (quasi-experimental and
experimental) rather than the
topic being evaluated. These
methods can be used to attribute
change at any program or project
outcome level, including
Intermediate Results (IR), sub-IRs,
and Assistance Objectives (AO).
FIGURE 1. DEFINITIONS OF IMPACT EVALUATION
• An evaluation that looks at the impact of an intervention on final welfare
outcomes, rather than only at project outputs, or a process evaluation which
focuses on implementation.
• An evaluation carried out some time (five to ten years) after the
intervention has been completed, to allow time for impact to appear.
• An evaluation considering all interventions within a given sector or
geographical area.
• An evaluation concerned with establishing the counterfactual, i.e., the
difference the project made (how indicators behaved with the project
compared to how they would have been without it).
NUMBER 19
1ST EDITION, 2010 DRAFT
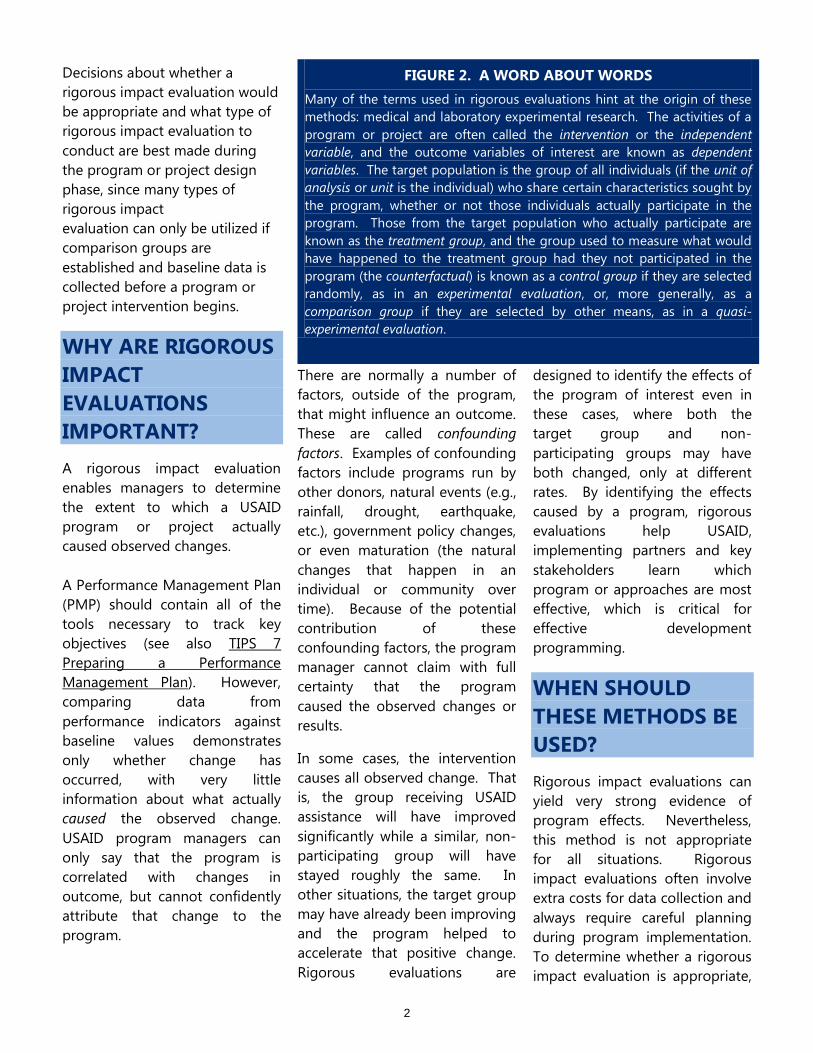
2
Decisions about whether a
rigorous impact evaluation would
be appropriate and what type of
rigorous impact evaluation to
conduct are best made during
the program or project design
phase, since many types of
rigorous impact
evaluation can only be utilized if
comparison groups are
established and baseline data is
collected before a program or
project intervention begins.
WHY ARE RIGOROUS
IMPACT
EVALUATIONS
IMPORTANT?
A rigorous impact evaluation
enables managers to determine
the extent to which a USAID
program or project actually
caused observed changes.
A Performance Management Plan
(PMP) should contain all of the
tools necessary to track key
objectives (see also TIPS 7
Preparing a Performance
Management Plan). However,
comparing data from
performance indicators against
baseline values demonstrates
only whether change has
occurred, with very little
information about what actually
caused the observed change.
USAID program managers can
only say that the program is
correlated with changes in
outcome, but cannot confidently
attribute that change to the
program.
There are normally a number of
factors, outside of the program,
that might influence an outcome.
These are called confounding
factors. Examples of confounding
factors include programs run by
other donors, natural events (e.g.,
rainfall, drought, earthquake,
etc.), government policy changes,
or even maturation (the natural
changes that happen in an
individual or community over
time). Because of the potential
contribution of these
confounding factors, the program
manager cannot claim with full
certainty that the program
caused the observed changes or
results.
In some cases, the intervention
causes all observed change. That
is, the group receiving USAID
assistance will have improved
significantly while a similar, non-
participating group will have
stayed roughly the same. In
other situations, the target group
may have already been improving
and the program helped to
accelerate that positive change.
Rigorous evaluations are
designed to identify the effects of
the program of interest even in
these cases, where both the
target group and non-
participating groups may have
both changed, only at different
rates. By identifying the effects
caused by a program, rigorous
evaluations help USAID,
implementing partners and key
stakeholders learn which
program or approaches are most
effective, which is critical for
effective development
programming.
WHEN SHOULD
THESE METHODS BE
USED?
Rigorous impact evaluations can
yield very strong evidence of
program effects. Nevertheless,
this method is not appropriate
for all situations. Rigorous
impact evaluations often involve
extra costs for data collection and
always require careful planning
during program implementation.
To determine whether a rigorous
impact evaluation is appropriate,
FIGURE 2. A WORD ABOUT WORDS
Many of the terms used in rigorous evaluations hint at the origin of these
methods: medical and laboratory experimental research. The activities of a
program or project are often called the intervention or the independent
variable, and the outcome variables of interest are known as dependent
variables. The target population is the group of all individuals (if the unit of
analysis or unit is the individual) who share certain characteristics sought by
the program, whether or not those individuals actually participate in the
program. Those from the target population who actually participate are
known as the treatment group, and the group used to measure what would
have happened to the treatment group had they not participated in the
program (the counterfactual) is known as a control group if they are selected
randomly, as in an experimental evaluation, or, more generally, as a
comparison group if they are selected by other means, as in a quasi-
experimental evaluation.
3
potential cost should be weighed
against the need for and
usefulness of the information.
Rigorous impact evaluations
answer evaluation questions
concerning the causal effects of a
program. However, other
evaluation designs may be more
appropriate for answering other
types of evaluation questions.
For example, the analysis of ‘why’
and ‘how’ observed changes,
particularly unintended changes,
were produced may be more
effectively answered using other
evaluation methods, including
participatory evaluations or rapid
appraisals. Similarly, there are
situations when rigorous
evaluations, which often use
comparison groups, will not be
advisable, or even possible. For
example, assistance focusing on
political parties can be difficult to
evaluate using rigorous methods,
as this type of assistance is
typically offered to all parties,
making the identification of a
comparison group difficult or
impossible. Other methods may
be more appropriate and yield
conclusions with sufficient
credibility for programmatic
decision-making.
While rigorous impact
evaluations are sometimes used
to examine the effects of only
one program or project
approach, rigorous impact
evaluations are also extremely
useful for answering questions
about the effectiveness of
alternative approaches for
achieving a given result, e.g.,
which of several approaches for
improving farm productivity, or
for delivering legal services, are
most effective.
Missions should consider using
rigorous evaluations strategically
to answer specific questions
about the effectiveness of key
approaches. When multiple
rigorous evaluations are carried
out across Missions on a similar
topic or approach, the results can
be used to identify approaches
that can be generalized to other
settings, leading to significant
advances in programmatic
knowledge. Rigorous methods
are often useful when:
Multiple approaches to
achieving desired results have
been suggested, and it is
unclear which approach is the
most effective or efficient;
An approach is likely to be
replicated if successful, and
clear evidence of program
effects are desired before
scaling up;
A program uses a large amount
of resources or affects a large
number of people; and
In general, little is known about
the effects of an important
program or approach, as is
often the case with new or
innovative approaches.
PLANNING
Rigorous methods require strong
performance management
systems to be built around a
clear, logical results framework
(see TIPS 13 Building a Results
Framework). The development
hypothesis should clearly define
the logic of the program, with
particular emphasis on the
intervention (independent
variable) and the principal
anticipated results (dependent
variables), and provides the basis
for the questions that will be
addressed by the rigorous
evaluation.
Rigorous evaluation builds upon
the indicators defined for each
level of result, from inputs to
outcomes, and requires high data
quality. Because quasi-
experimental and experimental
designs typically answer very
specific evaluation questions and
are generally analyzed using
quantitative methods, they can
be paired with other evaluation
tools and methods to provide
context, triangulate evaluation
conclusions, and examine how
and why effects were produced
(or not) by a program. This is
termed mixed method evaluation
(see TIPS 16, Mixed Method
Evaluations).
Unlike most evaluations
conducted by USAID, rigorous
impact evaluations are usually
only possible, and are always
most effective, when planned
before project implementation
begins. Evaluators need time
prior to implementation to
identify appropriate indicators,
identify a comparison group, and
set baseline values. If rigorous
evaluations are not planned prior
to implementation, the number
of potential evaluation design
options is reduced, often leaving
alternatives that are either more
complicated or less rigorous. As
a result, Missions should consider
the feasibility of and need for a

4
WHAT IS EXPERIMENTAL AND
QUASI-EXPERIMENTAL
EVALUATION?
Experimental design is based on a
the selection of the comparison and
treatment group through random
sampling.
Quasi-experimental design is
based on a comparison group that
is chosen by the evaluator (that is,
not based on random sampling).
rigorous evaluation prior to and
during project design.
DESIGN
Although there are many
variations, rigorous evaluations
are divided into two categories:
quasi-experimental and
experimental. Both categories of
rigorous evaluations rely on the
same basic concept - using the
counterfactual to estimate the
changes caused by the program.
The counterfactual answers the
question, “What would have
happened to program participants
if they had not participated in the
program?” The comparison of
the counterfactual to the
observed change in the group
receiving USAID assistance is the
true measurement of a program’s
effects.
While before and after
measurements of a single group
using a baseline allow the
measurement of a single group
both with and without program
participation, this design does
not control for all the other
confounding factors that might
influence the participating group
during program implementation.
Well constructed, comparison
groups provide a clear picture of
the effects of program or project
interventions on the target group
by differentiating
program/project effects from the
effects of multiple other factors in
the environment that affect both
the target and comparison
groups. This means that in
situations where economic or
other factors affecting both
groups make everyone better
off, it will still be possible to see
the additional or incremental
improvement caused by the
program or project, as Figure 3
illustrates.
QUASI-EXPERIMENTAL
EVALUATIONS
To estimate program effects,
quasi-experimental designs rely
on measurements of a non-
randomly selected comparison
group. The most common means
for selecting a comparison group
is matching, wherein the
evaluator ‘hand-picks’ a group of
similar units based on observable
characteristics that are thought to
influence the outcome. For
example, the evaluation of an
agriculture program aimed at
increasing crop yield might seek
to compare participating
communities against other
communities with similar weather
patterns, soil types, and
traditional crops, as communities
sharing these critical
characteristics would be most
likely to behave similarly to the
treatment group in the absence
of the program.
However, program participants
are often selected based on
certain characteristics, whether it
is level of need, motivation,
location, social or political factors,
or some other factor. While
evaluators can often identify and
match many of these variables, it
is impossible to match all factors
that might create differences
between the treatment and
comparison groups, particularly
characteristics that are more
difficult to measure or are
unobservable, such as motivation
or social cohesion. For example,
if a program is targeted at
Baseline Follow-up
Ou
tco
me
of
Inte
rest
= Target Group
= Comparison Group
Program
Effect
Obse
rve
d C
ha
ng
e
Confounding
Effect
FIGURE 3. CONFOUNDING EFFECTS

5
communities that are likely
succeed, then the target group
might be expected to improve
relative to a comparison group
that was not chosen based on the
same factors. Failing to account
for this in the selection of the
comparison group would lead to
a biased estimate of program
impact. Selection bias is the
difference between the
comparison group and the
treatment group caused by the
inability to completely match on
all characteristics, and the
uncertainty or error this
generates in the measurement of
program effects.
Other common quasi-
experimental designs, in addition
to matching, are described below.
Non-Equivalent Group Design.
This is the most common quasi-
experimental design in which a
comparison group is hand-picked
to match the treatment group as
closely as possible. Since hand-
picking the comparison group
cannot completely match all
characteristics with the treatment
group, the groups are considered
to be ‘non-equivalent’.
Regression Discontinuity.
Programs often have eligibility
criteria based on a cut-off score
or value of a targeting variable.
Examples include programs
accepting only households with
income below 2,000 USD,
organizations registered for at
least two years, or applicants
scoring above a 65 on a pre-test.
In each of these cases, it is likely
that individuals or organizations
just above and just below the
cut-off value would demonstrate
only marginal or incremental
differences in the absence of
USAID assistance, as families
earning 2,001 USD compared to
1,999 USD are unlikely to be
significantly different except in
terms of eligibility for the
program. Because of this, the
group just above the cut-off
serves as a comparison group for
those just below (or vice versa) in
a regression discontinuity design.
Propensity Score Matching. This
method is based on the same
rationale as regular matching: a
comparison group is selected
based on shared observable
characteristics with the treatment
group. However, rather than
‘hand-picking’ matches based on
a small number of variables,
propensity score matching uses a
statistical process to combine
information from all data
collected on the target
population to create the most
accurate matches possible based
on observable characteristics.
FIGURE 4.
QUASI-EXPERIMENTAL EVALUATION OF THE KENYA NATIONAL CIVIC EDUCATION PROGRAM
PHASE II (NCEP II)
NCEP II, funded by USAID in collaboration with other donors, reached an estimated 10 million individuals through
workshops, drama events, cultural gatherings and mass media campaigns aimed at changing individuals’ awareness,
competence and engagement in issues related to democracy, human rights, governance, constitutionalism, and
nation-building. To determine the program’s impacts on these outcomes of interest, NCEP as evaluated using a
quasi-experimental design with a matched comparison group.
Evaluators matched participants to a comparison group of non-participating individuals who shared geographic and
demographic characteristics (such as age, gender, education, and involvement with CSOs). This comparison group
was compared to the treatment group along the outcomes of interest to identify program effects. The evaluators
found that the program had significant long term effects, particularly on ‘civic competence and involvement’ and
‘identity and ethnic group relations, but had only negligible impact on ‘Democratic Values, Rights, and
Responsibilities’. The design also allowed the evaluators to assess the conditions under which the program was
most successful. They found confirmation of prior assertions of the critical role in creating lasting impact of multiple
exposures to civic education programs through multiple participatory methods.
- ‘The Impact of the Second National Kenya Civic Education Programme (NECP II-URAIA) on Democratic Attitudes,
Values, and Behavior’, Steven E. Finkel and Jeremy Horowitz, MSI

6
Interrupted Time Series.1 Some
programs will encounter
situations where a comparison
group is not possible, often
because the intervention affects
everyone at once, as is typically
the case with policy change. In
these cases, data on the outcome
of interest are recorded at
numerous intervals before and
after the program or activity take
places. The data form a time-
series or trend, which the
evaluator analyzes for significant
changes around the time of the
intervention. Large spikes or
drops immediately after the
intervention signal changes
caused by the program. This
method is slightly different from
the other rigorous methods as it
does not use a comparison group
to rule out potentially
confounding factors, leading to
increased uncertainty in
evaluation conclusions.
Interrupted time series are most
effective when data are collected
regularly both before and after
the intervention, leading to a
long time series, and alternative
causes are monitored.
EXPERIMENTAL EVALUATION
In an experimental evaluation, the
treatment and comparison
groups are selected from the
target population by a random
process. For example, from a
target population of 50
communities that meet the 1 Interrupted time series is normally
viewed as a type of impact evaluation.
It is typically considered quasi-
experiemental although it does not use a
comparison group.
eligibility (or targeting) criteria of
a program, the evaluator uses a
coin flip, lottery, computer
program, or some other random
process to determine the 25
communities that will participate
in the program (treatment group)
and the 25 communities that will
not (control group, as the
comparison group is called when
it is selected randomly). Because
they use random selection
processes, experimental
evaluations are often called
randomized evaluations or
randomized controlled trials
(RCTs).
Random selection from a target
population into treatment and
control groups is the most
effective tool for eliminating
selection bias because it removes
the possibility of any individual
characteristic influencing
selection. Because units are not
assigned to treatment or control
groups based on specific
characteristics, but rather are
divided randomly, all
characteristics that might lead to
selection bias, such as motivation,
poverty level, or proximity, will be
roughly equally divided between
the treatment and control
groups. If an evaluator uses
random assignment to determine
treatment and control groups,
she might, by chance, get two or
three very motivated
communities in a row assigned to
the treatment group, but if the
program is working in more than
a handful of communities, the
number of motivated
communities will likely balance
out between treatment and
control in the end.
Because random selection
completely eliminates selection
bias, experimental evaluations are
often easier to analyze and
provide more credible evidence
than quasi experimental designs.
Random assignment can be done
with any type of unit, whether the
unit is the individual, groups of
individuals (e.g., communities or
districts), organizations, or
facilities (e.g., health center or
school) and usually follows one of
the designs discussed below.
Simple Random Assignment.
When the number of program
participants has been decided
and additional eligible individuals
are identified, simple random
assignment through a coin flip or
lottery can be used to select the
treatment group and control
groups. Programs often
encounter ‘excess demand’
naturally (for example in training
programs, participation in study
tours, or where resources limit
the number of partner
organizations), and simple
random assignment can be an
easy and fair way to determine
participation while maximizing
the potential for credible
evaluation conclusions.
Phased-In Selection. In some
programs, the delivery of the
intervention does not begin
everywhere at the same time. For
capacity or logistical reasons,
some units receive the program
intervention earlier than others.
This type of schedule creates a
natural opportunity for using an

7
experimental design. Consider a
project where the delivery of a
radio-based civic education
program was scheduled to
operate in 100 communities
during year one, another 100
during year two, and a final 100
during year three. The year of
participation can be randomly
assigned. Communities selected
to participate in year one would
be designated as the first
treatment group (T1). For that
year, all the other communities
that would participate in Years
Two and Three form the initial
control group. In the second
year, the next 100 communities
would become the second
treatment group (T2), while the
final 100 communities would
continue to serve as the control
group. Random assignment to
the year of participation ensures
that all communities will
participate in the program but
also maximizes evaluation rigor
by reducing selection bias, which
could be significant if only the
most motivated communities
participate in Year One.
Blocked (or Stratified)
Assignment. When it is known in
advance that the units to which a
program intervention could be
delivered differ in one or more
ways that might influence the
program outcome, (e.g., age, size
of the community in which they
are located, ethnicity, etc.),
evaluators may wish to take extra
steps to ensure that such
conditions are evenly distributed
between an evaluation’s
treatment and control groups. In
a simple block (stratified) design,
an evaluation might separate
men and women, and then use
randomized assignment within
each block to construct the
evaluation’s treatment and
control groups, thus ensuring a
specified number or percentage
of men and women in each
group.
Multiple Treatments. It is
possible that multiple approaches
will be proposed or implemented
for the achievement of a given
result. If a program is interested
in testing the relative
effectiveness of three different
strategies or approaches, eligible
units can be randomly divided
into three groups. Each group
participates in one approach, and
the results can be compared to
determine which approach is
most effective. Variations on this
design can include additional
groups to test combined or
holistic approaches and a control
group to test the overall
effectiveness of each approach.
FIGURE 5.
EXPERIMENTAL EVALUATION OF THE IMPACTS OF EXPANDING CREDIT ACCESS IN
SOUTH AFRICA
While commercial loans are a central component of most microfinance strategies, there is much less consensus on
whether consumer loans are also for economic development. Microfinance in the form loans for household
consumption or investment has been criticized as unproductive, usurious, and a contributor to debt cycles or traps.
In an evaluation partially funded by USAID, researchers used an experimental evaluation designed to test the impacts
of access to consumer loans on household consumption, investment, education, health, wealth, and well-being.
From a group of 787 applicants who were just below the credit score needed for loan acceptance, the researchers
randomly selected 325 (treatment group) that would be approved for a loan. The treatment group was surveyed,
along with the remaining 462 who were randomly denied (control group), eight months after their loan application to
estimate the effects of receiving access to consumer credit. The evaluators found that the treatment group was more
likely to retain wage employment, less likely to experience severe hunger in their households, and less likely to be
impoverished than the control group providing strong evidence of the benefits of expanding access to consumer
loans.
-‘Expanding Credit Access: Estimating the Impacts’, Dean Karlan and Jonathan Zinman,
http://www.povertyactionlab.org/projects/print.php?pid=62
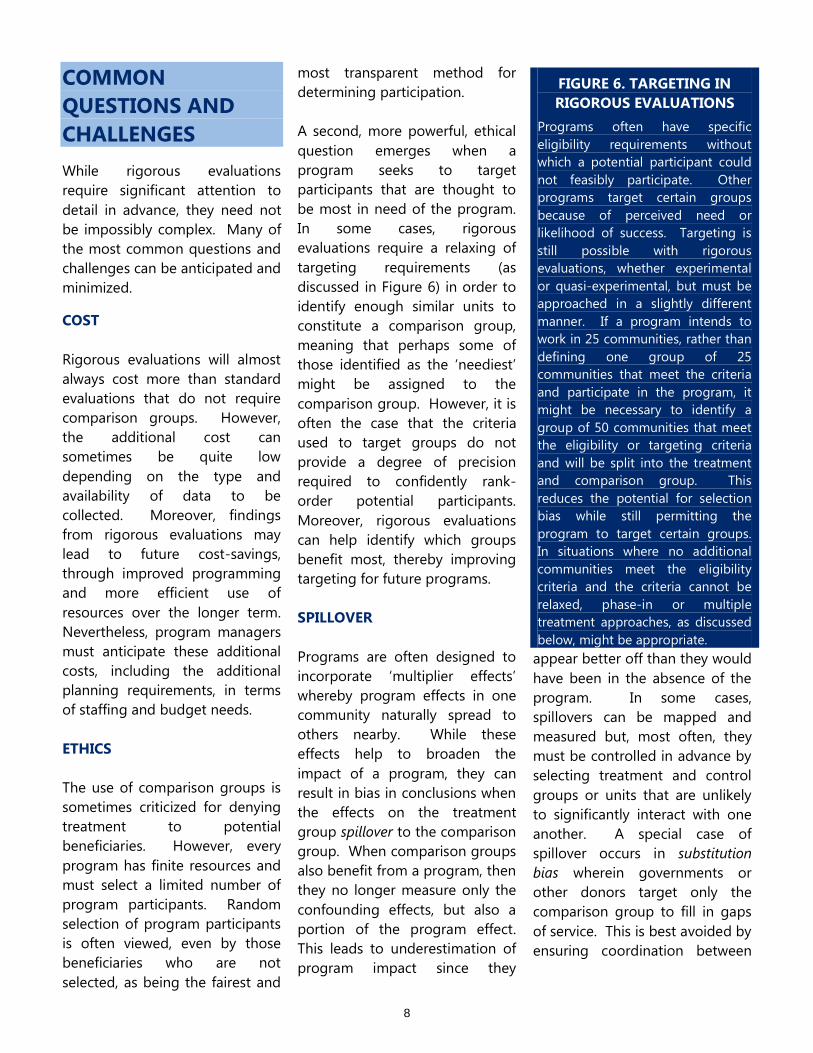
8
COMMON
QUESTIONS AND
CHALLENGES
While rigorous evaluations
require significant attention to
detail in advance, they need not
be impossibly complex. Many of
the most common questions and
challenges can be anticipated and
minimized.
COST
Rigorous evaluations will almost
always cost more than standard
evaluations that do not require
comparison groups. However,
the additional cost can
sometimes be quite low
depending on the type and
availability of data to be
collected. Moreover, findings
from rigorous evaluations may
lead to future cost-savings,
through improved programming
and more efficient use of
resources over the longer term.
Nevertheless, program managers
must anticipate these additional
costs, including the additional
planning requirements, in terms
of staffing and budget needs.
ETHICS
The use of comparison groups is
sometimes criticized for denying
treatment to potential
beneficiaries. However, every
program has finite resources and
must select a limited number of
program participants. Random
selection of program participants
is often viewed, even by those
beneficiaries who are not
selected, as being the fairest and
most transparent method for
determining participation.
A second, more powerful, ethical
question emerges when a
program seeks to target
participants that are thought to
be most in need of the program.
In some cases, rigorous
evaluations require a relaxing of
targeting requirements (as
discussed in Figure 6) in order to
identify enough similar units to
constitute a comparison group,
meaning that perhaps some of
those identified as the ‘neediest’
might be assigned to the
comparison group. However, it is
often the case that the criteria
used to target groups do not
provide a degree of precision
required to confidently rank-
order potential participants.
Moreover, rigorous evaluations
can help identify which groups
benefit most, thereby improving
targeting for future programs.
SPILLOVER
Programs are often designed to
incorporate ‘multiplier effects’
whereby program effects in one
community naturally spread to
others nearby. While these
effects help to broaden the
impact of a program, they can
result in bias in conclusions when
the effects on the treatment
group spillover to the comparison
group. When comparison groups
also benefit from a program, then
they no longer measure only the
confounding effects, but also a
portion of the program effect.
This leads to underestimation of
program impact since they
appear better off than they would
have been in the absence of the
program. In some cases,
spillovers can be mapped and
measured but, most often, they
must be controlled in advance by
selecting treatment and control
groups or units that are unlikely
to significantly interact with one
another. A special case of
spillover occurs in substitution
bias wherein governments or
other donors target only the
comparison group to fill in gaps
of service. This is best avoided by
ensuring coordination between
FIGURE 6. TARGETING IN
RIGOROUS EVALUATIONS
Programs often have specific
eligibility requirements without
which a potential participant could
not feasibly participate. Other
programs target certain groups
because of perceived need or
likelihood of success. Targeting is
still possible with rigorous
evaluations, whether experimental
or quasi-experimental, but must be
approached in a slightly different
manner. If a program intends to
work in 25 communities, rather than
defining one group of 25
communities that meet the criteria
and participate in the program, it
might be necessary to identify a
group of 50 communities that meet
the eligibility or targeting criteria
and will be split into the treatment
and comparison group. This
reduces the potential for selection
bias while still permitting the
program to target certain groups.
In situations where no additional
communities meet the eligibility
criteria and the criteria cannot be
relaxed, phase-in or multiple
treatment approaches, as discussed
below, might be appropriate.
9
the program and other
development actors.
SAMPLE SIZE
During the analysis phase,
rigorous evaluations typically use
statistical tests to determine
whether any observed differences
between treatment and
comparison groups represent
actual differences (that would
then, in a well designed
evaluation, be attributed to the
program) or whether the
difference could have occurred
due to chance alone. The ability
to make this distinction depends
principally on the size of the
change and the total number of
units in the treatment and
comparison groups, or sample
size. The more units, or higher
the sample size, the easier it is to
attribute change to the program
rather than to random variations.
During the design phase,
rigorous impact evaluations
typically calculate the number of
units (or sample size) required to
confidently identify changes of
the size anticipated by the
program. An adequate sample
size helps prevent declaring a
successful project ineffectual
(false negative) or declaring an
ineffectual project successful
(false positive). Although sample
size calculations should be done
before each program, as a rule of
thumb, rigorous impact
evaluations are rarely undertaken
with less than 50 units of analysis.
RESOURCES
This TIPS is intended to provide
an introduction to rigorous
impact evaluations. Additional
resources are provided on the
next page for further reference.

10
Further Reference
Initiatives and Case Studies:
- Office of Management and Budget (OMB):
o http://www.whitehouse.gov/OMB/part/2004_program_eval.pdf
o http://www.whitehouse.gov/omb/assets/memoranda_2010/m10-01.pdf
- U.S. Government Accountability Office (GAO):
o http://www.gao.gov/new.items/d1030.pdf
- USAID:
o Evaluating Democracy and Governance Effectiveness (EDGE):
http://www.usaid.gov/our_work/democracy_and_governance/technical_areas/dg_office/eval
uation.html
o Measure Evaluation:
http://www.cpc.unc.edu/measure/approaches/evaluation/evaluation.html
o The Private Sector Development (PSD) Impact Evaluation Initiative:
www.microlinks.org/psdimpact
- Millennium Challenge Corporation (MCC) Impact Evaluations:
http://www.mcc.gov/mcc/panda/activities/impactevaluation/index.shtml
- World Bank:
o The Spanish Trust Fund for Impact Evaluation:
http://web.worldbank.org/WBSITE/EXTERNAL/EXTABOUTUS/ORGANIZATION/EXTHDNETW
ORK/EXTHDOFFICE/0,,contentMDK:22383030~menuPK:6508083~pagePK:64168445~piPK:6
4168309~theSitePK:5485727,00.html
o The Network of Networks on Impact Evaluation: http://www.worldbank.org/ieg/nonie/
o The Development Impact Evaluation Initiative:
http://web.worldbank.org/WBSITE/EXTERNAL/EXTDEC/EXTDEVIMPEVAINI/0,,menuPK:39982
81~pagePK:64168427~piPK:64168435~theSitePK:3998212,00.html
- Others:
o Center for Global Development’s ‘Evaluation Gap Working Group’:
http://www.cgdev.org/section/initiatives/_active/evalgap
o International Initiative for Impact Evaluation: http://www.3ieimpact.org/
Additional Information:
- Sample Size and Power Calculations:
o http://www.statsoft.com/textbook/stpowan.html
o http://www.mdrc.org/publications/437/full.pdf
- World Bank: ‘Evaluating the Impact of Development Projects on Poverty: A Handbook for
Practitioners’:
o http://web.worldbank.org/WBSITE/EXTERNAL/TOPICS/EXTPOVERTY/EXTISPMA/0,,contentM
DK:20194198~pagePK:148956~piPK:216618~theSitePK:384329,00.html
Poverty Action Lab’s ‘Evaluating Social Programs’ Course: http://www.povertyactionlab.org/course/

11
For more information:
TIPS publications are available online at [insert website]
Acknowledgements:
Our thanks to those whose experience and insights helped shape this publication including USAID’s
Office of Management Policy, Budget and Performance (MPBP). This publication was written by Michael
Duthie of Management Systems International.
Comments regarding this publication can be directed to:
Gerald Britan, Ph.D.
Tel: (202) 712-1158
Contracted under RAN-M-00-04-00049-A-FY0S-84
Integrated Managing for Results II


