65
United States Department of Agriculture Rural Business- Cooperative Service FIBS Service Report 57 USDA m Farmer Cooperative Statistics, 1998

United StatesDepartment ofAgriculture
Rural Business-CooperativeService
FIBS ServiceReport 57
USDAm
Farmer CooperativeStatistics, 1998

Abstract A survey of all U.S. farmer cooperatives ending their business years during calendaryear 1998 showed a net income of $1.7 billion, down from $2.3 billion in 1997. Grossand net business volumes were down for the 3,651 cooperatives in the survey. Assets,liabilities, and net worth were up. Business volume by commodity handled is reportedfor all cooperatives and by State for 1997. Number of cooperatives, cooperative mem-berships, and number of employees are classified according to marketing, farm supply,and service function. Trends in cooperative numbers, memberships, employees, busi-ness size, sales volume, net income, assets, liabilities, and net worth are reportedalong with data on selected activities of other service organizations.
Keywords: cooperatives, statistics, business volume, employees, memberships, bal-ance sheet, net income.
Farmer Cooperative Statistics, 1998
Charles A. Kraenzle, Ralph M. Richardson,Celestine C. Adams, Katherine C. DeVille,and Jacqueline E. Penn
U.S. Department of AgricultureRural DevelopmentRural Business-Cooperative ServiceSTOP 32561400 Independence Ave., S.W.Washington, DC 20250-3256
Service Report 57
November 1999
Price: Domestic-$5.00;Foreign-$5.50
Preface Farmer cooperative statistics are collected annually to provide information on theprogress and trends in cooperatives’ growth and development. Many people use thesestatistics for research, technical assistance, education, planning, and public policy.Acquiring, analyzing, and disseminating farmer cooperative statistics is authorized bythe Cooperative Marketing Act of 1926.
This report provides aggregate information on the number, membership, business vol-ume, net income, and full-time employees of farmer cooperatives whose businessyears ended in 1998. Cooperatives are classified by principal product marketed andmajor function. Fishery cooperatives are included as miscellaneous marketing cooper-atives. Both gross (includes intercooperative business) and net (excludes intercoopera-tive business) dollar volumes are reported.
Statistics for 1998 were compiled on a national basis. State data on cooperative busi-ness volume and memberships are reported for 1997. State data are collected everyother year.
The information was collected from individual farmer and fishery cooperatives by amail survey of all organizations identified by USDA’s Rural Business-CooperativeService (RBS) as a farmer or aquacultural cooperative. Information was requested forcooperatives’ 1998 business years.
RBS conducts an annual census because of the need to make more accurate esti-mates for all cooperatives and to use current data on cooperatives for research, educa-tion, and technical assistance purposes. Information obtained from individual coopera-tives is combined to maintain confidentiality.
Statistics for all cooperatives were derived by adding data estimated for nonrespon-dents to respondent data. Responses to the 1998 survey accounted for 91 percent ofthe total gross sales of farmer cooperatives.
RBS depends on the cooperative community’s response to its annual survey to devel-op a detailed and comprehensive set of statistics on farmer cooperatives. The time andeffort taken to provide information and the timeliness with which it is furnished aregreatly appreciated.

Contents HIGHLIGHTS . . . . . . . . . . . . . . . . . . . . . . . . . . . . . . . . . . . . . . . . . . . . . . . . . . . . . . . .I-DEFINITION OF A FARMER COOPERATIVE .......................... .l
Classification of Cooperatives ................................1
Organizational Membership Structures ........................ .2II-1 998 STATISTICS . . . . . . . . . . . . . . . . . . . . . . . . . . . . . . . . . . . . . . . . . . . . . . . . .2
Number of Cooperatives ................................... .3Memberships . . . . . . . . . . . . . . . . . . . . . . . . . . . . . . . . . . . . . . . . . . . . . .Employees . . . . . . . . . . . . . . . . . . . . . . . . . . . . . . . . . . . . . . . . . . . . . . . .TotalLaborExpense . . . . . . . . . . . . . . . . . . . . . . . . . . . . . . . . . . . . . . . .BusinessSize . . . . . . . . . . . . . . . . . . . . . . . . . . . . . . . . . . . . . . . . . . . ..gBusinessVolume . . . . . . . . . . . . . . . . . . . . . . . . . . . . . . . . . . . . . . . . . . .Netlncome..............................................14BalanceSheet . . . . . . . . . . . . . . . . . . . . . . . . . . . . . . . . . . . . . . . . . ..16Selected Financial Ratios .................................. .18
Ill-COOPERATIVE TRENDS, 1989-98 ................................ .21Number of Cooperatives .................................. .21Memberships . . . . . . . . . . . . . . . . . . . . . . . . . . . . . . . . . . . . . . . . . . ..2 2Employees . . . . . . . . . . . . . . . . . . . . . . . . . . . . . . . . . . . . . . . . . . . . ..2 3Business Volume ........................................ .24Netlncome..............................................2 6BalanceSheet . . . . . . . . . . . . . . . . . . . . . . . . . . . . . . . . . . . . . . . . ..2 6
IV-OTHER SERVICE COOPERATIVES ............................... .27Farm Credit System ...................................... .27Rural Telephone Cooperatives .............................. .30Rural Electric Cooperatives ................................ .30Rural Credit Unions ...................................... .31Dairy Herd Improvement Associations ........................ .31
TABLESTable l-
Table 2-Table 3-
Table 4-
Table 5-
Table 6-
Table 7-
Table 8-Table 9-Table lO-
Number of cooperatives and memberships, by majorbusiness activity, 1998. . . . . . . . . . . . . . . . . . . . . . . . . . . . . . . . . . . . . .2Number of cooperatives, by major function and State, 1998 . . . . . . . .4Full-time and part-time and seasonal employeesof farmer cooperatives, by type of cooperative, 1997-98 . . . . . . . . . . . .7Average total labor expense for cooperativesreporting, by selected type and size, 1997-98 . . . . . . . . . . . . . . . . . . .lOTotal sales per dollar of total labor expense for cooperativesreporting, by selected type and size, 1998 . . . . . . . . . . . . . . . . . . . . . .l 1Farmer cooperatives and memberships, by grossbusiness volume, 1998.. . . . . . . . . . . . . . . . . . . . . . . . . . . . . . . . . . . .12Cooperatives’ gross and net business volumes bycommodity,1998 . . . . . . . . . . . . . . . . . . . . . . . . . . . . . . . . . . . . . . ...13Farmer cooperatives’ net income, 1998 . . . . . . . . . . . . . . . . . . . . . . . .15Combined balance sheet data for farmer cooperatives, 1998 . . . . . . .17Combined assets for farmer cooperatives, 1998 . . . . . . . . . . . . . . . . .18
Table 1 l- Selected financial ratios for,cooperatives, 1998 ................. .19Table 12- Number of farmer cooperatives, 1989-98 ...................... .21Table 13- Estimated number of branches operated by grain
and farm supply cooperatives, 1992-98 ....................... .23Table 14- Memberships in marketing, farm supply, and service
cooperatives, 1989-98 .................................... .24Table l!+ Cooperatives’ number of full-time employees, 1994-98 ........... .25

Contents Table 16Table 17-Table 18-Table 19-Table 20-Table 21-
Table 22-
Table 23-
Table 24-
Table 25-
Table 26-
Table 27-
FIGURESFigure l-Figure 2-Figure 3-Figure 4-
Figure 5-
Figure 6-
Figure 7-
Figure 8-
Figure 9-
Figure lO-
Cooperatives’ net business volume, 1989 and 1998 ............. .26Cooperatives’ gross and net business volumes, 1989-98 . . . . . . . . . .29Net income of farmer cooperatives, 1989-98 ....................30Combined balance sheet data for farmer cooperatives, 1989-98 ... .31Farm Credit Association Structure, Jan. 1, 1999 .................32Farm Credit System’s combined assets, net worth,and net income, 1994-98 .................................. .33Farm Credit Banks’ combined assets, net worth,net loans, and net income, 1994-98 .......................... .33Combined assets, net worth, net loans, and net income of theSt. Paul Bank for Cooperatives and CoBank, ACB, 1994-98 ....... -33Number, participation, and level of activity of ruraltelephone cooperatives, by State, Dec. 31, 1998 ................ .34Number, participation, and level of activity of ruralelectric cooperatives, by State, Dec. 31, 1998 .................. .35Number, participation, and level of activity of ruralcredit unions, by State, Dec. 31,1998 ........................ .36Number, participation, and level of activity of dairy herdimprovement associations, by State, Dec. 31, 1998 ............. -37
Number of Cooperatives by Function, Leading States, 1998 ........ .3Branches of Grain and Farm Supply Cooperatives by Size, 1998 .... 5Distribution of Memberships by Type of Cooperative, 1998 ......... .6Cooperative Memberships Grouped by Functionand Gross Business Volume, 1998 ........................... .6Full-Time and Part-Time and Seasonal Employees,by Type of Cooperative, 1998 . . . . . . . . . . . . . . . . . . . . . . . . . . . . . . . . .8Average Number of Full-Time and Part-Time and SeasonalEmployees, by Type of Cooperative, 1998 . . . . . . . . . . . . . . . . . . . . . . .9Distribution of Farmer Cooperatives and Gross BusinessVolume, by Size, 1998 ....................................-12Relative Importance of Farm Products Marketedby Cooperatives, 1998 .................................... .14Relative Importance of Farm Supplies Handledby Cooperatives, 1998 .................................... .15Total Net Income or Loss by Cooperative Type, 1998 ............ .16
Figure 1 l- Percentage of Cooperatives’ Assets Financedby Net Worth, by Cooperative Type, 1998 ..................... .17
Figure 12- Farmer Cooperatives in the United States, 1989-98 ............. .21Figure 13- Cooperatives Removed from RBS’ List, 1989-98 ................ .22Figure 14- Grain and Farm Supply Cooperatives and Branches, 1992-98 ..... .24Figure 15- Cooperatives’ Memberships by Function, 1989-98 .............. .25Figure 16- Cooperatives’ Net Business Volume, 1989-98 .................. .27Figure 17- Cooperatives’ Net Sales of Selected Commodities, 1989-98 ....... .28Figure 18- Cooperatives’ Net Sales of Selected Farm Supplies, 1989-98 ..... .28Figure 19- Cooperatives’ Net Income, 1989-98 .......................... .30Figure 20- Cooperatives’ Net Worth and Liabilities, 1989-98 ................32
. . .111

Contents APPENDIX TABLES. . . . . . . . . . . . . . . . . . . . . . . . . . . . . . . . . . . . . . . . . . . . . . . . .38Appendix Table l- Number of cooperatives and memberships,
by major business activity and State, 1997 . . . . . . . . . . . . .39Appendix Table 2- Cooperatives’ business volume, by
commodity and State, 1997 . . . . . . . . . . . . . . . . . . . . . . . . .43
APPENDIX FIGURES . . . . . . . . . . . . . . . . . . . . . . . . . . . . . . . . . . . . . . . . . . . . . . 51Appendix Figure l- Cooperatives’ Net Business Volume, 1974-98 . . . . . . . . . . .52Appendix Figure 2- Cooperatives’ Gross and Net Business
Volumes, 1974-98 . . . . . . . . . . . . . . . . . . . . . . . . . . . . . . . -52Appendix Figure 3- U.S. Farms and Farmer Cooperative
Memberships, 1974-98 . . . . . . . . . . . . . . . . . . . . . . . . . . . . .53Appendix Figure 4- Distribution of Farmer Cooperatives
byType, . . . . . . . . . . . . . . . . . . . . . . . . . . . . . . . . . ...53Appendix Figure 5- Distribution of Total Net Income by Type
of Cooperative, 1998 . . . . . . . . . . . . . . . . . . . . . . . . . . . . . .54Appendix Figure 6- Distribution of Total Losses by Type
of Cooperative, 1998 . . . . . . . . . . . . . . . . . . . . . . . . . . . . . .54Appendix Figure 7- Distribution of Total Net Worth by Type
of Cooperative, 1998 . . . . . . . . . . . . . . . . . . . . . . . . . . . . . .55Appendix Figure 8- Distribution of Total Full-time Employees
by Type of Cooperative, 1998 . . . . . . . . . . . . . . . . . . . . . . . .55Appendix Figure 9- Assets Per Full-Time Employee,
by Type of Cooperative, 1998 . . . . . . . . . . . . . . . . . . . . . . . .56Appendix Figure 1 O- Cooperatives’ Investments in and Patronage
Refunds Received from Other Cooperatives, 1989-98 . . . . .56
iv
Highlights Both gross and net business volumes dropped and net income declined significantly in1998 according to a survey of marketing, farm supply, and related-service cooperativesby USDA’s Rural Business-Cooperative Service (FIBS). Although the number of coop-eratives and memberships declined, total assets, total liabilities, net worth, and numberof full-time employees increased.
l Total gross business volume (includes intercooperative business) handled by coop-eratives dropped 4.5 percent, to $121 billion in 1998 from $126.7 billion in 1997.
Total net business (excludes intercooperative business) dropped 1.9 percent, or $2billion, to $104.7 billion from $106.7 billion.
Total net income of $1.7 billion was down 24.7 percent from the $2.3 billion reportedin 1997. The 1998 net included intercooperative dividends and refunds of $573 mil-lion-down 24.3 percent from $757.1 million. This included, reporting for the firsttime, refunds from CoBank and the St. Paul Bank for Cooperatives.
The number of cooperatives declined 3.7 percent, from 3,791 to 3,651.
Grain and farm supply cooperatives operated an estimated 5,617 branches in 1998,up from 5,433 in 1997.
Cooperative memberships were 3,352,577, down 2.1 percent from 3,424,168 in1997.
Cooperatives employed 173,791 full-time and 91,799 part-time and seasonalemployees in 1998. Numbers of full-time employees increased 0.9 percent, whilepart-time and seasonal employees decreased 4.8 percent.
Gross value of farm products marketed by cooperatives in 1998 decreased 1.7 per-cent, to $84.5 billion from $85.9 billion. Net value of these farm products, after elimi-nating intercooperative business, was $76.6 billion, down 1.5 percent from $77.8 bil-lion.
Gross value of farm supplies handled by farmer cooperatives was down 11 .l per-cent, to $33 billion from $37.1 billion. After adjusting for intercooperative business,the decrease was 2.5 percent, to $24.6billion from $25.2 billion.
Receipts for services related to marketing farm products and handling farm supplies,plus other income, decreased 4.8 percent to $3.5 billion.
Combined assets for all farmer cooperatives increased 5.8 percent to $46.6 billionfrom $44 billion. Net assets, after eliminating intercooperative investments, was up6.2 percent, to $41.9 billion from $39.4 billion. This included investments in CoBankand the St. Paul Bank for Cooperatives.
Total liabilities of $26.6 billion was up 4.5 percent from $25.5 billion.
Net worth, or member and patron equity, rose 7.6 percent to nearly $20 billion from$18.5 billion. Member and patron equity financed 42.9 percent of total assets, upfrom 42.1 percent in 1997.
V

Highlights HIGHLIGHTS CAPSULE
1997 1998 Change
Number of cooperatives
Memberships
Gross business volume (mil. dol.)
Net business volume (mil. dol.)
Net income (mil. dol.)
Total assets (mil. dol.)
Net worth (mil. dol.)
Full-time employees
Part-time and seasonal employees
Leading States 1995
Number of cooperatives 389
Memberships
Net business volume (mil. dol.) 8,891
3,791 3,651
3,424,168 3,352,577
126,673 120,961
106,670 104,667
2,314 1,742
43,996 46,560
18,537 19,954
172,199 173,791
96,472 91,799
Minnesota
Minnesota
329,241
California
1997
Minnesota
368
Minnesota
296,058
Iowa
10,941
-140
-71,591
-5,712
-2,003
-572
2,564
1,417
1,592
-4,673
-21
-33,183
N/A

FARMER COOPERATIVE STATISTICS, 1998
Charles A. Kraenzle, Ralph M. Richardson, Celestine C. Adams,Katherine C. DeVille, and Jacqueline E. PennRural Business-Cooperative Service
l-Definition of a Farmer Cooperative
The Rural Business-Cooperative Service (RBS) ofUSDA’s Rural Development mission area considersfour major criteria in identifying an organization as afarmer cooperative: (1) membership is limited to per-sons producing agricultural and aquacultural productsand to associations of such producers; (2) cooperativemembers are limited to one vote regardless of theamount of stock or membership capital owned, or thecooperative does not pay dividends on stock or mem-bership capital in excess of 8 percent a year, or thelegal rate in the State, whichever is higher; (3) busi-ness conducted with nonmembers may not exceed thevalue of business done with members; and (4) thecooperative operates for the mutual interest of mem-bers by providing member benefits on the basis ofpatronage.
These criteria may create larger or smaller num-bers of farmer cooperatives than found in lists or direc-tories of State agencies or cooperative councils. RBSincludes only marketing, farm supply, and related-ser-vice cooperatives on its list. Fishery cooperatives areincluded with miscellaneous marketing cooperatives.Wool pools are included as marketing cooperatives.Livestock shipping associations and rice drying coop-eratives, beginning with 1992 and 1993, respectively,are considered service cooperatives.
Many State lists include other types, such as pro-duction, credit, telephone, electric, and consumercooperatives, as well as those that do not meet RBSdefinition. Other reasons for possible differences in thenumber of cooperatives are that: (1) RBS may not learnof certain cooperatives operating in a State for a con-siderable period of time; (2) a cooperative may not
have completed and returned an initial questionnaire;or (3) no notice is received that a cooperative discon-tinued operating.
Year-to-year comparisons with specific commodi-ty groups, therefore, should reflect any differences inlists and classifications in State and Federal data.
Classification of CooperativesStatistics are presented according to a coopera-
tive’s major function or classification-marketing,farm supply, and related-service.
Marketing cooperatives derive most of their totaldollar volume from the sale of members’ farm prod-ucts. RBS classifies these cooperatives into one of 13commodities or commodity groups depending uponwhich accounts for most of its business volume. RBSmay reclassify a cooperative into a different commodi-ty category if its primary business volume changes.
Farm supply cooperatives derive most of theirbusiness volume from the sale of farm production sup-plies. These cooperatives handle a wide variety of sup-plies, farmstead equipment, and building materials.Many also handle farm and home items such as heat-ing oil, lawn and garden supplies and equipment, andfood.
Service cooperatives provide specialized businessservices related to the agricultural business operationsof farmers, ranchers, or cooperatives such as cottonginning, trucking, storing, drying, and artificial insem-ination. Livestock shipping associations were reclassi-fied from marketing to service in 1992. Rice dryingcooperatives, added in 1993, previously were listedwith rice marketing cooperatives.
Many cooperatives handle multiple commoditiesand provide both marketing and farm supply services,as well as the facilities and equipment used to perform
1

these services. These associations are classified accord-ing to the predominant commodity or function, asindicated by their business volume.
Information on other types of service coopera-tives, such as Farm Credit System institutions, ruralcredit unions, rural electric cooperatives, and dairyherd improvement associations, is presented separately.
Organizational Membership Structures
CentralizedOf the 3,651 farmer cooperatives in 1998,3,546
were centralized organizations, mostly locals withindividual farmer-members. Centralized cooperativesusually serve a local area or community, county, orseveral counties. Most usually perform a limited num-ber of initial marketing functions. Most farm supplysales are at the retail level. A few centralized coopera-tives, principally regionals, operate over large geo-graphic areas and have members in several States.They often provide more vertically integrated services,such as processing farm products or manufacturingfeed and fertilizer.
Bargaining associations also have a centralizedorganizational structure. They derive all or most oftheir business volume from negotiating with distribu-tors, processors, and other buyers and sellers overprice, quantity, grade, terms of sale, and other factorsinvolved in marketing farm products. Only a few bar-gain to purchase farm supplies. While the primaryfunction of such an association is to bring buyers andsellers together to contract for the sale of members’products, many bargaining associations now performadditional functions.
For example, dairy bargaining associations at onetime only negotiated price. Now, many perform addi-tional functions, such as physically handling part ofthe milk for spot sales. They, like other dairy market-ing cooperatives, represent their members at Federalor State milk marketing order hearings.
FederatedFederated cooperatives comprise two or more
member associations organized to market farm prod-ucts, purchase production supplies, or perform bar-gaining functions.
The 63 federated associations often operate atpoints quite distant from their headquarters. Federatedcooperative members are usually local cooperatives,although some are interregional associations withregional cooperative members.
MixedA few cooperatives have both individual farmer-
members and autonomous cooperative members, acombination of centralized and federated structures.They serve large geographic areas, with members inmany States, and provide a variety of integrated ser-vices. RBS has identified 42 such cooperatives.
II-1 998 STATISTICS
Cooperatives’ net business volume was $104.7billion in 1998, down from $106.7 billion in 1997 andthe first drop in business volume since 1991. Netincome of $1.7 billion was down from $2.3 billion in1997, a drop of 24.7 percent. That was the lowestincome level since 1993 and well off the income recordof $2.36 billion set in 1995. Numbers of cooperatives
Table I- Number of cooperatives and memberships,by major business activity, 1998
Major business activity Cooperatives Memberships
Beans and peas, dry edible 8 2,872Cotton 15 41,255Dairy 228 92,892Fruits and vegetables 249 43,953Grains and oilseeds’ 964 728,694Livestock 80 161,515Nuts 18 46,029Poultry2 18 36,329Rice 17 12,865Sugar3 52 15,915Tobacco 26 172,823Wool and mohair 91 17,911
Miscellaneous 97 25,303
Total marketing 1,863 1,398,356
Farm supply 1,347 1,773,659
Service 441 180,562
Total 3,651 3,352,577
Number
1 Excludes cotton. Cottonseed sales were included with cotton. Cottonseed
meal and oil were included with feed and miscellaneous, respectively.
* Includes eggs, turkeys, ratite, squab. and related products.3 Includes beets, sugarcane, honey, and related products.
2

and memberships, at 3,651 and 3,352,577, respectively,were down. Combined assets, net worth, and liabilitieswere all up.
Number of CooperativesThe 1998 survey accounted for 3,651 marketing,
farm supply, and related-service* cooperatives, com-pared with 3,791 in 1997. The net decrease of 140associations (3.7 percent) largely reflects a continuingtrend involving dissolution, merger, or acquisition.The largest decrease was in grain and oilseed (grain)cooperatives (50), followed by farm supply (39). Woolcooperatives increased by three and nut, dry bean, andsugar each increased by one.
Of the 3,651 cooperatives, 1,863 primarily mar-keted farm products, 1,347 primarily handled farmproduction supplies, and 441 provided services relatedto marketing or purchasing activities (table 1).
Marketing cooperatives decreased slightly, from51.2 percent in 1997 to 51 percent of the total numberof cooperatives in 1998, while farm supply coopera-
’ Services include trucking, cotton ginning, storage, crop drying,artificial insemination, livestock shipping, and similar servicesaffecting the form, quality, or location of farm products andsupplies. They do not include credit, electric, telephone, or othersuch services not directly related to marketing or purchasingactivities.
tives increased slightly, from 36.6 to 36.9 percent.Related-service cooperatives decreased slightly, from12.2 to 12.1 percent.
These percentage changes to some extent reflectreclassification because of annual dollar volumechanges. In any given year, sales of farm supplies orgrains and oilseeds can be higher due to market sup-ply and demand conditions.
Cooperative numbers by marketing and farmsupply and service functions by State are shown intable 2. North Dakota is the leading State in marketingcooperatives (157), followed closely by Minnesota(155). Texas accounted for the largest number of farmsupply and service cooperatives.
The 10 leading States in terms of number of coop-eratives are shown in figure 1, which also shows thenumber of cooperatives by function in each State. Forexample, Minnesota had about the same number ofmarketing and farm supply cooperatives, while themajority in Texas were service cooperatives, mainlycotton gins. Wisconsin, the fifth leading State, had thelargest percentage of farm supply cooperatives.
Grain and Farm Supply BranchesMany cooperatives operate branch facilities to
better serve their members. Most are owned. Some areleased. A number are formerly independent coopera-tives serving a local community. For economic or other
Figure I- Number of Cooperatives by Function, Leading States, 1998
Numb350
300
250
200
150
100
50
ler
Service
SUPPlY
Marketing
MN ND TX IA WI IL CA KS SD NE
3

Table n-Number of cooperatives,1 by major function and State, 1998*
Major function
State
MarketingFarm Supplyand Service
Total
Alabama 10 5 3 63Arizona 5 5 10Arkansas 12 4 5 57California 116 7 0 186Colorado 29 2 3 52Florida 36 8 44Georgia 9 8 17Hawaii 22 7 29Idaho 24 16 40Illinois 127 69 196Indiana 27 31 58Iowa 136 68 204Kansas 122 22 144Kentucky 12 30 42Louisiana 18 32 50Maryland 3 17 20Massachusetts 10 6 16Michigan 38 30 68Minnesota 155 186 341Mississippi 19 59 78Missouri 27 46 73Montana 38 37 75Nebraska 75 47 122New Jersey 13 5 18New Mexico 4 5 9New York 82 17 99North Carolina 20 9 29North Dakota 157 126 283Ohio 63 25 88Oklahoma 45 50 95Oregon 25 14 39Pennsylvania 46 14 60South Dakota 66 73 139Tennessee 8 71” 79Texas 69 193 262Utah 10 8 18Virginia 22 41 63Washington 55 35 90West Virginia 14 13 27Wisconsin 40 158 198Wyoming 7 6 13Other States3 47 10 57
N u m b e r
United States 1 , 8 6 3 1 , 7 8 8 3,651
r Centralized and federated cooperatives and those with mixed organizational structures.2 Data covering operations of coopeTatives for fiscal years that ended in 1998.3 Includes States with fewer than three cooperatives for any function. States with at least three cooperatives were: Connecticut, 5; Delaware,
3; South Carolina, 8.
4

reasons, many were acquired by or merged with othercooperatives and operated as branches from which toserve members and patrons at outlying locations.
In 1998, grain and farm supply cooperativesoperated an estimated 5,617 branches-2,299 and3,318, respectively. There was an increase of 49 branch-es for grain cooperatives and an increase of 135branches for farm supply cooperatives. Both grainand farm supply cooperatives averaged 2.4 branchesper cooperative in 1998. In 1997, grain and farm sup-ply cooperatives operated an estimated 5,433 branches.
Figure 2 shows that several of the largest cooper-atives (mainly regional) had more branches than manysmaller (local) cooperatives combined. The 48 largestgrain cooperatives-5 percent of all grain coopera-tives-accounted for 31.1 percent of the total numberof branches operated by grain cooperatives. And the30 largest farm supply cooperatives had 1,672 branch-es, 50.4 percent of all farm supply branches.
MembershipsMemberships in marketing, farm supply, and
related-service cooperatives totaled an estimated3,352,577 in 1998, down 2.1 percent from 3,424,168 in1997 (table 1).
By the cooperative’s major business activity, 52.9percent were memberships of farm supply coopera-tives and 21.7 percent were of grain (figure 3). Dairycooperative memberships were only 2.8 percent ofcooperatives’ total memberships, but accounted for24.2 percent of cooperatives’ net business volume in1998, up from 21.9 percent in 1997.
Among marketing cooperatives, membershipsdecreased in 1998 for every type except sugar, nut,wool, poultry, and dry-edible bean cooperatives-allof which increased.
The largest proportions of memberships in farmsupply cooperatives were among the smallest andlargest cooperatives, as shown in figure 4.Memberships in marketing cooperatives were thegreatest proportion of total memberships among thosecooperatives with gross business volumes of $15 mil-lion to $250 million. When grouped by function andsize, the largest number of memberships was in thosecooperatives with a gross business volume of $15 mil-lion to $100 million.
EmployeesFarmer cooperatives, like other businesses,
employ full-time and, in many cases, part-time andseasonal employees to run their operations. The num-
Figure 2- Branches of Grain and Farm Supply Cooperatives by Size, 1998
Number
2,500 ,
B r a n c h e s
”
’Less than 5 5-9.9 1 o-24.9 25 and moreTotal Assets (million dollars)
5

Figure 3- Distribution of Memberships by Type of Cooperative, 1998
Other Marketing’ 2.2%
Livestock & Poultry
Fruit & Vegetable
Tobacco 5.2%
Dairy 2.8%
5.9%
1.3%
Percent based on 3,352,577 total memberships.’ Includes dry bean and pea, wool and mohair, rice, sugar, fishery, and other miscellaneous marketing cooperatives
Farm Supply 52.9%
Nut 1.4%
Service 5.4%
Cotton 1.2%
Grain & Oilseed 21.7%
Figure 4- Cooperative Memberships Grouped by Function and Gross Business Volume, 1998
1 . 0 0 0 M e m b e r s h i p s
1000
9 0 0
8 0 0
7 0 0
6 0 0
5 0 0
4 5 0
3 0 0
2 0 0
100
0Less than 5 100-249.9 250 and more
Service
Farm Supply
Marketing
Gross business volume (million dollars)

ber and type of employees hired depends on a numberof factors, such as size of operation, type of commodityhandled, and involvement in value-added activities.
In 1998, farmer cooperatives employed an esti-mated 265,590 full-time and part-time and seasonalemployees, down from 268,671 in 1997 (table 3). Bytype, marketing cooperatives had 185,135 employees(69.7 percent of total); farm supply cooperatives had66,506 employees (25 percent); and related-servicecooperatives had 13,949 employees (5.3 percent).
Among marketing cooperatives, those primarilyhandling fruits and vegetables had the most employ-ees (58,055), followed by livestock and poultry (41,807)and grain and oilseed (32,411).
Figure 5 shows the number of full-time and part-time and seasonal employees by type of cooperativefor 1998. Farm supply cooperatives used the mostemployees and rice cooperatives the fewest. Rice coop-eratives had the smallest proportion of total part-timeand seasonal employees. Related-service, followed byfruit and vegetable, cooperatives had the largest pro-portion of part-time and seasonal employees.
Full-time employees totaled 173,791 in 1998, upfrom 172,199 in 1997, or 0.9 percent. The number perassociation, however, was nearly 48, up from 45 in
1997, due both to fewer cooperatives and more full-time employees. The 1,863 marketing cooperativesemployed 120,069 persons, up 1.3 percent from 1997.Livestock and poultry cooperatives, with 28,031, hadthe most full-time employees, while dairy coopera-tives, with 27,056, ranked second. Together, theyaccounted for 45.9 percent of the full-time employeesof marketing cooperatives.
The 1,347 farm supply cooperatives employed48,171 persons on a full-time basis, up only 0.6 percentfrom the 47,870 reported for 1997. Full-time employeesof the 441 related-service cooperatives totaled 5,551 in1998, down from 5,850, or 5.1 percent.
Cooperatives used 91,799 part-time and seasonalemployees in 1998, down 4,673, or 4.8 percent, from1997. Cooperatives marketing fruits and vegetableshired an additional 2,796 part-time and seasonalemployees.
In 1998, marketing cooperatives reported 65,066part-time and seasonal employees, or 70.9 percent ofthe total. Number per cooperative averaged nearly 35.Fruit and vegetable and livestock and poultry coopera-tives, with 48,097, accounted for 73.9 percent. Farmsupply cooperatives had 18,355 part-time and seasonalemployees, an average of nearly 14. Many of the mar-
Table ZI- Full-time and part-time and seasonal employees of farmer cooperatives, by type of co-op, 1997-98
Principal product(s)marketed ormajor function
Full-time employees
1997 1998
Number
Part-time and seasonal 1
1997 1998
Products marketed:CottonDairyFruits & vegetablesGrains and oilseedsexcluding cottonseed
Livestock and poultryRiceSugarOther products*
1,995 1,844 643 1,05028,323 27,056 825 92522,847 23,734 31,525 34,321
23,53826,399
2,7133,4739,191
23,873 9,106 8,53828,031 17,477 13,776
2,655 226 2314,402 4,203 4,0528,474 2,826 2,173
Marketing 118,479 120,069 66,830 65,066
Farm supply 47,870 48,171 19,264 18,335
Total c 172,199 173,791 96,472
5,850 5.551 10.377 8,398
91,799
1 Number of part-time employees was estimated for all cooperatives based on the relationship of part-time to full-time employees for therespondent cooperaOves. Data for 1997 were revised. Totals may not add due to rounding.
2 Includes dry edible beans and peas, nuts, tobacco, wool, fishery, and miscellaneous marketing cooperatives.
7

Figure 5- Full-Time and Part-Time and Seasonal Employees, by Type of Cooperative, 1998
Rice
Cotton
Sugar
Other Marketing’
Service
Dairy
Grain & Oilseed
Livestock & Poultry
Fruit & Vegetable
Farm Supply
-7, F u l l - T i m e1
0 10 20 30 40 50 60 70
1,0001 Includes dry bean and pea, nut, tobacco, wool and mohair, fishery,
and other miscellaneous marketing cooperatives.
keting cooperatives needed more employees than didfarm supply cooperatives. For example, livestock andpoultry cooperatives averaged nearly 427 employees(figure 6).
Total Labor ExpenseOne of the largest expense items of any business
is wages and benefits. Cooperatives are no exception.Hiring employees full-time or part-time and seasonallyinvolves decisions on the number of employees andlevels of salaries and wages. Other employee-relatedexpenses include associated payroll taxes, insuranceexpenses, etc.
The average total labor expense per cooperativefor those reporting in both 1997 and 1998 is shown intable 4. Average total labor expense (including directorfees) is shown by type of cooperative and by assetgroup. This information can be used for comparing theaverage total labor expense of individual cooperativesof similar type and size. 2 For those where no size
* In a 1999 USDA survey of farmer cooperative statistics users, two-thirds of those responding thought the most useful information toadd to USDA’s statistics of farmer cooperatives would beinformation on wages and benefits.
grouping is shown, labor expense may not be a goodbarometer because of the mix of sizes included in thegroup.
Overall, total labor expense for the cooperativesreporting total wages and benefits both years was up3.1 percent. As shown in table 4, average total laborexpense varied from a decrease from 1997 to 1998 of16.3 percent for the small cotton gins (assets less than$500,000) to an increase of 15 percent for the related-service cooperatives. Also, average total labor expenseincreased as size of cooperative increased, especiallyfor some of the largest cooperatives. In most cases,these larger cooperatives are involved in processing ormanufacturing activities that are very labor intensive.
Total Sales Per Dollar of Labor ExpenseThe productivity of labor can be measured by
examining the relationship between total sales andtotal labor expense. Table 5 shows total sales per dollarof total labor expense by type and size of cooperative,where applicable.
Total sales per dollar of total labor expense is rel-atively high for cooperatives involved in bargaining(dairy) or operating auctions (tobacco and livestock).In these situations, total labor requirements are low
8

Figure 6- Average Number of Full-Time and Part-Time and Seasonal Employees, by Type ofCooperative, 1998
Service
Grain & Oilseed
Other’
Farm Supply
Dairy
Sugar
Rice
Cotton
Fruit & Vegetable
Livestock & Poultry
‘ime and Seasone
0 50 100 150 200 250 300
Number1 Includes dry bean and pea, nut, tobacco, wool and mohair, fishery,
and other miscellaneous marketing cooperatives.
and sales are high. Surveyed cooperatives reported thevalue of the product for which they bargained orwhich they auctioned off.
Dairy cooperatives with assets of $500,000 to $1million accounted for the highest sales per dollar oflabor expense, $216.12 (table 5). Other service coopera-tives with assets in the $1 million to $2.5 million rangehad the lowest sales per dollar of labor expense, $2.21.
Total sales per dollar of labor expense varies lessas the size of cooperatives becomes larger for grainand oilseed and farm supply cooperatives than it doesin differing sizes for dairy and fruit and vegetablecooperatives. Dairy cooperatives ranged from $23.91 to$216.12; fruit and vegetable cooperatives from $7.99 to$90.20; grain and oilseed cooperatives from $19.60 to$49.67; and farm supply cooperatives from $9.92 to$14.65.
Cooperative leaders may want to calculate theirtotal sales per dollar of total labor expense and com-pare it with the appropriate figure in table 5 to see howwell their cooperative is performing.
Business SizeMost farmer cooperatives, as measured by annual
gross business volume, are relatively small and serve
local areas. Several are actively seeking regional,national, and even international markets to increasebusiness volume. These larger cooperatives accountfor much of cooperatives’ business volume.
The increased size comes in part from mergers,consolidations, and acquisitions. Data used were notadjusted for changes in price levels, and some sizechanges resulted from inflation.
In 1998,75.3 percent of all farmer cooperativesreported a business volume of less than $15 million.However, they accounted for only 9.9 percent of thetotal gross dollar volume (table 6 and figure 7). Only1.7 percent of farmer cooperatives reported a businessvolume of at least $250 million, but they accounted for59.2 percent of the total sales, down from 60.5 percentin 1997.
Business VolumeTotal gross business volume of the 3,651 market-
ing, farm supply, and related-service cooperatives for1998 was $121 billion (table 7), down 4.5 percent from$126.7 billion in 1997.
Total net business volume of farmer cooperativesin 1998 was $104.7 billion, $76.6 billion from farmproducts marketed, $24.6 billion from farm supply
9

Table S-Average total labor expense for cooperatives reporting, by selected type and size, 1997-98
Type of co-opand asset group (Ml. Dol.)
Average total labor expense
1997 1998 Change
Dry bean and pea 2,557Cotton 4,154
Dairy 2,778 2,997 7.9Less than 0.5 20 20 -.7
0.5 - .99 153 152 -.51.0 - 2.49 175 177 1.52.5 - 24.99 1,528 1,592 4.3
25.0 - 99.99 10,998 12,167 10.6
Fruit and vegetable 5,984 6,238 4.6Less than 0.5 70 71 .6
0.5 - .99 311 312 .21.0 - 2.49 355 332 -6.32.5 - 24.99 2,148 2,150 .2
25.0 - 99.99 9,231 9,384 1.7100.0 and more 53,972 57,391 6.3
Fruit and vegetable 5,964 6,238 4.6Fresh only 1,348 1,394 3.4Processed only 25,628 25,660 .lFresh and processed 12,943 14,404 11.3
Grain and oilseed 1,228 1,303 6.1Less than 0.5 56 55 -2.0
0.5 - .99 117 122 3.91.0 - 2.49 219 226 3.12.5 - 24.99 999 1,050 5.1
25.0 - 99.99 3,446 3,795 10.1100.0 and more 30,530 32,390 6.1
Livestock 1,207 1,122 -7.0Nut 11,806 12,874 9.0Pouttry 54,513 49,808 -8.6Rice 22,718 23,029 1.4Sugar 22,349 22,183 -.7Tobacco 151 139 -8.2Fishery 5,598 5,813 3.8Miscellaneous marketing 20,646 20,618 -.l
Farm supply 1,691 1,774 4.9Less than 0.5 73 74 0.9
0.5 - .99 161 167 4.11.0 - 2.49 307 319 3.82.5 - 24.99 1,241 1,295 4.3
25.0 - 99.99 5,126 5,818 13.5100.0 and more 65,893 68,882 4.5
Cotton gin 361 398 10.1Less than 0.5 107 89 -16.3
0.5 - .99 208 216 3.71.0 - 2.49 282 317 12.22.5 - 24.99 643 716 11.3
Service 1,478 1,699 15.0
$1,000
2,9254,062
Percent
14.4-2.2
1 Includes wages and salaries, payroll taxes, employee benefits, and director fees.
10

Tables- Total sales per dollar of total labor expense for cooperatives reporting, by selected typeand size 1998
Type of coopand asset group
Sales per$1 laborexpense’
Type of cc-cpand asset group
-Sales per$1 laborexpense’
Million Dollars Dollars Million Dollars Dollars
Dry bean and pea 15.48Cotton 38.58
Dairy 31.29Less than 0.5 139.590.5 - .99 216.121.0 - 2.49 170.752.5 - 24.99 61.47
25.00 - 99.99 23.91100.0 and more 25.77
Fruit and vegetable 9.52Less than 0.5 90.200.5 - .99 29.291 .o - 2.49 58.842.5 - 24.99 12.87
25.0 - 99.99 9.15100.0 and more 7.99
Fruit and vegetable 9.52Fresh only 14.18Processed only 8.78Fresh and processed 7.03
Grain and oilseed 28.68Less than 0.5 19.600.5 - .99 27.961 .o - 2.49 29.342.5 - 24.99 24.04
25.0 - 99.99 24.11100.0 and more 49.67
Livestock 91.97Nut 10.29Poultry 10.04Rice 12.97Sugar 7.96Tobacco 85.80Fishery 7.16Misc. Marketing 19.49
Farm supply 12.54Less than 0.5 13.050.5 - .99 9.921.0 - 2.49 11.142.5 - 24.99 10.62
25.00 - 99.99 12.89100.0 and more 14.65
Cotton gin 7.96Less than 0.5 10.190.5 - .99 6.731 .o - 2.49 8.092.5 - 24.99 8.02
Other service 2.24Less than 0.5 2.810.5 - .99 2.601.0 - 2.49 2.21
1 Includes wages and salaries, payroll taxes, employee benefits, and director fees.
11

Table 6- Farmer cooperatives and memberships, by gross business volume, 1998’
Volume group
(mil. dol.)
Cooperatives Dollar volume Memberships3
Number Percent of total Gross’ (mil. dol.) Percent of total Number (1,000) Percent of total
Less than 5.0 1,769 48.5 3,331 2.8 690 20.6
5 - 9.9 667 18.3 4,706 3.9 463 13.8
1 - 14.9 315 8.6 3,832 3.2 275 8.2
15 - 24.9 335 9.2 6,381 5.3 314 9.4
25 - 49.9 293 8.0 9,998 8.3 426 12.7
50 - 99.9 146 4.0 10,195 8.4 248 7.4
100 - 199.9 44 1.2 6,295 5.2 123 3.7
200 - 249.9 21 0.6 4,661 3.9 35 1.0
250 - 499.9 24 0.7 8,265 6.8 165 4.9
500 - 999.9 21 0.6 14,601 12.1 115 3.4
1,000 and more 16 0.4 48,696 40.3 498 14.9
Total4 3,651 100.0 120,961 100.0 3,353 100.0
1 Business volume includes revenues from marketing plus the value of products bargained for or handled on a commission basis, supplysales, service receipts, and other income.
2 Includes intercooperative business volume.3 Includes number of farmers, ranchers, and fishermen eligible to vote for directors. Does not include memberships held by other cooperatives,
such as local cooperative memberships in regional cooperatives.4 Totals may not add due to rounding.
Figure 7- Distribution of Farmer Cooperatives and Gross Business Volume, by Size, 1998
Percent
6 0
5 0
4 0
3 0
2 0
10
0
I r 1
Dollar Volume
Less than 5 5-9.9 1 o-1 4.9 15-99.9 100-249.9 250 or more
Gross business volume (million dollars)
12

sales, and nearly $3.5 billion from services performedand from other income sources. The total net figure (thedifference between gross and net business volumes),which excludes intercooperative business, was downfrom $106.7 billion set in 1997. However, adjusting forprice change, net business volume actually increased 5.4percent3, due to both lower commodity prices andlower prices paid for production items in 1998.
3 Deflated 1997 cooperative business volume was $109.4 billion, up 3percent from the actual $106.2 billion in 1996. The $109.4 billion wasderived by deflating farm products marketed by indices of pricesreceived for all farm products and farm supplies (inputs) and serviceincome by the index of prices paid by farmers for production items.
Gross volume of farm products marketed bycooperatives decreased 1.7 percent, from $85.9 billionin 1997 to $84.5 billion in 1998, due mainly to a 12-per-cent decrease in grain and oilseed marketings. The netvolume of farm products marketed was $76.6 billion,or 73.2 percent of the total net volume of all coopera-tives, down 1.5 percent from $77.8 billion in 1997.
Figure 8 illustrates the leading products market-ed by cooperatives based on net marketing businessvolume. Dairy (milk and milk products) led with 33percent, followed by grains and oilseeds (excludingcottonseed) with 27.8 percent, and fruits and vegeta-bles with 12.2 percent. The proportions of milk and
Table 7- Cooperatives’ gross and net business volumes by commodity, 1998 l
Commodity Gross volume Net volume
Products marketed:Beans and peas (dry edible)CottonDairyFruits and vegetablesGrains and oilseeds,excluding cottonseed
LivestockNutsPoultry3RiceSugarTobaccoWool and mohairMiscellaneous 4
Total farm products 64,523.g 69.9 76.642.0 73.2
Supplies purchased:Crop protectantsFeedFertilizerPetroleumSeedOther supplies5
4,078.67,186.47,764.48,767.71,019.84,147.0
3.45.96.47.3
::t
3,165.7 3.05,405.3 5.25,170.3 4.96,616.3 6.3
731.8 0.73,462.0 3.3
Total farm supplies 32,963.8 27.3 24,551.4 23.5
Services provided: Trucking,cotton ginning,storage, grinding,locker plants, misc.B 3,473.2 2.9 3,473.2 3.3
Total business 120,960.g 100.0 104,666.6 100.0
Million dollars Percent Million dollars Percent
187.3 0.2 187.2 0.23,004.4 2.5 2,961 .l 2.8
27,807.6 23.0 25,329.4 24.29,903.8 8.2 9.391.2 9.0
25,338.g7,575.0
900.72,137.3
932.02,681 .l
348.511.3
3,696.l
21 .o6.3
.71.8
E0:3(213.1
21,290.g 20.37,418.1 7.1
900.7 .92,137.3 2.0
932.0 0.92,444.7 2.3
348.5 0.36.8 (2)
3,294.2 3.2
1 Gross includes and net excludes intercooperative business. Totals may not add due to rounding.* Less than 0.05 percent.3 Includes eggs, turkeys, ratite, squab, and related products.4 Includes coffee, fish, forest products, hay, hops, seed marketed for growers, nursery stock, other farm products not separately classified, and
sales of farm products not received directly from member-patrons. Also includes manufactured food products and resale items marketed bycooperatives.
5 Includes building materials, containers and packaging supplies, farm machinery and equipment, meats and groceries, automotive supplies,hardware, chicks, and other supplies not separately classified.
6 Charges for services related to marketing or purchasing not included in the volume reported for those activities, plus other income.
13

Figure 8- Relative Importance of Farm Products Marketed by Cooperatives, 1998
Cotton 3.9%
Sugar 3.2%
Other Marketingsl4.5% ~
Nuts 1.2%
Grains & Oilseeds 27.8%
Livestock 9.7% -
Fruits & Vegetables 12.2% -
Tobacco 0.5%
Poultry 2.8%
-Milk & Milk Products 33.0%
Percent based on a net marketing business volume of $76.6 billion.* Includes dry beans and peas, wool and mohair, fish, and miscellaneous marketings.
milk products and fruits and vegetables were up com-pared with 1997, because of a significant drop in coop-eratives’ grain business volume in 1998.
Gross volume of all farm supplies handled by coop-eratives was $33 billion, down 11.1 percent from $37.1 bil-lion in 1997. Net farm supply volume of nearly $24.6 bil-lion, down 2.5 percent from $25.2 billion, accounted for23.5 percent of the total net business volume.
The leading farm production supplies handled bycooperatives in terms of net business volume werepetroleum, 26.9 percent; feed, 22 percent; and fertilizer,21.1 percent (figure 9). While sales of “other” supplies,seed, and crop protectants were up in 1998, feed, fertil-izer, and petroleum were down.
Receipts for services provided by marketing,farm supply, and related-service cooperatives, plusother income, were down 4.8 percent to $3.5 billion.Service receipts and other income represented 3.3 per-cent of total net business volume.
Net IncomeTotal net income (adjusted for losses and before
taxes) for all cooperatives in 1998 was $1.7 billion,including intercooperative dividends and refunds(table 8). Cooperatives operating strictly on a pooling
basis were excluded. Net income was down 24.7 per-cent from the $2.3 billion in 1997. Patronage refundsreceived from other cooperatives, including CoBankand the St. Paul Bank for Cooperatives, totaled $573million, down 24.3 percent from $757.1 million in1997.
Marketing cooperatives’ total net income of$1,017.5 million was down 22.5 percent from the$1,313.3 million generated in 1997. Losses by poultry,fruit and vegetable, sugar, and miscellaneous market-ing cooperatives were the major factor. Grain andoilseed (43.4 percent) and dairy (43.9 percent) coopera-tives together accounted for most (87.3 percent) ofmarketing cooperatives’ net income and a majority (51percent) of total net income (figure 10).
Total net income of farm supply cooperatives was$578.8 million in 1998, down 30.6 percent from $834.6million in 1997. And they accounted for 33.2 percent ofcooperatives’ total net income in 1998, compared with36.1 percent in 1997. Income from their own opera-tions, excluding patronage refunds from other cooper-atives, CoBank, and the St. Paul Bank forCooperatives, was $301.6 million, down 37.3 percentfrom $480.8 million in 1997.
14

Figure 9- Relative Importance of Farm Supplies Handled by Cooperatives, 1998
Otlier Supplies’ 14.1%
Seed 3.0%
Petroleum 26.9%
Crop Protectants 12.9%
Feed 22.0%
Fertilizer 21 .l%
Percent based on a net farm supply business volume of $24.6 billion.1 Includes building materials; tires, batteries, and accessories; equipment; animal health products; pet food; semen; hardware; food; clothing; etc.
Table 8- Farmer COOperStiVeS’ net hICOme 19981
Principal product(s) marketedand major function
Products marketed:CottonDairyFruits & vegetablesGrains and oilseeds
excluding cottonseedLivestock and poultryRiceSugarOther products3
co-ops’
Number
15228249
964981752
240
Total Income from Income fromnet income own operations other co-ops’
- - - - - - - - - - Milliondollars - - - - - - - - - -
64.0 60.7 3.4447.2 414.9 32.3
76.9 61.3 15.6
441.4 241.3 200.1-71.2 -80.0 8.8
7.3 5.4 1.9-12.1 -15.5 3.464.0 60.2 3.9
Total marketing 1,863 1 ,017.5 748.2Total farm supply 1,347 578.8 301.6Total related-service 441 146.0 119.5
Combined total 3,651 1,742.3 1,169.3
1 Includes number of cooperatives operating on a strictly pooling basis, but not their pool proceeds.* Includes patronage refunds from CoBank and the St. Paul Bank for Cooperatives.3 Includes dry edible beans and peas, nuts, tobacco, wool, and miscellaneous products.
269.3277.2
26.5
573.0
15

Figure IO- Total Net Income or Loss by Cooperative Type, 1998
Livestock & Poultry
Sugar
Rice
Cotton
Other Marketing2
Fruit and Vegetable
Service
Grain & Oilseed
Dairy
Farm Supply
c Frdm Own Opeiations/ I I
-100 0 100 200 300 400 500 600
i Includes dividends and patronage refunds from other farmer cooperatives, CoBank, and the St. Paul Bank for Cooperatives.
* Includes drv bean and oea. nut. tobacco. wool and mohair. fisherv. and other miscellaneous marketina coooeratives.
Farmer cooperatives’ net income from own oper-ations in 1998 totaled $1,169.3 million, down 24.9 per-cent from $1,557.2 million. Nearly 32.9 percent, or $573million, of total net income ($1,742.3 million) was gen-erated by other cooperatives, CoBank, and the St. PaulBank for Cooperatives, down 24.3 percent from $757.1in 1997. However, the proportion generated by othercooperatives in 1997 was about the same, 32.7 percent.Marketing cooperatives’ net income from other coop-eratives, including CoBank and the St. Paul Bank forCooperatives, totaled $269.3 million and accounted for26.5 percent of their total, down from $368.8 millionand 28.1 percent in 1997. Grain cooperatives’ netincome from other cooperatives totaled $200.1 million,or 45.3 percent of their total, down from $233.6 million,or 53.5 percent in 1997.
Income before adjusting for losses was !$2,122.2million. Losses by an estimated 601 cooperativestotaled $379.9 million in 1998, up from $162.8 millionin 1997. Number of cooperatives with losses was upsignificantly, from 506 to 601. The increased lossescame from marketing and related-service cooperatives.
Marketing cooperative losses totaled $338 millionin 1998, compared to $119.5 million in 1997. Related-service cooperative losses totaled $20.6 million, com-
pared with $4.8 million. Losses among farm supplycooperatives were down, $21.3 million versus $38.5million in 1997.
Balance SheetCombined assets for all farmer cooperatives
totaled nearly $46.6 billion in 1998, up 5.8 percent from$44 billion in 1997 (table 9). Assets of cooperatives,excluding intercooperative investments, were up 6.2percent to $41.9 billion, compared with $39.4 billion in1997.
Total liabilities were $26.6 billion, up 4.5 percentfrom $25.5 billion in 1997. Net worth, or member andpatron equity, was $20 billion, up 7.6 percent from$18.5 billion in 1997. The proportion of total assetsfinanced by member and patron equity increased to42.9 percent from 42.1 percent.
Net worth, or member and patron equity, for allmarketing cooperatives totaled $12.7 billion, up 7.5percent from 1997. Marketing cooperatives accountedfor 63.4 percent of farmer cooperatives’ combined networth, down slightly from 63.5 percent in 1997. Thenet worth figure for farm supply cooperatives was 33.9percent of the total, up from 33.5 percent. For market-ing cooperatives, the highest percentage of total assetsrepresented by net worth shown in figure 11 (50.6 per-
16
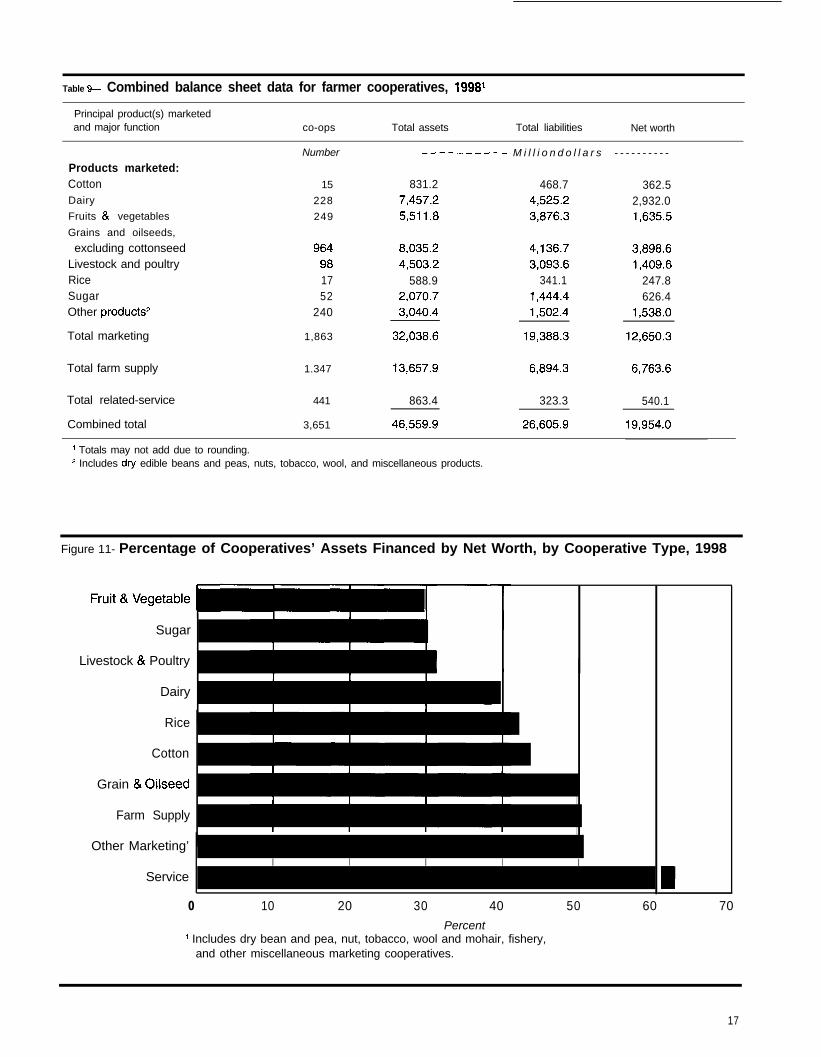
Table CL Combined balance sheet data for farmer cooperatives, 1998’
Principal product(s) marketedand major function co-ops Total assets Total liabilities Net worth
Products marketed:CottonDairy
Fruits & vegetables
Grains and oilseeds,
excluding cottonseedLivestock and poultryRiceSugarOther products2
15 831.2 468.7 362.5228 7,457.2 4,525.2 2,932.0249 5,511.8 3,876.3 1,635.5
964981752
240
Total marketing 1,863
Total farm supply 1.347 13,657.g 6,894.3 6,763.6
Total related-service 441
Combined total 3,651
Number ---------- M i l l i o n d o l l a r s - - - - - - - - - -
8,035.2 4,136.7 3,898.64,503.2 3,093.6 1,409.6
588.9 341.1 247.82,070.7 1,444.4 626.43,040.4 1,502.4 1,538.O
32,038.6 19,388.3 12,650.3
863.4 323.3 540.1
46,559.g 26,605.g 19,954.o
1 Totals may not add due to rounding.* Includes dry edible beans and peas, nuts, tobacco, wool, and miscellaneous products.
Figure 11- Percentage of Cooperatives’ Assets Financed by Net Worth, by Cooperative Type, 1998
Sugar
Livestock & Poultry
Dairy
Rice
Cotton
Grain & Oilseed
Farm Supply
Other Marketing’
ServiceI I I I I
0 10 20 30 40 50 60 70
Percent1 Includes dry bean and pea, nut, tobacco, wool and mohair, fishery,
and other miscellaneous marketing cooperatives.
17

cent) was for those marketing primarily “other” prod-ucts. The lowest, 29.7 percent, was for cooperativesmarketing primarily fruits and vegetables. Marketingand farm supply cooperatives had 39.5 percent and49.5 percent, respectively, of their assets financed bynet worth. Both were up from 1997.
Of the $46.6 billion in total assets, marketingcooperatives accounted for $32 billion, up 5.9 percentfrom 1997. Cooperatives primarily handling grainsand oilseeds (excluding cottonseed) had total assets of$8 billion in 1998, slightly up from nearly $8 billion in1997. Among the marketing cooperatives, those withprimarily grain also maintained the largest proportionof their assets as investments in other cooperatives inboth 1998 (15.5 percent) and 1997 (14.6 percent). Dairycooperatives had 9.6 percent of their assets invested inother cooperatives (table 10).
Assets of marketing cooperatives, excludinginvestments in other cooperatives, CoBank and the St.Paul Bank for Cooperatives, were $29.5 billion, up 5.9percent from $27.8 billion in 1997.
Farm supply cooperatives had total assets of$13.7 billion, compared with $12.9 billion in 1997, up6.1 percent. Excluding intercooperative investments,assets were up 7.6 percent to $11.7 billion from 10.8 bil-lion in 1997.
Selected Financial RatiosFinancial ratios express relationships between
items in the financial and income statements of a busi-ness operation and help in analyzing a cooperative’seconomic and financial situation.
Financial ratios can indicate problem areas. Whilethey can’t solve problems, they can serve as guidelinesfor planning and aid in formulating actions. Care mustbe taken in their use because both items used to calcu-late a ratio are subject to considerable variation. Ratiointerpretation is largely subjective.
Five financial ratios were selected to give someindication of cooperative performance or financial con-dition-return on assets, net worth-to-assets, return onsales, total sales-to-assets, and the current ratio.
The return on assets and return on sales ratiosindicate profitability. The net worth-to-assets ratioshows a cooperative’s ability to meet long-term finan-cial obligations. The total sales-to-asset ratio (assetturnover ratio) indicates how efficiently a cooperativeis using its assets. The current ratio (current assetsdivided by current liabilities) best measures a coopera-tive’s ability to meet short-run obligations.
Table 11 lists the values of these ratios for thecooperatives reporting to RBS. Extreme high and lowvalues were excluded so those used would be more
Table IO- Combined assets for farmer cooperatives, 1998’
Principal product(s)marketed andmajor function
co-ops2 Assets of own Investments in Totaloperations other co-ops 3 assets
Investments inother co-ops aspercent of total
Products marketed:CottonDairyFruits & vegetablesGrains and oilseeds
excluding cottonseedLivestock and poultryRiceSugarOther products4
15 803.7 27.5 831.2 3.3228 6,744.3 712.9 7,457.2 9.6249 5.329.2 182.5 5,511.8 3.3
964981752
240
Total farm products 1,863Total farm supplies 1,347Total selected services 441
Combined total 3,651
Number ---------- Milliondollars---------- Percent
6,787.g 1,247.3 8,035.24,205.l 298.1 4,503.2573.4 15.5 588.9
2,029.l 41.7 2,070.72,978.2 62.2 3,040.4
29,451.0 2,587.6 32,038.611,657.g 2,000.0 13,657.g
774.7 88.7 863.4
41,883.6 4,676.3 46,559.g
15.56.62.62.02.0
8.114.610.3
10.0
1 Totals may not add due to rounding.* Many cooperatives have multiproduct and multifunctional operations. Most are classified according to predominant commodity or function,
as indicated by business volume.3 Also includes investments in CoBank and the St. Paul Bank for Cooperatives.4 Includes dry edible beans and peas, nuts, tobacco, wool, and miscellaneous products.
18

Table I I- Selected financial ratios for cooperatives, 1998’
Type of co-op Return Net worthand asset group (mil. dol.) on asset.9 to assets3
Returnon sale.9
Salesto assets 4
Currentratio5
---a-Number-----
Cotton 7.7 43.3 2.1 3.7 1.4Less than 25 8.4 35.4 2.7 3.1 1.4$25 - 99.99 1.5 48.3 0.3 5.2 1.6$100.0 and more 9.6 42.9 2.9 3.3 1.3
Dairy 5.9 39.5 1.6 3.7 1.3Less than $O.V 2.8 60.9 0.5 5.3 1.9$0.5 - $.99 7.1 57.3 1.4 4.9 1.9$1 .o - $2.49 4.8 55.2 0.9 5.2 1.5$2.5 - $24.99 7.0 33.8 1.1 6.4 1.2$25.0 - $99.99 9.0 38.0 1.7 5.3 1.2$100.0 and more 5.4 39.9 1.6 3.4 1.3
Fruit and vegetable 2.6 29.0 1.4 1.9 1.3Less than $0.5 8.1 53.7 0.5 15.8 1.7$0.5 - $.99 6.8 67.9 1.9 3.5 2.3$1 .o - $2.49 6.8 58.3 1.7 4.0 1.6$2.5 - $24.99 10.7 42.5 2.8 3.8 1.2$25.0 - $99.99 1.4 27.4 0.8 1.7 1.1$100.0 and more 2.6 29.0 1.4 1.9 1.3
Grain and oilseed 5.6 48.6 1.7 3.3 1.3Less than $0.5 -0.3 87.7 -0.1 4.5 5.1$0.5 - $.99 5.7 78.0 1.4 4.0 3.2$1 .o - $2.49 4.5 66.8 1.2 3.7 1.9$2.5 - $24.99 5.7 52.7 1.9 3.0 1.3$25.0 - $99.99 5.2 43.3 2.0 2.6 1.2$100.0 and more 6.0 40.3 1.2 5.0 1.1
Livestock 1.8 32.7 0.5 3.4 1.3Less than $2.49 2.2 76.5 0.1 16.1 2.7$2.5 - $24.99 1.4 26.7 0.1 9.8 1.2$25.0 and more 1.8 32.8 0.6 3.2 1.3
Nut 1.7 38.4 1.0 1.8 1.7Poultly -11.6 22.8 -3.9 3.0 1.3Rice 1.3 44.3 0.6 2.3 1.4Sugar -0.7 36.8 -0.7 1.0 1.2Tobacco 1.4 25.8 ‘i.6 0.8 1.1Misc. marketing 1.6 52.9 0.7 2.3 1.5Fishery -0.2 48.8 -0.1 2.3 1.3
Farm supply 4.0 47.8 2.4 1.7 1.5Less than $0.5 1.2 73.2 0.3 3.8 2.7$0.5 - $.99 4.0 75.0 1.9 2.1 2.9$1 .o - $2.49 5.2 71.3 2.5 2.1 2.3$2.5 - $24.99 6.1 59.9 3.0 2.0 1.5$25.0 - $99.99 5.6 45.2 2.6 2.1 1.3$100.0 - $499.99 3.6 43.8 ‘1.5 2.4 1.4$500.0 and more 3.0 42.9 2.4 1.3 1.4
Artificial insemination 8.5 76.9 7.2 1.2 3.0
Continued
19

Table I I- Selected finanCiSl ratios for COOperatiVeS, 1998l(continued)
Type of co-opand asset group (mil. dol.)
Cotton ginsLess than $0.5$0.5 - $.99$1 .o - $2.49$2.5 and more
Return Net worth Returnon assets2 to assets3 on sales4
-_---__---Percent---------_
20.1 59.7 14.45.1 30.8 1.3
11.9 65.0 6.916.7 66.9 10.422.7 56.2 18.2
Sales Currentto assets4 ratio5
_____ Number ____ -
1.4 1.34.0 2.01.7 1.61.6 1.71.2 1.2
Other services 14.6 57.6 17.1 0.9 1.5Less than $0.5 9.7 91.9 7.2 1.4 6.5$0.5 - $.99 6.8 58.1 6.0 1.1 1.6$1 .o - $2.49 13.3 55.9 10.5 1.3 1.7$2.5 and more 16.1 55.6 24.9 .6 1.2
1 Based on cooperatives reporting. Excludes strictly pooling cooperatives. Ratios were calculated by summing the individual items anddividing. The same cooperatives were included in each group to calculate all five ratios. Outliers (extreme values) not representative of thegroup were excluded.
x Includes net income before any income taxes are deducted. Calculated by dividing net income by total assets. Usually referred to as thereturn on assets.
3 Net worth, or member equity, is the book value of the assets owned by members. The ratio was calculated by dividing total net worth by totalassets.
4 Total sales includes service receipts, other income, and patronage refunds received from other cooperatives, CoBank. and the St. Paul Bankfor Cooperatives. The return on sales was found by dividing net income by total sales.
5 The current ratio was derived by dividing current assets by current liabilities. These data were taken from annual reports where provided.* Includes bargaining cooperatives.7 Excludes cottonseed.* Includes cooperatives providing primarily services related to storage, transportation, livestock shipping, and rice drying.
representative of the cooperatives reporting. Ratios are The return on sales (net income/total sales)also shown by selected asset category for those cooper- ranged from a negative 3.9 percent for poultry cooper-atives where sufficient information was available. atives to a high of 24.9 percent for the largest “other”These ratios offer cooperative leaders a general barom- service cooperatives. Few cooperatives generated aeter to use in comparing their operations with others return on sales above 3 percent (only 10 of the 55of the same type (and/or size). groups shown in table 11).
The return on assets (net income/assets) variedconsiderably. It was negative for poultry, sugar, fish-ery, and small grain cooperatives. The ratio (20.1) washighest for cotton ginning cooperatives. By size group,fruit and vegetable and farm supply cooperatives withassets in the range of $2.5 million to $24.9 million hadthe largest return on assets. For dairy, it was highestfor those cooperatives with assets of $25 million to$99.9 million. Among grain cooperatives, the largestreturn came from the largest cooperatives.
The net worth-to-assets ratio ranged from a lowof 22.8 percent for poultry cooperatives to a high of91.9 percent for the smallest “other” service coopera-tives. Generally, as cooperatives become larger and/ordo more processing, a declining percentage of theirassets is financed by members,,resulting in a lower networth-to-assets ratio.
The sales-to-assets ratio ranged from a high of16.1 for the small livestock cooperatives to a low of 0.6for the largest “other” service cooperatives. Amongfruit and vegetable, grain, livestock, and cotton gin-ning cooperatives, the ratio tended to decrease as sizeof cooperative increased. Generally, this reflects thelarge investment in processing or manufacturingequipment typical of the larger dairy and fruit andvegetable cooperatives. The sales-to-assets ratios forfarm supply cooperatives did not vary much with sizeof the cooperative. Most of these cooperatives are lessinvolved in manufacturing or processing than the larg-er marketing cooperatives.
The generally high sales-to-assets ratios for thesmaller cooperatives, as well as for some types ofcooperatives, is due to bargaining activity or othermarketing functions not requiring major investmentsin plant and equipment.
20

The current ratio (current assets/current liabili-ties) ranged from a low of 1.1 for fruit and vegetablecooperatives with assets of $25 million to $99.9 million,the largest grain cooperatives, and tobacco coopera-tives to 5.1 for the smallest grain and oilseed coopera-tives. Smaller cooperatives’ current liabilities are gen-erally low, but become larger in relation to currentassets as business grows.
Table 12-Number of farmer cooperatives, 1989-98
Period 1 Marketing Farm supply Service Total
Number
1989 2,550 1,803 446 4,7991990 2,519 1,717 427 4,6631991 2,384 1,689 421 4,4941992 2,218 1,618 479 4,3151993 2,214 1,547 483 4,2441994 2,173 1,496 505 4,1741995 2,074 1,458 474 4,0061996 2,012 1,403 469 3,8841997 1,941 1,386 464 3,7911998 1,863 1,347 441 3,651
1 For years before 1989, see Cooperative Historical Statistics, CIR1, Section 26, USDA, Revised April 1998. Cotton ginningcooperatives, livestock shipping associations, and rice dryingcooperatives were reclassified from marketing to service in 1989,1992, and 1993, respectively.
III-Cooperative Trends, 1989-98
Although the number of cooperatives decreasedduring the past decade, their business volumeincreased until recent years. Cooperatives continue toadjust to the changing economic environment throughdissolution, merger, consolidation, acquisition, and thesale of assets. In some cases, farmers organized new-generation cooperatives to become involved in value-added activities. In 1989, the net business volume of4,799 cooperatives totaled $72.1 billion. A decade later,that volume generated by 3,651 cooperatives was$104.7 billion.
Number of CooperativesThe total number of marketing, farm supply, and
related-service cooperatives declined from 4,799 in1989 to 3,651 in 1998 (table 12 and figure 12).Marketing cooperatives declined from 2,550 to 1,863and farm supply cooperatives from 1,803 to 1,347.Number of service cooperatives decreased from 446 to441.
From 1989 through 1998,1,796 cooperatives(about 180 per year), were removed from RBS’ list offarmer cooperatives. Of those, 40.1 percent were dis-
Figure 12- Farmer Cooperatives in the United States, 1989-98
Number
3,500
3,000
Marketing
Farm Supply
500Service
01 I I I I I I I I I I
’1989 90 91 92 93 94 95 96 97 98
21

solved, 33.5 percent were merged or consolidated, 15percent were acquired by other cooperatives orinvestor-owned firms, and the remaining 11.4 percentwere removed for other reasons (figure 13).
Even while cooperatives were disappearing fromRBS’ list, new ones or ones not previously on the listwere added. From 1989 through 1998,524 cooperatives(about 52 per year) were added. During 1998,55 coop-eratives were added to RBS’ list of cooperatives, thelargest increase since 1993 when 65 were added.
Grain and Farm Supply BranchesIn 1992,2,861 grain and farm supply cooperatives
had an estimated 4,644 branches, 1,867 owned by graincooperatives and 2,777 by farm supply cooperatives. In1998, grain and farm supply cooperative numbersdropped to 2,311, but branches had increased to 5,617(table 13 and figure 14).
Average number of branches per cooperative was1.6 in 1992 and 2.4 in 1998. Larger cooperativesaccounted for the most branches, particularly amongthe farm supply cooperatives. For cooperatives with
assets of $25 million or more in 1998,30 farm supplycooperatives had an estimated 1,672 branches and 48grain cooperatives had 716 branches.
MembershipsMemberships in farmer cooperatives, 4.1 million
in 1989, dropped to 3.4 million in 1998 (table 14 andfigure 15). The long-term decline, in part, reflects thedecreasing number of farms and farmers in the UnitedStates. Many farmers are members of more than onecooperative and each membership is counted.Consequently, number of memberships exceeds thenumber of farmers. Total membership duplication can-not be eliminated with current reporting methods.
Member classification depends on the type ofcooperative used and may not be related to the mem-ber’s product(s) marketed or supplies purchased. Forexample, a member may use a cooperative to marketonly one of the farm products handled by the coopera-tive, or a member may use a cooperative classified inthe marketing group to purchase one or more produc-tion items. A member’s business with the cooperative,therefore, may not be in the group that represents thecooperative’s major business volume (the criterion for
Figure 13- Cooperatives Removed from RBS’ List, 1989-98
Number
80
60
Merger
Dissolution
AcquisitionOther
1989 90 91 92 93 94 95 96 97 98
Based on a list of U.S. farmer cooperatives maintained by RBS. Mergers also include consolidations. Other includes cooperativesdropped due to inactivity and unknown and miscellaneous reasons.
22

classifying cooperatives in this report). The member-ship, however, will be included arbitrarily in that clas-sification.
During the past decade, memberships in related-service and marketing cooperatives decreased at near-ly twice the rate of memberships in farm supply coop-eratives. Memberships in marketing cooperativesdropped 458,000, or 24.7 percent, while membershipsin farm supply cooperatives decreased 261,000, or 12.8percent.
EmployeesFarmer cooperatives had an estimated 173,791
full-time employees in 1998, up from 172,199 in 1997,but still down from the 1995 peak of 175,399 (table 15).In 1997, it appeared that the number of full-time
employees was declining in marketing cooperativesand increasing in farm supply cooperatives, but 1998survey results showed employee numbers were up inmarketing and farm supply cooperatives, but down inrelated-service cooperatives.
Overall, total number of full-time employeesaveraged 174,241 from 1994 to 1998. Although thenumber of full-time employees was up in 1998, it wasstill below the five-year average. The major changeduring this period was the significant increase in num-ber of full-time employees by the miscellaneous mar-keting cooperatives, from 5,795 in 1994 to 9,191 in1997.
Table IS- Estimated number of branches operated by grain and farm supply cooperatives, 1992-98
Asset Group (million dollars)
Year Lessthan 5 5- 9.9 10 - 24.9 250r more Total
1992 9021993 8081994 7721995 6581996 6181997 6161998 550
1992 441 4801993 410 4791994 408 5351995 399 4401996 387 5051997 364 4631998 292 517
1992 1,3811993 1,2861994 1,2031995 1,1341996 1,0641997 1,0221998 928
1992 724 4821993 642 4551994 610 4681995 571 5021996 542 5231997 481 5791998 528 548
NumberofGrain Cooperatives211 114233 131226 138223 174 z:229 176 43196 155 47216 150 48
1,2431,1931,1591,0901,0661,014964
NumberofBranches529688674756743717774
417 1,867488 2,065424 2,041577 2,172691 2,326706 2,250716 2,299
Numberol Fan Supply Cooperatives176 45 16183 14199 :211 1:: ::213 17232 109277 112
Number of Branchesz: 1,363
1,320344 1,335460 1,396526 1,438576 1,576570 1,672
1,6181,5471,4961,4581,4031,3861,347
2,7772,7142,7872,9293,0293,1833,318
23

Table I&- Memberships itI marketing, farm supply,and service cooperatives, 1989-98
Period 1 Marketing Farm supply Service Total
1,000
1989 1,856 2,035 243 4,134
1990 1,882 2,006 232 4,119
1991 1,842 2,025 191 4,059
1992 1,839 2,020 212 4,072
1993 1,830 1,977 216 4,023
1994 1,805 1,936 245 3,986
1995 1,712 1,846 210 3,767
1996 1,682 1,795 187 3,664
19972 1,498 1,743 183 3,424
1998 1,398 1,774 181 3,353
1 For years before 1989, see Cooperative Historical Statistics, CIR1, Section 26, USDA, Revised April 1998. Cotton ginningcooperatives, livestock shipping associations, and rice driers werereclassified from marketing to service in 1989, 1992, and 1993,respectively.
2 Number of memberships in farm supply cooperatives was revised.
Business VolumeNet cooperative business, unadjusted for price
change, increased from $72.1 billion in 1989 to $104.7billion in 1998 (table 16). When adjusted,4 net businesstotaled $102.1 billion in 1998 (figure 16). Consequently,the difference between actual and real net businessvolume in 1998 was $2.6 billion. The real net businessvolume was near the actual value in 1998 due mainlyto a decrease in prices received for farm products from1989-98. Prices received for all farm commoditiesdropped 2.9 percent, while prices paid for productionsupplies increased 21.1 percent.
Marketing sales of four major commoditygroups-dairy; grains and oilseeds, excluding cotton-seed; fruits and vegetables; and livestock-decreasedslightly from 83.5 percent in 1989 to 82.8 percent in1998. In 1989 and a decade later, net volume (amongcommodity groups) was highest in dairy ($18.3 bil-lion). In net volume terms, dairy was $25.3 billion and
4 Marketing sales was deflated by the index of producer pricesreceived for “all farm products” (1996 = 100). Supply sales andservice receipts and other income were deflated by the index ofprices paid by farmers for “production items,” excluding interest,taxes, and wages (1996 = 100).
Figure 14- Grain and Farm Supply Cooperatives and Branches, 1992-98
Number
6,000
Branches
3,000
Cooperatives
01 I I I I I I I
1992 93 94 95 96 97 98
24
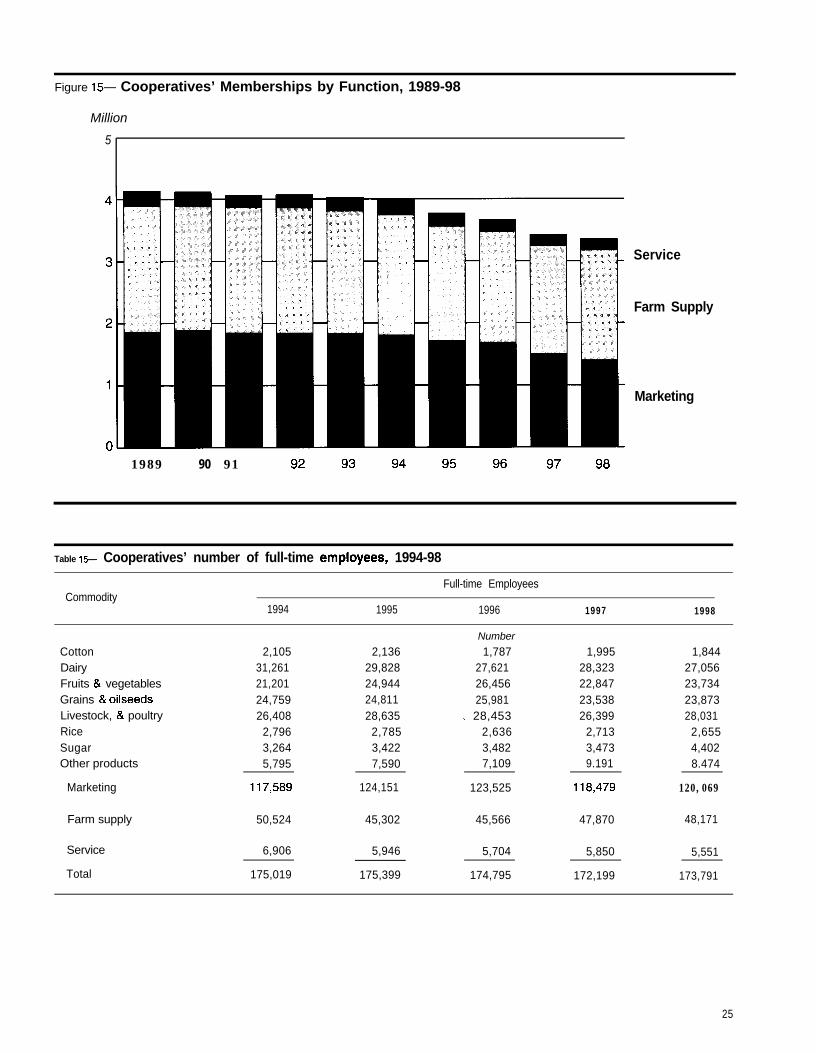
Figure 15- Cooperatives’ Memberships by Function, 1989-98
Million
5
1989 90 91 92 93 94 95 96 97 98
Service
Farm Supply
Marketing
Table IS--- Cooperatives’ number of full-time StIIplOyeeS, 1994-98
Commodity1994 1995
Full-time Employees
1996 1997 1998
Cotton 2,105 2,136Dairy 31,261 29,828Fruits & vegetables 21,201 24,944Grains & oilseeds 24,759 24,811Livestock, & poultry 26,408 28,635Rice 2,796 2,785Sugar 3,264 3,422Other products 5,795 7,590
Number
1,78727,62126,45625,981
. 28,4532,6363,4827,109
1,995 1,84428,323 27,05622,847 23,73423,538 23,87326,399 28,031
2,713 2,6553,473 4,4029.191 8.474
Marketing 117,589 124,151 123,525 118,479 120,069
Farm supply 50,524 45,302 45,566 47,870 48,171
Service 6,906 5,946 5,704 5,850 5,551
Total 175,019 175,399 174,795 172,199 173,791
25

grains and oilseeds $21.3 billion in 1998. In 1997, increased sales of crop protectants. In 1989, theygrains and oilseeds led commodity groups due to high accounted for 8.4 percent of farm supply sales versusgrain prices (figure 17). 12.9 percent in 1998.
Milk and milk product sales showed thestrongest growth in the 1989-98 decade. Prior to 1997,grain and oilseed sales showed a strong upward trend,but subsequently dropped.
In the farm supply group, petroleum, feed, andfertilizer were especially important. They accountedfor 72.9 percent of cooperatives’ total farm supplysales in 1989 and 70 percent in 1998. The drop reflected
The trend for cooperatives’ sales of petroleum,feed, fertilizer, and crop protectants, except for 1998,was upward, while seed sales remained fairly stable(figure 18). In 1998, however, feed, petroleum, and fer-tilizer sales dropped, due mainly to lower prices.
Net marketing of farm products totaled $53.2 bil-lion in 1989 and increased every year except in 1991and 1997-98. In 1998, net business volume of farmproducts marketed dropped to $76.6 billion from $77.8billion in 1997 (table 17). Aggregate farm supply salesincreased every year, from $16.9 billion in 1989 to $25.2billion in 1997, but then dropped in 1998 to $24.6 bil-lion. Service receipts increased from $2 billion in 1989to $3.5 billion in 1998, after reaching a high of $3.6 bil-lion in 1997. In 1990, service receipts were expanded toinclude other income and revenue.
Gross business volume was $88.1 billion in 1989,$121 billion in 1998, and a record high of $128.1 billionin 1996. The 1996 record increase in business volume($15.9 billion) was due mainly to higher prices forgrains and oilseeds.
Table 16-- Cooperatives’ net business volume,1989 and 19981
Function
Net Business Volume
1989 1998
Products marketed:Beans and peas (dry edible)CottonDairyFruits and vegetablesGrains and oilseeds 2/LivestockNutsPoultryRice
SugarTobaccoWool and mohairOther products
149.6 187.21,989.3 2,961 .l
18,339.O 25,329.47,888.0 9,391.2
14,189.2 21,290.g4,046.2 7,418.l
834.9 900.71,193.g 2,i 37.3
764.8 932.01776.8 2,444.7610.9 348.533.4 6.8
1,431.l 3 3,294.2
Total farm products 53,247.2 76,642.0
Supplies purchased:Crop protectantsFeedFertilizerPetroleumSeedOther supplies
Total farm supplies
1,428.1 3,165.74,224.l 5,405.33,337.2 5,170.34,768.7 6,616.3
573.0 731.82,576.0 3,462.0
16,907.2 24,551.4
Services provided:Trucking, cotton ginning,storage, grinding, lockerplants, mist 1,974.3 3.473.2
Total business 72,128.7 104,666.6
Million dollars
1
2
Excludes intercooperative business volume. Totals may not adddue to rounding.Excludes cottonseed. Cottonseed sales were included with cotton.Cottonseed meal and oil sales were included with feed and otherproducts, respectively.
3 Includes value of processed oilseeds.
26
Net IncomeStarting with $1.85 billion in 1989, total net
income fluctuated and finally set a record at $2.36 bil-lion in 1995. It dipped in 1996, climbed back in 1997,but then significantly dropped to $1.7 billion in 1998(table 18 and figure 19).
Net income from own operations and other coop-eratives varied, but reflected better economic times inagriculture in the late 1990s compared with conditionsin the late 1980s and early 1990s. In 1989, refunds fromother cooperatives totaled $344 million, or 16.6 percentof total net income. In 1998, refunds totaled $573 mil-lion, or 32.9 percent of total net income. However,beginning with 1998, refunds from CoBank and the St.Paul Bank for Cooperatives were also included.
Balance SheetCooperatives’ total assets grew by $16.9 billion
from $29.6 billion in 1989 to $46.6 billion in 1998 (table19 and figure 201, reflecting added investments in theirown operations and investment in other cooperatives.In 1989, nearly $3.3 billion (11 percent of total assets)was investments in other cooperatives, includingCoBank and Banks for Cooperatives. In 1998, theseinvestments were $4.7 billion, up $1.4 billion.
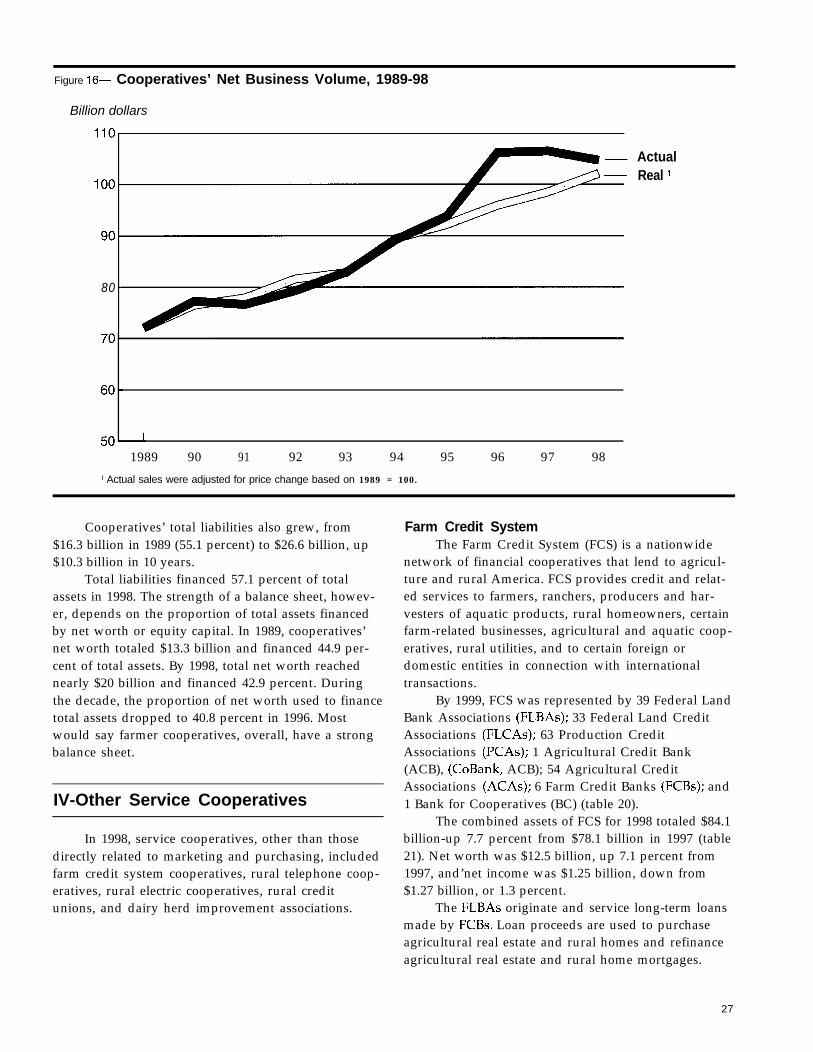
Figure 16- Cooperatives’ Net Business Volume, 1989-98
Billion dollars
80
1989 90 91 92 93 94 95 96 97 98
1 Actual sales were adjusted for price change based on 1989 = 100.
ActualReal l
Cooperatives’ total liabilities also grew, from$16.3 billion in 1989 (55.1 percent) to $26.6 billion, up$10.3 billion in 10 years.
Total liabilities financed 57.1 percent of totalassets in 1998. The strength of a balance sheet, howev-er, depends on the proportion of total assets financedby net worth or equity capital. In 1989, cooperatives’net worth totaled $13.3 billion and financed 44.9 per-cent of total assets. By 1998, total net worth reachednearly $20 billion and financed 42.9 percent. Duringthe decade, the proportion of net worth used to financetotal assets dropped to 40.8 percent in 1996. Mostwould say farmer cooperatives, overall, have a strongbalance sheet.
IV-Other Service Cooperatives
In 1998, service cooperatives, other than thosedirectly related to marketing and purchasing, includedfarm credit system cooperatives, rural telephone coop-eratives, rural electric cooperatives, rural creditunions, and dairy herd improvement associations.
Farm Credit SystemThe Farm Credit System (FCS) is a nationwide
network of financial cooperatives that lend to agricul-ture and rural America. FCS provides credit and relat-ed services to farmers, ranchers, producers and har-vesters of aquatic products, rural homeowners, certainfarm-related businesses, agricultural and aquatic coop-eratives, rural utilities, and to certain foreign ordomestic entities in connection with internationaltransactions.
By 1999, FCS was represented by 39 Federal LandBank Associations (FLBAs); 33 Federal Land CreditAssociations (FLCAs); 63 Production CreditAssociations (PCAs); 1 Agricultural Credit Bank(ACB), (CoBank, ACB); 54 Agricultural CreditAssociations (ACAs); 6 Farm Credit Banks (FCBs); and1 Bank for Cooperatives (BC) (table 20).
The combined assets of FCS for 1998 totaled $84.1billion-up 7.7 percent from $78.1 billion in 1997 (table21). Net worth was $12.5 billion, up 7.1 percent from1997, and’net income was $1.25 billion, down from$1.27 billion, or 1.3 percent.
The FLBAs originate and service long-term loansmade by FCBs. Loan proceeds are used to purchaseagricultural real estate and rural homes and refinanceagricultural real estate and rural home mortgages.
27

Figure I 7- Cooperatives’ Net Sales of Selected Commodities, 1989-98
Billion dollars
30
25 Milk & Milk Products
Grains & Oilseeds
Fruits & Vegetables
Livestock
01989 90 91 92 93 94 95 96 97 98
Figure 18- Cooperatives’ Net Sales of Selected Farm Supplies, 1989-98
Billion dollars
7-
i-
i_
Petroleum
Feed
Fertilizer
Crop Protectants
I I SeedI I I I I I I I I I
1989 90 91 92 93 94 95 96 97 98
28

Table 17-Cooperatives’ gross and net business volumes, 198948’
Gross volume Net volume
Farm Farm Farm FarmPeriod 2 products supplies Services 3 Total products supplies Services a Total
Billion dollars1989 60.3 25.8 2.0 88.1 53.2 16.9 2.0 72.11990 64.1 26.3 2.3 92.7 57.8 17.1 2.3 77.31991 61.4 26.8 2.5 90.8 56.2 17.9 2.5 76.61992 63.8 27.0 2.6 93.4 58.2 18.5 2.6 79.31993 66.8 28.2 2.7 97.7 60.9 19.2 2.7 82.91994 72.1 30.4 3.0 105.5 65.5 20.8 3.0 89.31995 77.9 31.0 3.3 112.2 69.3 21.2 3.3 93.81996 90.3 34.7 3.1 128.1 79.4 23.7 3.1 106.219974 85.9 37.1 3.6 126.7 77.8 25.2 3.6 106.71998 84.5 33.0 3.5 121.0 76.6 24.6 3.5 104.7
Percent1989 68.4 29.3 2.3 100 73.8 23.4 2.8 1001990 69.1 28.4 2.5 100 74.9 22.1 3.0 1001991 67.7 29.5 2.8 100 73.3 23.4 3.3 1001992 68.3 28.9 2.8 100 73.4 23.4 3.2 1001993 68.4 28.8 2.8 100 73.5 23.2 3.3 1001994 68.4 28.8 2.8 100 73.4 23.3 3.3 1001995 69.5 27.6 2.9 100 73.9 22.6 3.5 1001996 70.5 27.1 2.4 100 74.8 22.3 2.9 1001997 67.8 29.3 2.9 100 73.0 23.6 3.4 1001998 69.9 27.2 2.9 100 73.2 23.5 3.3 100
1 Gross includes and net excludes intercooperative business. Totals may not add due to rounding.* For years prior to 1989, see Cooperative Historical Statistics, CIR 1, Section 26, USDA, Revised April 1998. Data for prior years are not
entirely comparable due to revisions in statistical procedures.3 Services related to marketing or supply purchasing not included in the volumes reported for these activities. Beginning with 1990, other
income and revenue were included with service receipts.4 Revised.
Of the 33 FLCAs operating on Jan. 1,1999,18were in the AgriBank District and 11 in the WesternDistrict. FLCAs were authorized by the AgriculturalCredit Act of 1987. FLCAs are former FLBAs that weregiven direct-lending authority by FCBs.
PCAs provide farmers and ranchers short- andintermediate-term loans for various purposes, such asoperating expenses, farm equipment and livestockpurchases, and farm buildings and other capitalimprovements. Of the 63 PCAs, 18 were located in theAgriBank, FCB, District and 18 in the FCB of Wichitaterritory.
ACAs resulted from the merger of FLBAs orFLCAs with PCAs. ACAs offer both long- and short-term loans. Of the 54 ACAs operating on Jan. 1,1999,36 were in AgFirst, FCB, territory and 8 in theAgriBank, FCB, district.
The FCBs provide loans and support services toFLBAs, ACAs, FLCAs, and PCAs within their districts.Combined assets of the six FCBs, one ACB, and one BC
totaled $76.6 billion in 1998, up from $71.1 billion in1997 (table 22). Net worth in 1998 was $6.1 billion andnet loans totaled $62.6 billion. Net income dropped to$578 million in 1998 from $692 million in 1997.
The St. Paul Bank for Cooperatives5, the sole BC,is based in Minnesota. It offers a complete line of creditand related financial services to agricultural coopera-tives, rural utilities, and other eligible customersnationwide.
CoBank, ACB, provides short-, intermediate-, andlong-term credit to agricultural cooperatives, ruralutility systems, and other rural businesses nationwide.It also provides credit to the Farm Credit Associationsserving agricultural producers in the Northeast.CoBank, ACB, is owned by about 2,300 stockholders,consisting of U.S. farmer cooperatives, rural utilities,
5 Merged with CoBank on July 1,1999.
29

Table 18- Net income of farmer cooperatives,1989-98’
YearFrom ownoperations
From othercooperatives2
Million dollars
Total
1989 1,508 343 1,851
1990 1,062 378 1,440
1991 1,152 418 1,570
1992 1,034 406 1,440
1993 985 373 1,358
1994 1,571 392 1,963
1995 1,766 597 2,363
1996 1,475 773 2,248
1997 1,557 757 2,314
1998 1,169 573 1,742
1 Totals may not add due to rounding. Excludes income fromcooperative pooling operations.
* Dividends and patronage refunds received from other marketing,farm supply, and related-service cooperatives, CoBank, andBanks for Cooperatives.
ACAs, and other businesses serving rural America.CoBank also finances U.S. agricultural exports andprovides international banking services for farmercooperatives.
The combined assets of the St. Paul Bank andCoBank increased from $21.3 billion in 1997 to $22.2billion in 1998. Net worth totaled nearly $1.8 billion.As of Dec. 31,1998, the two banks had net loans of$17.5 billion and net income of $153 million, downfrom $176 million in 1997 (table 23).
Rural Telephone CooperativesAs of Dec. 31,1998, the 220 rural telephone coop-
eratives borrowing from the Rural ElectrificationAdministration (REA) had revenues of $1,271 millionand 1,419,OOO subscriber members. Iowa had the mostcooperatives, with 31 (14.1 percent of the total). NorthCarolina had the most subscriber-members (10.9 per-cent) of any State (table 24). Texas led all States in rev-enue, with $134 million (10.5 percent).
Rural Electric CooperativesRural electric cooperatives dropped in number to
662 from 744 in 1997, and they had 10.8 million con-sumer members and revenue of $14.2 billion (table 25).
Figure I 9- Cooperatives’ Net Income, 1989-98
Billion dollars
From OtherCooperatives1
From OwnOperations
1989 90 91 92 93 94 95 96 97 98
l Includes dividends and patronage refunds from other farmer cooperatives, CoBank, and the St. Paul Bank for
Cooperatives.
30

Table 1% Combined balance sheet data for farmer cooperatives, 1989-98
Year
Assets Investmentsfrom own in other
operations -psTotal Total Net
assets liabilities worth
1989 26,389 3r260 29 ,649 16,337 13,3131990 26,948 3 ,076 30,024 16,575 13,4491991 27 ,887 3,381 31 ,268 17,227 14,0401992 28 ,967 3 ,027 31 ,994 17,780 14,2131993 30,484 2 ,962 33 ,446 18,634 14,8121994 32,784 3 ,176 35 ,960 20 ,339 15,6211995 37,046 3 ,228 40 ,274 23 ,643 16,6311996 39,011 3,577 42 ,588 25 ,195 17,3921997 39,430 4 ,566 43 ,996 25 ,459 18,5371998 41 ,884 4 ,676 46 ,560 26 ,606 19,954
1989 89 .0 11.0 100 55.1 44.91990 89.8 10.2 100 55.2 44 .81991 89.2 10.8 100 55.1 44 .91992 90.5 9 .5 100 55 .6 44 .41993 91 .l 8 .9 100 55 .7 44 .31994 91 .2 8 .8 100 56.6 43 .41995 92 .0 8 .0 100 58.7 41 .31996 91 .6 8 .4 100 59.2 40 .81997 89 .6 10.4 100 57.9 42.11998 90 .0 10.0 100 57.1 42.9
Million dollars
Percent of total assets
1 Includes investments in other farmer cooperatives, CoE?ank, and Banks for Cooperatives.
Texas had the most associations, with 40 (6 percent ofthe total), while Georgia had the most consumer mem-bers, with 1,034 (9.6 percent), and the largest revenue,$1,393 million (9.8 percent).
Rural Credit UnionsThe 653 rural credit unions reported 4.4 million
members and savings of nearly $19.9 billion.Wisconsin led all States in number of associations,with 66, or 10.1 percent of the total. California had themost members and credit union savings, with morethan 1 million and $5.4 billion, respectively. California,Wisconsin, and Michigan accounted for more than 2million memberships (45.9 percent of the total) andnearly $9.1 billion in savings, or 45.7 percent of thetotal (table 26).
Dairy Herd Improvement AssociationsDairy Herd Improvement Associations (DHIA)
had 34,820 memberships in 1998 (table 27), down from38,920 in 1997. The DHIAs tested 4.2 million cows in
1998, down from 4.5 million in 1997. Wisconsin (9,014),Pennsylvania (4,748), Minnesota (3,986), and New York(3,014) combined accounted for 59.6 percent of totalmembers, down slightly from 60 percent in 1997.About 822,900 (19.7 percent) of the cows tested were inCalifornia, up from 19.4 percent.
31

Figure 20- Cooperatives’ Net Worth and Liabilities, 1989-98
Billion dollars
45
40
35
30
25
20
15
10
5
0
1989 90 91 92 93 94 95 96 97 98
Liabilities
- Net Worth
Table 20-- Farm Credit Association Structure, Jan. 1, 1999’
District or bank affiliation FLBA PCA ACA FLCA ACB FCB BC
CoBank, ACB*
AgFirst FCB
AgriBank, FCB
FCB of Wichita
FCB of Texas
Western FCB
AgAmerica, FCB
St. Paul BC
Total
1
18
19 18
20 15
10
1
- -
39 63
Number
4
36
8 18
3
5 11
1 1
- -
54 33
1
1
1
1
1
1
1
1- - -
1 6 1
- = No bank affiliation.1 FLBA = Federal Land Bank Association; PCA = Production Credit Association; ACA = Agricultural Credit Association; FLCA = Federal Land
Credit Association; ACB = Agricultural Credit Bank; FCB = Farm Credit Bank; and BC= Bank for Cooperatives.2 CoBank, ACB serves cooperatives nationwide and ACAs in the former Springfield District.Source: Farm Credit Administration, Report on the Financial Condition and Performance of the Farm Credit System, 7999 McLean, VA, p. 3.
32

Table 2% Farm Credit SyStSt?I’S combined SSSStS, net
worth, and net income, 1994-98’
Year Assets Net worth Net income
Million dollars
1994 66,377 8,981 1,0051995 71,439 9,864 1,1651996 74,917 10,729 1,2011997 78,144 11,694 1,2671998 84,139 12,522 1,251
1 Farm Credit System, Annual Information Statements, 1998Federal Farm Credit Banks, Funding Corporation, Jersey City,NJ., Feb. 24, 1999, p. F3.
Table 22- Farm Credit Banks’ combined assets, networth, net loans, and net income, 1994-98’
Year Assets Net worth Net loans Net income
Million dollars
1994 61,305 5,377 50,763 4681995 65,754 5,629 54,525 5551996 68,550 5,798 56,571 6221997 71,124 6,069 58,504 6921998 76,582 6,122 62,552 578
r As of December 31 of each year. Consolidated financial for sixFarm Credit Banks, one Agricultural Credit Bank, and one Bankfor Cooperatives.
Source: Farm Credit Administration, Report on the FinancialCondition and Performance of the Farm Credit System, 1998,McLean, VA, pp. 25-26.
Table 23- Combined assets, net worth, net loans, andnet income of the St. Paul Bank forCooperatives and CoBank, ACB, 199448’
Year Assets Net worth Net loans Net income
Million dollars1994 18,225 1,355 14,954 1421995 21,326 1,488 17,553 1751996 20,837 1,571 16,871 1561997 21,282 1,674 16,821 1761998 22,185 1,752 17,513 153
1 As of December 31 of each year. Source: CoBank, ACB, CoSank1998 Annual Report Financial Information: Rural America’sCooperative Bank, Englewood, CO, p. 10 and St. Paul Bank,7998 Annual Report, St. Paul, MN, p. 6.
33

Table24- Number, participation, and level of activity of rural telephonelco-ops by State, Dec. 31, 19982
State CooperativesMembers
(subscribers) Revenue StateMembers
Cooperatives (subscribers) Revenue
Number 1,000 Mil. dol.
3 2 7 207 66 741 4 72 9 9
Number 1,000 Mil. dol.
AlabamaAlaskaArizonaArkansasCalifornia
New HampshireNew JerseyNew MexicoNew YorkNorth Carolina
5
9
22
154
55
87
ColoradoDelawareFloridaGeorgiaIdaho
9 9
36 262 2
North DakotaOhioOklahomaOregonPennsylvania
10 60 605 5 41 10 165 17 16
Illinois 7 25 25Indiana 8 39 29Iowa 31 64 54Kansas 10 65 86Kentucky 8 104 73
LouisianaMaineMarylandMichiganMinnesota 18 83 62
South Carolina 5 105 74South Dakota 12 47 49Tennessee 7 141 94Texas 16 119 134Utah 2 18 18
VermontVirginiaWashingtonWest Virginia
5
2
20
4
14
4
MississippiMissouriMontanaNebraska
WisconsinWyoming
111
471
3537 48 48
7 59 755 10 9
Nevada United States 220 1,419 1,271
- = None reported in the State.1 Source: Rural Utilities Service, USDA.2 Totals may not add due to rounding.
34

Table 25- Number, participation, and level of activity of rural electriclcooperatives by State, Dec. 31, 1998*
State CooperativesMembers
(subscribers) Revenue StateMembers
Cooperatives (subscribers) Revenue
AlabamaAlaskaArizonaArkansasCalifornia
Colorado 19 319 438 North Carolina 22 679 864Delaware 1 56 62 North Dakota 19 116 200Florida 11 442 559 Ohio 22 290 341Georgia 36 1,034 1,393 Oklahoma 23 323 379Idaho 4 29 34 Oregon 8 52 74
Illinois 11 78 124 Pennsylvania 11 175 178Indiana 26 300 352 South Carolina 20 556 766Iowa 29 143 220 South Dakota 30 124 160Kansas 29 156 258 Tennessee 21 798 1,124Kentucky 25 648 932 Texas 40 615 754
Louisiana IO 286 406 Utah 1Maine 3 14 14 Vermont 1Maryland 1 115 203 Virginia 12Michigan 9 203 160 Washington 5Minnesota 36 385 413 West Virginia 1
Mississippi 14 394 547Missouri 37 518 573Montana 22 96 103Nebraska 2 9 18
Number
2195
153
1,000 Ml/. do/
444 590
78 175121 198332 456
20 20
NevadaNew HampshireNew JerseyNew MexicoNew York
WisconsinWyoming
United States
Number 1,000 Ml. dol.
1 5 26
1 11 1216 176 2564 16 13
79
35431
5
13057
10,751
88
51545
5
179-
662
124119
14,221
1 Source: Rural Utilities Service, USDA.2 Totals may not add due to rounding.
35

Table 21s Number, participation, and level of activity of rural credit unions’ by State, Dec. 31, 19982
State Cooperatives Members Savings State Cooperatives Members Savings
Alabama 10 24 85 Montana 11 54 202Alaska 1 22 97 Nebraska 17 21 95Arizona 4 16 50 Nevada 6 51 327Arkansas 3 7 27 New Hampshire 2 1 1California 57 1,034 5,398 New Jersey 6 12 20
Colorado 15 21 76 New Mexico 3 46 191Connecticut 1 1 1 New York 29 160 731Delaware 1 3 9 North Carolina 13 29 63Florida 14 102 402 North Dakota 30 100 576Georgia 11 34 91 Ohio 12 39 67
Hawaii 16 100 587 Oklahoma 4 7 30Idaho 9 16 47 Oregon 10 81 323Illinois 10 63 259 Pennsylvania 19 31 77Indiana 17 74 551 Rhode Island 3 57 556Iowa 7 7 19 South Carolina 3 9 53
Kansas 16 76 231 South Dakota 7 11 31Kentucky 7 31 81 Tennessee 8 14 37Louisiana 9 15 41 Texas 32 102 363Maine 10 25 97 Utah 9 16 46Maryland 5 56 264 Vermont 3 19 51
Massachusetts 4 16 61 Virginia 6 47 161Michigan 26 406 1,271 Washington 14 156 732Minnesota 35 206 936 West Virginia 3 4 10Mississippi 4 14 41 Wisconsin 66 599 2,415Missouri 6 19 59 Wyoming 2 3 5
Number 1,000 Mil. dol.
United States 3
1,000
653 4,439
Mil. dol.
19,870
* Source: Credit Union National Association, Inc. (Includes federally chartered and State-chartered credit unions.)2 Totals may not add due to rounding.3 Includes Puerto Rico with 37 cooperatives, 377,711 members, and $1.9 billion in savings.
36

Table iv- Number, participation, and hd of activity of dairy herd improvement aSSOCiatiOnS lby State, Dec. 31, 1998*
StateMembers
(herds)cowstested State
Members(herds)
cowstested
Number 1,000 Number 1.000
Alabama 72Alaska 1Arizona 61Arkansas 90California 1,135
ColoradoConnecticutDelawareFloridaGeorgia
88 37.5 New Mexico 27 36.9129 15.4 New York 3,014 327.734 4.4 North Carolina 255 41.1
113 59.1 North Dakota 95 9.3238 54.1 Ohio 1,252 104.4
HawaiiIdahoIllinoisIndianaIowa
5 2.5 Oklahoma 160 20.8240 73.6 Oregon 278 50.7744 57.7 Pennsylvania 4,748 321.3581 47.7 Rhode Island 8 .5
1,501 114.5 South Carolina 89 17.2
KansasKentuckyLouisianaMaineMaryland
369 34.9 South Dakota 327 29.7318 27.0 Tennessee 292 35.0156 21.5 Texas 340 130.1178 15.8 Utah 256 46.2460 40.1 Vermont 568 56.3
Massachusetts 137Michigan 1,121Minnesota 3,986Mississippi 89Missouri 570
11.9 Montana 60 7.2(3) Nebraska 267 33.7
75.0 Nevada 19 9.36.7 New Hampshire 118 10.8
622.9 New Jersey 92 8.1
11.9 Virginia 568 72.6143.5 Washington 288 73.9302.2 West Virginia 75 7.8
14.4 Wisconsin 9,014 642.150.8 Wyoming 4 .7
4,182.2United States4 34,820
1 Source: Agricultural Research Service, USDA. Totals may not add due to rounding.2 Totals may not add due to rounding.3 Fewer than 500.4 Includes Puerto Rico with 170 members and 41,840 cows tested:
37

Appendix Tables
38

L
Appendix Table I- Number of co-opsl and memberships * by major business activity and State,19973
State Hqts. in State Memberships State Hqts. in State Memberships
BEANS AND PEAS, DRY EDIBLECalifornia 3Other States 4-
United States 7
COTTON’California 3Mississippi 3Texas 4Other States 6Foreign6 -
United States 16 42,671
DAIRYCalifornia 10Illinois 4Iowa 6Massachusetts 3Michigan 3Minnesota 45Missouri 3New York 63North Dakota 5Ohio 7Oregon 3Pennsylvania 21Texas 5Virginia 4Wisconsin 31Other States 21
United States 236
1,7742,4065,015
2433,993
17,3483,8395,7631,1373,942
8036,4381,9081,142
29,37519.752
104,878
FRUITS AND VEGETABLESArizona 4Arkansas 5California 71Colorado 9Florida 27Georgia 4Hawaii 10Maine 5
699384
20,439455
2,022112430542
7622,097
2,859
2,1872,911
24,90812,538
127
FRUITS AND VEGETABLES5 (Continued)Massachusetts 4 487Michigan 16 3,457Minnesota 3 290Mississippi 4 257New Jersey 10 893New York 9 935North Carolina 4 115North Dakota 3 179Ohio 5 460Oregon 12 1,437Pennsylvania 6 585Texas 5 339Washington 21 5,026Other States 22 4,328Foreign6 104
United States 259 43,975
GRAINS AND OILSEEDS, EXCLUDING COTTONSEED ‘1ArkansasColoradoIdahoIllinoisIndianaIowaKansasMichiganMinnesotaMississippiMissouriMontanaNebraskaNorth DakotaOhioOklahomaOregon .South DakotaTexasWashingtonOther StatesForeign6
United States
3165
12322
133124
6107
6211373
1334241
370382510-
1,014
1,2598,8301,275
101,55531,63894,930
115,0052,801
69,5432,558
23,2559,411
69,59661,19731,42229,487
3,63051,32018,77310,1103,9033,511
745,009
Continued
39

Appendix Table I- Number of co-ops l and membership* by major business activity and State,19973 (continued)
State Hqts. in State Memberships State Hqts. in State Memberships
LIVESTOCK5AlabamaHawaiiIdahoIllinoisIndianaKentuckyMichiganMississippiMissouriNorth DakotaOhioVirginiaWest VirginiaWisconsinOther StatesForeign6
United States
NUTBCaliforniaOther States
United States
POULTRY9CaliforniaUtahOther StatesForeign6
United States
RICESCaliforniaLouisianaTexasOther StatesForeign6
United States
SUGAR0IdahoLouisianaMichiganMinnesotaMontanaWyomingOther StatesForeign6
United States
64333446784535
23
-
88
512-
17
33
14
-
20
-
18
798334
17--
51
5,24010,3414,832
40,9932,301
67134,969
5,1124,8059,548
14,4831,311
4853,782
96,905233
236,011
6,77134,884
41,655
83108
33,724378
34,293
1,978208
1,10010,682
1
13,969
2,306529
2,7972,225
540586
4,8402
13,825
TOBACCO 8KentuckyNorth CarolinaTennesseeVirginiaOther States
78,13524,90867,582
1,374948
United States
58733-
26 172,947
WOOL AND MOHAIRIdahoMontanaNorth DakotaOhioPennsylvaniaUtahVirginiaWyomingOther StatesForeign6
1,825872433
1,7221,616
420568185
9,00796
United States
520
53
16484
23--
88 16,744
MISCELLANEOUS”AlaskaCaliforniaFloridaGeorgiaHawaiiMaineMichiganMinnesotaMississippiNorth DakotaOregon
WashingtonOther States
9 7,46911 952
6 3153 2957 806
15 9183 1286 1,9323 1847 5,4403 3335 749
23 9,475
United States 101 28,996
TOTAL MARKETINGAlabamaAlaskaArizonaArkansasCaliforniaColoradoFloridaG e o r g i aHawaiiIdahoIllinoisIndiana
10 14,5179 7,6755 2,569
14 14,205117 37,85328 13,33138 6,07612 22,12825 11,87424 13,114
134 145,50926 37,048
Continued
40

Appendix Table I- Number of co-opsl and membership2 by major business activity and State,19973 (continued)
State Hqts. in State Memberships State Hqts. in State Memberships
TOTAL MARKETING (Continued)IowaKansasKentuckyLouisianaMaineMarylandMassachusettsMichiganMinnesotaMississippiMissouriMontanaNebraskaNew JerseyNew MexicoNew YorkNorth CarolinaNorth DakotaOhioOklahomaOregonPennsylvaniaSouth CarolinaSouth DakotaTennesseeTexasUtahVermontVirginiaWashingtonWest VirginiaWisconsinWyomingOther StatesForeign6
147124
131822
31041
16923314081154
7920
16665452546
472
869125
2356
642
87-
111,475118,59282,228
3,0701,8501,1021,069
50,042147,838
12,86732,93012,19775,151
2,8606,5499,283
26,86980,07753,71542,392
9,0648,7763,327
59,95168,95053,677
3,9341,641
27,45317,487
1,53335,617
1,2362,6794,452
United States 1,941 1,497,832
FARM SUPPLYAlabamaArkansasCaliforniaColoradoFloridaGeorgiaIdahoIllinoisIndianaIowaKansas
48 39,09740 47,99020 14,95822 20,317
6 8,9527 2,596
16 9,96565 87,64732 53,76673 74,655
> 21 16,310
FARM SUPPLY (Continued)KentuckyLouisianaMarylandMassachusettsMichiganMinnesotaMississippiMissouriMontanaNebraskaNew YorkNorth CarolinaNorth DakotaOhioOklahomaOregonPennsylvaniaSouth DakotaTennesseeTexasUtahVirginiaWashingtonWest VirginiaWisconsinWyomingOther StatesForeign6
28 121,87321 8,89913 52,414
4 3,58327 18,095
156 121,79537 89,72843 122,52239 16,79843 33,92411 33,4883 45,346
115 48,87223 14,24332 25,92113 12,675
7 31,45873 50,54470 70,56548 38,031
8 5,64238 118,43031 10,53414 59,636
120 115,6996 3,454
13 92,227- 582
United States 1,386 1,743,231
SERVICE’*AlabamaArizonaArkansasCaliforniaHawaii .IllinoisIowaKansasLouisianaMichiganMinnesotaMississippiNebraskaNew MexicoNew YorkNorth CarolinaNorth DakotaOhioOklahoma
5 1774 7886 1,047
48 3,9045 1164 733 1,7283 105
11 1,5875 5,643
43 26,42523 7,342
3 4724 1,3866 7,5986 120
16 4967 7,264
24 7,118
Continued
41

Appendix Table l- Number of co-opsl and memberships2 by major business activity and State,19973 (continued)
State Hqts. in State Memberships State Hqts. in State Memberships
SERVICEi (Continued)PennsylvaniaTexasWashingtonWisconsinOther States
7 13,144155 37,123
4 2,97050 26,24522 30,234
United States 464 183,105
TOTALAlabamaAlaskaArizonaArkansasCaliforniaColoradoConnecticutDelawareFloridaGeorgiaHawaiiIdahoIllinoisIndianaIowaKansasKentuckyLouisianaMaineMarylandMassachusettsMichiganMinnesotaMississippiMissouriMontanaNebraskaNew JerseyNew MexicoNew YorkNorth CarolinaNorth Dakota
63 53,7919 7,675
10 46,75760 63,242
185 56,71551 33,648
4 3,1743 29,685
46 27,i 2421 25,05932 13,39741 23,079
203 233,22960 go,91 5
223 187,858148 135,00742 208,60650 13,55624 9,21418 54,12214 5,05073 73,780
368 296,05883 109,93775 156,09379 28,995
127 109,54719 7,724
9 8,31196 50,36929 72,335
297 129,445
TOTAL (Continued)Ohio 95 75,222Oklahoma 101 75,431Oregon 40 21,747Pennsylvania 60 53,378South Carolina 6 3,745South Dakota 145 110,927Tennessee 79 141,185Texas 272 128,831Utah 21 11,550Vermont . 5 6,340Virginia 63 150,011Washington 91 30,991West Virginia 20 61,235Wisconsin 212 177,561Wyoming 14 4,690Other States 5 2,793Foreign6 - 5,034
United States 3,791 3,424,168
1 Includes centralized and federated cooperatives and those withmixed organizational structures.
* Revised. includes farmer-members (entitled to vote for directors),but not nonvoting patrons. (Duplication in these membershipfigures occurs because many farmers belong to more than onecooperative.) Totals may not add due to rounding.
3 Data covering operations of cooperatives for fiscal years thatended in 1997. States listed are those with more than twocooperatives or where disclosure is not a problem.
4 Cotton ginning cooperatives are included as servicecooperatives.
5 Cooperatives performing specific services related to a commodityin this group were included. Incorporated local associations of afederation that perform the actual marketing or processing werecounted.
B Includes memberships located in other countries.7 Excludes soybean meal and oil.B Membership fluctuates annually and is affected by the extent to
which producers participate in price stabilization programs.9 Includes eggs, turkeys, ratite, squab, and related products.lo Includes sugar, sugarcane, sugar beets, honey, maple syrup,
molasses, and sorghum.I1 Includes forest products, hay, hops, nursery stock, coffee, and
other farm products not separately classified.I2 Cooperatives providing services related to marketing or
purchasing activities. Major services provided are cotton ginning,trucking, storing, grinding, drying, and artificial insemination.
42

Appendix Table 2- COOperatiVeS’ business voiume 1 by commodity and State, 1997 2
State
Business volume
Gross NetState
Business volume
Gross Net
PRODUCTS MARKETED:
BEANS AND PEAS, DRY EDIBLECalifornia 89,081Other States 99,910
United States 188,991
COTTONCalifornia 662,564Mississippi 384,464Texas 940,528Other States 1,086,781
United States 3,074,337
DAIRYCalifornia 3,107,394Illinois 1(195,595Iowa 1,164,679Massachusetts 58,125Michigan 705,268Minnesota 2,700,430Missouri 1,136,673New York 1,648,294North Dakota 194,963Ohio 981,016Oregon 303,227Pennsylvania 1 ,170,426Texas 902,972Virginia 121,115Wisconsin 4,438,688Other States 6,449,093
United States 26,277,957
FRUITS AND VEGETABLESArizona 152,410Arkansas 1,337California 3,673,516Colorado 18,056Florida 1,228,521Georgia 16,701Hawaii 24,190Maine 25,400
1,000 dollars l,ooo dollars
89,08199,910
188,991
607,335371,889939,974
1,084,688
3,003,886
2,945,132975,839
1,026,05355,772
686,9992,281,830
967,6691 ,171,679
163,812930,480258,790976,137851,742112,589
3,982,8445,986,703
23,374,069
133,2251,337
3,367,46918,056
1 ,190,20712,34424,19025,400
FRUITS AND VEGETABLES (Continued)Massachusetts 530,847 530,847Michigan 594,750 483,638Minnesota 3,522 3,522Mississippi 11,926 11,478New Jersey 204,968 204,968New York 310,519 285,781North Carolina 29,270 27,751North Dakota 10,887 10,887Ohio 6,241 6,241Oregon 795,955 794,784Pennsylvania 334,682 324,706Texas 49,879 16,394Washington 867,920 862,568Other States 930,553 917,304Foreign3 15,091 15,091
United States 9837,141 9,268,189
GRAINS AND OILSEEDS, EXCLUDING COTTONSEEDArkansas 296,682 258,326Colorado 282,053 268,666Idaho 42,165 42,071Illinois 2,679,085 2,516,121Indiana 732,323 712,298Iowa 4,808,129 4647,143Kansas 2,055,805 1,857,357Michigan 136,923 130,162Minnesota 4,279,883 3,446,416Mississippi 152,100 150,267Missouri 978,608 811,773Montana 392,483 262,009Nebraska 2,369,748 2,156,557North Dakota 1,978,377 1,635,018Ohio - 867,857 842,806Oklahoma 314,118 289,403Oregon 557,137 395,410South Dakota 1,489,032 1,250,125Texas 1,224,510 697,949Washington 753,804 655,433Other States 1908,756 843,188Foreign3 1.383.168 770,665
United States 28,782,746 24,639,161
Continued
43

Appendix Table 2- COOperatiVeS’ business Volume’ by commodity and State, 1997* (continued)
State
Business volume
Gross NetState
Business volume
Gross Net
LIVESTOCKAlabamaHawaiiIdahoIllinoisIndianaKentuckyMichiganMississippiMissouriNorth DakotaOhioVirginiaWest VirginiaWisconsinOther StatesForeign3
United States
61,03923,17266,304
628,659277,997
77,629397,759
86,523551,673123,308314,034
27,9562,402
448,1974,305,890
90,995
7,483,538
NUTSCaliforniaOther States
United States
694,469 694,469185,807 185,807
880,276 880,276
POULTRY’CaliforniaUtahOther States
United States
36,334 36,334134,246 134,246
1,947,438 1,947,438
2,118,017 2,118,017
RICECaliforniaLouisianaTexasOther States
228,82218,11557,046
627,505
United States 931.487
1,000 dollars 1,000 dollars
61,03923,17266,304
627,249277,869
77,629397,759
86,523551,673120,214314,034
27,9562,402
444,9754,290,556
90,995
7,460,349
227,48818,11557,046
627,505
930,154
SUGARIdahoLouisianaMichiganMinnesotaMontanaWyomingOther StatesForeign3
455,573 335,616293,726 293,726120,495 120,495633,023 633,023
53,731 53,73152,673 52,673
813,603 789,0345,294 5,294
United States 2,428,119 2,283,591
TOBACCOKentuckyNorth CarolinaTennesseeVirginiaOther States
286,023 286,023231,176 231,176
68,695 68,6953,406 3,4063,575 3,575
United States 592,876 592,876
WOOL AND MOHAIRIdahoMontanaNorth DakotaOhioPennsylvaniaUtahVirginiaWyomingOther StatesForeign
50 50680 680
60 608,429 804
220 2201,776 1,776
85 85563 563
6,772 6,772297 297
United States 18,931 11,306
MISCELLANEOUS MARKETING5
Alaska 11,583California 46,862Florida 39,469Georgia 7,253Hawaii 30,430Maine 33,286Michigan 73,720Minnesota 767.117
11,58346,86239,469
7,25330,43033,28673,720
645,972
Continued

Appendix Table 2- COOperatiVeS’ business volume 1 by commodity and State, 199T2 (continued)
State
Business volume
Gross NetState
Business volume
Gross Net
1,000 dollars
MISCELLANEOUS MARKETINGS(Continued)Mississippi 144,061 143,437North Dakota 100,785 100,785Oregon 101,860 101,860Washington 149,787 149,787Other States 1,716,949 1,595,347Foreign 3 111,870 111,870
United States 3,335,031 3,091,660
TOTAL FARM PRODUCTS MARKETEDAlabama 820,882Alaska 11,583Arizona 705,295Arkansas 1,424,071California 8,709,783Colorado 576,596Florida 2,184,453Georgia 1,064,144Hawaii 100,080Idaho 1,129,126Illinois 4,558,569Indiana 1,534,292Iowa 8,296,195Kansas 2,987,577Kentucky 655,674Louisiana 701,620Maine 109,676Maryland 243,747Massachusetts 596,489Michigan 2,079,555Minnesota 8,732,932Mississippi 851,757Missouri 2,799,992Montana 520,027Nebraska 4,002,012New Jersey 256,916New Mexico 562,203New York 2,312,397North Carolina 615,232North Dakota 2,760,792Ohio 2,405,401Oklahoma 738,379Oregon 1,876,430Pennsylvania 1,605,305South Carolina 208,984South Dakota 2,008,297
817,31211,583
665,1861,376,4658,184,912
559,8162,138,1031,047,963
100,0801,004,1754,171,6891,450,5537,949,7802,748,145
644,40762 1,869108,270218,023594,136
1,943,4147,351,470
836,2782,463,685
389,5423,727,152
250,928550,215
1,811,043596,992
2,383,1882,292,388
702,3351,657,5321,401,041
208,4161,692,889
1,000 dollars
TOTAL FARM PRODUCTS MARKETED (Continued)Tennessee 180,388 177,321Texas 3,349,361 2,735,266Utah 466,043 454,676Vermont 356,839 324,532Virginia 223,407 207,334Washington 2,909,220 2,739,142West Virginia 80,015 75,315Wisconsin 5,583,838 5,085,983Wyoming 69,606 69,500Other States 377,552 308,267Foreign3 1,606,715 994,212
United States 85,949,447 77642,524
FARM SUPPLIES PROVIDED:
CROP PROTECTANTSAlabama 46,546 45,146Arkansas 185,726 93,832California 36,945 26,644Colorado 41,214 29,068Florida 17,743 15,138Georgia 147,832 144,807Idaho 36,551 17,468Illinois 563,760 308,900tndiana 264,648 175,371Iowa 589,118 442,091Kansas 128,587 105,675Kentucky 57,850 49,668Louisiana 61,324 28,434Maryland 18,847 16,785Massachusetts 2,448 2,448Michigan 38,006 26,905Minnesota 412,151 339,159Mississippi 39,065 38,505Missouri 119,168 89,936Montana 51,750 33,404Nebraska 230,430 179,219New York 38,958 36,076North Carolina 48,455 31,187North Dakota 178,660 140,063Ohio 101,787 89,950Oklahoma 28,768 17,808Oregon 49,122 35,178Pennsylvania 32,577 32,577South Dakota 183,596 145,805
Continued
45

Appendix Table 2- COOperatiVeS’ business VOhme’ by commodity and State, 1%V2 (continued)
State
Business volume
Gross NetState
Business volume
Gross Net
1,000 dollars 1.000 dollars
CROP PROTECTANTS (Continued)Tennessee 121,576 63,593Texas 72,520 61,396Utah 17,115 6,815Virginia 27,983 23,849Washington 57,496 39,351West Virginia 3,536 3,162Wisconsin 185,899 134,394Wyoming 12,998 2,943Other States 62,632 50,741Foreign3 37,433 1,989
United States
FEEDAlabamaArkansasCaliforniaColoradoFloridaGeorgiaIdahoIllinoisIndianaIowaKansasKentuckyLouisianaMarylandMassachusettsMichiganMinnesotaMississippiMissouriMontanaNebraskaNew YorkNorth CarolinaNorth DakotaOhioOklahomaOregonPennsylvaniaSouth DakotaTennesseeTexasUtah
4,350,820 3,125,481
338,793 315,798158,530 92,611187,196 126,48172,726 51,488
128,822 126,750458,719 456,231
41,137 15,256359,625 265,816370,372 165,264
1 ,154,985 796,087276,163 201,158
58,440 49,68159,495 36,19644,986 40,81520,830 20,83063,111 57,524
761,391 544,89555,658 44,760
299,859 205,00515,559 15,326
268,865 174,314141,070 133,055125,152 110,38169,785 56,579
144,594 144,217113,456 81,950118,597 26,758123,139 122,613256,153 208,874212,035 116,438230,737 177,780
95,528 93,694
FEED (Continued)VirginiaWashingtonWest VirginiaWisconsinWyomingOther StatesForeign3
United States
FERTILIZERAlabamaArkansasCaliforniaColoradoFloridaGeorgiaIdahoIllinoisIndianaIowaKansasKentuckyLouisianaMarylandMassachusettsMichiganMinnesotaMississippiMissouriMontanaNebraskaNew YorkNorth CarolinaNorth DakotaOhioOklahomaOregonPennsylvaniaSouth DakotaTennesseeTexasU t a hVirginiaWashingtonWest Virginia
126,285 112,767115,187 39,37823,354 20,292
503,268 325,1456,743 6,743
352,867 304,629193,883 104,385
8,147,076 5,987,963
140,551 97,491226,377 115,427137,921 116,222129,841 87,280121,903 40,698123,844 119,78863,479 30,265
923,191 465,614581,176 294,916965,166 630,753401,188 300,441115,867 101,82657,725 28,13030,097 26,865
3,906 3,90666,579 40,663
742,113 455,24260,176 58,824
359,335 258,577139,104 76,387493,719 337,351
55,256 55,25664,028 53,976
447,229 266,509193,072 130,025152,297 97,10982,853 55,59151,059 51,059
294,118 187,741243,24 1 111,736261,030 163,351
50,156 28,45775,620 68,44370,275 49,647
8,766 7,867
Continued
46

Appendix Table2- COOperatiVeS’ business VOiUme’ by commodity and State, 1997* (continued)
State
Business volume
Gross NetState
Business volume
Gross Net
FERTILIZER (continued)WisconsinWyomingOther StatesForeign3
345,208 204,306 Wisconsin 544,859 462,11727,012 5,313 Wyoming 115,456 70,425
115,513 90,104 Other States 142,604 141,695441,353 57,844 Foreign3 159,628 60,098
United States 8,881,348
PETROLEUMAlabamaArkansasCaliforniaColoradoFloridaGeorgiaIdahoIllinoisIndianaIowaKansasKentuckyLouisianaMarylandMassachusettsMichiganMinnesotaMississippiMissouriMontanaNebraskaNew YorkNorth CarolinaNorth DakotaOhioOklahomaOregonPennsylvaniaSouth DakotaTennesseeTexasUtahVirginiaWashingtonWest Virginia
40,951 4,865203,445 96,019
6,525 6,525359,301 195,946
11,778 9,73481,302 15,802
147,369 85,963677,455 478,585517,681 298,128
1 ,018,391 644,8731,246,265 393,733
1 go,51 4 115,74723,793 12,72973,838 66,80815,964 15,964
149,385 72,226649,378 553,430
20,348 19,171598,669 456,450195,483 146,099652,116 413,551245,760 244,944
20,714 17,753357,469 275,332143,449 119,272306,110 131,932170,484 121,359225,325 224,828358,376 254,895171,580 73,270233,786 134,318
83,524 19,389229,668 144,610180,282 136,61622,966 20,885
1,000 dollars 1,000 dollars
5,371,OOl
PETROLEUM (continued)
United States
SEEDAlabamaArkansasCaliforniaColoradoFloridaGeorgiaIdahoIllinoisIndianaIowaKansasKentuckyLouisianaMarylandMassachusettsMichiganMinnesotaMississippiMissouriMontanaNebraskaNew YorkNorth CarolinaNorth DakotaOhioOklahoma-OregonPennsylvaniaSouth DakotaTennesseeTexasUtahVirginiaWashingtonWest Virginia
10,591,991 6,756,086
32,394 20,87843,703 26,83922,195 22,195
2,540 2,5406,302 5,650
15,592 15,43316,787 9,49780,013 49,31948,825 24,13067,446 45,69511,371 11,37128,322 25,36321,296 10,17210,584 9,431
1,339 1,33910,165 9,95153,603 45,51018,708 18,65557,319 27,945
7,189 5,62112,807 10,25123,328 23,32814,668 12,36335,156 32,75526,245 26,245
4,200 4,20011,508 11,47017,520 17,52017,815 14,93266,640 39,97119,079 19,0263,072 3,072
25,757 23,26024,248 23,252
4,032 3,648
Continued
47

Appendix Table 2- Cooperatives’ business VOlUme’ by commodity and State, 1997* (continued)
State
Business volume
Gross NetState
Business volume
Gross Net
7,000 dollars
SEED (Continued)Wisconsin 38,583Wyoming 752Other States 20,425Foreign3 3,835
United States 925,364
MISCELLANEOUS SUPPLIES6Alabama 177,796 78,006Arkansas 133,948 92,393California 125,649 96,002Colorado 59,185 45,900Florida 102,041 59,157Georgia 90,330 69,199Idaho 47,014 39,178Illinois 144,296 86,622Indiana 69,488 53,202Iowa 228,635 165,002Kansas 127,735 93,563Kentucky 73,472 61,590Louisiana 47,297 33,846Maryland 37,771 33,930Massachusetts 9,877 9,877Michigan 107,729 93,698Minnesota 269,417 220,755Mississippi 60,783 60,783Missouri 99,029 59,329Montana 64,558 59,404Nebraska 115,054 95,068New York 161,401 139,200North Carolina 48,801 36,697North Dakota 107,468 98,070Ohio 105,967 87,222Oklahoma 45,369 32,198Oregon 141,584 136,818Pennsylvania 107,723 107,558South Dakota 90,354 77,517Tennessee 206,677 111,438Texas 102,734 82,174Utah 48,096 41,981Virginia 172,187 136,895Washington 127,128 95,932West Virginia 32,559 29,509
28,478733
19,962349
702,351
1,000 dollars
MISCELLANEOUS SUPPLIES” (Continued)Wisconsin 244,176Wyoming 39,896Other States 168,112Foreign3 57,806
United States 4,199,141
TOTAL FARM SUPPLIES
228,30637,643
139,31912,766
3,237,745
Alabama 777,030 562,184Arkansas 951,729 517,121California 516,431 394,068Colorado 664,808 412,221Florida 388,589 257,128Georgia 917,619 821,261Idaho 352,337 197,628Illinois 2,748,339 1,654,856Indiana 1,852,190 1,011,011Iowa 4,023,742 2,724,501Kansas 2,191,310 1 ,105,942Kentucky 524,467 403,875Louisiana 270,930 149,507Maryland 216,103 194,635Massachusetts 54,364 54,364Michigan 434,975 300,967Minnesota 2,888,053 2,158,991Mississippi 254,737 240,698Missouri 1,533,379 1,097,241Montana 473,643 336,242Nebraska 1,772,992 1,209,755New York 665,772 631,857North Carolina 321,818 262,356North Dakota 1 ,195,766 869,309Ohio 715,115 596,930Oklahoma- 650,201 365,199Oregon 574,149 387,174Pennsylvania 557,344 556,156South Dakota 1,200,412 889,764Tennessee 1,021,748 516,447Texas 919,886 638,045Utah 297,492 193,408Virginia 657,499 509,823Washington 574,617 384,177
Continued
48

Appendix Table 2- Cooperatives’ business VOIUIW by commodity and State, 1997* (continued)
State
Business volume
Gross NetState
Business volume
Gross Net
1,000 dollars 1,000 dol lars
TOTAL FARM SUPPLIES (Continued)West Virginia 95,213Wisconsin 1,861,993Wyoming 202,858Other States 862,152Foreign3 893,937
United States 37,075,740
SERVICES PROVIDED:’Alabama 23,784 23,784Arizona 26,320 26,320Arkansas 89,100 89,100California 529,691 529,691Hawaii 8,354 8,354Illinois 207,262 207,262Iowa 266,655 266,655Kansas 115,498 115,498Louisiana 20,141 20,141Michigan 73,527 73,527Minnesota 260,313 260,313Mississippi 97,423 97,423Nebraska 136,561 136,561New Mexico 6,015 6,015New York 152,576 152,576North Carolina 25,966 25,966North Dakota 48,603 48,603Ohio 108,826 108,826Oklahoma 35,753 35,753Pennsylvania 26,177 26,177Texas 295,661 295,661Washington 162,380 162,380Wisconsin 80,522 80,522Other States 850,227 850,227
United States 3,647,334 3,647,334
TOTAL:AlabamaAlaskaArizonaArkansasCaliforniaColoradoConnecticutDelawareFloridaGeorgia
1,621,696 1,403,279124,698 64,651786,643 737,821
2,464,900 1,982,6869,755,905 9,108,6711,273,093 1,003,727
266,727 205,367108,920 98,417
2,663,194 2,485,3822,012$45 1,899,906
85,3641,382,745
123,799746,450237,431
25,180,628
Foreign3
TOTAL: (Continued)Hawaii
U.S.
IdahoIllinoisIndianaIowaKansasKentuckyLouisianaMaineMarylandMassachusettsMichiganMinnesotaMississippiMissouriMontanaNebraskaNew JerseyNew MexicoNew YorkNorth CarolinaNorth DakotaOhioOklahomaOregonPennsylvaniaSouth CarolinaSouth DakotaTennesseeTexasUtahVermontVirginia _WashingtonWest VirginiaWisconsinWyomingOther States
130,603
2,500,652
1,492,1507,514,170
126,672,521
3,464,78512,586,5925,294,3851,210,076
992,690218,117463,990657,492
2,588,05711,881,299
1,203,9174,490,8791,002,6765,911,565
356,51262 1,939
3,130,745963,015
4,005,1613,229,3421,424,3332,496,6152,188,827
387,9623,451,8891,230,0594,564,908
806,244429,234905,881
3,646,217176,530
7,526,352274,702173,738
114,5721,212,4906,033,8072,539,867
10,940,9363,969,5841,078,217
791,516216,711416,798655,138
2,317,9079,770,7741 ,174,3993,718,435
734,7905,073,468
345,035608,117
2,595,476885,314
3,301 ,1002,998,1441 ,103,2862,090,7421,983,374
377,5632,825,833
721,6913,668,972
690,794396,927742,131
3,285,700161,980
6,549,250195,538162,559
1,231,643
106,670,486
See footnotes next page
49

Footnotes to Appendix Table 2.
1 Data covering operations of cooperatives whose business years ended during calendar 1997. Includes independent local cooperatives,federations, centralized regional cooperatives, and cooperatives with mixed organizational structures. The volume of products marketed wasallocated to the State in which they were originated and the volume of farm supplies was allocated to the State in which they were sold;service volume and other income was allocated to the State of origin when services related to farm products marketed or to the State ofdestination when related to farm supplies soM.
2 Gross business volume includes safes between cooperatives, while net business volume excludes sales. States listed had more than twocooperatives handtiig the commodity or farm supply or where disclosure was not a problem. Totals may not add due to rounding.
3 Includes value of farm products imported, farm supplies exported, services related to imported farm products or exported farm supplies,sales to domestic military installations, or sales of farm products not received directly from member-patrons.
4 Includes eggs, turkeys, ratite, squab, and related products.5 Includes forest products, hay, hops, nursery stock, fish, coffee, seed marketed for growers, and other farm products not separately classified.
Also includes manufactured food products and resale items marketed by cooperatives.6 Includes building supplies, containers and packaging supplies, farm machinery and equipment, animal health products, automotive supplies,
food, hardware, chicks, and other supplies not separately classified.7 Income from services related to marketing and purchasing activities, but not included in the volumes reported for these activities.
50

Appendix Figures
51

Appendix Figure I- Cooperatives’ Net Business Volume, 1974-98
Billion dollars
120
Total l
80Marketing
60
Farm Supply
o-““““““““““““’1974 76 78 80 82 84 86 88 90 92 94 96 98
1 Total includes value of related services and other income.
Appendix Figure 2- Cooperatives’ Gross and Net Business Volumes, 1974-98
Billion dollars
140
120Gross l
Net*
011 ” ” ” ” ” ” ” ” ” ” ” ”1974 76 78 ‘80 82 84 86 88 90 92 94 96 98
1 Includes intercooperative business. 2 Excludes intercooperative business.
52

Appendix Figure 3- U.S. Farms and Farmer Cooperative Memberships, 1974-98
Million
7
3
2
1
011 “““““““““““”1974 76 78 80 82 84 86 88 90 92 94 96 98
1 Memberships were higher than farm numbers because many farmers belonged to more than one cooperative.
Memberships’
Farms
Appendix Figure 4- Distribution of Farmer Cooperatives by Type, 1998
Cotton 0.4% -
Service 12.1%.
Farm Supply 36.9%
Grain & Oilseed 26.4%
Dairy 6.2%
Livestock & Poultry 2.7%
Fruit & Vegetable 6.6%
Other Marketing l 6.5%
Percent based on 3,651 cooperatives.1 Includes dry bean and pea, wool and mohair, nuts, rice, sugar, fishery, and other miscellaneous marketing cooperatives.
53

Appendix Figure 5- Distribution of Total Net Income by Type of Cooperative, 1998
Other Marketing I 3.0%
Grain & Oilseed 25.3%
Service 8.4%
Dairy 25.7%
Fruit & Vegetable 4.4%
Farm Supply 33.2%
Percent based on net income of $1.74 billion.1 Includes dry bean and pea, nut, wool and mohair, tobacco, rice, sugar, fishery, and other miscellaneous marketing cooperatives.
Appendix Figure 6- Distribution of Total Losses by Type of Cooperative, 1998
Livestoc:k& I‘oultry 39.0% -
Dairy 1 .O% -
-
Other Marketing I 16.7%
Farm Supply 5.69 6
Service 5.4%
Sugar 4.4%
Grain & Oilseed 3
Fruit & Vegetable
Cotton 1.9% -
Percent based on losses of $379.9 million.1 Includes dry bean and pea, nut, wool and mohair, tobacco, rice, fishery, and other miscellaneous marketing cooperatives
‘4%
22.2%
54

Appendix Figure 7- Distribution of Total Net Worth by Type of Cooperative, 1998
Grain & Oilseed 19.6%
Service 2.7%
Farm Supply 33.9%
Rice 1.2%
Dairy 14.7%
-Sugar 3.1%
-Fruit & Vegetable 62%
-Livestock & Poultry 7.1%
Other Marketing 7.7%
Cotton 1.8%Percent based on net worth of $20 billion.1 Includes dry bean and pea, nut, wool and mohair, tobacco, fishery, and other miscellaneous marketing cooperatives.
Appendix Figure 8- Distribution of Total Full-Time Employees by Type of Cooperative, 1998
Sugar 2.5%
Grain & Oilseed 13.7%
Dairy 15.6%
Rice 1.5%
Cotton 1 .l%
Service 3.2%
Fruit & Vegetable 13.7%
Livestock & Poultry 16.1%
Other Marketing ‘4.9%
Farm Supply 27.7%
Percent based on 173,791 full-time employees.1 Includes dry bean and pea, nut, wool and mohair, tobacco, fishery, and other miscellaneous marketing cooperatives.
55

Appendix Figure 9- Assets Per Full-Time Employee by Type of Cooperative, 1998
Service
Livestock & Poultry
Rice
Fruit & Vegetable
Dairy
Farm Supply
Grain & Oilseed
Other Marketing l
Cotton
SugarI I I I
0 100 200 300
Total assets (thousand dollars)
400 500
l Includes dry bean and pea, nut, tobacco, wool and mohair, fishery,and other miscellaneous marketing cooperatives.
Appendix Figure lo- Cooperatives’ Investments in and Patronage Refunds Received From OtherCooperatives,’ 1989-98
Million dollars
investments
I I I I I I I I I I I
1989 90 91 92 93 94 95 96 97 98
1 Includes other farmer cooperatives, CoBank, and Banks for Cooperatives.
56

U.S. Department of AgricultureRural Business-cooperative ServiceStop 3250Washington, D.C. 20260-3250
Rural Businestiooperative Service (RBS) provides research,management, and educational assistance to cooperatives tostrengthen the economic position of farmers and other ruralresidents. It works directly with cooperative leaders andFederal and State agencies to improve organization,leadership, and operation of cooperatives and to give guidanceto further development.
The cooperative segment of RBS ( 11 helps farmers and otherrural residents develop cooperatives to obtain supplies and
services at lower cost and to get better prices for products theysell; (21 advises rural residents on developing existingresources through cooperative action to enhance rural living;(31 helps cooperatives improve services and operatingefficiency; (4) informs members, directors, employees, and thepublic on how cooperatives work and benefit their membersand their communities; and (51 encourages internationalcooperative programs. RBS also publishes research andeducational materials and issues Rum1 Cooperatives magazine.
The U.S. Department of Agriculture (USDA) prohibitsdiscrimination in all its programs and activities on the basis ofrace, color, national origin, gender, religion, age, disability,political beliefs, sexual orientation, and marital or familystatus. (Not all prohibited bases apply to all programs.)Persons with disabilities who require alternative means forcommunication of program information (braille, large print,audiotape, etc.) should contact USDA’s TARGET Center at(202) 720-2600 (voice and TDD).
To file a complaint of discrimination, write USDA, Director,G&e of Civil Rights, Room 326-W, Whitten Building, 14th andIndependence Avenue, SW, Washington, D.C. 20250-9410 orcall (2021720-6964 (voice or TDD). USDA is an equalopportunity provider and employer.


